1
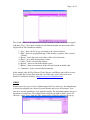
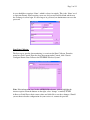
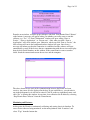
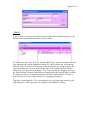
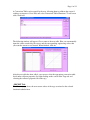
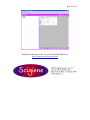
Page 1 of 12
Promis Quick Guide
Promis is an application to organize, view and visualize measurement data. For
monitoring purposes, for each device, automatically or manually, a tag can be defined.
Measurements will be registered to the tags for each device based on this. Data can be
printed, saved and emailed in graphical (*.jpg), tabular (*.xls), and report (*.html) form.
Operating Promis:
Once your Wireless Receiving system has been configured and set up to your computer,
Promis can be installed to collect, store, and retrieve data to use. Install the software from
the CD that has been provided to you. In the auto-run, select start installation, and follow
the instructions. When Promis has finished installation, open the software by clicking on
the Promis icon. When you open Promis, you are asked to login for the first time with an
empty database. You should login with the user name “Administrator” and leave the
password field blank.
The next window that opens up is the main platform of the software. The vertical righthand side of this main window displays a list of the different locations that data
acquisition is occurring.
Page 2 of 12
The second window to the right of the Locations window is where all the devices appear
with their “Tags”. Also, upon selecting any tab from the bottom bar, that action will be
displayed here. The bottom bar includes:
1. ‘Tags’, shows the list of tags associated to the selected location
2. ‘Map’, shows the geographical map, CAD drawing, or picture of the selected
location
3. ‘Recent’, shows the most recent values of the selected location
4. ‘Player’, plays back measurements in time
5. ‘Charts’, shows custom defined charts
6. ‘Reports’, shows custom defined html reports
7. ‘History’, shows measurements of the selected location in tabular form
8. ‘Comments’, shows custom defined comments
In this manual, only the Tags, Recent, Charts, Reports, and History tabs will be covered.
If you would like to learn more about these and other tags, please refer to the main
Promis User Manual, available at http://www.projex.nl/eng/index.htm.
USERS
Promis knows two types of users; Administrators and View-only users. An Administrator
is allowed to configure (on a licensed system) Promis and to view all locations. Viewonly users are only permitted to view granted locations. The maximum number of users is
dependent of your license. The standard license includes the right to define 4 users. To
edit users, select ‘Users’ from the ‘Edit’-menu and the following window will pop-up:
Page 3 of 12
A user should have a unique ‘Name’, which is always in capitals. This is the ‘Name’ used
to login into Promis. When creating a new user, the password will be blank and the user
has to change it at first login. If a user forgets its password, an administrator can reset the
password.
Start Data Collector:
The first step to start the data monitoring, is to activate the Data Collector. From the
menu bar, click Control. From the drop-down menu under Control, click “Start &
Configure Promis Data Collector for SCIGIENE Wireless System”.
Note: If the information listed in this window is not accurate, click to highlight the
incorrect option. From the buttons on the right, select “change” to modify TCP/IP
Address or Serial Port to their correct values and click Ok to save these changes. Should
you not know what the configuration for your receiver is, contact the provider.
Page 4 of 12
From the new window, select the proper Adapter, and click “Start Promis Data Collector”
at the bottom. A message will appear asking you whether you really want to start this
collector, say “Yes”. A “Start Confirmation” window will open, asking “Start as
Service”, “Start as Application”, or “Do not start”. Only when you click “Start as
Application” will a new window open. Otherwise, when you click “Start as Service”, the
data collector will run in the background and no window will open. Once done, a
message will inform you that the connection is established and the software will start
automatically to read all the devices that are communicating with the receiver and display
them by their Serial Numbers on this window. If the connection for some reason has
failed, check the connection between the receiver and the computer.
The above feature keeps track of the communication between the Promis and your
receiver. Any errors are also displayed in the box. If you would like to, you can make it
run in the background so it will not be noticed. Click X on the top right-hand corner, and
click “No” to iconize this window. At any time, data collection can be halted by selecting
“Stop Promis Data Collector” from the Control menu.
Monitoring and Features:
At this point, the Promis is continuously collecting and storing data in its database. To
access devices that are being monitored, on the main platform, click “Locations” and
select “Tags” from the bottom bar.
Page 5 of 12
Now in the main window, you can see those devices; in the example above, a Relative
Humidity Sensor, and a Temperature Sensor are displayed. Below, different features of
the software are introduced. Additional instructions for defining locations and others can
be accessed from the Main Manual at http://www.projex.nl/eng/index.htm.
- PARAMETERS/UNITS:
Parameters can be used to line-up similar tags with a common name and a common unit.
Assume you have to measure a flow at several locations. In this case you could define a
parameter named ‘flow’ with unit ‘m3/h’. For each location you define a measurement
tag for flow registration and you associated all these tags to the same parameter. To edit
parameters, select ‘Parameters/Units’ from the ‘Edit’ menu, and the following window
will pop-up:
A parameter should have a unique ‘code’, ‘name’ and a ‘unit’.
Page 6 of 12
- TAGS:
You can define several tags per location. If you require more information please see the
Promis main manual mentioned in the previous section.
To define a new tag, select ‘New tag’ from the ‘Edit->Tags’ menu or from the menu that
pops-up when you click the right mouse button. To edit an existing tag, select the tag
from the ‘Tags’-list and select ‘Properties’ from the ‘Edit->Tags’ or pop-up menu. To
delete an existing tag, select the tag from the ‘Tags’-list and select ‘Delete’ from the
‘Edit->Tags’ or pop-up menu. Deleting a ‘Tag’ is also possible by ‘dragging’ the tag to
the ‘Deleted Items’-location. Deleted tags are transferred to the ‘Deleted Items’-location.
To delete tags forever, the tags must be deleted from the ‘Deleted Items’- location as
well. You can move tags to other locations by ‘dragging & dropping’.
Tags have certain properties. To see the properties for a tag, right click on the tag, and
click “Properties”. Basic properties are displayed and explained as follows.
Page 7 of 12
Base Properties
Tag code: Usually the serial number by default.
Tag name: Each tag has a name. If multiple sensors are being used at the same time,
users can input a tag name to allow easy identification of the location of the sensor.
Tag ID: The tag ID is automatically generated by Promis.
Parameter: A tag must be associated to one of the defined parameters.
Type: The type of tag can be one of the following:
Type
Sample
Counter
Pulse
State/Step
Description
A measurement sample of a continues signal
A registration of a continuous increasing counter value. E.g. a kWh
counter.
A registration of a non-continuous signal. E.g. an impact.
A measurement sample of a discrete signal.
Number of Decimals: Specify the number of relevant decimals to be displayed.
Target: The target value (set point) for this tag.
Range: Specify the Min. and Max. range for the tag. Measurements outside this range
will not be displayed. The Y-axis of the ‘Player’ will be scaled to the specified range.
Limits: If a measurement is outside its limits it will be displayed in red, and if required,
an alarm can be passed to the Messenger for further dispatching.
On the top of this window, there is another tab for Additional Properties. There you can
specify which options you would or would not like Promis to display. Also, there is a
section for setting an alarm system for a tag. For more information on alarming, please
refer to Scigiene’s user manual for the Messenger Software.
Additional Properties
Page 8 of 12
Under the Additional Properties tab, users can configure where and for whom they want
the information displayed (either the map page, recent page, or the history page). Users
can also choose to have an alarm go off if values are beyond a certain range, or when
values are not recorded within a particular period of time.
Collector Properties
To adjust the offset of the sensor if suggest on the Scigiene Certificate of Traceability and
Calibration, enter the value into the offset box. The offset is an adjustment that can be
made to your sensor if the readings during the certification process were off by a certain
value. By entering an offset value, your sensor will now give a more accurate reading.
This can also be done by creating a conversion table as listed below.
Conversion Table
Page 9 of 12
A Conversion Table can be created by the user, allowing them to calibrate the sensor if
readings are incorrect. Go to Edit, and select Conversion Tables/Functions. To add a new
table, click Add.
The following window will appear. Give a name to the new table. Here you can manually
input the values recorded by the sensor, and the corresponding engineering values that
you want the sensor to read instead. When finished, click ok.
After the new table has been added, you can now select the appropriate conversion table
listed under collector properties (by right clicking on the sensor in the Tags tab, and
selecting the collector properties tab at the top).
- RECENT Tab:
The ‘Recent’ page shows the most recent values of the tags associated to the selected
location in tabular form.
Page 10 of 12
This sheet can be printed or saved or e-mailed as an Excel compatible sheet.
- CHARTS:
The ‘Chart’-page is used to show defined charts.
To define a new chart, select ‘New chart’ from the ‘Edit>Charts’ menu or from the menu
that pops-up when you right click the mouse button. From the window that opens up with
a list of tags, select the ones that you would like to graph, click “Close”. In the new
window, name your chart, edit it and click “OK”. Now you can view the defined chart.
To edit an existing chart, select the chart from the ‘Charts’ list and select ‘Properties’
from the ‘Edit>Charts’ or pop-up menu. To delete an existing chart, select the chart from
the ‘Charts’ list and select ‘Delete’ from the ‘Edit>Charts’ or pop-up menu. Chart can
also be customized and modified from chart Properties (see the Main Manual).
- REPORTS:
The ‘Report’-page is used to show defined reports.
Page 11 of 12
You can define several reports. When creating a new report, Promis generates a default
report based on the tags that you select. The default report displays a summary (Count,
Min, Max, and Average) over the selected period. Reports can be printed or saved or emailed as Html compatible documents. For information on how these can be done, please
refer to the main User Manual for Promis mentioned in previous sections.
To define a new report, select ‘New report’ from the ‘Edit>Reports’ menu or from the
menu that pops up when you right click the mouse button. Select tags that you would like
to be reported on the new window and click “Close”. A sample of the report style will be
viewed. You may name the report or edit the format. Once done, click “OK”.
To edit an existing report, select the report from the ‘Reports’ list and select ‘Properties’
from the ‘Edit>Reports’ or pop-up menu. To delete an existing report, select the report
from the ‘Reports’ list and select ‘Delete’ from the ‘Edit>Reports’ or pop-up menu.
- HISTORY:
The history tab allows users to view the data collected by all sensors from a specific
location. It displays the time interval each reading was collected, the number of readings
collected, the maximum and minimum readings and the average value of the readings. If
multiple sensors are being used at the same time, the appropriate tag names to each
sensor will allow for easy identification.
Page 12 of 12
Additional instructions can be accessed from the Main Manual at
http://www.projex.nl/eng/index.htm