1
User’s Manual/Installation Manual
PC Software Setup:
This program must be run on Linux. (A terminal emulator may work as well, but
performance is not guaranteed.) Put the software in a working directory (call it
Work/). In Work/, enter the command “make”. Then, enter the command
“sudo ./readSerialPort”.
Troubleshooting:
Alternatively, if you do not want to worry about which directory you are in, simply enter
the command “sudo cat <serial device> >> <output file name>”. <serial device> is how
the computer recognizes the USB device plugged in.
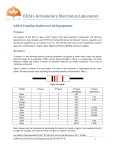
Hardware setup:
1. Plug in both USB connectors to computer with Linux operating system
a. Both board power LEDs should light up if on
2. Verify that the +5V, -5V, and GND pins are properly connected to their
corresponding labeled pins on the breadboard
.
Use DMM to test if necessary
How to test if system is working:
1. Connect phone to breadboard via the provided audio cable
Using “Signal Generator” phone app, play a 1kHz sine wave with maximum
amplitude and the volume turned to maximum (Turn off speaker if too loud)
2. Using the grey buttons, set the “recording time” on the LCD display to 2 seconds
3. Press the red record button
4. On your computer, locate the newly created .dat file in your local directory
5. Move the .dat file to your working MATLAB directory and rename it to “sine.dat”
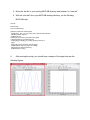
6. With the “sine.dat” file in your MATLAB working directory, run the following
MATLAB script:
clear all;
load sine.dat;
sine = transpose(sine);
plot(t,sine) %Plot time domain signal
axis([0 4/tone_freq -1.2 1.2]); %Only view 4 periods of time domain
title('Time domain signal');
xlabel('Time (s)');
sound(sine,fs); %Listen to the audio of the signal
y=fft(sine,length(t)); %Compute the FFT
f=fs/length(y)*(1:length(y)); %scaling frequency axis by fs
figure;
plot(f,real(y)) %Plot frequency domain signal
axis([0.95*tone_freq tone_freq*1.05 0 3500])
title('Frequency domain spectrum');
xlabel('Frequency (Hz)');
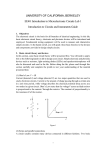
8.
After running the script, you should hear a sample of the signal and see the
following figures: