1
Moisture Image Series 1
Hygrometer
Programming Manual
April 2004
Process Control Instruments
Moisture Image Series 1
Hygrometer
Programming Manual
910-108PB2
!ATTENTION!
This manual contains instructions for Series 1 units
equipped with controller card p/n 703-1250. This
controller card supports the PanaCom/PanaView
user interface software.
June 2003
Warranty
Each instrument manufactured by GE Panametrics is warranted to be
free from defects in material and workmanship. Liability under this
warranty is limited to restoring the instrument to normal operation or
replacing the instrument, at the sole discretion of GE Panametrics. Fuses
and batteries are specifically excluded from any liability. This warranty
is effective from the date of delivery to the original purchaser. If GE
Panametrics determines that the equipment was defective, the warranty
period is:
•
one year for general electronic failures of the instrument
•
one year for mechanical failures of the transducers
If GE Panametrics determines that the equipment was damaged by
misuse, improper installation, the use of unauthorized replacement parts,
or operating conditions outside the guidelines specified by GE
Panametrics, the repairs are not covered under this warranty.
The warranties set forth herein are exclusive and are in lieu of
all other warranties whether statutory, express or implied
(including warranties or merchantability and fitness for a
particular purpose, and warranties arising from course of
dealing or usage or trade).
Return Policy
If a GE Panametrics instrument malfunctions within the warranty period,
the following procedure must be completed:
1. Notify GE Panametrics, giving full details of the problem, and
provide the model number and serial number of the instrument. If the
nature of the problem indicates the need for factory service, GE
Panametrics will issue a RETURN AUTHORIZATION NUMBER
(RAN), and shipping instructions for the return of the instrument to a
service center will be provided.
2. If GE Panametrics instructs you to send your instrument to a service
center, it must be shipped prepaid to the authorized repair station
indicated in the shipping instructions.
3. Upon receipt, GE Panametrics will evaluate the instrument to
determine the cause of the malfunction.
Then, one of the following courses of action will then be taken:
•
If the damage is covered under the terms of the warranty, the
instrument will be repaired at no cost to the owner and returned.
•
If GE Panametrics determines that the damage is not covered under
the terms of the warranty, or if the warranty has expired, an estimate
for the cost of the repairs at standard rates will be provided. Upon
receipt of the owner’s approval to proceed, the instrument will be
repaired and returned.
iii
April 2004
Table of Contents
Chapter 1: Features and Capabilities
Introduction to the Moisture Image
Series 1 . . . . . . . . . . . . . . . . . . . . . . . . . . . . . . . . . . . . . . . . . . . . . . . . . . . . . . . . . . . . . . . . . . . . .1-1
Electronics Unit . . . . . . . . . . . . . . . . . . . . . . . . . . . . . . . . . . . . . . . . . . . . . . . . . . . . . . . . . . . . . . .1-1
BASEEFA Certification . . . . . . . . . . . . . . . . . . . . . . . . . . . . . . . . . . . . . . . . . . . . . . . . . . . . . . . .1-3
CSA Certification . . . . . . . . . . . . . . . . . . . . . . . . . . . . . . . . . . . . . . . . . . . . . . . . . . . . . . . . . . . . .1-3
Probes . . . . . . . . . . . . . . . . . . . . . . . . . . . . . . . . . . . . . . . . . . . . . . . . . . . . . . . . . . . . . . . . . . . . . .1-4
M Series and TF Series Moisture Probes . . . . . . . . . . . . . . . . . . . . . . . . . . . . . . . . . . . . . . . .1-4
Moisture Image Series Probe . . . . . . . . . . . . . . . . . . . . . . . . . . . . . . . . . . . . . . . . . . . . . . . . .1-6
Delta F Oxygen Cell . . . . . . . . . . . . . . . . . . . . . . . . . . . . . . . . . . . . . . . . . . . . . . . . . . . . . . . .1-7
Cabling. . . . . . . . . . . . . . . . . . . . . . . . . . . . . . . . . . . . . . . . . . . . . . . . . . . . . . . . . . . . . . . . . . . . . .1-8
M Series and TF Series Probes . . . . . . . . . . . . . . . . . . . . . . . . . . . . . . . . . . . . . . . . . . . . . . . .1-8
Moisture Image Series Probe . . . . . . . . . . . . . . . . . . . . . . . . . . . . . . . . . . . . . . . . . . . . . . . . .1-8
Delta F Oxygen Cells . . . . . . . . . . . . . . . . . . . . . . . . . . . . . . . . . . . . . . . . . . . . . . . . . . . . . . .1-8
Pressure Sensors . . . . . . . . . . . . . . . . . . . . . . . . . . . . . . . . . . . . . . . . . . . . . . . . . . . . . . . . . . .1-8
RS232 Communications Port . . . . . . . . . . . . . . . . . . . . . . . . . . . . . . . . . . . . . . . . . . . . . . . . .1-8
User Program . . . . . . . . . . . . . . . . . . . . . . . . . . . . . . . . . . . . . . . . . . . . . . . . . . . . . . . . . . . . . . . . .1-9
Chapter 2: Basic Programming
Introduction . . . . . . . . . . . . . . . . . . . . . . . . . . . . . . . . . . . . . . . . . . . . . . . . . . . . . . . . . . . . . . . . . .2-1
Getting Started. . . . . . . . . . . . . . . . . . . . . . . . . . . . . . . . . . . . . . . . . . . . . . . . . . . . . . . . . . . . . . . .2-2
Powering Up . . . . . . . . . . . . . . . . . . . . . . . . . . . . . . . . . . . . . . . . . . . . . . . . . . . . . . . . . . . . . .2-2
Entering Data into the User Program . . . . . . . . . . . . . . . . . . . . . . . . . . . . . . . . . . . . . . . . . . .2-4
Screen and Key Functions. . . . . . . . . . . . . . . . . . . . . . . . . . . . . . . . . . . . . . . . . . . . . . . . . . . .2-5
Entering the Passcode . . . . . . . . . . . . . . . . . . . . . . . . . . . . . . . . . . . . . . . . . . . . . . . . . . . . . . .2-6
Getting On-Line Help . . . . . . . . . . . . . . . . . . . . . . . . . . . . . . . . . . . . . . . . . . . . . . . . . . . . . . .2-7
Verifying and Entering Setup Data . . . . . . . . . . . . . . . . . . . . . . . . . . . . . . . . . . . . . . . . . . . . . . . .2-8
Activating and Changing Probes. . . . . . . . . . . . . . . . . . . . . . . . . . . . . . . . . . . . . . . . . . . . . . .2-9
Entering Calibration Data . . . . . . . . . . . . . . . . . . . . . . . . . . . . . . . . . . . . . . . . . . . . . . . . . . .2-12
Entering High and Low Reference Values . . . . . . . . . . . . . . . . . . . . . . . . . . . . . . . . . . . . . .2-21
Displaying Measurements . . . . . . . . . . . . . . . . . . . . . . . . . . . . . . . . . . . . . . . . . . . . . . . . . . . . . .2-28
Setting Up the Matrix Format . . . . . . . . . . . . . . . . . . . . . . . . . . . . . . . . . . . . . . . . . . . . . . . .2-32
Setting Up the Line Graph . . . . . . . . . . . . . . . . . . . . . . . . . . . . . . . . . . . . . . . . . . . . . . . . . .2-35
Tagging the Inputs . . . . . . . . . . . . . . . . . . . . . . . . . . . . . . . . . . . . . . . . . . . . . . . . . . . . . . . .2-37
Adjusting the Contrast of the Screen . . . . . . . . . . . . . . . . . . . . . . . . . . . . . . . . . . . . . . . . . . . . . .2-40
Setting the Clock and Calendar . . . . . . . . . . . . . . . . . . . . . . . . . . . . . . . . . . . . . . . . . . . . . . . . . .2-41
v
April 2004
Table of Contents (cont.)
Chapter 3: Advanced Programming
Introduction . . . . . . . . . . . . . . . . . . . . . . . . . . . . . . . . . . . . . . . . . . . . . . . . . . . . . . . . . . . . . . . . . 3-1
Setting Up the Recorders . . . . . . . . . . . . . . . . . . . . . . . . . . . . . . . . . . . . . . . . . . . . . . . . . . . . . . . 3-1
Selecting Measurement Mode and Units for Recorders . . . . . . . . . . . . . . . . . . . . . . . . . . . . 3-2
Setting the Range for Recorders . . . . . . . . . . . . . . . . . . . . . . . . . . . . . . . . . . . . . . . . . . . . . . 3-3
Setting Up the Alarms . . . . . . . . . . . . . . . . . . . . . . . . . . . . . . . . . . . . . . . . . . . . . . . . . . . . . . . . . 3-4
Selecting the Measurement Mode, Units and High/Low Values for Alarms . . . . . . . . . . . . 3-5
Entering the Setpoint and Deadband Values for Alarms. . . . . . . . . . . . . . . . . . . . . . . . . . . . 3-5
Using Automatic Calibration . . . . . . . . . . . . . . . . . . . . . . . . . . . . . . . . . . . . . . . . . . . . . . . . . . . . 3-7
Entering Constants and User Functions . . . . . . . . . . . . . . . . . . . . . . . . . . . . . . . . . . . . . . . . . . . . 3-9
Entering User Constants . . . . . . . . . . . . . . . . . . . . . . . . . . . . . . . . . . . . . . . . . . . . . . . . . . . 3-10
Specifying User Functions. . . . . . . . . . . . . . . . . . . . . . . . . . . . . . . . . . . . . . . . . . . . . . . . . . 3-11
Entering User-Defined Tables . . . . . . . . . . . . . . . . . . . . . . . . . . . . . . . . . . . . . . . . . . . . . . . 3-13
Entering Saturation Constants . . . . . . . . . . . . . . . . . . . . . . . . . . . . . . . . . . . . . . . . . . . . . . . 3-14
Using Computer Enhanced Response . . . . . . . . . . . . . . . . . . . . . . . . . . . . . . . . . . . . . . . . . . . . 3-15
Setting Up the Data Logger . . . . . . . . . . . . . . . . . . . . . . . . . . . . . . . . . . . . . . . . . . . . . . . . . . . . 3-17
Viewing the Data Logger Status . . . . . . . . . . . . . . . . . . . . . . . . . . . . . . . . . . . . . . . . . . . . . 3-18
Viewing Logged Data . . . . . . . . . . . . . . . . . . . . . . . . . . . . . . . . . . . . . . . . . . . . . . . . . . . . . 3-18
Removing Logged Data. . . . . . . . . . . . . . . . . . . . . . . . . . . . . . . . . . . . . . . . . . . . . . . . . . . . 3-18
Entering Data Logger Settings . . . . . . . . . . . . . . . . . . . . . . . . . . . . . . . . . . . . . . . . . . . . . . 3-19
Setting Up the RS232 Communications Port. . . . . . . . . . . . . . . . . . . . . . . . . . . . . . . . . . . . . . . 3-22
Configuring the Serial Port . . . . . . . . . . . . . . . . . . . . . . . . . . . . . . . . . . . . . . . . . . . . . . . . . 3-22
Description of a Sample Output . . . . . . . . . . . . . . . . . . . . . . . . . . . . . . . . . . . . . . . . . . . . . 3-24
Setting Error Processing. . . . . . . . . . . . . . . . . . . . . . . . . . . . . . . . . . . . . . . . . . . . . . . . . . . . . . . 3-28
Procedure for Setting Error Processing . . . . . . . . . . . . . . . . . . . . . . . . . . . . . . . . . . . . . . . . 3-28
Loading New Software . . . . . . . . . . . . . . . . . . . . . . . . . . . . . . . . . . . . . . . . . . . . . . . . . . . . . . . 3-30
Chapter 4: Programming with PanaView
Introduction . . . . . . . . . . . . . . . . . . . . . . . . . . . . . . . . . . . . . . . . . . . . . . . . . . . . . . . . . . . . . . . . . 4-1
Changing Measurement Modes and Units . . . . . . . . . . . . . . . . . . . . . . . . . . . . . . . . . . . . . . . . . . 4-1
Open the Meter Display Window . . . . . . . . . . . . . . . . . . . . . . . . . . . . . . . . . . . . . . . . . . . . . 4-2
Change Meter Programming . . . . . . . . . . . . . . . . . . . . . . . . . . . . . . . . . . . . . . . . . . . . . . . . . 4-4
Changing a Matrix Display to a Graph . . . . . . . . . . . . . . . . . . . . . . . . . . . . . . . . . . . . . . . . . . . . 4-6
Changing Alarm Settings . . . . . . . . . . . . . . . . . . . . . . . . . . . . . . . . . . . . . . . . . . . . . . . . . . . . . . . 4-7
Changing Recorder Settings. . . . . . . . . . . . . . . . . . . . . . . . . . . . . . . . . . . . . . . . . . . . . . . . . . . . . 4-9
Setting Recorder Values . . . . . . . . . . . . . . . . . . . . . . . . . . . . . . . . . . . . . . . . . . . . . . . . . . . . 4-9
Testing Recorder Outputs . . . . . . . . . . . . . . . . . . . . . . . . . . . . . . . . . . . . . . . . . . . . . . . . . . 4-10
Programming Error Handling . . . . . . . . . . . . . . . . . . . . . . . . . . . . . . . . . . . . . . . . . . . . . . . 4-11
Programming User Functions . . . . . . . . . . . . . . . . . . . . . . . . . . . . . . . . . . . . . . . . . . . . . . . . . . 4-12
Entering User Tables . . . . . . . . . . . . . . . . . . . . . . . . . . . . . . . . . . . . . . . . . . . . . . . . . . . . . . . . . 4-14
Entering Saturation Constants . . . . . . . . . . . . . . . . . . . . . . . . . . . . . . . . . . . . . . . . . . . . . . . . . . 4-15
vi
Chapter 1
Features and Capabilities
Introduction to the Moisture Image Series 1 . . . . . . . . . . . . . . . . . 1-1
Electronics Unit . . . . . . . . . . . . . . . . . . . . . . . . . . . . . . . . . . . . . . . . 1-1
Probes . . . . . . . . . . . . . . . . . . . . . . . . . . . . . . . . . . . . . . . . . . . . . . . . 1-4
Cabling . . . . . . . . . . . . . . . . . . . . . . . . . . . . . . . . . . . . . . . . . . . . . . . 1-8
User Program . . . . . . . . . . . . . . . . . . . . . . . . . . . . . . . . . . . . . . . . . . 1-9
June 2003
Introduction to the
Moisture Image
Series 1
The GE Panametrics Moisture Image Series 1 is a microprocessor
based multi-channel analyzer designed to measure dissolved moisture
concentration in gases and non-aqueous liquids, and dissolved
oxygen concentration in gases. It is a highly advanced industrial
analyzer which is versatile and adaptable to many applications.
The Series 1 combines the use of hardware and software to make
various measurements. The user connects the needed inputs (moisture
probes, oxygen cells, pressure transducers, etc.) to the back panel of
the electronics unit using several types of cables. Typically, the user
installs moisture probes and oxygen cells into the process using a
sample system that is specifically designed for the application. The
sample system delivers a sample of the process to the probes. The
probes then send a signal to the Series 1 electronics unit, which
interprets the signal and converts it into a measurement.
The complete analyzer, including electronics, cables, and
measurement probes, forms a “system” which is designed to monitor
the process accurately and reliably. The following sections discuss
each part of this “system.”
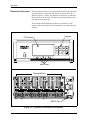
Electronics Unit
The center of the “system” is the electronics unit. The electronics unit
has many components, including terminal blocks for all connections,
an RS232 port, a Liquid Crystal Display (LCD), a keypad, and menu
keys. See Figure 1-1.
The back panel of the electronics unit contains the terminal blocks for
connecting moisture probes, oxygen cells, recorders, and optional
alarms (standard or hermetically sealed) for up to six channels. The
Series 1 also provides connections for two isolated outputs per
channel. Input connections for the M Series, TF Series, Moisture
Image Series and Delta F oxygen sensors are intrinsically safe.
As an optional feature, the Series 1 provides connections for two
auxiliary inputs (not intrinsically safe) on each channel. The auxiliary
inputs can accept signals from any 0/4 to 20-mA or 0 to 2-VDC
device, including other GE Panametrics analyzers.
The RS232 port enables the user to connect a remote terminal,
printer, or computer to the Series 1. Using an optional Personal
Computer (PC) interface software package, the user can also set up
and operate one or more analyzers from a remote location, transfer
data for further analysis, and create data logs.
The front panel of the electronics unit has a Liquid Crystal Display
(LCD) to show data.The LCD is capable of displaying data in a line
graph, or a text matrix format.
Features and Capabilities
1-1
April 2004
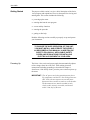
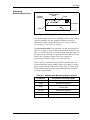
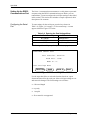
Electronics Unit (cont.)
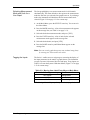
The front panel also has a 16-key keypad that is used to enter data and
operate the Series 1. There are four menu keys below the LCD, as
shown in Figure 1-1 below. The function of a menu key is indicated
directly above it on the LCD. The menu key functions change as the
user makes menu selections.
The electronics unit with all these features is available in a rack
mount, bench mount, panel mount, weatherproof, or explosion-proof
versions.
Keypad
LCD Screen
1
2
3
YES
4
5
6
NO
7
8
9
-
0
.
POWER
Menu Keys
Terminal Blocks
12
250
3
RS232 Port
Figure 1-1: The Series 1 Electronics Unit Features
1-2
Features and Capabilities
June 2003
BASEEFA Certification
Rack, bench, panel Series 1s s/n 2000 and above and WPF Series 1s
s/n 2300 and above are BASEEFA certified to supply intrinsically
safe levels. Installation requires that the Series 1 be mounted in a
general purpose area only. M Series, TF Series, and Moisture Image
Series probes and Delta F oxygen cells are intrinsically safe when
connected to the Series 1, allowing for sensor installation in IEC/
CENELEC zone 0 areas.
CSA Certification
Newer versions of rack, bench, panel and WPF Series 1’s are
CSA-NRTL certified intrinsically safe. Installation requires the
Series 1 be mounted in either a NEC CL.1, Div. 2, Group B, C or D
hazardous area or a general purpose area. M Series, TF Series, and
Moisture Image Series probes and Delta F oxygen cells are
intrinsically safe when connected to the Series 1, allowing for sensor
installation in NEC CL.1, Div. 1, Groups A, B, C and D hazardous
areas.
Note: Refer to certification labels on your instrument and
installation drawing #752-138 to determine the applicable
level of certification that your meter carries.
Features and Capabilities
1-3
June 2003
Probes
Probes are the part of the system that come into contact with the
process flow. The Series 1 uses various types of probes to fit the
needs of a wide range of applications.
The term “probe” includes devices such as moisture sensors, pressure
transducers, and oxygen cells. Although you can supply your own
probes for certain measurements, GE Panametrics provides the
following standard probes to make moisture, temperature, pressure
and oxygen measurements:
•
Moisture (M) Series - moisture and temperature (in gases and
liquids)
•
Three Function (TF) Series and Moisture Image Series Probes moisture, temperature, and pressure (in gases and liquids)
•
Delta-F Cells - oxygen measurement (in gases)
The most commonly used probes are discussed in more detail below.
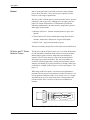
M Series and TF Series
Moisture Probes
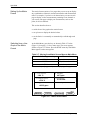
The M Series and the TF Series probes are very similar. Both probes
use GE Panametrics aluminum oxide sensors to measure moisture,
and thermistor beads to measure temperature (the thermistor is
optional). The TF Series, however, also has an optional built-in
strain-gage-type pressure transducer. The sensor assemblies are
secured to a probe mount and are usually protected with a sintered
stainless-steel shield (TF-9 probes do not have a shield). Other types
of shields are available (refer to Figure 1-2 below and Figure 1-3 on
page 1-5).
When using an M Series probe, a separate pressure transmitter is
required if in-line pressure measurement is needed. The Series 1 can
use any pressure transmitter with a 0/4 to 20 mA or 0 to 2-V output.
Alternatively, the user can enter fixed values for temperature and
pressure into the Series 1 memory if the process conditions are
constant.
Figure 1-2: The M Series Probe
1-4
Features and Capabilities
June 2003
M Series and TF Series
Moisture Probes (cont.)
Figure 1-3: The TF Series Probe
Although the M and the TF Series probes may be installed directly in
the process line, more often these probes are inserted into a sample
system. The sample system protects the probes and enables the user to
easily remove the probes for calibrating, servicing and cleaning.
Sample systems also control the flow of the process stream so that it
is within the specifications of the measurement probe or cell.
The M and TF Series probes, when used with a BASEEFA-approved
Series 1, are intrinsically safe (see Chapter 3, Specifications, of the
Startup Guide for BASEEFA certification numbers) and designed to
meet the requirements of IEC/CENELEC zone 0 areas.
When operated with a CSA-NRTL approved Series 1, the M and TF
Series probes are intrinsically safe (see Chapter 3, Specifications, of
the Series 1 Startup Guide for CSA-NRTL certification numbers) and
designed to meet the requirements of NEC C1.1, Div. 1, Groups A, B,
C and D hazardous areas.
The M and TF Series probes measure moisture content in a standard
range from –110°C to 20°C (–166°F to 68°F) dew/frost point
temperature and optionally from –110°C to 60°C (–166°F to 140°F).
Both probes optionally measure temperature in a range of –30°C to
70°C (–22°F to 158°F). The TF probe optionally measures pressure
from 30 to 300, 50 to 500, 100 to 1000, 300 to 3000, or 500 to 5000
PSIG.
Features and Capabilities
1-5
June 2003
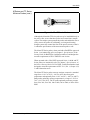
Moisture Image Series
Probe
The Moisture Image Series Probe measures moisture, temperature
(optional), and pressure (optional). The Moisture Image Series Probe
has its own electronics module that consists of a built-in
microcontroller with 16-bit resolution (see Figure 1-4 below).
The electronics module stores the probe calibration and reference data
in non-volatile memory; therefore, the user never needs to enter the
data by hand. The Moisture Image Series Probe also features
continuous compensation of its own analog circuitry to assure longterm electronic stability.
The Moisture Image Series Probe, when operated with a BASEEFAapproved Series 1, is intrinsically safe (see Chapter 3, Specifications,
of the Startup Guide for BASEEFA certification numbers) and
designed to meet the requirements of IEC/CENELEC zone 0 areas.
The Moisture Image Series Probe, when operated with a CSA-NRTL
certified Series 1, is intrinsically safe (see Chapter 3, Specifications,
of the Series 1 Startup Guide for CSA-NRTL certification numbers)
and designed to meet the requirements of NEC C1.1, Div. 1, Groups
A, B, C and D hazardous areas.
The Moisture Image Series Probe measures moisture content in a
standard range from –110°C to 20°C (–166°F to 68°F) dew/frost
point temperature and optionally from –110°C to 60°C (–166°F to
140°F). Additionally, the Moisture Image Series Probe can be used to
measure temperature in a range of –30°C to 70°C (–22°F to 158°F)
and pressure from 30 to 300, 50 to 500, 100 to 1000, 300 to 3000, or
500-5000 PSIG.
Electronics Module
Figure 1-4: The Moisture Image Series Probe
1-6
Features and Capabilities
June 2003
Delta F Oxygen Cell
The Series 1 standard oxygen measurement probe is the Delta F Cell.
Overall oxygen content range is from 0 to 25%. You may choose
from seven standard oxygen ranges.The lowest standard range is 0 to
1/10/100 ppm, and the highest standard range is 0 to 25% oxygen. An
ultra-low range sensor that covers 0-500 ppbv and is sensitive to less
than 5 ppb is also available. The Series 1 also accepts oxygen inputs
from other GE Panametrics oxygen sensors.
If your application has a high concentration of acid-forming
components, GE Panametrics can supply a STAB-EL option for the
Delta F Cell. The STAB-EL option is specially designed to
effectively neutralize these components from the sample gas stream.
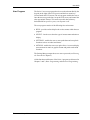
The Delta F Cell is available in a general purpose model with both a
top and bottom drain or only a top drain (see Figure 1-5 below). The
Delta F Cell is usually installed in its own sample system.The Delta F
Cell is available with VCR® fittings, mounted in a NEMA-4X
enclosure for weatherproof/corrosion resistant applications, or
mounted in a NEMA-7 enclosure for hazardous areas.
The Delta F Cell, when operated with a BASEEFA-approved
Series 1, is intrinsically safe (see Chapter 3, Specifications, of the
Startup Guide for BASEEFA certification numbers) and designed to
meet the requirements of IEC/CENELEC zone 0 areas.
The Delta F Cell, when used with a CSA-NRTL certified Series 1, is
intrinsically safe (see Chapter 3, Specifications, of the Series 1
Startup Guide for CSA-NRTL certification numbers) and designed to
meet the requirements of NEC C1.1, Div. 1, Groups A, B, C and D
hazardous areas.
Bottom Drain
Top Drain
Figure 1-5: Delta F Oxygen Cells - Bottom and Top Drain
Features and Capabilities
1-7
April 2004
Cabling
Each probe requires an interconnecting cable. Cables differ
depending on the probe. The various cables are discussed below
under the appropriate probe type. All of these cable assemblies can be
ordered from GE Panametrics.
M Series and TF Series
Probes
The M and the TF Series probes are connected to the analyzer with a
special GE Panametrics shielded cable. Probes can be located up to
600 meters (2000 feet) from the Series 1 (consult GE Panametrics for
distances up to 1200 meters). To measure pressure with a TF probe,
the maximum cable length is approximately 152 meters (500 feet).
Small electronic offsets, especially with longer cables, are possible
and should be corrected as described in Performing a MH Calibration
Test/Adjustment on page 1-20 of the Service Manual.
Moisture Image Series
Probe
The Moisture Image Series Probe can be connected to the Series 1
with an unshielded, twisted-pair cable. The probe may be located up
to 915 meters (3000 feet) from the analyzer using 22 AWG twisted
pair cable. (Consult GE Panametrics for longer cable lengths.)
Delta F Oxygen Cells
The standard Delta F Cell is connected to the analyzer with a fourwire shielded cable (22 AWG). With 22-AWG cable, oxygen cells
with a range from 0 to 1/10/100 ppmv or 0 to 0.5/5/50 ppmv can be
located up to 90 meters (300 feet) away from the analyzer. All other
oxygen cells can be located up to 15 meters (50 feet) away. For
greater cable lengths, 20, 18 or 16 AWG wire is required. Consult a
factory engineer when a longer length is required.
Pressure Sensors
The Series 1 accepts either pressure transducers or pressure
transmitters. Most pressure transducers can be connected with a
standard four-wire shielded cable. Most pressure transmitters are
connected using either a two or four-wire non-shielded cable and can
be either loop or self-powered.
RS232 Communications
Port
A personal computer or serial printer can be connected to the Series 1
RS232 communications port using a standard serial cable. A special
switch enables the user to configure the unit as Data Terminal
Equipment (DTE) or Data Communications Equipment (DCE). (See
Connecting a PC or Printer in Chapter 1 of the Service Manual for
details on DTE/DCE configuration.)
1-8
Features and Capabilities
June 2003
User Program
The Series 1 has a user program that is accessed and controlled by the
keypad (to the right of the LCD screen) and the four menu keys
(located under the LCD screen).The user program enables the user to
enter the necessary probe data, set up the LCD screen, and control the
other operational features. The meter stores this data in batterybacked RAM for up to five years, even if power is off.
The user program consists of the following four main menus:
•
HELP - provides on-line help for the various menus within the user
program.
•
SELECT - lets the user select the type of measurement and units to
display.
•
SETTINGS - enables the user to enter probe data and set up basic
functions such as recorders and alarms.
•
OPTIONS - enables the user to set up the Series 1 screen to display
measurements in matrix or graphic format and perform advanced
functions.
The Settings Menu prompts the user to enter a passcode (see Entering
the Passcode in Chapter 2).
All the functions and features of the Series 1 program are discussed in
Chapters 2 and 3, Basic Programming and Advanced Programming.
Features and Capabilities
1-9
Chapter 2
Basic Programming
Introduction . . . . . . . . . . . . . . . . . . . . . . . . . . . . . . . . . . . . . . . . . . . 2-1
Getting Started . . . . . . . . . . . . . . . . . . . . . . . . . . . . . . . . . . . . . . . . . 2-2
Verifying and Entering Setup Data . . . . . . . . . . . . . . . . . . . . . . . . . 2-8
Displaying Measurements . . . . . . . . . . . . . . . . . . . . . . . . . . . . . . .2-28
Adjusting the Contrast of the Screen. . . . . . . . . . . . . . . . . . . . . .2-40
Setting the Clock and Calendar . . . . . . . . . . . . . . . . . . . . . . . . . .2-41
June 2003
Introduction
The Moisture Image Series 1 is a highly advanced and versatile
instrument. Because of this, operation ranges from basic to advanced
functions. This section is designed to provide a step-by-step guide to
basic operations. For information on other functions, refer to Chapter
3, Advanced Programming.
IMPORTANT: You must install a switch or circuit breaker on the
input power line. For greatest safety, locate the
circuit breaker or power switch near the electronics
console. To comply with the Low Voltage Directive,
you must install an external current protection
device.
The following sections cover basic programming functions:
•
Getting Started - describes how to power up, gives a description of
the user program, and explains how to obtain on-line help.
•
Verifying Setup Data - describes how to verify and, if necessary,
enter setup data for moisture, pressure, oxygen, and any other input
devices.
•
Displaying Measurements - explains how to display measurements
using different screen formats.
•
Adjusting the Contrast of the Screen - explains how to adjust the
screen for optimal viewing.
•
Setting the Clock and Calendar - explains how to set the internal
clock and calendar.
Note: Because they are so essential, the instructions covered in the
Getting Started, Verifying and Entering Setup Data and
Displaying Measurements sections are also included in the
Startup Guide. If you have read this material, you may skip
those sections of this chapter.
Basic Programming
2-1
June 2003
Getting Started
The purpose of this section is to give a brief description of the Series
1 user program and explain how to use its front panel for viewing and
entering data. This section includes the following:
•
powering up the meter
•
entering data into the user program
•
screen and key functions
•
entering the passcode
•
getting on-line help
Read the following sections carefully to properly set up and operate
your instrument.
!WARNING!
TO ENSURE THE SAFE OPERATION OF THIS UNIT,
YOU MUST INSTALL AND OPERATE THE SERIES 1
AS DESCRIBED IN THIS MANUAL. IN ADDITION, BE
SURE TO FOLLOW ALL APPLICABLE SAFETY
CODES AND REGULATIONS FOR INSTALLING
ELECTRICAL EQUIPMENT IN YOUR AREA.
Powering Up
The Series 1 has a universal power supply that automatically adjusts
to line voltages from 90 to 260 VAC. After making electrical
connections (including grounding) as described in Chapter 1,
Installation, of the Startup Guide, press the power switch to power up
the meter.
IMPORTANT: .The AC power cord is the main disconnect device.
For compliance with the EU’s Low Voltage Directive
(IEC 1010), this unit requires an external power
disconnect device such as a switch or circuit breaker.
The disconnect device must be marked as such,
clearly visible, directly accessible, and located
within 1.8 m (6 ft) of the unit.
2-2
Basic Programming
June 2003
Powering Up (cont.)
Caution!
Do not operate the Delta F oxygen cell for extended
periods of time at oxygen concentrations that are over
range. Trace and low percent range sensors may be
damaged if exposed to high levels of oxygen, such as
air, for long periods (>1 hour) while the Series 1 is on. If
exposure is unavoidable, either disconnect the oxygen
cell from the Series 1 or equip the sample system with a
valve that allows the cell to be switched to purge gas.
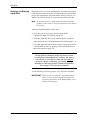
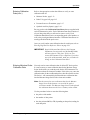
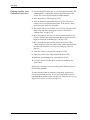
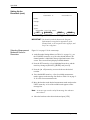
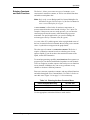
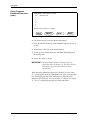
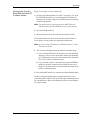
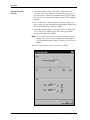
If the meter passes its self-test, the screen begins displaying
measurements in a matrix format similar to the one shown in
Figure 2-1 below.
1 Dew Point
-18.0 °C
2 Temperature
+35.9 °C
3
H 2O
+0.535 ppmv
Main Menu
HELP
SELECT
4 Oxygen
48.3 ppbv
5 Pressure
27.10 PSIg
X Unassigned
11:35 01/22/2000
pg: 1
SETTINGS
OPTIONS
Figure 2-1: Screen Matrix Format After Power Up
Basic Programming
2-3
June 2003
Entering Data into the
User Program
The Series 1 has a user program that enables you to enter data to set
up alarms, recorders, and probes, as well as its other features.
The user program consists of the following four main menus (refer to
Figures 3-17 and 3-18, pages 3-31 and 3-32, for menu maps of the
user program):
•
HELP - provides on-line help for the various menus of the
user program.
•
SELECT - lets you select the type of measurement and units to
display.
•
SETTINGS - enables you to set up recorders and alarms, as well as
enter probe data for basic operation. (To enter this menu you must
enter the passcode. See page 2-6.)
•
OPTIONS - enables you to set up the screen to display
measurements in text or graphical form. It is also used to perform
advanced functions.
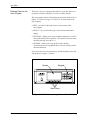
You can use the screen, four menu keys, and the keypad to enter data
into the unit (see Figure 2-2 below).
Screen
Keypad
1
2
3
YES
4
5
6
NO
7
8
9
-
0
.
POWER
Menu Keys
Figure 2-2: The Moisture Image Series 1 Front Panel
2-4
Basic Programming
June 2003
Screen and Key
Functions
The screen displays measurements, up to four menu options, system
messages, and a pointer. The pointer acts as a measurement
indicator, as well as a guide during data entry.
While the unit displays measurements in the matrix format, the
pointer moves sequentially from box to box to indicate measurement
updates. However, while in the user program, you can use the arrow
keys to move the pointer to the desired location for data entry.
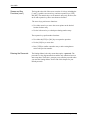
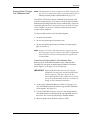
The menu options appear at the bottom of the screen. Below the
screen are the corresponding menu keys (refer to Figure 2-3). Each
menu key corresponds to each of the menu options in the user
program. Up to four new menu options appear each time you enter a
menu.
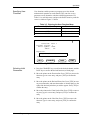
The line above the menu options is the message line (see Figure 2-3
below). The message line displays the menu title, the time, and the
date. The message line also displays a list of selections depending on
the menu option you enter.
The page indicator is located in between the message line and the
menu keys. Since the Series 1 is capable of displaying up to six pages
of data, the page indicator displays the currently selected page.
Message Line
Page Indicator
Main Menu
HELP
11:35 01/22/2000
pg: 1
SELECT SETTINGS OPTIONS
Menu Options
Menu Keys
Figure 2-3: Screen Components
Basic Programming
2-5
June 2003
Screen and Key
Functions (cont.)
The keypad to the side of the screen consists of 16 keys, including the
[.] and [-] symbols, two arrow keys, and two response keys: [YES]
and [NO]. The numeric keys are for numeric entry only; however, the
arrow and response keys have more than one function.
The arrow keys perform two functions:
•
Use either arrow key to move the screen pointer to the desired
location for data entry.
•
Use the left arrow key as a backspace during number entry.
The response keys perform three functions:
Entering the Passcode
2-6
•
Use either the [YES] or [NO] key to respond to questions.
•
Use the [NO] key to erase data.
•
Press [YES] to confirm a number entry or after erasing data to
retrieve the previous number.
The Settings Menu is the only menu that requires a passcode. The
passcode is a four-digit number that enables only authorized users to
enter setup data. The Series 1 prompts you to enter the passcode when
you enter the Settings Menu. See the end of this chapter for your
default passcode.
Basic Programming
June 2003
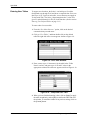
Getting On-Line Help
The Series 1 offers on-line help screens that contain descriptions and
instructions for various topics. The first menu option in most of the
menus is HELP.
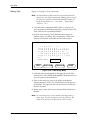
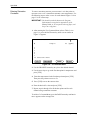
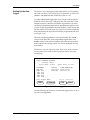
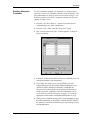
When you press the HELP menu key, the screen display gives a list of
help topics as shown in Figure 2-4. This list enables you to get help
for most subjects, regardless of the current menu. To select a topic,
use the arrow keys to move the pointer to the topic you want to view,
then press [YES]. Use the NEXT and PREVIOUS menu options to
scroll from one page to another. The NEXT menu option brings you
to the following page and the PREV menu options brings you to the
previous page. Press DONE to exit and return to the current menu.
Select Topic, then press YES.
Alarms
AutoCal
Calibration
Clock/Calendar
Cs Constant
Configuration
Data Logging
Delta-F Tables
Enhanced Response
Entering Numbers
Entering Text
Error Messages
Error Processing
Graphs
Henry’s Law
Legends,Entering
Logger,Capacity
Logger,Setting
Logger,Viewing
Main Menu
Help Topic Index Menu
ABOUT
NEXT
PREV
DONE
Figure 2-4: HELP Screen
By pressing the ABOUT key, users can access the history of their
particular Series 1: its serial number, PCI number, software revision
number and date of manufacture. This information remains part of the
HELP file and cannot be changed by the user.
Basic Programming
2-7
April 2004
Verifying and Entering
Setup Data
Before the Series 1 can make measurements, it must have the proper
setup data entered into its memory. GE Panametrics has entered all or
most of the setup data for each probe before delivery; however, you
should verify that all the data is correct and entered into your unit.
Note: If you want to switch a probe from one channel to another,
you must re-enter some or all of the setup data as described in
this section.
Verifying setup data consists of three steps:
•
Verify that probes are properly activated in the Probe
Configuration Menu as described on page 2-9.
•
Verify that calibration data for all necessary probes is properly
entered in the System Calibration Menu as described on page 2-12.
•
Verify that applicable high and low reference values for the Series
1 measurement circuitry are properly entered into the Reference
Menu as described on page 2-21.
Caution!
All high and low reference values are factory set and
normally do not need adjustment. However, the factory
may instruct you to adjust the high and low moisture
reference values. If necessary, you should do so as
described in Performing an MH Calibration/Adjustment
Test on page 1-20 of the Service Manual.
Use the following sections to properly verify and enter setup data.
IMPORTANT: While you are reviewing data, you should take the
time to record it on the Program Information List
supplied in Appendix A of the Startup Guide, or on a
separate sheet of paper.
2-8
Basic Programming
April 2004
Activating and Changing
Probes
Although the probes are physically connected to the back of the
electronics unit, you must “tell” the electronics what type of
measurements the probe is capable of making. In addition, if you
want to use a constant value rather than a live input, you must “tell”
the electronics that you are using a constant value.
If you do not activate probes, or if you activate them incorrectly, the
unit will display No Probe or other error messages.
Once you verify and/or change configuration data, refer to Entering
Calibration Data on page 2-12.
Verifying Probe
Configuration Data
IMPORTANT: You should record this data on the Program
Information List supplied in Appendix A of the
Startup Guide, or on a separate sheet of paper, and
keep it in a safe place.
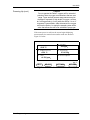
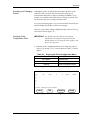
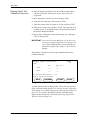
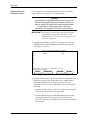
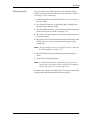
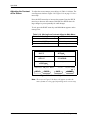
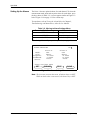
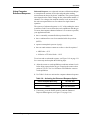
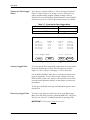
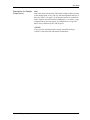
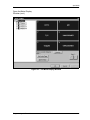
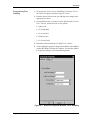
1. Enter the Probe Configuration Menu (for a menu map, refer to
Figure 3-19 on page 3-32). A screen similar to Figure 2-5 below
appears.
Table 2-1: Entering the Probe Configuration Menu
Press the Main Menu key:
To enter the:
SETTINGS*
Settings Menu
SYSTEM
System Settings Menu
CONFIG
Probe Configuration Menu
* The Settings Menu will prompt for a passcode (see page 2-6).
SYSTEM CONFIGURATION
Ch
1
2
3
4
5
6
O2
HYG
T
P
Aux1
Aux2
Probe Configuration Menu
HELP
TAG
ERRORS
DONE
Figure 2-5: Probe Configuration Menu
Basic Programming
2-9
April 2004
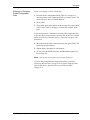
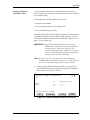
Activating and Changing
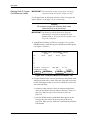
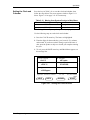
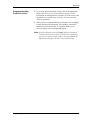
Probes (cont.)
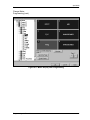
Verify that the correct probe types have been activated for each
channel. To do this, make sure a probe is activated for each
measurement it is capable of taking. For example, if a Moisture
Image Series Probe with the temperature and pressure functions is
connected to channel 1, “MIS” must be selected in the hygrometry,
temperature, and pressure columns as shown in Figure 2-6 below.
If the optional auxiliary inputs are installed and active, you only need
to select whether the input is current or voltage. If you do not select
current or voltage, the Series 1 defaults to current.
Note: If you are using an auxiliary input to measure pressure,
activate Au1 (or Au2 depending on which input you are using)
in the pressure column for the desired channel; then activate
current or voltage in the Aux 1(or Aux 2) column.
In addition, if you connect a pressure transducer to the PRESS/
OTHER terminal block, you must activate the TF probe in the
pressure column for that channel.
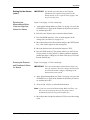
If you need to change any data in the Probe Configuration Menu, see
the following section, Entering or Changing Probe Configuration
Data. If the data is correct, refer to Tagging the Inputs on page 2-37.
SYSTEM CONFIGURATION
Ch
O2
HYG
MIS
1
2
3
4
5
6
T
MIS
P
MIS
Aux1
Aux2
Probe Configuration Menu
HELP
TAG
ERRORS
DONE
Figure 2-6: MIS Probe Configuration on Channel 1
2-10
Basic Programming
April 2004
Entering or Changing
Probe Configuration
Data
Figure 3-19 on page 3-32 for a menu map.
1. From the Probe Configuration Menu (Table 2-1 on page 2-9),
move the pointer to the channel and probe you want to select. The
arrow will move only to installed channels.
2. Press [YES].
3. The possible probe types appear on the message line at the bottom
of the screen. Table 2-2 on page 2-12 shows the available probe
types.
If you choose to enter a constant for moisture (Kh), temperature (Kt),
or pressure (Kp), you must enter a constant value in the User Constant
Menu. See Entering Constants and User Functions on page 3-9 for
instructions.
4. Move the brackets to the correct probe type, then press [YES]. The
selected probe type displays.
5. Repeat Steps 1 through 4 for each channel.
6. To exit, press the DONE menu key until Main Menu appears on
the message line.
Note: You can only select probes for an installed channel.
If you are only using Moisture Image Series probes, proceed to
Displaying Measurements on page 2-28. If you are using any other
type of input device, proceed to Entering Calibration Data
on page 2-12.
Basic Programming
2-11
April 2004
Entering or Changing
Probe Configuration
Data (cont.)
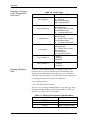
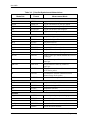
Table 2-2: Probe Types
Measurement Mode
Probe Type
OXY (Oxygen)
Entering Calibration
Data
–
%
ppM
ppB
(None)
(Percent)
(Parts per Million)
(Parts per Billion)
HYG (Hygrometry)
– (None)
MIS (MIS Probe)
TF (Three-Function Probe)
Mxx (M Series Probe)
Kh (Constant Dew Point)
T (Temperature)
– (None)
MIS (MIS probe)
TF (Three-Function probe)
Mxx (M-Series probe)
Kt (Constant Temperature)
P (Pressure)
– (None)
MIS (MIS probe)
TF (Three-Function probe)
Au1 (Auxiliary 1)
Au2 (Auxiliary 2)
Kp (Constant Pressure)
Aux1 (Auxiliary 1)
– (None)
I (Current)
V (Voltage)
Aux2 (Auxiliary 2)
– (None)
I (Current)
V (Voltage)
The Series 1 needs calibration data for moisture, oxygen, and
pressure probes, as well as auxiliary inputs. GE Panametrics has
already entered calibration data for probes; however, you should
verify this data before startup. You will need to enter this data if you:
•
•
•
sent the probes back to the factory for calibration
use a different probe
use a non-GE Panametrics input
To enter, verify, or change calibration data for any probe type, enter
the System Calibration Menu as described in Table 2-3 below. (see
Figure 3-19 on page 3-32 for a menu map.)
.
Table 2-3: Moving to the System Calibration Menu
Press the Main Menu key:
To enter the:
SETTINGS*
SYSTEM
CALIB
Settings Menu
System Settings Menu
System Calibration Menu
*The Settings Menu will prompt for a passcode (see page 2-6).
2-12
Basic Programming
April 2004
Entering Calibration
Data (cont.)
Refer to the appropriate section that follows to verify or enter
calibration data for:
•
Moisture Probes, page 2-13
•
Delta F Oxygen Cell, page 2-15
•
Pressure Sensor or Transmitter, page 2-17
•
Optional Auxiliary Input(s), page 2-19
Be sure you have the Calibration Data Sheets that are supplied with
each GE Panametrics probe. Each Calibration Data Sheet consists of
a list of data points that you will need to enter or verify. Each
Calibration Data Sheet lists its corresponding probe serial number, as
well as the preassigned channel number. Calibration Data Sheets are
usually packed inside the probe cases.
Once you verify and/or enter calibration data for each input, refer to
Entering High and Low Reference Values on page 2-21.
IMPORTANT: Staple Calibration Data Sheets to the Program
Information List (Appendix A of the Startup Guide)
and store them in a safe place. If they are lost,
contact GE Panametrics for a duplicate. If you alter
any of the calibration data, make sure you make the
change on the Calibration Data Sheet.
Entering Moisture Probe
Calibration Data
You only need to enter calibration data for M and TF Series probes.
It is not necessary to enter calibration data for the Moisture Image
Series Probe unless you send the probe back to GE Panametrics for
calibration without its electronics module. If this is the case, enter the
calibration data for the recalibrated probe as described in this section.
The Series 1 will automatically download the new calibration data
into the Moisture Image Series Probe electronics module.
Note: You do not need to enter calibration data for the Moisture
Image Series Probe because it is stored in the probe’s
electronics module. The Moisture Image Series Probe uploads
the calibration data into the Series 1 memory when needed.
Use the procedure below to enter the following data:
Basic Programming
•
the probe serial number
•
the number of data points
•
the dew point and MH (or FH, depending on the probe) reading for
each data point
2-13
April 2004
Entering Moisture Probe
Calibration Data (cont.)
Referring to the Calibration Data Sheets, enter calibration data
separately for each probe on the designated channel as described
below. Figure 3-19 on page 3-32 for a menu map.
Note: If you want to enter a constant value, refer to Entering
Constants on page 3-9. It is not necessary to enter the
calibration data if you are using a constant.
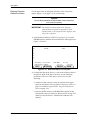
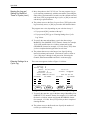
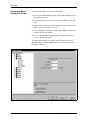
1. At the System Calibration Menu (see Table 2-3 on page 2-12),
press the PROBE menu key until the Moisture Probe Calibration
screen appears (see Figure 2-7 below).
2. Use the CHANNEL menu key to cycle to the desired channel. The
channel number is indicated in the top right-hand corner of the
screen.The screen will only display installed channels.
Moisture Probe Calibration
S/N:
ND:
##
MH
DP/°C
##
01
09
02
10
03
11
04
12
05
13
06
14
07
15
08
16
System Calibration Menu
MH
Ch 1
DP/°
Screen 1 of 1
HELP
CHANNEL
PROBE
DONE
Figure 2-7: System Calibration Menu for Moisture
3. Move the pointer to S/N and press [YES].
4. Enter the probe serial number from the Calibration Data Sheet,
and press [YES]. (The serial number is also scribed on the hex nut
of the moisture probe.) The pointer automatically jumps to ND.
Press [YES] again.
5. Enter the number of data points indicated on the Calibration Data
Sheet (typically 2-16 points for each probe), and press [YES]. The
pointer automatically jumps to the first data point.
6. Move the pointer to 1 and enter the MH (or FH) values and dew
point (in °C) for each data point. Make sure you press [ENT] after
you enter each value.
7. Repeat Step 6 for each data point.
8. Repeat Steps 2 through 7 to enter moisture probe calibration data
for the remaining channels.
To enter calibration data for other probes, refer to the following
sections. To exit, press the DONE menu key until Main Menu
appears on the message line. Then refer to Entering High and Low
Reference Values on page 2-21.
2-14
Basic Programming
April 2004
Entering Delta F Oxygen
Cell Calibration Data
Note: The information in this section applies to Delta F oxygen cells
only. If you are using some other type of oxygen input, refer to
Entering Auxiliary Input Calibration Data on page 2-19.
Your Delta F cell has been factory calibrated using nitrogen as the
reference background gas. If you want to use the oxygen cell with a
different background gas than the cell was calibrated for, refer to the
section Background Gas Correction Factors for the Delta F Oxygen
Cell in Chapter 2 of the Service Manual to determine the correct
oxygen current multiplier.
Use the procedure below to enter the following data:
•
the probe serial number
•
the zero and span range in microamps (µ A)
•
the zero and span range in parts per million by volume (ppmv)
ppbr, or percent (%)
Note: Oxygen cells can be ordered to measure in ppm or percent.
Select the proper oxygen cell units in the Probe Configuration
Menu. The units you select will automatically appear in the
second column.
Procedure for Entering Delta F Cell Calibration Data
Referring to the Calibration Data Sheets, enter calibration data
separately for each probe on the designated channel as described
below. Figure 3-19 on page 3-32 for a menu map.
IMPORTANT: Staple Calibration Data Sheets to the Program
Information List (Appendix A of the Startup Guide)
and store them in a safe place. If they are lost,
contact GE Panametrics for a duplicate. If you alter
any of the calibration data, make sure you make the
change on the Calibration Data Sheet.
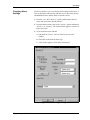
1. At the System Calibration Menu (see Table 2-3 on page 2-12),
press the PROBE menu key until the Oxygen Probe Calibration
screen appears. See Figure 2-8.
2. Use the CHANNEL menu key to cycle to the desired channel.
The channel number is indicated in the top right-hand-corner of
the screen. The screen will only display installed channels.
3. Move the pointer to the S/N line and press [YES].
Basic Programming
2-15
June 2003
Entering Delta F Cell
Calibration Data (cont.)
4. Enter the probe serial number from the Calibration Data Sheet,
and press [YES].The serial number is also on the side of the
oxygen cell.
5. Move the pointer to the Zero µ A line and press [YES].
6. Enter the microamp (µA) value and press [YES].
7. Move the pointer to the Zero ppm (or %) line and press [YES].
8. Enter the zero range value, and press [YES]. The range units will
be either ppm or %, depending on the cell type/model selected in
the Probe Configuration Menu.
9. Repeat Steps 5 through 8 to enter the microamp (µA) and range
value for the span line.
IMPORTANT: Leave the O2 Current Multiplier at 1.00 unless you
are using a background gas other than nitrogen. See
the section Background Gas Correction Factors for
the Delta F Oxygen Cell in Chapter 2 of the Service
Manual.
Repeat Steps 1 through 9 to enter oxygen calibration data for the
remaining channels.
Oxygen Probe Calibration
Ch
S/N
µA
ppm (or %)
Zero:
___
___
Span:
___
___
1
O2 Current Multiplier: 1:00
System Calibration Menu
HELP
CHANNEL
PROBE
DONE
Figure 2-8: System Calibration Menu for Oxygen Cell
To enter calibration data for other probes, refer to Entering Moisture
Probe Calibration Data on page 2-13, Entering Pressure Calibration
Data on page 2-17, and Entering Auxiliary Input Calibration Data on
page 2-19. To exit, press the DONE menu key until Main Menu
appears on the message line. Then refer to Entering High and Low
Reference Values on page 2-21.
2-16
Basic Programming
April 2004
Entering Pressure
Calibration Data
Use this section to enter pressure calibration data for any type of
pressure sensor you are using, even if the pressure sensor is connected
to an auxiliary input.
To enter pressure calibration data, you must enter
•
the probe serial number
•
the zero and span range in mV, current, or FP
•
the zero and span range in PSIg
Referring to the Calibration Data Sheets supplied by GE Panametrics
or another manufacturer, enter calibration data separately for each
probe on the designated channel as described below. Figure 3-19 on
page 3-32 for a menu map.
IMPORTANT: Staple Calibration Data Sheets to the Program
Information List (Appendix A of the Startup Guide)
and store them in a safe place. If they are lost,
contact GE Panametrics for a duplicate. If you alter
any of the calibration data, make sure you make the
change on the Calibration Data Sheet.
Note: If you want to enter a constant value, refer to Entering
Constants and User Functions on page 3-9. It is not necessary
to enter the calibration data if you are using a constant.
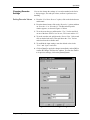
1. At the System Calibration Menu (see Table 2-3 on page 2-12),
press the PROBE menu key until the Pressure Probe Calibration
screen appears. See Figure 2-9 below.
Pressure Probe Calibration
Ch
S/N
Zero:
Span:
mV
____
____
1
Pressure, PSIg
____
____
System Calibration Menu
HELP
CHANNEL
PROBE
DONE
Figure 2-9: System Calibration Menu for Pressure
Basic Programming
2-17
April 2004
Entering Delta F Cell
Calibration Data (cont.)
Note: If you are using an auxiliary input to measure pressure, the
first column will be in mA or Volts depending on how you
configured the auxiliary input in Activating and Changing
Probes as described on page 2-9.
2. Use the CHANNEL menu key to cycle to the desired channel. The
channel number is indicated in the top right-hand corner of the
screen. The screen will only display installed channels.
3. Move the pointer to S/N and press [YES].
4. Enter the probe serial number from the Calibration Data Sheet and
press [YES].
5. Move the pointer to the Zero mV (mA) line and press [YES].
6. Enter the voltage or current value and press [YES].
7. Move the pointer to the Zero PSIg line and press [YES].
8. Enter the PSIg value and press [YES].
9. Use Steps 5 through 8 to enter the span values.
Repeat steps 1 through 9 to enter pressure calibration data for the
remaining channels.
To enter calibration data for other probes, refer to Entering Moisture
Probe Calibration Data on page 2-13, Entering Delta F Oxygen Cell
Calibration Data on page 2-15, and Entering Auxiliary Input
Calibration Data on page 2-19. To exit, press the DONE menu key
until Main Menu appears on the message line. Then refer to Entering
High and Low Reference Values on page 2-21.
2-18
Basic Programming
April 2004
Entering Auxiliary Input
Calibration Data
Note: If you are using an auxiliary input to measure pressure, enter
pressure calibration data as described in Entering Pressure
Calibration Data as described on page 2-17.
This section describes how to enter calibration data for an auxiliary
input (optional). If your device is not supplied by GE Panametrics,
you will have to obtain the calibration data in order to properly set up
the Series 1.
You will need to enter two to 16 data points. If the sensor is linear,
you only need to enter two data points. Each data point requires a
voltage or current value depending on the probe configuration (see
page 2-9) and a corresponding scale value. Use the procedure below
to enter data.
Figure 3-19 on page 3-32 for a menu map.
IMPORTANT: Enter the auxiliary calibration data on the Program
Information List (Appendix A of the Startup Guide)
and store it in a safe place. If it is lost, contact GE
Panametrics for a duplicate.
1. At the System Calibration Menu (see Table 2-3 on page 2-12),
press the PROBE menu key until the Auxiliary Input Calibration
screen appears. There is one screen each for Auxiliary Input 1 and
Auxiliary Input 2. Make sure you have the correct screen before
verifying or entering data (see Figure 2-10 below).
Aux 1 Probe Calibration
ND:
Label:[No Label]
[ Aux # ] ##
#
mA (VDC)
01
08
02
09
03
10
04
11
05
12
06
13
07
14
15
Ch
mA
1
[ Aux #]
System Calibration Menu
HELP
CHANNEL
PROBE
DONE
Figure 2-10: System Calibration Menu for Auxiliary Inputs
Basic Programming
2-19
April 2004
Entering Auxiliary Input
Calibration Data (cont.)
2. Use the CHANNEL menu key to cycle to the desired channel. The
channel number is indicated in the top right-hand corner of the
screen. The screen will only display installed channels.
3. Move the pointer to ND and press [YES].
4. Enter the number of data points and press [YES]. The Series 1
requires two to 16 calibration data points. If the sensor is linear
you only need to enter two data points.
5. The pointer will move to LABEL. Press [YES] to enter the Label
Entry menu and enter or change the Label (as described in
“Making Tags” on page 2-38).
6. Move the pointer to the Units (or [Aux]) column heading. Press
[YES] to edit the Units label used when displaying the Auxiliary
Input (as described in “Making Tags” on page 2-38).
7. Move the pointer to the first data point in the mA (or VDC)
column and press [YES]. The units for this column will depend on
the units you selected in Activating and Changing Probes on
page 2-9.
8. Enter the voltage or current value and press [YES].
9. Move the pointer to the Units column and press [YES].
10. Enter the corresponding scale value and press [YES].
11. Use steps similar to 4 through 10 to enter the remaining data
point values.
Repeat steps 1 through 9 to enter auxiliary input calibration data for
the remaining channels.
To enter calibration data for moisture, temperature, and pressure,
refer to the preceding sections. To exit, press the DONE menu key
until Main Menu appears on the message line. Then refer to Entering
High and Low Reference Values on page 2-21.
2-20
Basic Programming
April 2004
Entering High and Low
Reference Values
The last step in setup is entering high and low reference values. The
Series 1 requires reference values for its measurement circuitry for
moisture, oxygen, and pressure inputs. The references are factory
calibration values that are specific to each channel card. Reference
values are located on a label placed on the side or front of the unit.
Note: If you receive a channel card replacement or change the
instrument program, you need to re-enter the reference data
for that channel.
Table 2-4 shows the key sequences for entering the Reference Menu.
(Figure 3-19 on page 3-32 for a menu map.)
Table 2-4: Moving to the Reference Menu
Press the Main Menu key:
To enter the:
SETTINGS*
SERVICE
REFS
Settings Menu
System Service Menu
Reference Menu
*The Settings Menu will prompt for a passcode (see page 2-6).
Use the appropriate section that follows to verify or enter reference
values for the probes.
Once you verify and/or enter reference data for each input, refer to
Displaying Measurements on page 2-28.
IMPORTANT: You should record this data on the Program
Information List supplied in Appendix A of the
Startup Guide, or on a separate sheet of paper, and
keep it in a safe place.
Basic Programming
2-21
April 2004
Entering Moisture
Reference Values
Use the steps below to change the reference values for moisture
inputs. (Figure 3-19 on page 3-32 for a menu map.)
Caution!
If you modified the supplied cables or are not using GE
Panametrics-supplied cables for moisture probes, you
may be required to adjust the moisture reference data
as described in Performing an MH Calibration/
Adjustment Test on page 1-20 of the Service Manual.
IMPORTANT: You should record reference data on the Program
Information List supplied in Appendix A of the
Startup Guide, or on a separate sheet of paper, and
keep it in a safe place.
1. At the Reference Menu (see Table 2-4 on page 2-21), press the
PROBE menu key until the Moisture Reference Table appears
(see Figure 2-11 below).
MOISTURE REFERENCE TABLE
Ch
1
2
3
4
5
6
HIGH
LOW
AutoCal Interval: (HH.MM) 01:00
Reference Menu
HELP
INTERVAL
PROBE
DONE
Figure 2-11: Reference Menu for Moisture
2. Compare the data on the screen to the reference data printed on the
label placed on the side or front of the unit, or supplied with a
replacement channel card. If the data is incorrect, use the
procedure below to correct it. If the data is correct, do one of the
following:
2-22
•
continue to enter reference values for oxygen cell and pressure
inputs as described in the following sections.
•
press the DONE menu key until Main Menu appears on the
message line; then refer to Displaying Measurements on
page 2-28. When you exit, the Series 1 automatically calibrates
each channel.
Basic Programming
April 2004
Entering Moisture
3. Move the pointer to HIGH for the desired channel, and press
[YES].
Reference Values (cont.)
4. Enter the high reference value for that channel and press [YES].
5. The pointer automatically moves to LOW for the same channel.
Press [YES].
6. Enter the low reference value for that channel, and press [YES].
7. Repeat steps 3 through 6 to enter the high and low reference
values for the remaining channels.
Note: You may also enter the Auto-Cal Interval while in the
Reference Menu. Simply press the INTERVAL menu key and
enter the desired interval. See page 3-7 for more information.
To enter reference values for oxygen cell and pressure inputs, refer to
the following sections. To exit, press the DONE menu key until Main
Menu appears on the message line. Then refer to Displaying
Measurements on page 2-28. When you exit, the Series 1
automatically calibrates each channel.
Basic Programming
2-23
April 2004
Entering Delta F Oxygen
Cell Reference Values
IMPORTANT: The instructions in this section apply to entering
reference data for the Delta F oxygen cell only.
Use the steps below to change the reference values for oxygen cell
inputs. (Figure 3-19 on page 3-32 for a menu map.)
Caution!
Do not adjust oxygen cell reference data unless
instructed to do so by the factory.
IMPORTANT: You should record this data on the Program
Information List supplied in Appendix A of the
Startup Guide, or on a separate sheet of paper, and
keep it in a safe place.
1. At the Reference Menu (see Table 2-4 on page 2-21), press the
PROBE menu key until the Oxygen Cell Reference Table appears
(see Figure 2-12 below).
OXYGEN CELL REFERENCE TABLE
HIGH
LOW
Zero
Span
Zero Span
Ch
1
2
3
4
5
6
AutoCal Interval: (HH.MM): 01:00
Reference Menu
11:15
6/2/00
HELP
INTERVAL
PROBE
DONE
Figure 2-12: Reference Menu for the Delta F Cell
2. Compare the data on the screen to the reference data printed on the
label placed on the side or front of the unit. If the data is incorrect,
use the following procedure to correct it. If the data is correct, do
one of the following:
2-24
•
continue to enter reference values for moisture and pressure
inputs as described in Entering Moisture Reference Values on
page 2-22, and Entering Pressure Reference Values on
page 2-26.
•
press the DONE menu key until Main Menu appears on the
message line; then refer to Displaying Measurements on
page 2-28. When you exit, the Series 1 automatically calibrates
each channel.
Basic Programming
April 2004
Entering Delta F Oxygen
Cell Reference Values
(cont.)
3. Move the pointer to the Zero line for the high reference for the
desired channel and press [YES].
4. Enter the zero value for the high reference for that channel and
press [YES]. The pointer automatically proceeds to the Span line
for the high reference for the same channel. Press [YES] again.
5. Enter the span value for the high reference for that channel and
press [YES].
6. Move the pointer to the Zero line for the low reference for the
desired channel and press [YES].
7. Enter the zero value for the low reference for that channel and
press [YES].
8. Move the pointer to the Span line for the low reference for the
desired channel and press [YES].
9. Enter the span value for the low reference for that channel and
press [YES].
Repeat steps 3 through 9 to enter the high and low reference values
for the remaining channels.
To enter reference values for moisture and pressure inputs, refer to
Entering Moisture Reference Values on page 2-22 and Entering
Pressure Reference Values on page 2-26. To exit, press the DONE
menu key until Main Menu appears on the message line. Then refer
to Displaying Measurements on page 2-28. When you exit, the
Series 1 automatically calibrates each channel.
Basic Programming
2-25
June 2003
Entering Pressure
Reference Values
Use the steps below to change the reference values for pressure
inputs. (Figure 3-19 on page 3-32 for a menu map.)
Caution!
Do not adjust pressure reference data unless instructed
to do so by the factory.
IMPORTANT: You should record this data on the Program
Information List supplied in Appendix A of the
Startup Guide, or on a separate sheet of paper, and
keep it in a safe place.
1. At the Reference Menu (see Table 2-4 on page 2-21), press the
PROBE menu key until the Pressure Reference Table appears (see
Figure 2-13 below).
Ch
1
2
3
4
5
6
PRESSURE REFERENCE TABLE
HIGH
LOW
AutoCal Interval:
Reference Menu
HELP
INTERVAL
(HH.MM): 01:00
11:15
6/2/00
PROBE
DONE
Figure 2-13: Reference Menu for Pressure
2. Compare the data on the Series 1 screen to the reference data for
the pressure input. If the data is incorrect, use the following
procedure to correct it. If the data is correct, do one of the
following:
2-26
•
continue to enter reference values for moisture and oxygen
inputs as described in Entering Moisture Reference Values on
page 2-22 and Entering the Delta F Oxygen Cell Reference
Values on page 2-24.
•
press the DONE menu key until Main Menu appears on the
message line; then see Displaying Measurements on page 2-28.
When you exit, the Series 1 automatically calibrates each
channel.
Basic Programming
April 2004
Entering Pressure
3. Move the pointer to HIGH for the desired channel and press
[YES].
Reference Values (cont.)
4. Enter the high reference value for that channel and press [YES].
5. The pointer automatically moves to LOW for the same channel.
Press [YES].
6. Enter the low reference value for that channel and press [YES].
7. Repeat steps 3 through 6 to enter the high and low reference
values for the remaining channels.
To enter reference values for moisture and oxygen inputs, refer to
Entering Moisture Reference Values on page 2-22, and Entering the
Delta F Oxygen Cell Reference Values on page 2-25. To exit, press
the DONE menu key until Main Menu appears on the message line.
Then refer to Displaying Measurements on page 2-28. When you exit,
the Series 1 automatically calibrates each channel.
Basic Programming
2-27
June 2003
Displaying
Measurements
The Series 1 can display measurements in a matrix format or a line
graph. The first time you power it up, the screen will display
measurements in the matrix format. The matrix format has six pages
and each page consists of six boxes as shown in Figure 2-14. You can
program each box to display any measurement for any channel.
1
Dew Point
-18.0 °C
4 Oxygen
48.3 ppbv
2 Temperature
+35.9 °C
5 Pressure
27.10 PSIG
H 2O
+0.535 ppmv
X Unassigned
3
Main Menu
HELP
SELECT
11:35
SETTINGS
01/22/2000
pg: 1
OPTIONS
Figure 2-14: Matrix Format Screen
Each box in the matrix format is either assigned or unassigned. An
assigned box displays a channel number, measurement mode, units,
and a value. An unassigned box displays no data. See Figure 2-15 on
page 2-29 for examples of each type of box.
2-28
Basic Programming
June 2003
Displaying
Measurements (cont.)
Channel
Number
Measurement
Mode
Units
5 Pressure
27.10 PSIG
Indicators
X Unassigned
Value
Unassigned Box
Figure 2-15: Assigned and Unassigned Boxes
The channel number is from 1 to 6, depending on how many channel
cards are installed in the unit. Additional channel cards can be
purchased separately and installed later (see Installing a Channel
Card on page 2-19 of the Service Manual).
The measurement mode is the parameter currently being measured.
There are a variety of units for each measurement mode. Table 2-6 on
page 2-31 shows a list of the measurement modes and a description of
the units for each. The table also shows the measurement modes and
units as they are displayed on the screen. An example of a
measurement is shown in Figure 2-16 on the next page.
When selecting a measurement mode, please remember that some
measurement modes require multiple inputs. For example, to display
ppmv, you need moisture and pressure inputs. Table 2-5 below shows
a list of measurement modes that require multiple inputs and what
you need to program them.
Table 2-5: Measurement Modes and Required Inputs
To measure:
You need the following inputs:
Basic Programming
RH
Temperature and moisture
PPMv
Moisture and pressure
PPMw
Moisture, temperature and saturation
constant data
MCF/IG
Moisture and pressure
MCF/NG
Moisture and pressure
PPMv/NG
Moisture and pressure
2-29
June 2003
Displaying
Measurements (cont.)
The shaded area in Figure 2-15 represents the indicator area. When
you program the Series 1 with constants or use Enhanced Response, a
symbol appears in this area. A “K” indicates a constant is being used
in the measurement and an “E” indicates the meter is using Enhanced
Response to determine the measurement. An example of a
measurement using a constant and Enhanced Response activated is
shown in Figure 2-16 below.
The value is expressed in the units selected for a desired measurement
mode.
5
Value
Indicators
Measurement
Mode
Channel
Number
H2 O
123.45
E K
PPMw
Units
Figure 2-16: Example of a Displayed Measurement
2-30
Basic Programming
April 2004
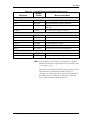
Table 2-6: Measurement Modes and Units for the Series 1
Selected
Meas. Mode
Oxygen
Displayed
Meas. Mode
Displayed
Units
O2%= Percent Oxygen default
Oxygen
%
O2/ppM = Parts Per Million
Oxygen
ppmv
O2/ppB = Parts Per Billion
Oxygen
ppbv
O2/µA = Microamps (Diagnostic Mode)
Oxygen
µA
Description of Units
O2/DVM = Digital Voltmeter (Diagnostic Mode)
Oxygen DVM
VDC
DP/°C = Dew/Frost Point default
Dew Point
°C
DP/°F = Dew/Frost Point °F
Dew Point
°F
DP/K = Dew/Frost Point K (Kelvin)
Dew Point
K
Rel. Humidity
%
H/ppMv = Parts per Million of Water by Volume
H2O
ppmv
H/ppMw = Parts per Million of Water by Weight (for liquids only)
H2O
ppmw
%R.H. = Relative Humidity
H/ppBv = Parts per Billion of Water by Volume
Hygrometry
H2O
ppbv
MCF/IG = Pounds of Water per Million Std. Cubic Feet in Ideal Gas
H2O/MMSCF NG
lbs
MCF/NG = Pounds of Water per Million Std. Cubic Feet in Natural Gas
H2O/MMSCF NG
lbs
ppMv/NG = Parts Per Million by Volume in Natural Gas
H2O (Nat. Gas)
ppmv
mmHg = Vapor Pressure
Vapor Pressure
mmHg
Pas = Vapor Pressure
Vapor Pressure
Pas
MH = MH* (Diagnostic Mode)
H/DVM = Digital Voltmeter (Diagnostic Mode)
FH = FH* (Diagnostic Mode)
Temperature
MIS Probe
FH
Temperature
°C
T/°F = Degrees Fahrenheit
Temperature
°F
T/K = Kelvin
Temperature
K
Temp DVM
VDC
PSIg = Pounds per Square Inch Gauge default
Pressure
PSIg
Bars = Bars
Pressure
Bars
mbs = Millibars
Pressure
mbs
mm/Hg = Millimeters of Mercury
Pressure
mmHg
Pa(g) = Pascal, gauge
Pressure
Pas
kPas(g) = KiloPascal, gauge
Pressure
kPas
P/mV = Pressure in millivolts
Pressure
mV
Pressure DVM
VDC
P/DVM = Digital Voltmeter (Diagnostic Mode)
FP = FP** (Diagnostic Mode)
Aux1/V = Volts default
Auxiliary 1
MH
VDC
T/°C = Degrees Celsius default
T/DVM = Digital Voltmeter (Diagnostic Mode)
Pressure
H2O
Moisture DVM
Aux1/I = Milliamps
MIS Probe
FP
Aux1
VDC
Aux1
mA
Aux1 (Aux Label)
none
Aux2/V = Volts default
AuxX
VDC
Aux2/I = Milliamps
Aux2
mA
Aux2/User = Function (Displays Aux Label)
Aux2 (Aux Label)
none
Volt Reference
Vref = Volts default (Diagnostic Mode)
Voltage Reference
VDC
Signal Ground
Vgnd = Volts default (Diagnostic Mode)
Signal Ground
VDC
Aux1/User = Function (Displays Aux Label)
Auxiliary 2
User
*The MH and FH values are the moisture sensors’ response values and are the values that are recorded during calibration.
**The FP value is the MIS Probe’s response value for pressure and is the value recorded during calibration.
Basic Programming
2-31
April 2004
Setting Up the Matrix
Format
The matrix format consists of six pages that you can set up to display
any combination of channels, measurement modes and measurement
units. For example, if you have a six channel unit, you can use each
page to display various measurements pertaining to one channel or
you can use each page to display one measurement, such as dew
point, for all six channels.
This section describes how to:
Switching from a Line
Graph to the Matrix
Format
•
switch from a line graph to the matrix format
•
set up boxes to display the desired values
•
set the Series 1 to manually or automatically scroll through each
page
At the Main Menu, press the keys as shown in Table 2-7 below.
(Figure 3-18 on page 3-31 for a menu map.) The screen appears
similar to Figure 2-17 below. Press the DONE menu key until Main
Menu appears on the message line.
Table 2-7: Moving from Matrix Screen Menu to Main Menu
Press the following menu keys:
To enter the:
OPTIONS
Option Menu
SCREEN
Graph/Matrix Screen Menu
MATRIX*
Matrix Screen Menu
*This menu key only appears if you are displaying a line graph.
1 Dew Point
-18.0 °C
2 Temperature
+35.9 °C
3 H 2O
4 Oxygen
48.3 ppbv
5 Pressure
27.10 PSIG
X Unassigned
+0.535 ppmv
Matrix Screen Menu
GRAPHS
CYCLE
11:35
01/22/2000
pg: 1
DONE
CONTRAST
Figure 2-17: Matrix Screen Menu
2-32
Basic Programming
April 2004
Setting Up a Box
Once you switch to the matrix format, you can assign the desired
channel, measurement modes and units to any of the boxes. Figure 318 on page 3-31 for a menu map.
1. At the Main Menu, press the SELECT menu key. You are now in
the Select Menu.
2. Press the PAGE menu key. At the Display Page # prompt, enter
the page number and press [YES].
3. Press the MODE menu key. A list of measurement modes appears
on the message line (see Table 2-6 on page 2-31).
4. Press the PLACE menu key to move the larger pointer to the box
you want to change.
5. Move the brackets to the desired measurement mode and press the
UNITS menu key. A list of measurement units appears on the
message line.
Note: To clear (unassign) a box, press [NO]. The Series 1 labels the
box X Unassigned (see Figure 2-17).
6. Move the brackets to the desired measurement units and press
[YES].
7. Enter the desired channel number.
Note: A “Channel Not Installed” message appears if you select a
channel where no channel card is installed. Select a different
channel. The meter will emit a buzzing sound.
Repeat the above steps for each desired box. To exit, press the DONE
menu key until Main Menu appears on the message line.
Basic Programming
2-33
June 2003
Manually or
Automatically Scrolling
Through Pages
You can set the Series 1 to automatically scroll through each page or
enable you to scroll through each page manually. Use the appropriate
section below to set up the scrolling procedure.
Figure 3-18 on page 3-31 for a menu map.
1. At the Main Menu, press the SELECT menu key. You are now in
the Select Menu.
2. Press the PAGE menu key. At the Display Page # prompt, enter
the page number and press [YES].
3. At the Main Menu, press the OPTIONS menu key.
4. Press the SCREEN menu key.
5. Press the CYCLE menu key.
6. Enter an interval between 0 and 5 minutes and press [YES].
Note: Enter 0:00 to turn the automatic scroll off.
7. Press the DONE menu key until Main Menu appears on the
message line.
After you enter the interval, the Series 1 begins scrolling through each
page. It will automatically skip over pages that consist of all
unassigned boxes.
Note: When you press the SELECT menu key, the meter suspends
the automatic page scrolling so you can make changes to the
screen. It will automatically begin scrolling when you return
to the Main Menu.
2-34
Basic Programming
April 2004
Setting Up the Line
Graph
A line graph displays data for each channel using a point-to-point
graph. A line graph is useful for indicating trends or changes in
measurements. You can only choose one measurement mode, which
you can change at any time, for all channels. Only channels
programmed for the selected measurement mode appear.
This section describes how to:
Switching from the
Matrix Format to a Line
Graph
•
switch from the matrix format to a line graph
•
select the measurement units and mode
•
select the X and Y axis scale
At the Main Menu, press the keys as shown in Table 2-8 below.
Figure 3-18 on page 3-31 for a menu map. The screen appears similar
to Figure 2-18 below. Proceed to the appropriate section that follows
to change the mode, units or scale. If you do not want to change any
of the line graph settings, press the DONE menu key until Main Menu
appears on the message line.
Table 2-8: Moving from Graph Screen Menu to Main Menu
Press the following menu keys:
To enter the:
OPTIONS
Option Menu
SCREEN
Matrix Screen Menu
GRAPHS*
Graph Screen Menu
*This menu key will not appear if your screen is already set up for the
graph format. If you switched your screen to display a line graph
earlier and are now returning to adjust the graph, press the MATRIX
menu key in its place. The screen will switch to the matrix format.
Press the DONE menu key once to exit the Matrix Screen Menu.
Then press the SCREEN menu key, and the GRAPHS menu key
should appear.
Dew Point, °C
+070.0
+050.0
+030.0
+010.0
-010.0
-030.0
00
02
Graph Screen Menu
MATRIX
SCALE
04
06
08
10 m
11:35
01/22/2000
CONTRAST
DONE
Figure 2-18: Graph Screen Menu for a Line Graph
Basic Programming
2-35
April 2004
Setting Up the X and Y
Axis for a Line Graph
Figure 3-18 on page 3-31 for a menu map.
1. At the Graph Screen Menu (see Table 2-7), press the SCALE
menu key, and then the SCALE X and Y axis menu key.
2. The Series 1 prompts for the minimum Y axis. Enter the minimum
value to be displayed, and press [YES].
3. The meter then prompts for the maximum Y axis. Enter the
maximum value to be displayed, and press [YES].
4. Press the X AXIS (horizontal axis) menu key.
5. Enter the time in minutes, and press [YES]. The Series 1 accepts
any value from 1 to 2160 minutes (36 hours).
6. Press the DONE menu key until Main Menu appears on the
message line.
2-36
Basic Programming
April 2004
Selecting Measurement
Mode and Units for a
Line Graph
The line graph displays one measurement mode for all channels
simultaneously. The meter defaults to dew point as the measurement
mode the first time you select the line graph; however, if you change
modes, the instrument will default to the last measurement mode
selected. Figure 3-18 on page 3-31 for a menu map.
1. At the Main Menu, press the SELECT menu key. You are now in
the Select Menu.
2. Press the MODE menu key. A list of measurement modes appears
on the message line (see Table 2-6 on page 2-31).
3. Select the desired measurement mode, and press [YES].
4. Press the UNITS menu key. A list of units for the selected
measurement mode appears on the message line.
5. Select the desired units, and press [YES].
6. Press the DONE menu key until Main Menu appears on the
message line.
Note: You can rescale graph data at any time (without losing data)
by entering new X-axis and Y-axis values.
Tagging the Inputs
The Series 1 enables users to assign tags to customize the display of
the input parameters in the matrix or graph formats. The instrument
accepts a separate 16 character label for each input. To tag inputs, use
Table 2-9 to enter the System Calibration Menu. (Figure 3-19 on page
3-32 for a menu map.)
Table 2-9: Moving from Label Entry Menu to Main Menu
Press the following menu keys
To enter the:
SETTINGS*
Settings Menu
SYSTEM
System Settings Menu
CONFIG
Probe Configuration Menu
*The Settings Menu will prompt for a passcode (see page 2-6).
Basic Programming
2-37
April 2004
Making Tags
Figure 3-19 on page 3-32 for a menu map.
Note: You should have already verified or entered the calibration
data for the input before making tags. Making your own tag of
any character length overrides the default GE Panametrics
tag for that parameter (i.e., “Dew Point,” “Temperature,”
“Pressure,” etc.)
1. From the Probe Configuration Menu (Table 2-1 on page 2-9),
move the pointer to the channel and probe you want to select. The
arrow will only move to installed channels.
2. Press the TAG menu key. The Label Entry Menu appears as
shown in Figure 2-19 below. The screen displays a table of the
character set available, an Edit Box and four menu options.
0
@
P
‘
p
!
1
A
Q
a
q
∋ °
“
2
B
R
b
r
#
3
C
S
c
s
$
4
D
T
d
t
%
5
E
U
e
u
& '(
6 7
F G
V W
f g
v w
)
8
H
X
h
x
*
9
I
Y
i
y
+
:
J
Z
j
z
,
;
K
[
k
{
- . /
< = > ?
L M N O
¥ ] ^ _
l m n o
| } → µ
Label Entry:
HELP
NEXT ROW
PREV ROW
DONE
Figure 2-19: Label Entry Menu
3. A flashing select pointer appears in the upper left corner of the
character set. Use the NEXT ROW and PREV ROW menu keys to
move the pointer to the desired row.
4. Then use the arrow keys to move the pointer to the desired
character and press [YES]. The selected character will appear in
the Edit Box. The upper left corner of the character set contains
the space character.
5. Repeat steps 3 and 4 until you have entered all the characters for
the label.
Note: Use the numeric keys to enter numbers, decimal points, or
minus signs. To erase a character, press the [NO] key. The
character to the left of the Edit Cursor will be erased.
2-38
Basic Programming
April 2004
Making Tags (cont.)
6. When you complete entering the label, press the DONE menu key.
The Probe Configuration Menu screen appears again, this time
with a tag symbol appearing beside the tagged probe. When you
return to the Main Menu, the matrix will display the tag name in
the assigned channel.
Note: Tags do not appear for alarm or recorder outputs.
Basic Programming
2-39
April 2004
Adjusting the Contrast
of the Screen
To adjust the screen contrast, press the keys in Table 2-10 below. The
screen appears similar to Figure 2-20. Figure 3-18 on page 3-31 for a
menu map.
Press the INCR menu key to increase the contrast. Press the DECR
menu key to decrease the contrast. Hold INCR or DECR down for
large changes or press repeatedly for small changes.
To exit, press the DONE menu key until Main Menu appears on the
message line.
Table 2-10: Moving from Contrast Adjust to Main Menu
Press the following menu keys:
To enter the:
OPTIONS
Option Menu
SCREEN
Screen Menu
CONTRAST
1
Dew Point
-18.0 °C
2 Temperature
+35.9 °C
3
Contrast Adjust Menu
4 Oxygen
48.3 ppbv
5 Pressure
27.10 PSIG
X Unassigned
H2O
+0.535 ppmv
Contrast Adjust Menu
HELP
DECR
11:35
01/22/2000
pg: 1
INCR
DONE
Figure 2-20: Contrast Adjust Menu
Note: The screen in Figure 2-20 above will appear in either the
matrix format or a line graph, depending on the screen setup.
2-40
Basic Programming
April 2004
Setting the Clock and
Calendar
Press the keys in Table 2-11 to reset the clock and calendar; then
follow the steps below. The screen appears similar to Figure 2-21
below. Figure 3-18 on page 3-31 for a menu map.
Table 2-11: Moving from System Service to Main Menu
Press the following menu keys:
To enter the:
SETTINGS
SERVICE
Settings Menu
System Service Menu
*The Settings Menu will prompt for a passcode (see page 2-6).
Use the following steps to set the clock and calendar:
1. Press the CLOCK menu key. The hours are highlighted.
2. Enter the digits for the month, day, year, hours (0-23), minutes,
and seconds. If you do not want to change a part of the time or
date, press the pointer to skip over it until you complete entering
the year.
3. To exit, press the DONE menu key until Main Menu appears on
the message line.
1 Dew Point
-18.0 °C
4 Oxygen
48.3 ppbv
2 Temperature
+35.9 °C
5 Pressure
27.10 PSIG
3
X Unassigned
H2O
+0.535 ppmv
System Service Menu
HELP
REFS
11:35
CLOCK
01/22/2000
pg:1
DONE
Figure 2-21: Setting the Clock/Calendar
Basic Programming
2-41
Your passcode is 2719.
Please remove this page and put it in a safe place for future reference.
Chapter 3
Advanced Programming
Introduction . . . . . . . . . . . . . . . . . . . . . . . . . . . . . . . . . . . . . . . . . . . 3-1
Setting Up the Recorders . . . . . . . . . . . . . . . . . . . . . . . . . . . . . . . .3-1
Setting Up the Alarms . . . . . . . . . . . . . . . . . . . . . . . . . . . . . . . . . . . 3-4
Using Automatic Calibration . . . . . . . . . . . . . . . . . . . . . . . . . . . . . . 3-7
Entering Constants and User Functions . . . . . . . . . . . . . . . . . . . . 3-9
Using Computer Enhanced Response . . . . . . . . . . . . . . . . . . . . . 3-15
Setting Up the Data Logger . . . . . . . . . . . . . . . . . . . . . . . . . . . . . . 3-17
Setting Up the RS232 Communications Port. . . . . . . . . . . . . . . . 3-22
Setting Error Processing . . . . . . . . . . . . . . . . . . . . . . . . . . . . . . . . 3-28
Loading New Software. . . . . . . . . . . . . . . . . . . . . . . . . . . . . . . . . . 3-30
April 2004
Introduction
Setting Up the
Recorders
Now that the Series 1 is running and the screen is set up, you may
want to use the other operational features that are listed below:
•
Setting Up the Recorders
•
Setting Up the Alarms
•
Using Automatic Calibration
•
Entering Constants and User Functions
•
Using Enhanced Response
•
Using Data Logging
•
Setting Up the RS232 Communications Port
•
Setting Error Processing
The Series 1 has two recorder outputs for each channel: Recorder A
and Recorder B. To select the measurement mode, units and range for
each recorder, press the menu keys as shown in Table 3-1 below. The
screen appears similar to Figure 3-1 on page 3-2. Figure 3-19 on page
3-32 for a menu map.
IMPORTANT: Switch Blocks must be set to the appropriate
positions for output ranges. See Connecting the
Recorder Outputs in Chapter 1 of the Service
Manual.
To test or trim recorders, refer to Testing the Recorder Outputs or
Trimming Recorders in Chapter 2 of the Service Manual.
Table 3-1: Entering the Recorder Settings Menu
Press the following menu keys:
To enter the:
SETTINGS*
OUTPUTS
RECORDER
Settings Menu
Output Settings Menu
Recorder Settings Menu
* The Settings Menu will prompt for a passcode (see page 2-6).
Advanced Programming
3-1
April 2004
Setting Up the
Recorders (cont.)
Recorder Outputs
Recorder A
Recorder B
Mode:
Range:
Zero:
Span:
Recorder Setting Menu
SET
CHANNEL
TEST
DONE
Figure 3-1: Recorder Settings Menu
IMPORTANT: You should record this data on the Program
Information List supplied in Appendix A of the
Startup Guide, or on a separate sheet of paper, and
keep it in a safe place.
Selecting Measurement
Mode and Units for
Recorders
Figure 3-19 on page 3-32 for a menu map.
1. At the Recorder Settings Menu (see Table 3-1 on page 3-1), use
the CHANNEL menu key to cycle to the desired channel. The
channel number is indicated in the top right-hand corner of the
screen. The screen will only display installed channels.
2. Press the SET menu key. A box highlights Recorder A, and the
menu keys change to [RANGE], [MODE] and [A
B].
3. Press the [A
recorder.
B] menu key to move the box to the desired
4. Press the MODE menu key. A list of available measurement
modes appears on the message line. Refer to Table 2-6 on page 231 for a list of measurement modes.
5. Move the brackets to the desired measurement mode and press the
UNITS menu key. A list of the available units appears on the
message line.
Note: An arrow sign at either end of the message line indicates
more choices.
6. Move the brackets to the desired units and press [YES].
3-2
Advanced Programming
June 2003
Setting the Range for
Recorders
Figure 3-19 on page 3-32 for a menu map.
1. At the Recorder Settings Menu (see Table 3-1 on page 3-1), press
the SET menu key. The menu keys change to [RANGE], [MODE]
and [A
B].
2. Press the RANGE menu key. A list of the available output ranges
appears on the message line.
3. Move the brackets to the desired output range and press [YES].
4. With the arrow key, move the pointer to the Zero line for the
desired recorder. Press [YES] to erase the present value.
5. Enter a new value and press [YES].
6. Move the pointer to Span for the desired recorder and press [YES]
to erase the current value.
7. Enter a new value and press [YES].
8. Repeat steps 1 through 6 to set up the other recorder.
Repeat all of the above steps to set up recorders for the desired
channels.
To exit, press the DONE menu key until Main Menu appears in the
message line.
Advanced Programming
3-3
April 2004
Setting Up the Alarms
The Series 1 has two optional alarms for each channel. To select the
measurement mode, units and set point values for each alarm, press
the keys shown in Table 3-2. A screen appears similar to Figure 3-2
below. Figure 3-19 on page 3-32 for a menu map.
To test alarms, refer to Testing the Alarm Relays in Chapter 2,
Troubleshooting and Maintenance, of the Service Manual.
Table 3-2: Moving to Alarm Settings Menu
Press the Main Menu key:
To enter the:
SETTINGS*
Settings Menu
OUTPUTS
Output Settings Menu
ALARMS
Alarm Settings Menu
*The Settings Menu will prompt for a passcode (see page 2-6).
Ch
ALARM SETPOINT
Mode:
Trip:
Setpoint:
Deadband:
Status:
Alarm A
OFF
Above
+0.0000
+0.0000
Reset
Alarm Settings Menu
SET
CHANNEL
1
Alarm B
OFF
Above
+0.0000
+0.0000
Reset
TEST
DONE
Figure 3-2: Alarm Settings Menu
Note: The first time you enter this menu, all alarm relays are OFF.
When an alarm value is not entered, the alarm relay is OFF.
3-4
Advanced Programming
April 2004
Setting Up the Alarms
(cont.)
IMPORTANT: You should record this data on the Program
Information List supplied in Appendix A of the
Startup Guide, or on a separate sheet of paper, and
keep it in a safe place.
Selecting the
Measurement Mode,
Units and High/Low
Values for Alarms
Figure 3-19 on page 3-32 for a menu map.
1. At the Alarm Settings Menu (see Table 3-2 on page 3-4), press the
CHANNEL key to scroll to the channel for the alarm you want to
set, and then press SET.
2. Press the [A
B] menu key to select the desired alarm.
3. Press the MODE menu key. A list of modes appears on the
message line (see Table 2-6 on page 2-31).
4. Move the brackets to the desired mode and press the UNITS menu
key. A list of units appears on the message line.
5. Move the brackets to the desired units and press [YES].
6. Press the TRIP menu key. The pointer will move to the Trip line.
Use the pointer to select [Above] or [Below] and thus determine
whether the alarm is a High or Low alarm. Then press [YES] and
then the [DONE] key.
Entering the Setpoint
and Deadband Values
for Alarms
Figure 3-19 on page 3-32 for a menu map.
IMPORTANT: Select the measurement mode and units before you
enter the setpoints. The meter changes the format for
the allowable number of digits, depending on the
measurement units entered.
1. At the Alarm Settings Menu (see Table 3-2 on page 3-4), press the
CHANNEL key to scroll to the channel for the alarm you want to
set, and then press SET.
2. Press the [A
B] key to select the desired alarm.
Note: If you have entered the Measurement Mode and Units, you
may enter the setpoint at this step. The pointer moves
automatically from the Trip to the Setpoint line.
3. Move the pointer to Setpoint: and press [YES] to erase the existing
value.
Advanced Programming
3-5
June 2003
Entering the Setpoint
and Deadband Values
for Alarms (cont.)
4. Enter a new setpoint value, and press [YES] to confirm the new
value.
Note: If the alarm set point value is blank or invalid, the old value
will be restored.
The deadband allows users to set a programmable range of (normally
small) values beyond the setpoint, so that the Series 1 will not trigger
an alarm unless the measured value goes outside the deadband range.
On a High alarm, the alarm will trip if the measurement is greater
than or equal to the setpoint. It will not RESET until the measurement
is less than the setpoint minus the deadband. However, on a Low
alarm, the alarm will trip if the measurement is less than or equal to
the setpoint. It will not RESET until the measurement is greater than
the setpoint plus the deadband.
5. Move the pointer to the deadband line, and press [YES] to erase
the existing value.
6. Enter a new deadband value, and press [YES] to confirm the new
value.
To exit, press the DONE menu key until Main Menu appears on the
message line.
3-6
Advanced Programming
April 2004
Using Automatic
Calibration
The Series 1 automatically calibrates the moisture, pressure, and
oxygen measurement circuitry (Auto-Cal) at a user selected interval.
Auto-Cal compensates for any drift in the electronics. GE
Panametrics recommends setting the Auto-Cal interval to eight hours.
Set a smaller interval to Auto-Cal more frequently if the meter is
exposed to extreme temperatures or weather conditions.
Note: If you are using only Moisture Image Series Probes to
measure moisture, you do not have to Auto-Cal.
To set the Auto-Cal interval, press the keys shown in Table 3-3. The
screen appears similar to Figure 3-3 below. Refer to Figure 3-19 on
page 3-32 for a menu map.
Table 3-3: Entering the Reference Menu
Press the Main Menu key:
To enter the:
SETTINGS*
SERVICE
REFS
Settings Menu
System Service Menu
Reference Menu
* The Settings Menu will prompt for a passcode (see page 2-6).
MOISTURE REFERENCE TABLE
Ch
1
2
3
4
5
6
HIGH
LOW
AutoCal Interval: 96 minutes.
Reference Menu
HELP
INTERVAL
PROBE
DONE
Figure 3-3: Setting the Auto-Cal Interval
Advanced Programming
3-7
June 2003
Using Automatic
Calibration (cont.)
To set the Auto-Cal interval, do the following. (Figure 3-19 on page
3-32 for a menu map.)
Note: The Reference Menu has three tables: one each for moisture,
oxygen, and pressure references. You can use any one of these
Tables to set the Auto-Cal interval.
1. At the Reference Menu (see Table 3-3 on page 3-7), press the
INTERVAL menu key.
2. Using the numeric keys, enter an Auto-Cal interval between 0 and
24 hours and press [YES].
3. Press the DONE menu key. The meter begins Auto-Cal. Wait for
the Auto-Cal to complete and continue pressing the DONE menu
key until Main Menu appears on the message line.
The next time Auto-Cal occurs will depend on the length of the time
interval that was set. See the example below.
EXAMPLE:
The Series 1 establishes a fixed schedule, beginning at midnight,
using the interval specified to determine the times of subsequent
Auto-Cals. For example, if you enter a 1 hr., 30 min. time interval,
Auto-Cal will occur 16 times per day (1 day = 1440 minutes ÷ 90
minutes = 16). The fixed schedule will be as follows:
1. 1:30 a.m.
2. 3:00 a.m.
3. 4:30 a.m.
4. 6:00 a.m.
5. 7:30 a.m.
6. 9:00 a.m.
7. 10:30 a.m.
8. 12:00 p.m. (noon)
9. 1:30 p.m.
10. 3:00 p.m
11. 4:30 p.m.
12. 6:00 p.m.
13. 7:30 p.m.
14. 9:00 p.m.
15. 10:30 p.m.
16. 12:00 a.m. (midnight)
If you set the 1 hr., 30 min. Auto-Cal interval at 6:10 p.m., the next
Auto-Cal will occur at 7:30 p.m. (excluding the Auto-Cal performed
when first leaving the Reference Menu).
3-8
Advanced Programming
April 2004
Entering Constants
and User Functions
The Series 1 allows you to enter two types of constants, a user
constant and a saturation constant, as well as user-defined functions
and tables to manipulate data.
Note: Refer to the section Background Gas Current Multipliers for
the Delta F Oxygen Cell in Chapter 2 of the Service Manual to
enter a current multiplier for oxygen.
A user constant is a fixed value for moisture, temperature, or
pressure entered into the meter instead of using a “live” input. For
example, if the process runs at a steady pressure, you can enter the
constant pressure into the memory rather than using a pressure
transmitter. For special applications, you can also multiply the
moisture ppm value by a constant value (K × ppmv).
A reverse video “K”symbols appears in the top-right-hand corner of
the box (in matrix format) for channels that are using a user constant
value. A symbol does not appear in the graph format.
The other type of constant is a saturation constant. The Series 1
requires a saturation constant in order to calculate ppmw in nonaqueous liquids. If you do not know the saturation constant of the
liquid, contact GE Panametrics.
To extend programming capability, user functions allow operators to
program up to four desired mathematical equations on each channel.
Users can assign any recorder output or alarm relays to user functions
on any channel. In addition, they can use any parameter on any
channel to calculate a different parameter.
Enter user constants, saturation constants, and user-defined functions
and tables through the User Constant Menu. Use Table 3-4 below to
enter this menu. Figure 3-18 on page 3-31 for a menu map.
Table 3-4: Entering the User Constant Menu
Press the Main Menu key:
To enter the:
OPTIONS
USER
Option Menu
User Constant Menu
Use the appropriate section that follows to make entries.
Advanced Programming
3-9
April 2004
Entering User Constants
The User Constant Menu enables you to enter constants for moisture
(Kh), temperature (Kt), and pressure (Kp). In addition, you can
multiply the ppmv value by a specified constant for special purposes.
The default multiplier is 1.000.
Note: In order for the constant to work properly, you should make
sure you also configure that channel for a constant as
described on page 2-11.
Use the following steps to enter user constants. (Figure 3-18 on page
3-31 for a menu map.)
IMPORTANT: You should record this data on the Program
Information List supplied in Appendix A of the
Startup Guide, or on a separate sheet of paper, and
keep it in a safe place.
1. After entering the User Constant Menu (refer to Table 3-4 on
page 3-9), press the PAGE menu key until the User Constant Table
appears as shown in Figure 3-4 below.
2. Move the pointer to the desired channel and constant to enter and
press [YES] to erase the present value.
3. Enter the constant value and press [YES].
4. To enter user functions, user tables or saturation constants, press
[PAGE] to proceed to the following pages. To exit this menu, press
the DONE menu key until Main Menu appears in the message
line.
USER CONSTANT TABLE
Kh
Ch
1
2
3
4
5
6
Kt
°C
Kp
°C
K
Psig
X PPMv
User Constant Menu
HELP
---
PAGE
DONE
Figure 3-4: User Constant Menu
3-10
Advanced Programming
April 2004
Specifying User
Functions
User functions enable operators to program up to four desired
mathematical equations on each channel. They can also use any
parameter on any channel to calculate a different parameter. Use
Table 3-5 to enter this menu, and press the PAGE menu key until the
screen is similar to Figure 3-5 below.
Table 3-5: Entering the User Function Menu
Press the Main Menu key:
To enter the:
OPTIONS
Option Menu
USER
User Constant Menu
PAGE
User Function Menu
SPECIFY USER FUNCTION
Ch
1
Function: User 1
Decimal Places: 1
Units Symbol: TEST
Label:
TT
Equation:
log (DP°/C-15.3)
User Function Menu
HELP
CHANNEL
PAGE
DONE
Figure 3-5: User Function Menu
Selecting Initial
Parameters
1. Press the CHANNEL key to scroll to the desired channel, and the
PAGE key to scroll to the desired function (or blank page).
2. Move the pointer to the Function line. Press [YES] to remove the
function, type in a new entry, and press [YES] to confirm the
entry.
3. Move the pointer to the Decimal Places line. Press [YES] to erase
any current number, and enter the number of decimal places to the
right of the decimal point that you wish to appear. Press [YES] to
confirm the entry.
4. Move the pointer to the Units Symbol line. Press [YES] to remove
any entry, type in a new entry, and press [YES] to confirm the
entry.
5. Move the pointer to the Label line. Press [YES] to remove the
function. Type in a new entry, and press [YES] to confirm the
entry.
Advanced Programming
3-11
April 2004
Entering the Equation
1. Move the pointer to the Equation box. Press [YES] to enter the
function. The Math Entry Menu appears, as shown in Figure 3-6.
EQUATION ENTRY
)
inv
TblA
+
,
User 1 *
(
/
abs
^
exp
Ch
1
ln
log sqrt Mode
TblB TblC TblD TblE
Math Entry Menu
HELP
NEXT ROW
PREV ROW
DONE
Figure 3-6: Math Entry Menu
2. In the Math Entry Menu, use the NEXT ROW and PREV ROW
keys to scroll to the appropriate row. Then use the arrow key to
reach the desired symbol.
3. Once the key is on the symbol, press [YES] to enter the symbol
into the equation. Use the number keys to enter numeric values.
(Press [NO] to remove any mistaken or unwanted symbols or
numbers.)
4. To enter a particular measured parameter into the equation, click
on the MODE symbol at the right of the third row. A list of
parameters will appear. Scroll through the list until you reach the
desired parameter, and press [YES].
5. A list of units will then appear. Scroll through the list with the
arrow keys until you reach the desired units, and press [YES].
Note: If you wish to link a parameter from a particular channel, add
“(Ch#)” after you select the parameter. For example, “DP/
°C(2)” is the dewpoint in °C on channel 2.
6. Press the DONE key to confirm the equation. The meter will
return to the User Function Menu. However, if the user function
contains an error (for example, unbalanced parentheses or a
missing operator), the function will be labeled “INVALID.”
7. Press DONE to return to the Option Menu, or repeat the procedure
to enter functions for other channels or pages.
3-12
Advanced Programming
April 2004
Entering User-Defined
Tables
To support user-defined functions, the Series 1 can hold up to five
tables (designated as A through E) of non-linear or empirical data.
Users can enter up to 16 X-Y pairs in each table. The user functions
can supply an X value with Tbl(). The meter then interpolates the Y
value for a given X, and substitutes it for Tbl (X) in the function. (The
results are extrapolated if the X value exceeds the bounds of the
table.)
To enter the User Function Table Menu, first enter the User Function
Menu, and press the PAGE menu key until a screen similar to
Figure 3-7 appears. Press the TABLE menu key to scroll through the
five tables.
USER TABLE
ND:
##
X
00
01
02
03
04
05
Y
Table
Title:[No Title]
##
X
Y
06
07
08
09
10
11
A
User Function Table Menu
HELP
TABLE
PAGE
DONE
Figure 3-7: User Function Table Menu
1. The pointer starts at the ND (number of data points) line. Press
[YES]. Enter the number of data points desired, and press [YES]
to confirm the entry.
2. The pointer moves to the Title entry. Press [YES] and the Label
Entry Menu (shown in Chapter 2) appears.
Note: The title is for information purposes, and does not appear
anywhere else.
3. A flashing select pointer appears in the upper left corner of the
character set. Use the NEXT ROW and PREV ROW keys to move
the pointer to the desired row. Then use the arrow keys to move
the pointer to the desired character. The upper left corner of the
character set contains the space character.
4. The pointer moves to the first row for X and Y data points. Press
[YES] and enter the data points desired.
5. Press [YES] to confirm each entry and proceed to the next point.
6. Repeat steps 4 and 5 until you have entered all the data points.
Then press the [DONE] menu key to return to the Option menu.
Advanced Programming
3-13
April 2004
Entering Saturation
Constants
To enter a saturation constant, you must enter 1 to 6 data points to
represent a curve of Cs (saturation constant) versus temperature. Use
the following steps to enter a curve for each channel. Figure 3-18 on
page 3-31 for a menu map.
IMPORTANT: You should record this data on the Program
Information List supplied in Appendix A of the
Startup Guide, or on a separate sheet of paper, and
keep it in a safe place.
1. After entering the User Constant Menu (refer to Table 3-4 on
page 3-9), press the PAGE menu key until a screen similar to
Figure 3-8 appears.
SATURATION CONSTANT TABLE
Ch
Temp°C
#
1
Cs (ppmw)
1
2
3
4
5
6
Cs Constant Menu
HELP
CHANNEL
PAGE
DONE
Figure 3-8: Cs Constant Menu
2. Use the CHANNEL menu key to cycle to the desired channel.
3. Use the arrow keys to go to the first data point for temperature and
press [YES].
4. Enter the temperature for the first data point and press [YES].
Then press the pointer to move to Cs.
5. Press [YES] to erase the current value.
6. Enter the desired Cs value and press [YES].
7. Repeat steps 4 through 6 for all the data points and for each
channel using a saturation constant.
To exit the Cs Constant Menu, press the DONE menu key until Main
Menu appears on the message line.
3-14
Advanced Programming
April 2004
Using Computer
Enhanced Response
Enhanced Response uses a dynamic moisture calibration technique
to extrapolate the moisture level to the end point when making
measurements in abrupt “dry down” conditions. The system response
time depends on the relative change in dew point and the number of
channels. For a change from ambient moisture levels to trace levels,
the unit can respond in three to five minutes for single-channel
operation.
The accuracy of enhanced response is ±2°C of the reading the sensor
would have read if it were allowed to reach equilibrium with the gas.
To ensure that computer enhanced software is as accurate as possible,
your application should:
•
have a reasonably constant final dew point and flow rate.
•
have a minimum flow rate of one standard cubic foot per hour
(SCFH).
•
operate at atmospheric pressure (0 psig).
•
have an actual moisture content at or above a dew/frost point of
•
MIS Probe: -85°C
•
M Series or TF Series Probe: -110°C
To activate and use enhanced response, see Figure 3-18 on page 3-31
for a menu map and complete the following steps.
1. Allow the sensor to reach equilibrium at ambient moisture levels
before being exposed to the dry gas. Exposing the sensor to dew
points of 5 to 10°C for 5 to 10 minutes will enable the sensor to
reach equilibrium.
2. Use Table 3-6 below to activate the computer enhanced response.
Table 3-6: Activating the Enhanced Response Option
Press the Main Menu key:
To enter the:
OPTIONS
USER
Option Menu
User Constant Menu
3. If necessary, press the PAGE menu key until the Enhanced
Response Menu appears (see Figure 3-9 on page 3-16).
Advanced Programming
3-15
April 2004
Using Computer
Enhanced Response
(cont.)
ENHANCED RESPONSE TABLE
Ch
Enhanced
1
2
3
4
5
6
Enhanced Response Menu
HELP
ON/OFF
PAGE
DONE
Figure 3-9: Enhanced Response Menu
4. Use the arrow keys to scroll to the desired channel.
5. Press the ON/OFF menu key to turn enhanced response on (yes) or
off (no).
6. Repeat steps 4 and 5 for each desired channel.
7. To exit, press the DONE menu key until Main Menu appears on
the message line.
8. Expose the sensor to dry gas.
IMPORTANT: You must enable enhanced response before you
expose the sensor to the dry gas. The meter must see
all of the dry down in order to make accurate
calculations.
When activating enhanced response for a channel, a reverse video
“E” symbol appears in the top-right-hand corner of the corresponding
box when displaying data in the matrix format. When the meter
determines the final value, the reverse video “E” changes to a regular
“E”. The “E” symbol does not appear in the graph format.
3-16
Advanced Programming
June 2003
Setting Up the Data
Logger
The Series 1 has a data logging feature that enables you to internally
store and view data. Users can log up to 12 parameters on each of six
channels, and update the data at intervals as fast as 5 sec.
A 64-kbyte RAM holds logged data; users can also add an optional
PCMCIA card to store up to 1 Mbyte of data. The meter has a fixed
amount of memory; therefore, the number of parameters you select
and the more frequent the time interval, the shorter the log time. Once
you specify the log parameters, the meter displays a status screen that
lists the number of records, bytes free, bytes used, and the remaining
hours and minutes the log will run before the programmed End Time
(see Figure 3-10).
The meter assigns logged data a record and a header. The record
consists of the date, time, and corresponding logged values. The
header consists of the selected channels, the selected measurement
modes, and the time the log started. It is used to distinguish one log
from another.
The Series 1 can store logs in six slots. Thus, if you wish to create a
new log when all six slots are filled, you must remove one of the
existing logs.
DATA LOGGING STATUS
Storage: Extra
Bytes Used: 117012
FILENAME
MON.LOG
TUES.LOG
(New Log)
(New Log)
(New Log)
(New Log)
STATUS
Finished
Running
Data Logger Menu
HELP
Bytes Free: 137920
STORAGE
TIME REMAINING
00000:00:00
00018:27:27
15:16
06/15/99
FILE
DONE
Figure 3-10: Data Logger Menu
Use the following sub-section to view the data logger status, set up a
log, and view logged data.
Advanced Programming
3-17
April 2004
Viewing the Data Logger
Status
Press the keys as shown in Table 3-7. The screen appears similar to
Figure 3-7 below. Figure 3-18 on page 3-31 for a menu map. Log
statuses include running, stopped, pending (waiting to start) or
finished. The screen also displays whether internal or extra (PCMCIA
card) memory is in use, as well as the amount of memory available.
Table 3-7: Entering the Data Logger Menu
Press the Main Menu key:
To enter the:
OPTIONS
Option Menu
LOGGER
Data Logger Menu
TUES.LOG
TIME
12:15:22
12:15:32
12:15:42
12:15:52
12:16:02
VIEWING
1:User 1
-4.8
-4.7
-4.8
-4.6
-4.7
Data Logger Menu
HELP
NEXT
1:DP/°C
+15.3
+15.3
+15.3
+15.3
+15.3
15:16
06/15/00
1:FH
163.590
163.600
163.610
163.600
163.620
06/15/99
PREV
DONE
Figure 3-11: The Data Logger Menu
Viewing Logged Data
To view a specific file from the Data Logger Menu, move the pointer
to that file, and then press [YES]. The screen appears similar to
Figure 3-11 above. Figure 3-18 on page 3-31 for a menu map.
Use the PREV and NEXT menu keys to view the next and previous
pages of logged data. To view other records, continue to press the
NEXT menu key until <end> appears at the end of the record. If the
screen has more than three columns, use the pointer to scroll across
the columns.
To exit, press the DONE menu key until Main Menu appears on the
message line.
Removing Logged Data
To remove a log, select it with the arrow keys on the Data Logger
Menu. Press the [FILE] menu key, and then [REMOVE]. The screen
will ask “Are you sure?” Confirm the deletion by pressing [YES].
IMPORTANT: Deleted logs cannot be retrieved!
3-18
Advanced Programming
April 2004
Entering Data Logger
Settings
Use the steps below to select the channels, measurement modes and
units you want to log, as well as the log interval and whether the log is
cyclic or has a definite start and end.
Note: If all six logs are filled, a log must be deleted to create room
for another.
Naming the Log and
Setting Up Start/End
Times or Cycles
Figure 3-18 on page 3-31 for a menu map.
1. At the Data Logger Menu (see Table 3-7 on page 3-18), select a
“New Log” file and press [YES] to enter the Label Entry Menu
shown in Figure 3-12 below.
( ) - 0 1 2 3 4 5 6 7 8 9 A B C
D E F G H I J K L M N O P Q R S
T U V W X Y Z [ ] _ { }
Label Entry:
HELP
NEXT ROW
PREV ROW
DONE
Figure 3-12: Label Entry Menu
2. Specify the log name. Use the NEXT ROW and PREV ROW
menu keys to scroll to the desired line, and then use the arrow keys
to reach the desired letters, numbers or symbols. When you have
completed the label, press the DONE menu key. The Set Data
Logger Menu now appears, as shown in Figure 3-13 below.
DATA LOGGING SETUP
Cyclic: N
Error Log: N
Start: 06/03/2000
End: 06/03/2000
Interval: 00:00
Ch:Mode
Ch:Mode
:
:
:
:
:
:
Set Data Logger Menu
HELP
START
15:28:56
18:00:00
Status: Finished
Ch:Mode
Ch:Mode
:
:
:
:
:
:
15:16
06/15/00
MODE
DONE
Figure 3-13: Set Data Logger Menu
Advanced Programming
3-19
April 2004
Naming the Log and
Setting Up Start/End
Times or Cycles (cont.)
3. Move the pointer to the CYCLIC row. You can program a log as
cyclic (running continuously, with the newest data overwriting the
oldest after a certain number of records) or with a definite start and
end. Press [YES] to program the log as cyclic, or [NO] to start and
end the log at specified times.
4. The pointer moves to the Error Log row. Press [YES] to have the
log record only errors, or [NO] to proceed to the Start/End times.
The program now varies, depending on your selection in step 3.
•
If you pressed [NO], continue with step 5.
•
If you pressed [YES], go to “Entering Settings for a Cyclic
Log” below.
5. To specify the start and end times, type in the dates using a
Month/Day/Year (MM:DD:YYYY) numeric format (for example,
12/29/1999) and the times in a 24-hour, minute and second
(HH:MM:SS) format (for example, 15:33:00). Press [YES] when
you have completed entering the data for each time.
6. The pointer then moves to the Interval row. Specify the log
interval in minutes and seconds. (The interval can be as short as
5 sec.) Skip steps 7 through 9, and proceed to “Selecting the
Channel, Measurement Mode and Units” on the next page.
Entering Settings for a
Cyclic Log
The screen now appears similar to Figure 3-14 below.
DATA LOGGING SETUP
Cyclic: Y
Error Log: N
Start: 06/03/2003
Records: 0
Interval: 00.00
Time (ddd:hh:mm:ss)
Ch:Mode
Ch:Mode
:
:
:
:
:
:
Set Data Logger Menu
HELP
START
15:28:56
Status: Stopped
000:00:00:00
Ch:Mode
Ch:Mode
:
:
:
:
:
:
15:16
MODE
06/03/03
DONE
Figure 3-14: Set Data Logger Menu for a Cyclic Log
7. To specify the start time, type in the date using a Month/Day/Year
(MM:DD:YYYY) numeric format (for example, 12/29/1999) and
the time in a 24-hour, minute and second (HH:MM:SS) format
(for example, 15:33:00). Press [YES] when you have completed
entering the data.
8. The pointer moves to the Records row. Specify the number of
records you wish for the log.
3-20
Advanced Programming
June 2003
Entering Settings for a
Cyclic Log (cont.)
9. The pointer then moves to the Interval row. Specify the log
interval in minutes and seconds. (The interval can be as short as 5
sec., or up to 99 min. and 59 sec.)
10.At the Time row, enter the interval duration set — the amount of
time in days, hours, minutes and seconds to complete one
measurement cycle. Then proceed to “Selecting the Channel,
Measurement Mode and Units” below.
Note: If a conflict exists between the Time and the interval time, the
total Time overrules the selected interval time. To set the total
Time with only the record and interval settings, set the Time to
all zeroes for days, hours, minutes and seconds
(000:00:00:00). If dividing the total Time by the number of
records does not result in uniform intervals, the Series 1 uses
the largest interval that will fit within the total Time, and
recalculates the total Time as the largest fitting interval times
the number of records.
Selecting the Channel,
Measurement Mode and
Units
1. The entry for each log channel and mode appears as ___:____ if
blank. Use the arrow keys to move to the entry to change or enter
data. Press [NO] to erase a previous entry.
2. Press numeric keys 1 to 6 to select the desired channel.
3. Press the MODE menu key. A list of measurement modes appears
on the message line (see Table 2-6 on page 2-31).
Note: Notice the MODE menu key changes to UNIT. This menu key
switches back and forth depending on the parameters you are
selecting.
4. Move the brackets to the desired measurement mode.
5. Press the UNITS key. A list of units appears on the message line.
6. Select the desired units and press [YES].
Repeat steps 1 to 6 until you have selected the desired parameters.
Press the [START] menu key to activate the log. Then press the
[DONE] menu key to return to the Data Logger Menu. If you wish to
check the parameters for a given log, press the [FILE] menu key in
the Data Logger Menu (Figure 3-10 on page 3-17) and then press the
[SETTINGS] menu key.
IMPORTANT: You cannot change the log parameters once the log
has started!
Advanced Programming
3-21
April 2004
Setting Up the RS232
Communications Port
The Series 1 can transmit measurements to a serial printer or personal
computer using the RS232 communications port. Before you can
transmit data, you must configure the serial port settings as described
in this section. This section also includes a sample output and a brief
description of its contents.
Configuring the Serial
Port
To enter settings for the serial port, press the keys shown in
Table 3-8. (Figure 3-19 on page 3-32 for a menu map.) A screen
appears similar to Figure 3-15 below.
Table 3-8: Entering the Port Settings Menu
Press the Main Menu key:
To enter the:
SETTINGS*
Settings Menu
OUTPUTS
Output Settings Menu
PORT
Port Settings Menu
*The Settings Menu will prompt for a passcode (see page 2-6).
CONFIGURE SERIAL PORT
Port Function: PanaLink
Baud Rate: 19200
Node ID: 16
Port Settings Menu
FUNCTION
BAUD
NODE ID
DONE
Figure 3-15: Port Settings Menu
Use the steps that follow to select the function, baud rate, report
format and interval for the serial port. Other serial port settings are set
and cannot be changed. The fixed settings are as follows:
3-22
•
8 bit word length
•
no parity
•
1 stop bit
•
flow control is not supported
Advanced Programming
April 2004
Selecting the Function,
Baud Rate and Node ID
or Matrix Interval
Figure 3-19 on page 3-32 for a menu map.
1. From the Port Settings Menu (see Table 3-8 on page 3-22), press
the FUNCTION menu key to scroll through the available port
functions (for example, a printer or PanaLink software), and stop
at the desired function.
Note: The third menu key alternates between NODE ID for the
PanaLink function and INTERVAL for the printer function.
2. Press the BAUD menu key.
3. Move the brackets to the desired baud rate and press [YES].
We recommend that you do not set the baud rate below 2400. At
lower speeds, several seconds are required to transmit data.
Note: If you are using GE Panametrics PanaLink software, set the
baud rate to 19,200.
4. The next step will depend upon the function selected in Step 1.
a. If you selected PanaLink as the function, press the NODE ID
menu key. Unless you are instructed to change the ID number
by GE Panametrics, please leave the number at the default ID
of 16. Press [YES] to confirm the entry.
b. If you selected a printer as the function, press the INTERVAL
menu key and enter, in minutes and seconds, the interval at
which you wish the meter to transmit matrix report data. Press
[YES] to confirm the entry.
5. Press the DONE menu key to return to the Output Settings Menu.
You have completed setting up the communications port. If you
selected the printer function, the meter will begin transmitting data at
the selected interval. Refer to the following section for a description
of a sample output.
Advanced Programming
3-23
June 2003
Description of a Sample
Output
Figure 3-16 below shows what a record would look like for the matrix
format shown in Figure 3-8 on page 3-14. Each record consists of a
Message ID, date, time, channel, mode/unit, data and a carriage
return.
Channel
Message ID
Mode/Unit
Data
Date
Time
*D 01/22/00 11:50:07 1:DP/C=18.0 2:T/C=+35.9 3:H/ppMV=0.535
4:O/ppB = 48.3 5:PSIg/27.10 <CR/LF>
Carriage
Return
Figure 3-16: A Sample of One Record
Note: The length of the line depends on how many characters your
screen or printer has per line, or the width of the page.
Message ID
Every record begins with the Message ID that consists of an asterisk
(*) and the report type. *D denotes a Display (Matrix) report. The
Message ID is always followed by one ASCII space.
Date
The date of the report is shown in MM/DD/YY format. The Series 1
uses a zero as a column place holder, so the date will always be eight
characters long. The date is always followed by one ASCII space.
Time
The time of the report is shown in HH:MM:SS format. Time is in 24hour format. The Series 1 uses a zero as a column place holder, so the
time will always be eight characters long. The time is always
followed by one ASCII space.
Channel
The channel is a single digit from 1 to 6 and is the channel from
which the displayed measurement was read. The channel is always
followed by a colon (:).
Mode/Unit
The modes or units are represented by an abbreviation. Refer to
Table 3-9 on page 3-26 for abbreviations. The Mode/Unit is always
followed by an equals sign (=).
3-24
Advanced Programming
June 2003
Description of a Sample
Output (cont.)
Data
Data is the actual measurement. The number of digits and the position
of the decimal point, if any, will vary with the magnitude and type of
data (see Table 3-9 on page 3-26 for number formats for each mode/
units). Signed values will contain a leading plus (+) or minus (-) sign.
Unsigned values (percent oxygen, for example) have no sign. The
data is always followed by two ASCII spaces.
<CR/LF>
Every record is terminated with a carriage return/line feed pair
(ASCII 13 and 10 decimal, 0D and 0A hexadecimal).
Advanced Programming
3-25
June 2003
Table 3-9: Print-Out Symbols and Abbreviations
Number
Mode/Unit
Format
Measurement Mode
Oxygen
O%
XXX.X
Oxygen concentration in percent.
O/ppM
XXXX.XX
Oxygen concentration in parts per million.
O/ppB
XXXXX
Oxygen concentration in parts per billion.
O/A
±XXX.XXX
Oxygen cell current in microamperes.
O/DVM
±X.XXXX
Oxygen circuit voltage in volts DC.
DP/C
±XXX.X
Dew point in degrees Celsius.
DP/F
±XXX.X
Dew point in degrees Fahrenheit.
DP/K
±XXX.X
Dew point in Kelvin.
%R.H.
XXX.X
Relative humidity in percent.
H/ppMv
XXX.XXX
Parts per million of water by volume.
H/ppBv
XXXXX.X
Parts per billion of water by volume.
H/ppMw
XXX.XXX
Parts per million of water by weight.
MCF/IG
X.XXXX
Pounds of water per million standard cubic feet of
an ideal gas.
MCF/NG
X.XXXX
Pounds of water per million standard cubic feet of
natural gas.
ppMv/NG
XXX.XXX
Parts per million of water by volume in
natural gas.
MH
X.XXXX
GE Panametrics moisture calibration unit for M
and TF Series probes.
FH
X.XXXX
GE Panametrics moisture calibration unit for
Moisture Image Series probes.
H/DVM
±X.XXXX
Moisture circuit voltage in volts DC.
T/C
±XXX.X
Temperature in degrees Celsius.
T/F
±XXX.X
Temperature in degrees Fahrenheit.
T/K
±XXX.X
Temperature in Kelvin.
T/DVM
±X.XXXX
Temperature circuit voltage in volts DC.
PSIg
±X.XXX
Pressure in pounds per square inch gauge.
Bars
X.XXXX
Pressure in bars absolute.
mbs
XXXX.X
Pressure in millibars.
mm/Hg
XXX.XXX
Pressure in millimeters of mercury absolute.
Pas
XXXXX
Pressure in Pascals absolute.
Moisture
Temperature
Pressure
3-26
Advanced Programming
June 2003
Table 3-9: Print-Out Symbols and Abbreviations (cont.)
Number
Mode/Unit
Format
Measurement Mode
Pressure (Continued)
kPas
XXX.XX
Pressure in kiloPascals absolute.
P/mV
±XXX.XX
Pressure transducer output in millivolts.
FP
XXXX.XX
GE Panametrics pressure calibration unit in
millivolts.
P/DVM
X.XXXX
Pressure circuit voltage in volts DC.
Aux1/V
±X.XXXX
Auxiliary input #1 in volts.
Aux1/I
±XX.XXX
Auxiliary input #1 in milliamperes.
Aux1/F
±XX.XXXX
Auxiliary input #1 in user-defined units.
Aux2/V
±X.XXXX
Auxiliary input #2 in volts.
Aux2/I
±XX.XXX
Auxiliary input #2 in milliamperes.
Aux/F
±XX.XXXX
Auxiliary input #2 in user-defined units.
Vref
±X.XXXX
Channel card reference voltage.
Vgnd
±X.XXXX
Channel card ground voltage.
Auxiliary Inputs
Other
Note: In the formats presented above, the plus/minus (±) symbol
indicates that the data is signed and will be preceded by a plus
(+) or minus (-) sign.
The number of decimal places indicated is for nominal values.
The instrument will maintain the number of digits by
“floating” the decimal point to the right as the magnitude of
the number increases. DO NOT “hard-code” the decimal
points when using data acquisition software.
Advanced Programming
3-27
January 2004
Setting Error
Processing
The Series 1 user program includes an Error Processing menu that
may be used to specify how the recorders/analog outputs and the
alarms respond to Range, Signal and Calibration errors.
The meter categorizes range errors as Under Range if the input
signal goes below the probe calibration range or Over Range if the
input signal goes above the probe calibration range. However, signal
errors are always categorized as Over Range, while calibration
errors are always categorized as Under Range.
Note: See Chapter 2 in the Service Manual for a detailed description
of Range, Signal and Calibration Errors.
When an error condition occurs, the meter displays an error message
on the screen and it drives the recorders/analog outputs and alarm
relays as indicated in Table 3-10 below.
Table 3-10: Error Indicators
Screen Error
Output & Alarm
Error Type
Message
Relay Response
Over Range
Over Range Setting**
Under Range
Under Range Setting**
Signal Error
“Mode” Fault!*
Over Range Setting**
Calibration Error
Cal Error
Under Range Setting**
Range Error
* “Mode” indicates one of the available measurement modes
** currently programmed error processing setting (see next section)
IMPORTANT: The factory default setting for Error Messaging is
ON, but the factory default settings for both Under
Range and Over Range errors is Ignore (this forces
the recorder/analog outputs to 0 mA or 0V).
Procedure for Setting
Error Processing
The Series 1 user program allows you to turn Error Messaging either
ON or OFF. In addition, if Error Messaging is ON, you can program
separate Over Range and Under Range responses for all alarm relays
(if installed) and recorder/analog outputs. The error responses are
independently programmable for each channel.
Table 3-11 on the next page provides instructions for entering the
Error Processing Menu, and Figure 3-17 on the next page shows a
typical menu screen. To suppress or activate the Display Messages
function, move the pointer to the Display Messages line and use the
ACTION menu key to select ON (the default) or OFF.
If Display Messages is set to ON , use the steps on the next page to set
up error processing:
3-28
Advanced Programming
January 2004
Procedure for Setting
Error Processing (cont.)
Table 3-11: Entering the Error Processing Menu
Press the Main Menu key:
To enter the:
SETTINGS*
Settings Menu
SYSTEM
System Settings Menu
CONFIG
Probe Configuration Menu
ERRORS
Error Processing Menu
* The Settings Menu will prompt for a passcode (see page 2-6).
1. Press the keys shown in Table 3-11 above, and a screen similar to
that in Figure 3-17 below appears (see Figure 3-19 on page 3-32
for a complete menu map of the procedure).
ERROR PROCESSING CONFIGURATION
Error:
Alarm A:
Alarm B:
Rcrd A:
Rcrd B:
Under Range
Ignore
TRIP
Ignore
LOW
1
Ch
Over Range
TRIP
Ignore
Ignore
HIGH
Display Messages: ON
Error Processing Menu
HELP
CHANNEL
ACTION
DONE
Figure 3-17: Error Processing Menu
2. Use the CHANNEL menu key to cycle to the desired channel.
3. Move the pointer to the desired range and output.
4. Press the ACTION menu key repeatedly until the desired action
appears (the default setting for all actions is Ignore):
•
Alarms: The available actions are Trip and Ignore. For the
Ignore option, the alarms remain in the state they were in at the
time a range error occurs.
•
Recorders/Analog Outputs: The available actions are: Ignore,
High, Low, Hold (last value), and Value (specified by user). For
the Ignore option, both the A and B analog output signals are
forced to 0 mA or 0 V when a range error occurs.
5. Repeat Steps 2-4 for both ranges and for each output on the
desired channel(s).
To exit Error Processing, press the DONE menu key until Main Menu
appears on the message line.
Advanced Programming
3-29
April 2004
Loading New Software
At some point, a new version of the MIS-1 operating software may be
released or your existing software file may become corrupted. To
update your own system, use the following guidelines:
1. Record all of the setup, configuration, calibration and reference
information from the MIS-1, and transfer required logs to a PC.
IMPORTANT: All of the settings will be lost when the code is
updated. Any logs will also be erased.
2. Obtain the new software file (with a *.cod extension) and save the
file to your PC hard drive.
3. Set up the MIS-1 with an RS232 cable connected to a COM port
(most likely COM1) on a PC having a communications program
like Hyperterminal. (See Setting Up the RS232 Communications
Port in Chapter 3 of this manual, and Connecting a PC or Printer
in Chapter 1 of the Service Manual.)
4. Start the communications program on the PC and select the COM
port with the connection to the MIS-1.
5. Set the following information:
Baud Rate = 19200
Data Bits =
8
Parity =
none
Stop Bits =
1
Flow Control = none.
6. Turn on the power to the MIS-1.
7. Press and hold the 0 key.
Note: The display will indicate a message similar to Reload Flash
via RS232 (Y/N)?
8. Press the YES key.
9. Choose the Transfer file menu and select Send File.
10. Select the XMODEM transfer protocol.
11. Select the file to send: the file that was saved to the PC hard drive.
The meter will reboot and load the new software.
Note: Once the software is loaded into the MIS-1, it will be
necessary to reprogram the configuration data, references,
recorders, alarms, logs, etc (see the previous sections in this
manual).
After the reprogramming is complete, the MIS-1 is ready for
operation.
3-30
Advanced Programming
June 2003
Main Menu
ABOUT
HELP
SELECT
SETTINGS
OPTIONS
MIS-1 Help System
Display Select Menu
Settings Menu
(See Figure 3-18)
Option Menu
NEXT
PREV
DONE
HELP
MODE
PAGE
DONE
SCREEN
LOGGER
USER
DONE
Display Page #
User Constant Menu
UNITS
PLACE
or
(key toggles)
TABLE
or
HELP
DONE
PAGE
DONE
CHANNEL
or
MODE
ON/OFF
Data Logger Menu
HELP
STORAGE
SETTINGS
FILE
REMOVE
Set Data Logger Menu
HELP
If you are displaying data in
Matrix Format
or
Line Graph
Graph Screen Menu
Matrix Screen Menu
GRAPHS CYCLE
CONTRAST
DONE
MATRIX
SCALE
CONTRAST
DECR
INCR
MODE
DONE
DONE
DONE
Contrast Adjust Menu
Contrast Adjust Menu
HELP
START
or
STOP
VIEW
DONE
Figure 3-18: Help, Select and Options Menu
Scrolling Mode Selection
HELP
HELP
DONE
DECR
INCR
DONE
Graph Scale Menu
HELP
Advanced Programming
X AXIS
Y AXIS
DONE
3-31
June 2003
Main Menu
HELP
SELECT
SETTINGS
OPTIONS
Help System
(See Figure 3-17)
Display Select Menu
(See Figure 3-17)
Settings Menu
Option Menu
(See Figure 3-17)
OUTPUTS
SYSTEM
Output Settings Menu
ALARMS
RECORDER
PORT
HELP
DONE
CONFIG
CALIB
DONE
SERVICE
System Settings Menu
System Service Menu
HELP
DONE
REFS
CLOCK
DONE
Reference Menu
System Calibration Menu
BAUD
INTERVAL
DONE
HELP
CHANNEL
PROBE
HELP
(printer)
or
NODE ID
(PanaLink)
Alarm Setting Menu
SET
CHANNEL
TRIP
MODE
TEST
Probe Configuration Menu
HELP
DONE
TAG
ERRORS
DONE
Error Processing Menu
A
B
DONE
HELP
Label Entry Menu
HELP
Recorder Settings Menu
SET
CHANNEL
TEST
Set Recorder:
MODE
RANGE
A
NEXT ROW
INTERVAL
PROBE
DONE
DONE
PREV ROW
CHANNEL
ACTION
DONE
Figure 3-19: Settings Menu
Port Settings Menu
FUNCTION
DONE
DONE
Recorder Test Menu
B
DONE
HELP
TRIM
----
DONE
Recorder Trim Menu
ZRO/SPAN
Advanced Programming
TRIM UP
TRIM DN
DONE
3-32
Chapter 4
Programming with PanaView
Introduction . . . . . . . . . . . . . . . . . . . . . . . . . . . . . . . . . . . . . . . . . . . 4-1
Changing Measurement Modes and Units . . . . . . . . . . . . . . . . . . . 4-1
Changing a Matrix Display to a Graph . . . . . . . . . . . . . . . . . . . . . . 4-6
Changing Alarm Settings . . . . . . . . . . . . . . . . . . . . . . . . . . . . . . . .4-7
Changing Recorder Settings. . . . . . . . . . . . . . . . . . . . . . . . . . . . . . 4-9
Programming User Functions. . . . . . . . . . . . . . . . . . . . . . . . . . . . 4-12
Entering User Tables . . . . . . . . . . . . . . . . . . . . . . . . . . . . . . . . . . . 4-14
Entering Saturation Constants . . . . . . . . . . . . . . . . . . . . . . . . . . . 4-15
April 2004
Introduction
The optional PanaView software package enables you to remotely
change the programming of the Series 1. In addition to displaying
meter measurements on your PC, you can vary the modes and display
units on individual pages and channels, and add, change or delete user
equations and user tables. For a complete explanation of PanaView’s
capabilities, see the PanaView User’s Manual.
IMPORTANT: Before attempting to display or change programming
via the PC, be sure to install PanaView as described
in Chapter 1 of the PanaView User’s Manual.
Changing
Measurement Modes
and Units
Programming with PanaView
PanaView enables you to actually change the measurements on the
matrix display. For example, through the PC, you can switch a
window on page 2 from its original programming of measuring
oxygen in parts-per-million on Channel 2 to new programming of
measuring pressure at psig on Channel 3 — or leave the window
entirely blank.
4-1
April 2004
Open the Meter Display
Window
1. From the “File” menu, click on the “New Meter Browser” option.
2. From the network tree, click on the desired communications port
(COM 1, etc.) and meter.
3. From the expanded tree, click on the “Display” option. A list of
six display pages appears. Clicking on any page opens the list of
channels, modes (temperature, hygrometry, oxygen, etc.) and
display units currently assigned for that page.
4. Double-clicking on any page opens the “Meter Display” window,
shown in Figure 4-1 on page 4-3. Each individual blue window
shows the mode and unit measured in the corresponding window
on the Series 1 page, with the assigned channel number in the
upper left corner. A line below indicates which page the meter is
currently displaying.
5. To scroll to a particular page, click on the left or right pointer
buttons at the bottom of the window.
6. If you want to set a particular page as the page currently displayed
on the meter, scroll to that page and click on [Set Active Page].
Note: While each window shows the sensor and units measured, you
must click on the “Text Display” option from the “Output”
menu, or view the Series 1 screen, to see the actual
measurements at any given time.
4-2
Programming with PanaView
April 2004
Open the Meter Display
Window (cont.)
Figure 4-1: The Meter Display Window
Programming with PanaView
4-3
April 2004
Change Meter
Programming
1. To change a particular window, click on it. The selected window
turns red.
2. Click on the desired meter on the network tree to the left of the
programming window. A list of available channels appears. Click
on the channel you wish to apply.
3. The tree expands to show a list of available sensors.
a. Click on the desired sensor, and the tree expands further to
show a list of available units.
b. Double-click on the unit, and the Series 1 reassigns the selected
box, on the Series 1 and in the “Meter Display” window.
c. To unassign a mode and unit without assigning a different
sensor, click on the desired window and then on [Unassign].
Figure 4-2 on page 4-5 shows a typical change on the PC screen from
O2/ppm (shown in Figure 4-1 on page 4-3) to PSIg.
Note: For an explanation of unit abbreviations, see Table 2-6 on
page 2-31, “Measurement Modes and Units for the Series 1.”
4. Click [Apply] to apply the change immediately and continue
programming, and [OK] to confirm the change and close the
window.
Note: To return the window to its previous settings, click on the
[Cancel] button instead of the [OK] button.
4-4
Programming with PanaView
April 2004
Change Meter
Programming (cont.)
Figure 4-2: Matrix Display After Programming
Programming with PanaView
4-5
April 2004
Changing a Matrix
Display to a Graph
To set a graph display of a single mode and unit:
1. Click on the [Graph Display] button. The window changes to list
the graph parameters.
2. Click on the meter icon to show lists of the available modes and
units.
3. Double-click on the desired unit, and enter the parameters for the
graph, as shown in Figure 4-3 below.
4. Click on [Apply] to change the graph, and on [OK] to confirm the
change and close the window.
5. Click on the [Set Active Display] button to prompt the Series 1
screen to display the graph.
To toggle between the matrix display and the graph, click on the
[Matrix Display] or [Graph Display] buttons. The window returns to
the display indicated.
Figure 4-3: Graph Programming Window
4-6
Programming with PanaView
April 2004
Changing Alarm
Settings
PanaView enables you to set or change alarm settings for the Series 1.
You can determine which sensor and unit serve as the alarm, the trip
and deadband values, and the alarm’s reaction to errors.
1. From the “New Meter Browser” option, pull down the desired
meter, and click on the desired channel.
2. From the channel menu, click on the “Alarms” option, and then on
“Alarm A” or “Alarm B.” The Alarm window appears, as shown in
Figure 4-4 below.
3. To set the alarm sensor and unit
a. Pull down the “Sensor” list box in the lower part of the
window.
b. Then click on the desired sensor type.
c. A list of units appears. Click on the desired unit.
Figure 4-4: Alarm Programming Window
Programming with PanaView
4-7
April 2004
Changing Alarm
Settings (cont.)
4. To set the alarm type, click on the [Trip Above] or [Trip Below]
radio buttons, as desired.
5. To determine the alarm values, enter the Trip and Deadband
values in the designated text boxes. (For a definition of the
Deadband value, see Setting Up the Alarms on page 3-4.)
6. To determine how the alarm will react when it encounters an error:
a. Pull down the “High” list box under the “On Error” line.
b. Then click on the desired option from the listing: “Ignore
error,” “Trip on error,” “Reset on error,” or “Hold on last
error.”
c. Repeat the procedure for the “Low” list box.
7. To test the alarm, click on the [Test] button. Click on the [Trip]
button to trip the alarm, and on the [Reset] button to reset it.
8. Click on [Apply] to immediately apply the changes, and on [OK] to
confirm the changes and close the window. (To return the window
to its previous settings, click on the [Cancel] button.)
4-8
Programming with PanaView
April 2004
Changing Recorder
Settings
You can also change the settings of a recorder attached to the Series
1: the input type, zero and span values, and how it performs error
handling.
Setting Recorder Values
1. From the “New Meter Browser” option, click on the desired meter
and channel.
2. From the channel menu, click on the “Recorders” option, and then
on “Recorder A” or “Recorder B.” The Recorder Properties
window appears, as shown in Figure 4-5 below.
3. To set the recorder type, pull down the “Type” list box and click
on one of the three choices: 0 to 20 mA, 4 to 20 mA and 0 to 2 V.
4. To set the recorder unit, pull down the “Sensor/Class” list box and
click on the desired sensor. Then pull down the “Unit” list box
and select from the available units.
5. To establish the input settings, enter the desired values in the
“Zero” and “Span” text boxes.
6. Click on [Apply] to apply the changes immediately, and on [OK] to
confirm the changes and close the window. To return the window
to its previous settings, click on the [Cancel] button.
Figure 4-5: Recorder Programming Window
Programming with PanaView
4-9
April 2004
Testing Recorder
Outputs
1. To test the recorder outputs, click on the [Test] button in the
“Recorder Properties” window (see Figure 4-5 on page 4-9). A
message appears: “This will suspend Recorder #[X] on Channel
[X]. Are you sure you want to test this recorder?” Click on [OK] to
continue.
2. The “Test Recorder” window appears, as shown in Figure 4-6
below. At the top, slide the pointer to the desired percentage of the
full scale recorder range, and click on [OK].
3. To trim the recorder outputs, scroll the arrows to the right of the
“Zero” and “Span” windows up or down until you reach the
desired values, and click on [OK].
Note: For a complete discussion of testing and trimming recorder
outputs, refer to the sections Testing the Recorder Outputs
and Trimming Recorder Outputs in Chapter 2 of the Service
Manual.
The screen returns to the “Recorder Properties” window.
Figure 4-6: Recorder Test Window
4-10
Programming with PanaView
April 2004
Programming Error
Handling
1. To program the Series 1 for error handling, click on the “Errors”
tab. The screen appears similar to Figure 4-7 below.
2. Enter the desired values for the low and high error settings in the
appropriate text boxes.
3. To program the meter’s response to errors, pull down the “On Low
Error” list box, and click on one of five options:
•
Ignore error
•
Go to high limit
•
Go to low limit
•
Hold last value
•
Go to error value.
4. Repeat this selection with the “On High Error” list box.
5. Click on [Apply] to apply the changes immediately, and on [OK] to
confirm the changes and close the window. To return the window
to its previous settings, click on the [Cancel] button.
Figure 4-7: Recorder Properties Window - Error Handling
Programming with PanaView
4-11
April 2004
Programming User
Functions
As explained in Entering Constants and User Functions on page 3-9,
user functions enable operators to program up to four desired
equations on each channel, or to use any measured parameter to
calculate a different parameter. PanaView allows users to program or
change user functions and related tables through the PC.
To program a user function:
1. From the “New Meter Browser” option, click on the desired
communications port, meter, and channel.
2. Click on “User Functions,” and then double-click on the desired
function (1 to 4). The right side of the screen appears similar to
Figure 4-8 below.
3. Enter three parameters:
•
a function label (of no more than 16 characters)
•
a function symbol (no more than 4 characters), and
•
the number of decimal places desired.
4. To incorporate an existing parameter, pull down the network
menu and click on the desired channel, sensor and display unit.
Figure 4-8: The User Function Window
4-12
Programming with PanaView
April 2004
Programming User
Functions (cont.)
5. To select the desired operation or table, click on the appropriate
button. (See Entering User-Defined Tables on page 3-13 for
information on entering data for user tables.) Use the cursor in the
equation box to position values correctly, or to erase incorrect
values or operations.
6. When you have completed entering the function, click on [Apply]
to apply the function immediately, and on [OK] to confirm the
function and close the window. To return the window to its
previous settings, click on the [Cancel] button.
Note: It may be advisable to use the [Apply] button as a means of
checking the function’s validity. If the function is improperly
typed, or if a sensor is under range or not programmed, the
Equation line displays “Invalid” with a brief message.
Programming with PanaView
4-13
April 2004
Entering User Tables
To support user functions, the Series 1 can hold up to five tables
(designated as A through E) of non-linear or empirical data. Users can
enter up to 16 X-Y pairs in each table. A user function can supply an
X value with Tbl(). The Series 1 then interpolates the Y value for a
given X, and substitutes it for Tbl (X) in the function. (See the section
Entering User-Defined Tables on page 3-13.)
To enter values for a user table:
1. From the “New Meter Browser” option, click on the desired
communications port and meter.
2. Click on “User Tables,” and then double-click on the desired
table.The right side of the screen appears similar to Figure 4-9.
Figure 4-9: User Table Window
3. Enter a name (up to 13 characters) for the table in the “Table
Name” text box, and enter up to 16 X and Y values in the
appropriate columns.The table now appears similar to Figure 4-10.
Figure 4-10: Completed User Table
4. When you have finished entering values, click on [Apply] to apply
the table immediately, and on [OK] to confirm the table and close
the window. To return the window to its previous settings, click on
the [Cancel] button.
4-14
Programming with PanaView
April 2004
Entering Saturation
Constants
To enter a saturation constant, you must enter 1 to 6 data points to
represent a curve of Cs (saturation constant) versus temperature. (For
more information, see Entering Saturation Constants on page 3-14.)
PanaView enables you to enter a saturation constant curve for each
channel. To enter a curve:
1. From the “New Meter Browser” option, click on the desired
communications port, meter, and channel.
2. From the “Edit” menu, select the “Properties” option.
3. The “Constant Saturation Table” window appears, as shown in
Figure 4-11 below.
Figure 4-11: Constant Saturation Window
4. Enter up to six data points in the text boxes to establish a curve of
saturation constants versus temperature.
5. The window also allows you to specify whether you wish
Enhanced Response for the channel. Enhanced Response uses a
dynamic moisture calibration technique to extrapolate the
moisture level to the end point when making measurements in
abrupt “dry down” conditions. (For more information, refer to
Using Computer Enhanced Response on page 3-15.) Click the
appropriate radio button to turn Enhanced Response on or off.
6. When you have finished entering values, click on [Apply] to apply
the table immediately, and on [OK] to confirm the table and close
the window. To return the window to its previous settings, click on
the [Cancel] button.
Programming with PanaView
4-15
April 2004
Index
A
C
Activating. . . . . . . . . . . . . . . . . . . . . . . . . . . . 2-9
Activating and Changing Probes . . . . . . . . . . 2-9
Adjusting Screen Contrast . . . . . . . . . . . . . . 2-40
Alarm Settings Menu . . . . . . . . . . . . . . . . . . . 3-4
Alarms
Setting Up. . . . . . . . . . . . . . . . . . . . . . . . . . 3-4
Arrow Keys
Functions . . . . . . . . . . . . . . . . . . . . . . . . . . 2-6
Assigned Box
Erasing (Unassigning) . . . . . . . . . . . . . . . 2-33
Auto-Cal
Setting Interval . . . . . . . . . . . . . . . . . . . . . . 3-7
Using . . . . . . . . . . . . . . . . . . . . . . . . . . . . . 3-7
Auxiliary Inputs
Activating . . . . . . . . . . . . . . . . . . . . . . . . . . 2-9
Cables
M Series Probe . . . . . . . . . . . . . . . . . . . . . .1-8
Moisture Image Series . . . . . . . . . . . . . . . .1-8
Oxygen Cell . . . . . . . . . . . . . . . . . . . . . . . .1-8
Pressure Sensors . . . . . . . . . . . . . . . . . . . . .1-8
TF Series Probe . . . . . . . . . . . . . . . . . . . . . .1-8
Calendar
Setting . . . . . . . . . . . . . . . . . . . . . . . . . . . .3-15
Calibration Data . . . . . . . . . . . . . . . . . 2-13, 2-17
Oxygen Cell . . . . . . . . . . . . . . . . . . . . . . .2-15
System Calibration Menu . . . . . . . . . . . . .2-12
Calibration Data Sheets. . . . . . . . . . . . . . . . .2-12
Changing Matrix to Graph Display
in PanaView . . . . . . . . . . . . . . . . . . . . . . . .4-6
Changing Recorder Settings
in PanaView . . . . . . . . . . . . . . . . . . . . . . . .4-9
Channel
Line Graph, Selecting . . . . . . . . . . . . . . . .2-37
Matrix Format, Selecting . . . . . . . . . . . . .2-33
Clock
Setting . . . . . . . . . . . . . . . . . . . . . . . . . . . .3-15
Communications Port . . . . . . . . . . . . . . . . . .3-22
Default Settings. . . . . . . . . . . . . . . . . . . . .3-22
Interval Selection . . . . . . . . . . . . . . . . . . .3-23
Setting Up . . . . . . . . . . . . . . . . . . . . . . . . .3-22
Computer Enhanced Response
Using . . . . . . . . . . . . . . . . . . . . . . . . . . . . .3-15
Configuration
Communications Port . . . . . . . . . . . . . . . .3-22
Probes . . . . . . . . . . . . . . . . . . . . . . . . . . . . .2-9
Constant Menu
Computer Enhanced Response . . . . . . . . .3-15
Entering. . . . . . . . . . . . . . . . . . . . . . . . . . . .3-9
Constants
Definition . . . . . . . . . . . . . . . . . . . . . . . . . .3-9
Entering. . . . . . . . . . . . . . . . . . . . . . . . . . . .3-9
Saturation, Definition of . . . . . . . . . . . . . . .3-9
User, Definition of . . . . . . . . . . . . . . . . . . .3-9
Contrast
Adjusting. . . . . . . . . . . . . . . . . . . . . . . . . .2-40
Contrast Adjust Menu . . . . . . . . . . . . . . . . . .2-40
B
Basic Operations . . . . . . . . . . . . . . . . . . . . . . 3-1
Alarms Setup . . . . . . . . . . . . . . . . . . . . . . . 3-4
Recorder Setup . . . . . . . . . . . . . . . . . . . . . . 3-1
Bottom Drain Cell
Description of. . . . . . . . . . . . . . . . . . . . . . . 1-7
Index
1
April 2004
Index (cont.)
D
H
Data
Calibration Data . . . . . . . . . . . . . . . . . . . . 2-12
Entering. . . . . . . . . . . . . . . . . . . . . . . . . . . . 2-4
Verifying Setup . . . . . . . . . . . . . . . . . . . . . . 2-8
Data Logger Menu . . . . . . . . . . . . . . . . . . . . 3-18
Data Logging
Setting Up . . . . . . . . . . . . . . . . . . . . . . . . . 3-17
Status, Checking . . . . . . . . . . . . . . . . . . . . 3-18
Date
Sample Output . . . . . . . . . . . . . . . . . . . . . 3-24
Setting . . . . . . . . . . . . . . . . . . . . . . . . . . . . 3-15
Delta F Oxygen Cell
Oxygen Cells . . . . . . . . . . . . . . . . . . . . . . . 1-7
Displaying Measurements . . . . . . . . . . . . . . 2-28
Line Graph Format . . . . . . . . 2-35, 2-36, 2-37
Matrix Format . . . . . . . . . . . . . . . . . 2-32, 2-34
Header
Definition. . . . . . . . . . . . . . . . . . . . . . . . . 3-17
Help
Getting On-Line. . . . . . . . . . . . . . . . . . . . . 2-7
E
Electronics Unit
Description of . . . . . . . . . . . . . . . . . . . . . . . 1-1
Setting Up . . . . . . . . . . . . . . . . . . . . . . . . . . 2-8
Enhanced Response
in PanaView . . . . . . . . . . . . . . . . . . . . . . . 4-15
Enhanced Response Menu . . . . . . . . . . . . . . 3-15
Entering User-Defined Tables . . . . . . . . . . . 3-13
Erasing Assigned Boxes . . . . . . . . . . . . . . . . 2-33
Error Handling
in PanaView . . . . . . . . . . . . . . . . . . . . . . . 4-11
Error Processing . . . . . . . . . . . . . . . . . . . . . . 3-28
I
Indicator
Definition. . . . . . . . . . . . . . . . . . . . . . . . . 2-29
Inputs
Labeling . . . . . . . . . . . . . . . . . . . . . . . . . . 2-12
Inputs, Tagging . . . . . . . . . . . . . . . . . . . . . . 2-37
K
Key Functions . . . . . . . . . . . . . . . . . . . . . 2-5, 2-6
Arrow Keys . . . . . . . . . . . . . . . . . . . . . . . . 2-6
Help Keys . . . . . . . . . . . . . . . . . . . . . . . . . 2-7
YES and NO Keys. . . . . . . . . . . . . . . . . . . 2-6
L
Label Entry Menu . . . . . . . . . . . . . . . . . . . .
Labeling Inputs . . . . . . . . . . . . . . . . . . . . . .
Line Graph
Measurement Mode, Selecting . . . . . . . .
Switch to . . . . . . . . . . . . . . . . . . . . . . . . .
Units, Selecting . . . . . . . . . . . . . . . . . . . .
Loading New Software . . . . . . . . . . . . . . . .
2-38
2-12
2-37
2-35
2-37
3-30
F
Functions. . . . . . . . . . . . . . . . . . . . . . . . . . . . . 2-6
Functions, Screen and Key . . . . . . . . . . . . . . . 2-5
Functions, User . . . . . . . . . . . . . . . . . . . . . . . 3-11
G
Graph Screen Menu . . . . . . . . . . . . . . . . . . . 2-35
2
Index
April 2004
Index (cont.)
M
M Series Probe
Cables. . . . . . . . . . . . . . . . . . . . . . . . . . . . . 1-8
Description of. . . . . . . . . . . . . . . . . . . 1-4, 1-5
Main Menu Options . . . . . . . . . . . . . . . . . . . . 2-7
Math Entry Menu . . . . . . . . . . . . . . . . . . . . . 3-12
Matrix Format . . . . . . . . . . . . . . . . . . . . . . . 2-34
Setting Up. . . . . . . . . . . . . . . . . . . . 2-32, 2-34
Setting Up a Box . . . . . . . . . . . . . . . . . . . 2-33
Switch to. . . . . . . . . . . . . . . . . . . . . . . . . . 2-32
Unassigning a Box . . . . . . . . . . . . . . . . . . 2-33
Measurement Mode
Definition . . . . . . . . . . . . . . . . . . . . . . . . . 2-29
Displayed on Screen. . . . . . . . . . . . . . . . . 2-31
Displayed Units . . . . . . . . . . . . . . . . . . . . 2-31
Line Graph, Selecting. . . . . . . . . . . . . . . . 2-37
Matrix Format, Selecting . . . . . . . . . . . . . 2-33
Table . . . . . . . . . . . . . . . . . . . . . . . . . . . . . 2-31
Units . . . . . . . . . . . . . . . . . . . . . . . . . . . . . 2-31
Measurement Modes
in PanaView . . . . . . . . . . . . . . . . . . . . . . . . 4-1
Measurement Units
in PanaView . . . . . . . . . . . . . . . . . . . . . . . . 4-1
Measurements
Line Graph, Displaying . . . . . 2-35, 2-36, 2-37
Matrix Format, Displaying . . . . . . . 2-32, 2-34
Menu Options
Alarm Settings Menu . . . . . . . . . . . . . . . . . 3-4
Auto-Cal Interval, Activating. . . . . . . . . . . 3-7
Contrast Adjust Menu . . . . . . . . . . . . . . . 2-40
Data Logger Menu . . . . . . . . . . . . . . . . . . 3-18
Enhanced Response Menu . . . . . . . . . . . . 3-15
Graph Screen Menu . . . . . . . . . . . . . . . . . 2-35
Help Menu . . . . . . . . . . . . . . . . . . . . . . . . . 2-7
Main Menu Descriptions . . . . . . . . . . . . . . 2-4
Port Settings Menu . . . . . . . . . . . . . . . . . . 3-22
Probe Configuration Menu. . . . . . . . . . . . . 2-9
Recorder Settings Menu . . . . . . . . . . . . . . . 3-1
Reference Menu . . . . . . . . . . . . . . . . . . . . 2-21
System Calibration Menu. . . . . . . . . . . . . 2-12
System Service Menu. . . . . . . . . . . . . . . . 3-15
User Constant Menu. . . . . . . . . . . . . . . . . . 3-9
User Constant Menu (Enhanced Resp.) . . 3-15
Message ID. . . . . . . . . . . . . . . . . . . . . . . . . . 3-24
Mode/Unit
Sample Output . . . . . . . . . . . . . . . . . . . . . 3-24
Index
Moisture Image Series Probe . . . . . . . . . . . . .1-6
Description of . . . . . . . . . . . . . . . . . . . . . . .1-6
Moisture Probes . . . . . . . . . . . . . . . . . . 2-9, 2-13
Calibration Data, Entering . . . . . . . . . . . .2-13
M Series . . . . . . . . . . . . . . . . . . . . . . . 1-4, 1-5
Moisture Image Series Description. . . . . . .1-6
TF Series . . . . . . . . . . . . . . . . . . . . . . . 1-4, 1-5
N
NO Key
Functions. . . . . . . . . . . . . . . . . . . . . . . . . . .2-6
O
Option Menu
Computer Enhanced Resp. . . . . . . . . . . . .3-15
Constant . . . . . . . . . . . . . . . . . . . . . . . . . . .3-9
Contrast Adjust Menu . . . . . . . . . . . . . . . .2-40
Data Logger Menu . . . . . . . . . . . . . . . . . .3-18
Graph Screen Menu . . . . . . . . . . . . . . . . .2-35
Outputs
Alarms Setup. . . . . . . . . . . . . . . . . . . . . . . .3-4
Communications Port . . . . . . . . . . . . . . . .3-22
Recorder Setup . . . . . . . . . . . . . . . . . . . . . .3-1
Oxygen Cell
Cables . . . . . . . . . . . . . . . . . . . . . . . . . . . . .1-8
Calibration Data, Entering . . . . . . . . . . . .2-15
Oxygen Cells
Activating . . . . . . . . . . . . . . . . . . . . . . . . . .2-9
Description of . . . . . . . . . . . . . . . . . . . . . . .1-7
3
April 2004
Index (cont.)
P
R
Pages
Scrolling through in the Screen . . . . . . . . 2-34
PanaView
Capabilities of . . . . . . . . . . . . . . . . . . . . . . . 4-1
Changing Measurement Modes . . . . . . . . . 4-1
Changing Recorder Settings . . . . . . . . . . . . 4-9
Enhanced Response in . . . . . . . . . . . . . . . 4-15
Error Handling in . . . . . . . . . . . . . . . . . . . 4-11
Graph Display in. . . . . . . . . . . . . . . . . . . . . 4-6
Matrix Display in . . . . . . . . . . . . . . . . . . . . 4-6
Saturation Constants in . . . . . . . . . . . . . . . 4-15
User Functions in . . . . . . . . . . . . . . . . . . . 4-12
User-Defined Tables in . . . . . . . . . . . . . . . 4-14
Passcode . . . . . . . . . . . . . . . . . . . . . . . . . . . . . 2-6
Port Settings Menu . . . . . . . . . . . . . . . . . . . . 3-22
Powering . . . . . . . . . . . . . . . . . . . . . . . . . . . . . 2-3
Powering Up . . . . . . . . . . . . . . . . . . . . . . . . . . 2-2
Pressure Sensors . . . . . . . . . . . . . . . . . . . . . . 2-17
Pressure Transducers
Activating . . . . . . . . . . . . . . . . . . . . . . . . . . 2-9
Cables . . . . . . . . . . . . . . . . . . . . . . . . . . . . . 1-8
Reference Values, Entering. . . . . . . . . . . . 2-26
Pressure Transmitters
Activating . . . . . . . . . . . . . . . . . . . . . . . . . . 2-9
Cables . . . . . . . . . . . . . . . . . . . . . . . . . . . . . 1-8
Calibration Data, Entering . . . . . . . . . . . . 2-17
Reference Values, Entering. . . . . . . . . . . . 2-26
Probe Configuration Menu . . . . . . . . . . . . . . . 2-9
Probes
Activating & Changing (in User Program). 2-9
Calibration Data Sheets . . . . . . . . . . . . . . 2-12
Calibration Data, Entering . . . . . . . . . . . . 2-12
Moisture Probes . . . . . . . . . . . . . . . . . . . . . 1-4
Oxygen Cells . . . . . . . . . . . . . . . . . . . . . . . 1-4
Pressure Transducers . . . . . . . . . . . . . . . . . 1-4
Pressure Transmitters . . . . . . . . . . . . . . . . . 1-4
Programming
User Program . . . . . . . . . . . . . . . . . . . . . . . 1-9
Programming Error Handling in PanaView . 4-11
Programming User Functions
in PanaView . . . . . . . . . . . . . . . . . . . . . . . 4-12
Record
Definition. . . . . . . . . . . . . . . . . . . . . . . . . 3-17
Recorder Outputs
Testing in PanaView . . . . . . . . . . . . . . . . 4-10
Trimming in PanaView . . . . . . . . . . . . . . 4-10
Recorder Ranges
Setting . . . . . . . . . . . . . . . . . . . . . . . . . . . . 3-1
Recorder Settings
in PanaView . . . . . . . . . . . . . . . . . . . . . . . . 4-9
Recorder Settings Menu . . . . . . . . . . . . . . . . 3-1
Recorders
Setting Up . . . . . . . . . . . . . . . . . . . . . . . . . 3-1
Reference Menu. . . . . . . . . . . . . . . . . . . . . . 2-21
Pressure Sensors . . . . . . . . . . . . . . . . . . . 2-26
Setting Auto-Cal Interval . . . . . . . . . . . . . 3-7
Response Keys. . . . . . . . . . . . . . . . . . . . . . . . 2-6
Functions . . . . . . . . . . . . . . . . . . . . . . . . . . 2-6
Return Policy . . . . . . . . . . . . . . . . . . . . . . . . . . iii
4
Index
April 2004
Index (cont.)
S
T
Sample Output
Channel . . . . . . . . . . . . . . . . . . . . . . . . . . 3-24
Description . . . . . . . . . . . . . . . . . . . . . . . . 3-24
Mode/Units. . . . . . . . . . . . . . . . . . . . . . . . 3-24
Saturation Constants
in PanaView . . . . . . . . . . . . . . . . . . . . . . . 4-15
Saturations . . . . . . . . . . . . . . . . . . . . . . . . . . . 3-9
Screen
Adjusting Contrast . . . . . . . . . . . . . . . . . . 2-40
Displayed Measurement Modes . . . . . . . . 2-31
Displayed Units . . . . . . . . . . . . . . . . . . . . 2-31
Displaying Measurements . . . . . . . . . . . . 2-28
Matrix Format, Setting Up . . . . . . . 2-32, 2-34
Scrolling through Pages . . . . . . . . . . . . . . 2-34
Screen Functions . . . . . . . . . . . . . . . . . . . . . . 2-5
Scrolling through Pages . . . . . . . . . . . . . . . . 2-34
Setting . . . . . . . . . . . . . . . . . . . . . . . . . . . . . 2-33
Setting Up. . . . . . . . . . . . . . . . . . . . . . . . . . . 3-22
Activating and Changing Probes . . . . . . . . 2-9
Calibration Data, Entering . . . . . . . . . . . . 2-12
Data Logger . . . . . . . . . . . . . . . . . . . . . . . 3-17
High and Low Reference Values . . . . . . . 2-21
Matrix Format . . . . . . . . . . . . . . . . 2-32, 2-34
Verifying. . . . . . . . . . . . . . . . . . . . . . . . . . . 2-8
Setting Up a Box . . . . . . . . . . . . . . . . . . . . . 2-33
Settings Menu
Alarm Settings Menu . . . . . . . . . . . . . . . . . 3-4
Auto-Cal Interval, Activating. . . . . . . . . . . 3-7
Error Processing Menu. . . . . . . . . . . . . . . 3-28
Passcode . . . . . . . . . . . . . . . . . . . . . . . . . . . 2-6
Port Settings Menu . . . . . . . . . . . . . . . . . . 3-22
Probe Configuration Menu. . . . . . . . . . . . . 2-9
Recorders Settings Menu . . . . . . . . . . . . . . 3-1
Reference Menu . . . . . . . . . . . . . . . . . . . . 2-21
System Calibration Menu. . . . . . . . . . . . . 2-12
System Service Menu. . . . . . . . . . . . . . . . 3-15
Software, Loading . . . . . . . . . . . . . . . . . . . . 3-30
Specifications
Cables. . . . . . . . . . . . . . . . . . . . . . . . . . . . . 1-8
Specifying User Functions . . . . . . . . . . . . . . 3-11
System Service Menu. . . . . . . . . . . . . . . . . . 3-15
Tables
Entering in PanaView . . . . . . . . . . . . . . . .4-14
Tables, User-Defined . . . . . . . . . . . . . . . . . .3-13
Tagging Inputs . . . . . . . . . . . . . . . . . . . . . . .2-37
Testing Recorder Outputs
in PanaView . . . . . . . . . . . . . . . . . . . . . . .4-10
TF Series Probe
Cables . . . . . . . . . . . . . . . . . . . . . . . . . . . . .1-8
Description of . . . . . . . . . . . . . . . . . . . 1-4, 1-5
Top Drain Cell
Description of . . . . . . . . . . . . . . . . . . . . . . .1-7
Trimming Recorder Outputs
in PanaView . . . . . . . . . . . . . . . . . . . . . . .4-10
U
Unassigned Box
How to Make. . . . . . . . . . . . . . . . . . . . . . .2-33
Units
Displayed Units. . . . . . . . . . . . . . . . . . . . .2-31
Line Graph, Selecting . . . . . . . . . . . . . . . .2-37
Matrix Format, Selecting . . . . . . . . . . . . .2-33
Measurement Modes . . . . . . . . . . . . . . . . .2-31
User Constants
Definition . . . . . . . . . . . . . . . . . . . . . . . . . .3-9
User Functions
in PanaView . . . . . . . . . . . . . . . . . . . . . . .4-12
User Functions, Definition of . . . . . . . . . . . . .3-9
User Functions, Entering . . . . . . . . . . . . . . . 3-11
User Functions, Specifying . . . . . . . . . . . . . . 3-11
User Program
Description of . . . . . . . . . . . . . . . . . . . . . . .1-9
Entering Data . . . . . . . . . . . . . . . . . . . . . . .2-4
User Tables, Entering . . . . . . . . . . . . . . . . . .3-13
User-Defined Tables
Entering in PanaView . . . . . . . . . . . . . . . .4-14
V
Verifying Setup Data. . . . . . . . . . . . . . . . . . . .2-8
W
Warranty . . . . . . . . . . . . . . . . . . . . . . . . . . . . . .iii
Y
YES Key . . . . . . . . . . . . . . . . . . . . . . . . . . . . .2-6
Index
5
ATEX COMPLIANCE
GE Panametrics
221 Crescent Street, Suite 1
Waltham, MA 02453
U.S.A.
We,
as the manufacturer, declare under our sole responsibility that the product
Moisture Image Series 1 Analyzer
to which this document relates, in accordance with the provisions of ATEX Directive 94/9/EC Annex II,
meets the following specifications:
1180
II 1 G EEx ia IIC (-20°C to +50°C)
BAS01ATEX7097
Furthermore, the following additional requirements and specifications apply to the product:
• Having been designed in accordance with EN 50014 and EN 50020, the product meets the fault
tolerance requirements of electrical apparatus for category “ia”.
• The product is an electrical apparatus and must be installed in the hazardous area in accordance with
the requirements of the EC Type Examination Certificate. The installation must be carried out in
accordance with all appropriate international, national and local standard codes and practices and site
regulations for flameproof apparatus and in accordance with the instructions contained in the manual.
Access to the circuitry must not be made during operation.
• Only trained, competent personnel may install, operate and maintain the equipment.
• The product has been designed so that the protection afforded will not be reduced due to the effects of
corrosion of materials, electrical conductivity, impact strength, aging resistance or the effects of
temperature variations.
• The product cannot be repaired by the user; it must be replaced by an equivalent certified product.
Repairs should only be carried out by the manufacturer or by an approved repairer.
• The product must not be subjected to mechanical or thermal stresses in excess of those permitted in
the certification documentation and the instruction manual.
• The product contains no exposed parts which produce surface temperature infrared, electromagnetic
ionizing, or non-electrical dangers.
CERT-ATEX-C
7/16/03
DECLARATION
OF
CONFORMITY
GE Panametrics
Shannon Industrial Estate
Shannon, Co. Clare
Ireland
We,
declare under our sole responsibility that the
Moisture Image Series 1 Analyzer
Moisture Image Series 2 Analyzer
Moisture Monitor Series 3 Analyzer
to which this declaration relates, are in conformity with the following standards:
• EN 50014:1997+A1+A2:1999
• EN 50020:1994
• II (1) G [EEx ia] IIC
BAS01ATEX7097
Baseefa (2001) Ltd/EECS, Buxton SK17 9JN, UK
• EN 61326:1998, Class A, Annex A, Continuous Unmonitored Operation
• EN 61010-1:1993+A2:1995, Overvoltage Category II, Pollution Degree 2
following the provisions of the 89/336/EEC EMC Directive, the 73/23/EEC Low Voltage Directive and the
94/9/EC ATEX Directive.
The units listed above and any sensors and ancillary sample handling systems supplied with them do not
bear CE marking for the Pressure Equipment Directive, as they are supplied in accordance with Article 3,
Section 3 (sound engineering practices and codes of good workmanship) of the Pressure Equipment
Directive 97/23/EC for DN<25.
Shannon - July 1, 2003
Mr. James Gibson
GENERAL MANAGER
TÜV
TÜV ESSEN
ISO 9001
U.S.
CERT-DOC Rev G2
5/28/02
DECLARATION
DE
CONFORMITE
GE Panametrics
Shannon Industrial Estate
Shannon, Co. Clare
Ireland
Nous,
déclarons sous notre propre responsabilité que les
Moisture Image Series 1 Analyzer
Moisture Image Series 2 Analyzer
Moisture Monitor Series 3 Analyzer
rélatif á cette déclaration, sont en conformité avec les documents suivants:
• EN 50014:1997+A1+A2:1999
• EN 50020:1994
• II (1) G [EEx ia] IIC
BAS01ATEX7097
Baseefa (2001) Ltd/EECS, Buxton SK17 9JN, UK
• EN 61326:1998, Class A, Annex A, Continuous Unmonitored Operation
• EN 61010-1:1993+A2:1995, Overvoltage Category II, Pollution Degree 2
suivant les régles de la Directive de Compatibilité Electromagnétique 89/336/EEC, de la Directive Basse
Tension 73/23/EEC et d’ATEX 94/9/EC.
Les matériels listés ci-dessus, ainsi que les capteurs et les systèmes d'échantillonnages pouvant être livrés
avec ne portent pas le marquage CE de la directive des équipements sous pression, car ils sont fournis en
accord avec la directive 97/23/EC des équipements sous pression pour les DN<25, Article 3, section 3 qui
concerne les pratiques et les codes de bonne fabrication pour l'ingénierie du son.
Shannon - July 1, 2003
Mr. James Gibson
DIRECTEUR GÉNÉRAL
TÜV
TÜV ESSEN
ISO 9001
U.S.
CERT-DOC Rev G2
5/28/02
KONFORMITÄTSERKLÄRUNG
GE Panametrics
Shannon Industrial Estate
Shannon, Co. Clare
Ireland
Wir,
erklären, in alleiniger Verantwortung, daß die Produkte
Moisture Image Series 1 Analyzer
Moisture Image Series 2 Analyzer
Moisture Monitor Series 3 Analyzer
folgende Normen erfüllen:
• EN 50014:1997+A1+A2:1999
• EN 50020:1994
• II (1) G [EEx ia] IIC
BAS01ATEX7097
Baseefa (2001) Ltd/EECS, Buxton SK17 9JN, UK
• EN 61326:1998, Class A, Annex A, Continuous Unmonitored Operation
• EN 61010-1:1993+A2:1995, Overvoltage Category II, Pollution Degree 2
gemäß den Europäischen Richtlinien, Niederspannungsrichtlinie Nr.: 73/23/EG, EMV-Richtlinie
Nr.: 89/336/EG und ATEX Richtlinie Nr. 94/9/EG.
Die oben aufgeführten Geräte und zugehörige, mitgelieferte Sensoren und Handhabungssysteme tragen
keine CE-Kennzeichnung gemäß der Druckgeräte-Richtlinie, da sie in Übereinstimmung mit Artikel 3,
Absatz 3 (gute Ingenieurpraxis) der Druckgeräte-Richtlinie 97/23/EG für DN<25 geliefert werden.
Shannon - July 1, 2003
Mr. James Gibson
GENERALDIREKTOR
TÜV
TÜV ESSEN
ISO 9001
U.S.
CERT-DOC Rev G2
5/28/02
WORLDWIDE
OFFICES
MAIN OFFICES:
GE PANAMETRICS INTERNATIONAL OFFICES:
USA
GE Panametrics
221 Crescent St., Suite 1
Waltham, MA 02453-3497
USA
Telephone: 781-899-2719
Toll-Free: 800-833-9438
Fax: 781-894-8582
E-mail: [email protected]
Web: www.gepower.com/panametrics
ISO 9001 Certified
Australia
P.O. Box 234
Gymea N.S.W. 2227
Australia
Telephone 61 (02) 9525 4055
Fax 61 (02) 9526 2776
E-mail [email protected]
Japan
2F, Sumitomo Bldg.
5-41-10, Koishikawa, Bunkyo-Ku
Tokyo 112-0002
Japan
Telephone 81 (03) 5802-8701
Fax 81 (03) 5802-8706
E-mail [email protected]
Austria
Waldgasse 39
A-1100 Wien
Austria
Telephone +43-1-602 25 34
Fax +43-1-602 25 34 11
E-mail [email protected]
Korea
Kwanghee Bldg., 201, 644-2
Ilwon-dong, Kangnam-Ku
Seoul 135-945
Korea
Telephone 82-2-445-9512
Fax 82-2-445-9540
E-mail [email protected]
Benelux
Postbus 111
3870 CC Hoevelaken
The Netherlands
Telephone +31 (0) 33 253 64 44
Fax +31 (0) 33 253 72 69
E-mail [email protected]
Spain
Diamante 42
28224 Pozuelo de Alarcon
Madrid
Spain
Telephone 34 (91) 351.82.60
Fax 34 (91) 351.13.70
E-mail [email protected]
France
BP 106
11 Rue du Renard
92253 La Garenne Colombes Cedex
France
Telephone 33 (0) 1 47-82-42-81
Fax 33 (0) 1 47-86-74-90
E-mail [email protected]
Sweden
Box 160
S147 23 Tumba
Sweden
Telephone +46-(0)8-530 685 00
Fax +46-(0)8-530 357 57
E-mail [email protected]
Germany
Mess-und Pruftechnik
Robert-Bosch-Straße 20a
65719 Hofheim
Germany
Telephone +49-6122-8090
Fax +49-6122-8147
E-mail [email protected]
Taiwan
7th Fl 52, Sec 3 Nan-Kang Road
Taipei, Taiwan
ROC
Telephone 02-2788-3656
Fax 02-2782-7369
E-mail [email protected]
Italy
Via Feltre, 19/A
20132 Milano
Italy
Telephone 02-2642131
Fax 02-26414454
E-mail [email protected]
United Kingdom
Unit 2, Villiers Court
40 Upper Mulgrave Road
Cheam
Surrey SM2 7AJ
England
Telephone 020-8643-5150
Fax 020-8643-4225
E-mail [email protected]
Ireland
GE Panametrics
Shannon Industrial Estate
Shannon, Co. Clare
Ireland
Telephone 353-61-470200
Fax 353-61-471359
E-mail [email protected]
ISO 9002 Certified
July 2003
USA
GE Panametrics
221 Crescent Street, Suite 1
Waltham, MA 02453-3497
Telephone: (781) 899-2719
Toll-free: (800) 833-9438
Fax: (781) 894-8582
E-Mail: [email protected]
Web: www.gepower.com/panametrics
Ireland
GE Panametrics
Shannon Industrial Estate
Shannon, County Clare
Ireland
Telephone: 353-61-470200
Fax: 353-61-471359
E-Mail: [email protected]