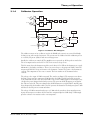
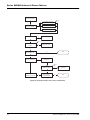
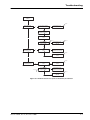
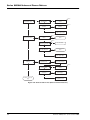
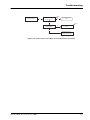
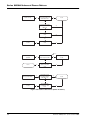
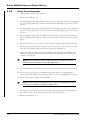
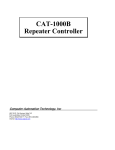
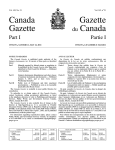
1
www.gigatronics.com
Series 8650A Universal Power Meters
Amend
ed
96 v
19
10
S
Certified Product
ISO 9001
Certified Process
st
ra
r:
42
26
gi
Re
Giga-tronics Incorporated ◆ 4650 Norris Canyon Road, San Ramon, California 94583
925.328.4650/800.726.4442/925.328.4700 (Fax) ◆ Customer Service: 800.444.2878/925.328.4702 (Fax)
Register
ed
04
Publication 32089, Rev. A4, February 2002
e
un
0
er 20 1
mb
te
ep
J
Service Manual
3
BS
FM
I, Cer cation
ti fi
All technical data and specifications in this publication are subject to change without prior notice and do not represent a change
without prior notice and do not represent a commitment on the part of Giga-tronics Incorporated.
© 2002 Giga-tronics Incorporated. All rights reserved. Printed in the USA.
WARRANTY
Giga-tronics Series 8650A instruments are warranted
against defective materials and workmanship for two
years from date of shipment. Giga-tronics will at its
option repair or replace products that are proven
defective during the warranty period. This warranty
DOES NOT cover damage resulting from improper use,
nor workmanship other than Giga-tronics service. There
is no implied warranty of fitness for a particular purpose,
nor is Giga-tronics liable for any consequential damages.
Specification and price change privileges are reserved
by Giga-tronics.
MODEL NUMBERS
The series 8650A includes two models: The single-channel Model 8561A and the dual-channel Model 8652A. Apart
from the number of sensors they support, the two models are identical. Both models are referred to in this manual by
the general term 8650A, except where it is necessary to make a distinction between the models.
DECLARATION OF CONFORMITY
Preparation for Reshipment
Follow these instructions if it is necessary to return the product to the factory.
To protect the instrument during reshipment, use the best packaging materials available. If possible
use the original shipping container. If this is not possible, a strong carton or a wooden box should be
used. Wrap the instrument in heavy paper or plastic before placing it in the shipping container.
Completely fill the areas on all sides of the instrument with packaging material. Take extra
precautions to protect the front and rear panels.
Seal the package with strong tape or metal bands. Mark the outside of the package “FRAGILE —
DELICATE INSTRUMENT”. If corresponding with the factory or local Giga-tronics sales
office regarding reshipment, please reference the full model number and serial number. If the
instrument is being reshipped for repair, enclose all available pertinent data regarding the problem
that has been found.
☛
NOTE: If you are returning an instrument to Giga-tronics for service, first contact
Giga-tronics Customer Service at 800.444.2878 or Fax at 925.328.4702 so that a return
authorization number can be assigned. You can also contact Customer Service via our
e-mail address [email protected].
Table of Contents
About This Manual ....................................................................................................... v
Conventions ............................................................................................................... vii
Record of Manual Changes .......................................................................................... ix
1
Specifications
1.1
Introduction ..................................................................................................1-1
1.1.1
Environmental Requirements ........................................................1-1
1.2
Safety Precautions ........................................................................................1-1
1.3
8650A Universal Power Meter Specifications ................................................1-2
2
Adjustments & Performance Tests
2.1
Introduction ..................................................................................................2-1
2.2
Calibration Procedure ....................................................................................2-1
2.2.1
2.2.2
2.2.3
2.2.4
2.3
Equipment Requirements .............................................................2-1
Calibrator Output Power ...............................................................2-1
1 mW Reference Output Adjustment ............................................2-1
Display Brightness Adjustment .....................................................2-3
Performance Verification Tests ......................................................................2-4
2.3.1
2.3.2
2.3.3
2.3.4
Equipment Requirement ...............................................................2-4
Calibrator Performance and Output Power Reference Level ..........2-5
2.3.2.1
Calibrator Output Power Reference Level .................... 2-5
2.3.2.2
Maximum Output Power ............................................ 2-7
2.3.2.3
Calibrator Attenuator Test........................................... 2-8
2.3.2.4
Return Loss................................................................. 2-8
2.3.2.5
Calibrator Frequency Check......................................... 2-9
GPIB Port Check .........................................................................2-12
Instrument Plus Power Sensor Linearity .....................................2-13
3
Theory of Operation
3.1
8650A Power Meter Theory of Operation ......................................................3-1
3.1.1
3.1.2
3.1.3
3.1.4
3.1.5
3.1.6
Manual 32089, Rev. A, December 2000
General Theory .............................................................................3-1
Analog Section Operation .............................................................3-2
Digital Section Operation ..............................................................3-2
Calibrator Operation .....................................................................3-3
Setting the Calibrator Level ...........................................................3-4
Calibrating the Sensor/Meter Combination ....................................3-4
i
Series 8650A Universal Power Meters
4
Replaceable Parts
4.1
8650A Replaceable Parts...............................................................................4-1
5
Troubleshooting
5.1
8650A Fault Isolation ....................................................................................5-1
Index
Series 8650A Universal Power Meters Index ....................................................... Index-1
ii
Manual 32089, Rev. A, December 2000
Preface
List of Figures
Figure
Figure
Figure
Figure
Figure
Figure
Figure
Figure
Figure
Figure
Figure
Figure
Figure
2-1:
2-2:
2-3:
2-4:
2-5:
3-1:
3-2:
5-1:
5-2:
5-3:
5-4:
5-5:
5-6:
Calibrator Output Test Setup ................................................................2-3
Calibrator Maximum Output Test Setup ...............................................2-7
HyperTerminalTM Display ....................................................................2-7
Return Loss Setup ................................................................................2-9
Power Linearity Test Setup.................................................................2-13
8650A Meter Block Diagram.................................................................3-1
Calibrator Block Diagram ......................................................................3-3
Fault Isolation Tree (Power on Sequence) .............................................5-1
Fault Isolation Tree (Sensor Problems) ..................................................5-2
Fault Isolation Tree (Sensor Problems) Continued .................................5-3
Fault Isolation Tree (Measurement Problems) .......................................5-4
Fault Isolation Tree (Measurement Problems) Continued ......................5-5
Fault Isolation Tree (Other Problems) ....................................................5-6
Manual 32089, Rev. A, December 2000
iii
Series 8650A Universal Power Meters
List of Tables
Table
Table
Table
Table
iv
1-1:
2-1:
2-2:
4-1:
Measurement Rates.............................................................................
Related Equipment List ........................................................................
Required Equipment List......................................................................
8650A List of Assemblies ....................................................................
1-5
2-1
2-4
4-1
Manual 32089, Rev. A, December 2000
About This Manual
This manual contains the following chapters to describe the service components of the Giga-tronics
Series 8650A Universal Power Meters:
Preface:
In addition to a comprehensive Table of Contents and general information about the manual, the
Preface also contains a record of changes made to the manual since its publication.
Chapter 1 – Specifications:
This chapter contains brief information about the instrument and provides information on its
performance parameters.
Chapter 2 – Adjustments & Performance Tests:
This chapter provides procedures for inspection, calibration and performance testing. It defines the
procedures to verify the performance of the Series 8650A Universal Power Meters.
Chapter 3 – Theory of Operation:
This chapter provides an instrument block diagram level description and its circuits for maintenance
and applications.
Chapter 4 - Replaceable Parts:
This chapter provides replaceable parts for the Series 8650A Universal Power Meters.
Chapter 5 – Troubleshooting:
This chapter contains procedures for troubleshooting.
Index:
A word index of the various elements of the Series 8650A Universal Power Meters Service manual.
Changes that occur after publication of the manual, will be inserted as loose pages in the manual
binder. Please insert and/or replace the indicated pages as detailed in the Technical Publication
Change Instructions included with new and replacement pages.
Manual 32089, Rev. A, December 2000
v
Series 8650A Universal Power Meters
vi
Manual 32089, Rev. A, December 2000
Conventions
The following conventions are used in this product service manual. Additional conventions not
included here will be defined at the time of usage.
Warning
WARNING
The WARNING statement is encased in gray and centered in the
page. This calls attention to a situation, or an operating or
maintenance procedure, or practice, which if not strictly corrected
or observed, could result in injury or death of personnel. An
example is the proximity of high voltage.
Caution
CAUTION
The CAUTION statement is enclosed with single lines and centered
in the page. This calls attention to a situation, or an operating or
maintenance procedure, or practice, which if not strictly corrected
or observed, could result in temporary or permanent damage to the
equipment, or loss of effectiveness.
Notes
☛
NOTE: A NOTE Highlights or amplifies an essential operating or maintenance
procedure, practice, condition or statement.
Manual 32089, Rev. A, December 2000
vii
Series 8650A Universal Power Meters
viii
Manual 32089, Rev. A, December 2000
Record of Manual Changes
This table is provided for your convenience to maintain a permanent record of manual change data.
Corrected replacement pages will be issued as Technical Publication Change Instructions, and will be
inserted at the front of the binder. Remove the corresponding old pages, insert the new pages, and
record the changes here.
Change
Instruction
Number
Change
Instruction
Date
Manual 32089, Rev. A, December 2000
Date
Entered
Comments
ix
Series 8650A Universal Power Meters
x
Manual 32089, Rev. A, December 2000
1
Specifications
1.1
Introduction
This chapter contains the power meter’s specifications and supplemental characteristics.
1.1.1
Environmental Requirements
The Series 8650A instruments are type tested to MIL-PRF-28800F, Class 3 for all departments and
agencies of the Department of Defense applications except as follows:
•
•
•
•
1.2
Operating temperature range is 0 °C to 55 °C (calibrator operating temperature range is 5 °C to
35 °C).
Operating the 8651A/8652A Power Meters in a high level RF field (approximately 3 V/m) may
degrade performance, this degradation occurs at measured levels below -36 dBm and when the
frequency of the field is nominally between 50 and 1000 MHz.
Non-operating (storage) temperature range is -40 °C to +70 °C.
Relative humidity is limited to 95% non-condensing.
Safety Precautions
This 8650A has a 3-wire power cord with a 3-terminal polarized plug for connection to the power source
and safety-ground. The ground (or safety ground) is connected directly to the chassis.
WARNING
If a 3-to-2 wire adapter is used, connect the ground lead from the
adapter to earth ground. Failure to do this can cause the instrument to float above earth ground, posing a shock hazard.
The 8650A is designed for international use with source voltages of 100, 120, 220, or 240 Vac, ±10% at
48 to 440 Hz. The 8650A uses an internationally approved connector that includes voltage selection,
fuse, and filter for RFI protection.
Manual 32089, Rev. A, December 2000
1-1
Series 8650A Universal Power Meters
1.3
8650A Universal Power Meter Specifications
Power Meter
Frequency Range:
Power Range:
10 MHz to 40 GHz1
-70 dBm to +47 dBm (100 pW to 50 Watt)1
Single Sensor
Dynamic Range:
CW Power Sensors:
90 dB1
Peak Power Sensors:
40 dB Peak, 50 dB CW
Modulation Sensors:
87 dB CW; 80 dB MAP/PAP; 60 dB BAP
Display Resolution:
Measurement Modes:
Averaging:
dB Rel and Offset:
Configuration Storage
Registers:
Power Measurements and
Display Configuration:
User-selective from 1 dB to 0.001 dB in Log mode and from 1 to
4 digits of display resolution in Linear mode.
CW, Peak, MAP, BAP, PAP
User-selective auto-averaging or manual, 1 to 512 readings.
Timed averaging from 20 ms to 20 seconds. Automatic noise
compensation in auto-averaging mode.
Allows both relative and offset readings. Power display can be
offset by -99.999 dB to +99.999 dB to account for external loss/
gain.
Up to 20 front panel setups plus a last instrument state at powerdown to be stored and recalled from non-volatile memory.
Any four of the following channel configurations simultaneously:
A, B, A/B, B/A, A-B, B-A, DLYA, DLYB, Min/Max, Bar Graph/
Peaking Meter, Peak Hold, Crest Factor, or Mean & Std
Deviation. Alternately, full-screen graphic display of Histogram,
Strip Chart, Cumulative Distribution Function (CDF) and
Complementary CDF (CCDF) functions.
Sampling:
CW Mode and Modulation
Mode:
2.5 to 5.0 Mhz, asynchronous
Analog Bandwidth:
CW Mode:
Modulation Mode:
1-2
≥3 kHz
>10 MHz
Manual 32089, Rev. A, Ncvember 2000
Specifications
Time Gated Measurements:
Gate Polarity:
Specifies the external signal TTL high or low level as true for
defining the gated time.
Trigger Delay:
0 to 327 ms
Gate Time:
Holdoff Time:
10 µs to 327 ms
0 to 327 ms
External Trigger Polarity:
Positive or negative leading edge
Delay & Range Accuracy:
+1.5 µs or 100 ppm of the set time, whichever is greater
Settability:
Trigger Signal:
5 µs steps or selective by cursoring to specific digits
Standard TTL levels
Accuracy
50 MHz Calibrator
Standard
Calibrator:
+20 to -30 dBm power sweep calibration signal to dynamically
linearize the sensors.
Frequency:
50 MHz nominal
0.0dBm Accuracy:
VSWR:
Connector:
1 GHz Calibrator
(Option 12)
±1.2% worst case for one year over a temperature range of 5 to
35 °C.
<1.05 (Return Loss >33 dB) @ 0 dBm
Type N, 50 Ω
Required for 80701A Series Sensors (see Option 12 in
Appendix C).
Calibrator:
+20 to -30 dBm power sweep calibration signal to dynamically
linearize the sensors.
Frequency:
1 GHz, nominal
0.0dBm Accuracy:
VSWR:
Connector:
± 1.2% worst case for one year over a temperature range of 5 to
35 °C.
<1.07 (Return Loss >30 dB) @ 0 dBm
Type N, 50 Ω
800 MHz to 1 GHz
Synthesizer (Option 12)
Power Range:
Frequency:
Power Stability:
Frequency Accuracy:
☛
+15 to -30 dBm, settable in 1 dB steps
800 MHz to 1 GHz, settable in 1 MHz steps
<0.1 dB/hour
±0.05%
NOTE: Power accuracy for Option 12 is only guaranteed while in calibration mode at 1 GHz,
0 dBm.
Manual 32089, Rev. A, December 2000
1-3
Series 8650A Universal Power Meters
Instrumentation Linearity
System Linearity at 50 MHz:
±0.02 dB over any 20 dB range from -70 to +16 dBm 1
±0.02 dB (±.05 dB/dB) from +16 to +20 dBm
±0.04 dB from -70 to +16 dBm
The following chart shows linearity plus worst case zero set and
noise vs. input power.
3
Typical Error (dB)
2
1
0
-1
-2
SENSORS
-3
80301A
80310A
80320A
80321A
80322A
80325A
80330A
80401A,80601A (CW)
80701 (CW)
-70
-64
-60
-50
-40
-40
-30
-67
-64
-60
-54
-50
-40
-30
-30
-20
-57
-54
-50
-44
-40
-30
-20
-20
-10
-47
-44
-40
-34
-30
-20
-10
-10
0
-37
-34
-30
-24
-20
-10
0
0
10
-27
-25
-20 -10
-14 -4
0
-10
0 10
0 20
10 20
20
-17 -7
-16 -7
0
6
10
20
20
30
10
16
20
30
40
40
20
26
30
40
44
50
3
3
13
13
20
20
Input (dBM)
Temperature Coefficient of
Linearity:
Zeroing Accuracy:
Zero Set:
<0.3%/ °C temperature change following Power Sweep
calibration. 24-hour warm-up required.
(CW)
<±50 pW, <± 100 pW with 80400A, 80600A series Modulation
Power Sensors.
<±200 pW with 80700A Series Sensors.
<±100 pW during 1 hour
Zero Drift (during 1 hour):
Noise:
<±200 pW with 80400A and 80600A Series Modulation Sensors
<±400 pW with 80700A Series Sensors
<±50 pW, <±100 pW with 80400A and 80600A Series
modulation power sensors.
<±200 pW with 80700A Series Sensors.
Measurable over any 1 minute interval after zeroing, three
standard deviations.
Notes:
1.
2.
Depending on sensor used (see Power Sensor details in Appendix B of the Series 8650A Universal Power Meters Operation
Manual P/N 31470).
Zero Drift Measurement
a.
Set the meters Average to 512. Perform Calibration. Connect a 50-ohm load to the sensor after Calibration and
Zero meter.
b.
c.
d.
e.
1-4
Temperature stabilize at 25 °C for 24 hours.
After the 24 hour stabilization, perform a Zero Drift test.
Zero the meter and take an initial measurement reading.
Continue taking one reading every 10 minutes until 6 readings have been taken.
Plot the 6 readings, Zero Drift should be ±200pW or ±400pW, depending on the sensor.
Manual 32089, Rev. A, Ncvember 2000
Specifications
Measurement Rates
Table 1-1 illustrates typical maximum measurement rates for different measurement collection modes.
The rate of measurement depends on several factors including the controller speed and the number of
averages. The Fast Buffered Mode speed does not include bus communication time. Measurement speed
increases significantly using the 8650A Fast Buffered Mode. Storing data in the power meter’s memory
for later downloading to your controller reduces GPIB protocol overhead. Up to 5000 readings can be
buffered.
Table 1-1: Measurement Rates
Readings per Second
(CW Measurement)
Readings per Second
(MAP, PAP, BAP
Measurement)
>300
150
>1750
800
Fast Buffered Mode, Buffered Data, Time
Interval = 0
26,000
N/A
Fast Modulated Mode, Continuous Single
Readings
N/A
800
Measurement
Collection Mode
Normal (TR3), Continuous Single
Readings
Swift Mode, Continuous or
Buffered, Bus/TTL triggered
Individual data points are read immediately after measurement in the Normal mode. The Normal mode
and the Swift mode both slow down at low power levels (<-37 dBm for Standard Sensors) to average the
effects of noise. The Swift mode allows triggering of individual data points and can store the data in the
8650A memory. Measurement timing of individual data points is controlled by setting the time interval
(0 to 5000 ms) between the data points following a trigger.
Remote Operation
GPIB Interface:
All front panel operations and some GPIB-only operations to be
remotely programmed in IEEE-488.2 or IEC-625 formats.
Interrupts:
SRQs are generated for the following conditions:
Power Up, Front Panel key actuation, Operation Complete and
Illegal Command.
Fast Buffered Mode Controls
Trigger Source:
Data Buffer Control:
Time Interval:
Manual 32089, Rev. A, December 2000
TTL or GPIB
Pre- or Post-measurement data is collected immediately either
before or after receipt of the TTL or GPIB trigger.
TIME ### - controls time interval in milliseconds between
measurements. Accurate to 5%, typical.
1-5
Series 8650A Universal Power Meters
Inputs/Outputs
VPROPF Input (BNC):
Recalls cal factors using source VPROPF output. Corrects power
readings for sensor frequency response using sweeper voltage
output. Input resistance = 50K. Does not operate in the fast
measurement collection modes (normal mode only).
Analog Output (BNC):
Provides an output voltage of 0 to 10V from the respective
channel in either Log or Lin units. Does not operate in the swift
and fast measurement buffered modes.
Trigger Input (BNC):
Accepts a TTL trigger input signal for swift and fast measurement
buffered modes, and time gating mode.
GPIB connector:
Interfaces the power meter to a host computer for remote
programming using SCPI, IEEE 488.2 and IEC-625 coding, also
emulation modes.
RS-232 connector:
Interfaces the power meter to serial communications equipment,
using RS-232 format.
General Specifications
Temperature Range:
Operating:
Storage:
Power Requirements:
0 to 55 °C (32 to 13 2 °F)
-40° to 70 °C (-40° to 158 °F)
100/120/220/240Vac <± 100 pW 10%, 48 to 440 Hz, 20 VA
typical
Physical Characteristics:
Dimensions:
Weight:
1-6
215 mm (8.4 in) wide, 89 mm (3.5 in) high, 368 mm (14.5 in)
deep
4.55 kg (10 lbs)
Manual 32089, Rev. A, Ncvember 2000
2
Adjustments & Performance Tests
2.1
Introduction
This chapter defines procedures for adjustments and performance testing for the Series 8650A Universal
Power Meters.
2.2
Calibration Procedure
If any of the instrument performance characteristics cannot be calibrated within specification, refer to
the Troubleshooting Chapter of the 8650A Service Manual.
2.2.1
Equipment Requirements
Table 2-1 lists the equipment required for calibration of the 8650A power meters.
Table 2-1: Related Equipment List
Description
Representative Model
Key Characteristics
CW Thermistor Power Meter
HP 432A
VRF and Vcomp available externally
Thermistor Mount
< 1.07 VSWR @ 50 MHz
(30 dB return loss)
HP 478-H75
Accuracy + 0.5% @ 50 MHz
Digital Voltmeter
+0.05% accuracy & 1 µV resolution
HP 34401A
PC
2.2.2
Win 95, 98, 2000, NT
TM
PC comm port software
HyperTerminal
9 pin Type D Serial Cable
Radio Shack P/N 26-117
Serial Port Communications software
Serial cable (non-null modem)
Calibrator Output Power
Power up the 8650A and allow for a 30 minute warm up period. Perform the Calibrator Performance
and Output Power Reference Level tests (see section 2.3). The unit should meet all required
performance specifications. If the unit fails to meet the 1 mW Reference Output Specification within
the 0.981 mW to 1.019 mW minimum and maximum limits, continue to section 2.2.3.
2.2.3
1 mW Reference Output Adjustment
Connect the test equipment per Figure 2-1. Set the 50 MHz calibrator to 0 dBm from the front panel of
the 8650A and turn on the calibrator. Using the HyperTerminal TM program, connect to the 8650A and
enter the command “XC TESTCAL”. Record the 50 MHz Cal Factor from the response into the Cal
Factor column of the Calibrator Cal Factor table. Type “T” and press “Enter”. Enter “0” at the prompt to
reset the calibrator cal factor to zero. Measure the calibrator output using the following procedure:
Manual 32089, Rev. A, December 2000
2-1
Series 8650A Universal Power Meters
In the following steps, precision power measurements will be made using the 432A Power Meter. For
detailed information on using the 432A, please refer to the operating section of the 432A manual.
Allow all equipment 30 minutes to thermally stabilize before proceeding.
1.
Connect the 432A to the Calibrator Output on the 8650A as shown in Figure 2-1. Be certain
that the 8650A Calibrator is off.
2.
Set the 432A RANGE switch to COARSE ZERO, and adjust the front panel COARSE ZERO
control to obtain a zero (±2% F.S.) meter indication.
☛
NOTE: Ensure that the DVM input leads are isolated from chassis ground when performing
the next step.
3.
Set the DVM to a range that results in a resolution of 1 µV and connect the positive and
negative input, respectively, to the VCOMP and VRF connectors on the rear panel of the 432A.
4.
Fine zero the 432A on the most sensitive range, then set the 432A range switch to 1 mW.
5.
Record the DVM indication as V0.
6.
Turn ON the 8650A Calibrator RF power as follows:
Press MENU, scroll to REF POWER ON/OFF, press ENTER, select ON, press ENTER.
Record the reading shown on the DVM as V1.
7.
Disconnect the DVM negative lead from the VRF connector on the 432A, and reconnect it to
the 432A chassis ground. Record the new indication observed on the DVM as VCOMP.
8.
Calculate the Calibrator Output level (PCAL) using the following formula:
PCAL(Watts) =
2VCOMP (V1- V0 ) + V0 2 - V1
4R(Calibration Factor)
2
where:
PCAL = calibrator output power reference level
VCOMP= previously recorded value in Step 8
V1= previously recorded value in Step 7
V0= previously recorded value in Step 6
R= 200Ω (assuming HP478A-H75 mount)
Calibration factor = value for the thermistor mount at 50 MHz (traceable to the NIST)
2-2a
Manual 32089, Rev. A, December 2000
Adjustments & Performance Tests
Enter the power level reading into the following formula:
CFnew = (-10Log10(Pcal*1000)) * 1000
Record the new Cal Factor value (CFnew) into the New Cal Factor column of the Calibrator Cal Factor
table. Enter the new Calibrator Cal Factor by typing “T” and Enter. Repeat the power measurement to
confirm the new Cal Factor for 50 MHz. If Option 12 is installed, repeat section 2.2.3 using the 1000
MHz settings and readings. To enter the new cal factor, type “U” and Enter.
Figure 2-1: Calibrator Output Test Setup
2.2.4
Display Brightness Adjustment
The Series 8650A Universal Power Meters LCD display can be adjusted for brightness. The display
brightness is adjustable in 5% or 10% increments.
Procedure
1.
From the main display screen, press the "Display" softkey.
2.
Press the "More Options" softkey.
3.
Use the UP and DOWN arrow buttons to increase or decrease the brightness setting.
4.
Press the "OK" softkey to return the main menu.
Manual 32089, Rev. A, December 2000
2-3b
Series 8650A Universal Power Meters
2.3
Performance Verification Tests
If any of the instrument performance characteristics are not within specifications, refer to Chapter 5,
the Troubleshooting section of the 8650A Service Manual.
2.3.1
Equipment Requirement
Table 2-2 lists the equipment required for performance verification of the Series 8650A Power Meters.
Table 2-2: Required Equipment List
Description
Representative Model
Key Characteristics
CW Thermistor Power Meter
HP 432A
VRF and Vcomp available externally
Thermistor Mount
HP 478-H75
< 1.07 VSWR @ 50 MHz
(30 dB return loss)
Accuracy + 0.5% @ 50 MHz
2-4
Digital Voltmeter
HP 34401A
+0.05% accuracy & 1 µV resolution
Directional Coupler, 10 dB
Mini Circuits
ZFDC-10-1 10 dB
<1.15 SWR @ 50 MHz
Step Attenuator, 0 to 90 dB
In 10 dB increments
Weinshel
Model AC 118A-90-33
<1.15 SWR @ 50 MHz
+0.1 dB attenuation
RF Source
Giga-tronics 12508 Frequency
Synthesizer
+15 dBm @ 50 MHz and 1 GHz
Low Pass Filter
Integrated Microwave
Model 904 881
>30 dB attenuation @ 100 MHz
Universal Power Meter
Giga-tronics 8560A
Universal Power Meter
Return Loss/VSWR measurement
Directional Bridge
Giga-tronics 80501A
Directional Bridge
Relative accuracy 0.02 dB/20 dB
GPIB Controller
National Instruments IEEE 488.2
IEEE 488.2 compatible driver
Amplifier, 10 MHz to 1000 MHz
Mini Circuits
ZFL-1000VH
>+22.0 dBm output
PC comm port software
HyperTerminal TM
Serial Port Communications software
9 pin Type D Serial Cable (M-F)
Radio Shack P/N 26-117
Serial cable (non-null modem)
Frequency Counter
Tektronix CMC251
+1 ppm/year Time Base
Manual 32089, Rev. A, December 2000
Adjustments & Performance Tests
2.3.2
Calibrator Performance and Output Power Reference
Level
2.3.2.1
Calibrator Output Power Reference Level
This test determines if the Calibrator Output Power Reference Level given in this section is valid for an
ambient temperature range between +5° C and +35° C (+41° F to +95° F).
The Calibrator Output power reference is factory adjusted to 1 mW ±0.7%. To achieve this accuracy,
Giga-tronics uses a precision measurement system with accuracy to ±0.5% (traceable to the NIST formerly the NBS), and allows for a transfer error of ±0.2% for a total of ±0.7%. If an equivalent
measurement system is used for verification, the power reference oscillator output can be verified to
1mW ±1.9% (±1.2% accuracy, ±0.5% verification system error, ±0.2% transfer error, for a maximum
error of ±1.9%). To ensure maximum accuracy in verifying the Calibrator Output power reference, the
following procedure provides step-by-step instructions for using specified test instruments of known
capability. If equivalent test instruments are substituted, refer to the Key Characteristics section in
Table 2-2.
Procedure:
In the following steps, thermistor power measurements will be made using the 432A Power Meter. For
detailed information on using the 432A, please refer to the operating section on the 432A manual.
1.
Turn on the 8650A and the associated test equipment.
2.
After 15 minutes, turn the 8650A’s Calibrator Output OFF and ON. This establishes the 1mW
reference for the instrument firmware.
3.
Connect the Thermistor Mount to the 8650A Calibrator output “N” type connector as show
in Figure 2-1. Allow a 15 minute thermal equilibrium period between the Thermistor and
Calibrator connector to minimize temperature differences.
4.
Set the 432A RANGE switch to COARSE ZERO, and adjust the front panel COARSE ZERO
control to obtain a zero (±2% F.S.) meter indication.
☛
NOTE: Ensure that the DVM input leads are isolated from chassis ground
when performing the next step.
5.
Set the DVM to a range that results in a resolution of 1 µV and connect the positive and
negative input, respectively, to the VCOMP and VRF connectors on the rear panel of the 432A.
6.
Fine zero the 432A on the most sensitive range, then set the 432A range switch to 1 mW.
7.
Record the DVM indication as V0.
8.
Turn ON the 8650A Calibrator RF power as follows:
Press [Meter Setup] [Calibrator] [Frequency], set to 50.0 MHz, press [ON] then [OK}
Record the reading shown on the DVM as V1.
9.
Disconnect the DVM negative lead from the VRF connector on the 432A, and reconnect it to
the 432A chassis ground. Record the new indication observed on the DVM as VCOMP.
Manual 32089, Rev. A, December 2000
2-5
Series 8650A Universal Power Meters
10. Calculate the Calibrator Output level (PCAL) using the following formula:
PCAL(Watts) =
2VCOMP (V1- V0 ) + V0 2 - V1
4R(Calibration Factor)
2
where:
PCAL = calibrator output power reference level
VCOMP= previously recorded value in Step 8
V1= previously recorded value in Step 7
V0= previously recorded value in Step 6
R= 200Ω (assuming HP478A-H75 mount)
Calibration factor = value for the thermistor mount at 50 MHz (traceable to the NIST)
11. Verify that the PCAL is within the following limits:
1 mW ±0.019 mW (0.981 to 1.019 mW)
For record purposes, the measured value of PCAL can be entered on the Test Data Recording
Sheet located on page 2-10.
12. For Option 12, set the calibrator frequency to 1.000 GHz as in step 8 and repeat steps 7 & 9
through 12.
2-6a
Manual 32089, Rev. A, December 2000
Adjustments & Performance Tests
2.3.2.2
Maximum Output Power
Connect the test setup as shown in Figure 2-2. Start the HyperTerminal program and connect to the
8650A using the serial communications port. The Comm Port set up should include the Append Line
Feeds to incoming Line Ends. When communications are established, enter the command “XC
TESTCAL”. The 8650A will output data as shown in Figure 2-3. Set the Step Attenuator so that the
Attenuator is at 20 dB attenuation.
Figure 2-2: Calibrator Maximum Output Test Setup
GIGA-TRONICS MODEL 8650 CALIBRATOR SERVICE
---- ------- ----- ---- ---------- ------Calibrator S/N 001835111 ... Password XXXXXXXX ... High Band Enabled
CF(50M) -307 @ 52.4 C, SC_50: 0 ..... CF(1G) 264 @ 52.4 C, SC_1G: 0
Temperature :
49.4 C ... Oven Control : 3.860 Volts
MAX335 register = 5e1c ATTN 0007 MODE 5e00 ... CAL_OFF
Attenuation = 0 Frequency 50 MHz LOCKED
Ambient
LEVELLED
Voltage 2.0797 Volts (27033)
Reference Voltage 2.2040 Volts (28649)
Difference Voltage 0.3769 Volts (04940)
Power 0.000 dBm Spigot -0.005 dBm Diode 3.1603e-01 CH: 0
50 MHz Cal Factor Setting CF (50)
Enter one of the following numbers (any other number to exit)
A = Set RF Attenuation
F = Set Frequency
L=LEVEL MODE
O = Calibrator Off
P = Set Power
D = Set DAC
C = Cal Freq. Response G=Temp Comp A
S = Set Calibrator SN
M=Difference
R = Set HiBand Password X=Set 50M SC
T = Set 50M Cal Factor
U = Set 1G Cal Factor Y=Set 1G SC
Q=QUIT
Amb : 2.079655
Ref : 2.203974 DAC : 0.395279
Figure 2-3: HyperTerminalTM Display
Manual 32089, Rev. A, December 2000
2-7
Series 8650A Universal Power Meters
2.3.2.3
1.
Turn on the calibrator by entering "L" or by manually turning on the calibrator through the front
panel Meter Setup Menu.
2.
Set the frequency to 50 MHz by using the “X” command or by manually setting the frequency of the
calibrator to 50 MHz. (It is necessary to do this only if Option 12 is installed).
3.
Type “D”. The 8650A will request a DAC value. Type “65000” and press the ENTER key. The
maximum value is 65535. Type “L” after entering the DAC value to load the new DAC setting.
4.
Measure the output power. If the reading is not greater than or equal to the specification for
Maximum Output Power, repeat step 3 and increase the DAC value in increments of 50 until the
maximum DAC value has been reached. Record the calibrator maximum output power reading in
the Performance Verification Test Data Sheet.
5.
If Option 12 is installed, repeat steps 2 through 4 with the Calibrator set to 1000 MHz.
6.
Refer to the Calibrator Troubleshooting section of the manual if the Calibrator does not meet the
Maximum Output Power Specification.
Calibrator Attenuator Test
Using the same test setup in Figure 2-2. Set the Step Attenuator so that the Attenuator is at 0 dB
attenuation. Press the REL softkey and set the 8650A to make a relative measurement. Using the
HyperTerminal Comm program, type “A” and press enter. Next, enter “0”. Use the attenuator settings
specified in the Calibrator Attenuator Test section of the Performance Verification Test Data Sheet.
Record the relative measurement of the 8650A power meter in the appropriate column and compare to
the specifications.
2.3.2.4
Return Loss
Connect the test setup as shown in Figure 2-4. Set the RF Source frequency to 50 MHz and level to 10
dBm. Calibrate the 80501A Directional Bridge to the 8650A Universal Power Meter according to
manufacturer’s specifications.
2-8
1.
Connect the Short supplied with the Directional Bridge and set the meter into relative mode
(0 dB).
2.
Disconnect the Short and connect the 80501A Directional Bridge to the Calibrator. Turn the
Calibrator off when performing this measurement.
3.
Measure and record the absolute value of the reading in the appropriate section of the
Performance Verification Test Data Sheet provided at the end of this chapter.
4.
If Option 12 is installed, repeat steps 2 through 3 with the RF source set to 1000 MHz.
Manual 32089, Rev. A, December 2000
Adjustments & Performance Tests
Refer to the Calibrator Troubleshooting section of the manual if the Calibrator does not meet the
Return Loss specification.
Figure 2-4: Return Loss Setup
2.3.2.5
Calibrator Frequency Check
Connect the output of the 8650A calibrator to the frequency counter. Set the output of the calibrator to
50 MHz, +5 dBm and turn on the calibrator. Record the reading of the frequency counter in the
Performance Verification Test Data Sheet. If Option 12 is installed, repeat this test for 1000 MHz.
Manual 32089, Rev. A, December 2000
2-9a
Series 8650A Universal Power Meters
GIGA-TRONICS 8650A SERIES
PERFORMANCE VERIFICATION TEST
DATA SHEET
Date:
Operator:
Test Number:
(if required)
Series 8650A S/N:
Power Sensor S/N:
Test
50 MHz
Spec.
1000 MHz (Option 12)
Actual
Spec.
Actual
1 mW Reference Output
0.981 mW to 1.019 mW
0.981 mW to 1.019 mW
Maximum Power Output
>+20.8 dBm
>+20.8 dBm
Calibrator Return Loss
>33 dB
>30 dB
Calibrator Frequency Accuracy
49 MHz to 51 MHz
999.5 MHz to 1000.5 MHz
Calibrator Attenuator Test
Attenuator Setting
Attenuation (dB)
Spec. (+/- dB)
0
0.00
0.00
1
6.25
.25
2
12.50
.50
4
25.00
1.00
7
43.75
2.00
Actual
Calibrator Cal Factor Table
Frequency (MHz)
Cal Factor
New Cal Factor
50
1000
2-10
Manual 32089, Rev. A, December 2000
Adjustments & Performance Tests
Linearity Data - (+16 dBm to +20 dBm)
Step
Attenuator
Value
0 dB
0 dB
0 dB
0 dB
0 dB
Power Set
Point
1.00 mW
±0.025 mW
3.98 mW
±0.10 mW
3.98 mW
±0.10 mW
5.01 mW
±0.13 mW
5.01 mW
±0.13 mW
6.31 mW
±0.16 mW
6.31 mW
±0.16 mW
7.94 mW
±0.2 mW
7.94 mW
±0.2 mW
10 mW
±0.25 mW
Power
Meter
Reading
(P)
8650A
(DUT)
Reading
(R)
P1 =
R1 =
P2 =
R2 =
P1 =
R1 =
P2 =
R2 =
P1 =
R1 =
P2 =
R2 =
P1 =
R1 =
P2 =
R2 =
P1 =
R1 =
P2 =
R2 =
Reference
Power
Ratio
P1/P2 =
8650A
(DUT)
Reading
Ratio
Linearity Error (%)1
Linearity
Specification
R1/R2 =
Same as Lin.
error above
±1%
P1/P2 =
R1/R2 =
P1/P2 =
R1/R2 =
P1/P2 =
R1/R2 =
P1/P2 =
R1/R2 =
Accumulated
Linearity
Error2
+1%
-1.6%
+1%
-2.7%
+1%
-3.8%
+1%
-4.9%
Linearity Data - (-60 dBm to +16 dBm)
Linearity Error (%)1
Step
Attenuator
Value
Power
Set Point
Power
Meter
Reading
(P)
8650A
(DUT)
Reading
(R)
Reference
Power
Ratio
8650A
(DUT)
Reading
Ratio
Linearity
Specification
Accumulated
Linearity
Error2
See Note 3
0 dB
10 dB
20 dB
30 dB
40 dB
50 dB
60 dB
70 dB
±1%
1.00 mW
±0.025 mW
10.00 mW
±0.25 mW
1.00 mW
±0.025 mW
10.00 mW
±0.25 mW
1.00 mW
±0.025 mW
10.00 mW
±0.25 mW
1.00 mW
±0.025 mW
10.00 mW
±0.25 mW
1.00 mW
±0.025 mW
10.00 mW
±0.25 mW
1.00 mW
±0.025 mW
10.00 mW
±0.25 mW
1.00 mW
±0.025 mW
10.00 mW
±0.25 mW
P1 =
R1 =
P2 =
R2 =
P1 =
R1 =
P2 =
R2 =
P1 =
R1 =
P2 =
R2 =
P1 =
R1 =
P2 =
R2 =
P1 =
R1 =
P2 =
R2 =
P1 =
R1 =
P2 =
R2 =
P1 =
R1 =
P2 =
R2 =
P1/P2 =
Same as Lin.
error above
R1/R2 =
±1%
P1/P2 =
R1/R2 =
±1%
P1/P2 =
R1/R2 =
±1%
P1/P2 =
R1/R2 =
±1%
P1/P2 =
R1/R2 =
P1/P2 =
R1/R2 =
P1/P2 =
R1/R2 =
±1%
±1.5%
±6%
Notes:
1.
2.
3.
Linearity Error (%) = [(R1/R2) / (P1/P2) - 1] x 100
Accumulated error is the sum of the current dB segment linearity error plus the previous accumulated error.
Use the first CW Linearity error value entered in the +16 dBm to +20 dBm Linearity Data.
Manual 32089, Rev. A, December 2000
2-11
Series 8650A Universal Power Meters
2.3.3
GPIB Port Check
The following steps confirm that the GPIB port is functional:
1.
Set the 8650A to the desired address (the default is 13; see Section 2.2.1 of the Operation
Manual for instructions on how to set the GPIB mode and address).
2.
Connect the GPIB controller to the GPIB Port on the rear of the 8650A.
3.
Send the command:
*IDN?
(*IDN? is the IEEE 488.2 Common ID query. When addressed to talk after receiving the command, the 8650A will output a string that identifies itself as Model 8651A or 8652A.)
4.
Display the response on the controller.
This completes the performance verification test for the 8650A Universal Power Meter and its sensors.
If the instrument has performed as described in this chapter, it is correctly calibrated and within
specifications.
2-12
Manual 32089, Rev. A, December 2000
Adjustments & Performance Tests
2.3.4
Instrument Plus Power Sensor Linearity
Test Description
Connect the test setup as shown in Figure 2-5. The linearity will be tested over the range +20 dBm to
-60 dBm. At low power levels, the linearity measurement will include the uncertainty due to the zero set
specification. The procedure should be repeated for each sensor used with the 8650A.
Figure 2-5: Power Linearity Test Setup
When measuring the linearity of a high power sensor, the power output of the source as well as the
directional coupler coupling factor, must be increased. The power coefficient of the step attenuator will
also have to be considered. The specification of power coefficient for the Weinschel attenuator cited in
the Equipment List is: <0.005 dB/dB/W. The latter will affect the linearity of each 10 dB segment, and
make it necessary to expand the overall linearity specification by this quantity.
In assembling the test setup shown in Figure 2-5, keep in mind that if testing is to be conducted with
Low VSWR or High Power sensors, the optional RF Amplifier must have frequency and bandwidth
parameters to match the sensor’s characteristics (see the Sensor Selection Guide in Chapter 1 of the
Operation Manual, if unsure of characteristics), and the Directional Coupler must be increased as stated
above for the particular series of sensors. All Standard (Series 8030X) and True RMS (Series 8033X)
sensors are tested with a 10 dB Directional Coupler and without the optional RF amplifier.
Refer to the Linearity Data recording section of the Performance Verification Data recording sheets
located on pages 2-11. The tolerance is already entered for the various steps, and includes an allowance
for specified zero set errors at low power levels.
☛
NOTE: To ensure accurate and repeatable measurements, the 432A power meter should be
zeroed just before taking each reading that will be used to calculate P1 in the Power Meter
column of the Performance Verification Test Data Sheets starting on page 2-11.
Manual 32089, Rev. A, December 2000
2-13
Series 8650A Universal Power Meters
Setup Parameters
The following setup parameters should be accomplished prior to performing the Power Linearity test:
1.
The 8650A and sensor should be calibrated.
2.
The Averaging is set to AUTO.
[Sensor Setup] select Sensor A or B [Avg] set the number of Periods [Averages] [Auto]
Test Procedure
Extreme care is required in the following procedure since the accuracy requirements are critical to ensure the
most accurate test results.
Power readings are determined using the thermistor power meter in the same general way as given in the
Power Reference Level test. That is, P1 and P2 in the Power Meter reading column of the Performance
verification Test Data Sheet tables are calculated each time for the respective values of VCOMP, V0, and
V1 read on the DVM.
1.
Set the step attenuator to 70 dB. Turn the source power output off, and then zero the 8650A.
(The 8650A is zeroed by pressing [ZERO/CAL] and then following the softkey label instructions.)
2-14
2.
Set the step attenuator to 0 dB after the 8650A has zeroed.
3.
Set the power output of the RF source so that the thermistor power meter indicates 1.00 mW
±0.025 mV.
4.
Record the calculated power meter reading and the displayed 8650A reading in the correct
columns of the Linearity Data recording sheet on page 2-11.
5.
Set the power output of the RF source so that the thermistor power meter indicates 3.98 mW
±0.10 mW.
6.
Record the new calculated power meter reading and the new displayed 8650A reading as in
Step 4 above.
7.
Record the new calculated power meter reading and the new displayed 8650A reading as in
Step 4, above.
8.
Repeat using the other power set points in the Data Recording sheet on page 2-11. Note that
the Step Attenuator is used to generate the remaining 70 dB range of 10 dB steps for a total
range of 80 dB. Repeat Step 1, above, between each 10 dB step shown on the Linearity Data
Recording sheet.
9.
Make the calculations indicated on the Linearity Data sheet, and enter the values in the
appropriate blank spaces.
Manual 32089, Rev. A, December 2000
Adjustments & Performance Tests
2.4
Calibrator Service GPIB 488.2 Commands
2.4.1
Set or Query Cal Factor of the Calibrator for 50 MHz and
1 GHz (Option 12 Only)
TEST CALIB KB 50M|1G d
TEST CALIB KB 50M?|1G?
2.4.2
Set or Query Calibrator Output Power Level
TEST CALIB POWER d
where d is the dBm power level
TEST CALIB POWER?
2.5
Sensor EEPROM GPIB 488.2 Commands
2.5.1
General Sensor Data
TEST EEPROM A|B TYPE Nx9
TEST EEPROM A|B TYPE?
Example: TEST EEPROM A TYPE 80301, 1800101, 0, 59, 18, 15, 4, 01, 0
Set sensor A model, serial number, cal location (see below), minute, hour, day, month, year, password
flag.
Model range: 0 to 999999
Serial number range: 0 to 99999999
Cal location range: 0 to 3 (0 = factory; 1 = field rep; 2 = service center; 3 = customer site)
Password flag: 0 for disable, 1 for enable
2.5.2
Load Sensor Data to Edit Buffer and Write from Buffer to
Sensor EEPROM
TEST EEPROM A|B READ
TEST EEPROM A|B WRITE n
where n = password number in range of 0 to 999999
Publication 32089, Rev. A4, February 2002
2-15
Series 8650A Universal Power Meters
2.5.3
Cal Factor Table & Frequency Query
EEPROM A|B CALF?
Response: whole cal factor table sorted by frequency
EEPROM A|B FREQ?
Response: whole frequency table sorted by frequency
2.5.4
Standard Frequency Correction Factor Table & Standard
Frequencies Table
TEST EEPROM A|B CALFST d*
TEST EEPROM A|B CALFST?
TEST EEPROM A|B FREQST?
2.5.5
Standard Start Frequency, Standard Frequency
Increment, Number of Standard Frequencies, Number of
Special Frequencies
TEST EEPROM A|B CALFR d d n n
Query:
TEST EEPROM A|B CALFR?
Syntax Examples
NI 488.2
wrt$ = “TEST EEPROM A CALFR 2E9,1E9,17,1”
ibwrt pwrmtr%, wrt$
mNI VISA
wrt$= “TEST EEPROM A CALFR 2E9,1E9,17,1”
stat = viWrite(sesn, wrt$, Len(wrt$), retCount)
Description: This command sets the lowest frequency in the normal frequency correction table, the
frequency increment, the number of normal frequency correction points and the number of
special frequency correction points.
2.5.6
Special Frequency Correction Factor Table & Special
Frequencies Table
TEST EEPROM A|B CALFSP d*
TEST EEPROM A|B CALFSP?
TEST EEPROM A|B FREQSP d*
TEST EEPROM A|B FREQSP?
2-16
Publication 32089, Rev. A4, February 2002
Adjustments & Performance Tests
2.5.7
Cal Factor Write Example NI 488.2 Syntax
wrt$ = “TEST EEPROM A READ”
ibwrt pwrmtr%, wrt$
spfrqcf = “0.00”
’50 MHz cal factor
stanFreq =
“2.00,3.00,4.00,5.00,6.00,7.00,8.00,9.00,10.00,11.00,12.00,13.00,14.00,15.00,16.00,17.00,18.00”
‘standard frequency cal factors
wrt$ = “test eeprom a calfsp” + spfrqcf
ibwrt pwrmtr%, wrt$
‘load special frequency cal factor into edit buffer
wrt$ = “test eeprom a calfst” + stanfreq
ibwrt pwrmtr%, wrt$
‘load standard frequency cal factors into edit buffer
wrt$ = “test eeprom a write 0"
ibwrt pwrmtr%, wrt$
2.5.8
‘write cal factors from edit buffer to sensor EEPROM
Linearity Correction Factors
TEST EEPROM A|B CORR dX6
Correction factor range:
-99 to 99
TEST EEPROM A|B CORR?
2.5.9
Start/Stop Frequency, Power (dBm), Video R+ and RTEST EEPROM A|B SPEC dX5
TEST EEPROM A|B SPEC?
2.5.10
Sensor Temperature Compensation (807XXA Only)
TEST EEPROM A|B TC CLR|LO|MID|HI
TEST EEPROM A|B TC CUR?|LO?|MID?|HI?
Returns 9 values. Use the “CUR?” to query last temperature data after a calibration.
Publication 32089, Rev. A4, February 2002
2-17
Series 8650A Universal Power Meters
2-18
Publication 32089, Rev. A4, February 2002
3
Theory of Operation1
3.1
8650A Power Meter Theory of Operation
The power meter is basically a specialized microvoltmeter which measures the RF detector diode’s
voltage. A patented calibration system ‘linearizes’ the diode sensors while EEPROM stored data (in the
sensors) is used to apply frequency related correction factors.
3.1.1
General Theory
The 8650 power meter is used with a dual Schottky diode detector sensor module. It measures RF power
up to 40 GHz depending on which sensor is used. All Schottky diodes operate in the square law region
below –30 dBm. This means they give a DC voltage output proportional to the RF input voltage squared
(P=V3/R). The detector is a good 50 Ω termination. At higher power levels the diodes no longer give a
linear output directly proportional to input power. The detected voltage is measured with a known RF
power from –30 dBm to +20 dBm. The built in calibrator generates this accurate RF power at 50 MHz
and optionally at 1 GHz. This data is used to correct the meter readings.
Chopper
In
Chopper
The detector sensors are measured over their frequency range during manufacturing. Frequency
correction factors are stored in EEPROM in each sensor. When the front panel (or GPIB) FREQ switch
is pressed and the signal frequency is entered, the frequency correction factor is automatically calculated
in the displayed reading.
X1
X8
X64
X8
X8
X8
ADC
Mux
Gain Select
Trim
DAC
Front Panel/
Display
Main Processor
Calibrator
IEEE 488 RS-232
DSP
FPGA
Single Channel Meter
Shown
Figure 3-1: 8650A Meter Block Diagram
Manual 32089, Rev. A, December 2000
3-1
Series 8650A Universal Power Meters
3.1.2
Analog Section Operation
Single channel meters have one analog amplifier chain while the dual channel meters have two.
The input from the power sensor is a differential DC level (with modulation for all but 300 series
sensors). The 300 and 400 series sensors output the diode voltages directly. The 350, 600, and 700
series sensors have internal amplifiers. This DC level is amplified by selectable gain amplifiers,
controlled by the instrument processor and associated logic elements. In CW mode, for signal levels less
than –38 dBm, the balanced detector voltages from the sensor are switched (chopped) between the
inverting and non-inverting paths of the amplifier chain with CMOS solid-state switches. This
chopping is done in the sensors when using the 600 and 700 series sensors and in the meter itself when
using the 300 and 400 series sensors. This essentially produces classic amplitude modulation at a low
frequency rate thus converting the spectrum from around DC to around the chopping frequency. The
purpose is to eliminate the DC input offset drift of the amplifiers and to reduce the 1/f noise. The
amplifiers are DC coupled in this power meter because above –38 dBm the chopper is not used and the
DC must be amplified directly.
In modulation mode (MAP and BAP), the high frequency AC component is separately amplified and
remixed with the DC/low frequency amplifier output so that wide bandwidth can be achieved without
compromising DC performance. This is done both at the first gain block of the 8650 and in the 600 and
700 series sensors.
Both the amplitude modulated signal and the directly amplified DC go directly to the A-D converter.
In the chopping mode (below –38 dBm input), the demodulation is done using digital signal processing.
When the meter is zeroed, the instrument processor adjusts a D-A converter to sum a correction voltage
into the amplifier chain. The use of this correction voltage prevents saturation of the amplifiers at high
gain settings due to detector and amplifier offsets. A bias is also added to the A-D to achieve 13 bits of
resolution out of a 12-bit A-D.
The instrument power supply circuitry and the rear panel analog outputs are also located on the host
board. The power supply is a linear/switching type supplying +3.3, +5, +6.5, –6.5, +12 and –12 volts.
3.1.3
Digital Section Operation
Control for all instrument functions is provided by a combination of processing and programmable logic
elements. The Motorola 68340 microprocessor acts as the primary control element. It accepts user
interface and remote control information to set up the measurement processes and display/output the
results.
The output of each amplifier chain is a high speed Analog to Digital converter. This device is read by
the system FPGA and thus sends its data to a Texas Instruments Floating Point Digital Signal Processor.
These two devices provide the majority of the data acquisition and computation for the various
measurement modes of the meter.
3-2
Manual 32089, Rev. A, December 2000
Theory of Operation
3.1.4
Calibrator Operation
1 GHz
25 dB
6.25 dB
12.5 dB
50 MHz
EEPROM
U11
RF Thermistor
U10D
U20
DC Thermistor
Instrument CPU
DAC
U10A
Figure 3-2: Calibrator Block Diagram
The calibrator consists of two oscillators (one for the 50 MHz only version), an ovenized dual bridge
leveling circuit, and a switched attenuator. The operation of the calibrator and the calibration process
is covered by US patent 4,794,325 and various foreign patents.
Initially the oscillators are turned off. The amplifiers are not powered up. All the pads are switched in.
The oven temperature has reached 55 °C. The D-A converter voltage is zero.
The DC current heats the thermistors until they reach about 125 °C. When the thermistors are exactly
100 Ω ±0.1 %, the bridge is in balance. There is no error voltage to the integrators U10D, U10A. The
integrator will hold the voltage and current to the thermistor constant. The power to the thermistor is
constant. The temperature in the oven is constant. The heat transfer out the thermistor leads is
constant.
The voltage at the output of U10D is measured. The switches are flipped. The microprocessor adjusts
the DAC voltage until the comparator (U20) flips when the LSB is toggled. In effect the integrator
(U11) slams from one rail to the other. This forms a very accurate 16-bit voltmeter. The microprocessor
calculates the power dissipated in the bridge resistors. The power in the RF Thermistor is one third of
this. This is stored as P1. The power dissipated in the RF thermistor stays CONSTANT. Any RF power
that is dissipated by the thermistor adds to the DC power in the thermistor. The bridge integrator U10D
will decrease the DC power to remain in balance.
The voltage of U10D is measured with respect to U10A with the switches in their original positions.
Again, the microprocessor adjusts the D-A until the comparator flips for a LSB change. U10A simply
provides a reference for variations in the oven temperature.
Manual 32089, Rev. A, December 2000
3-3
Series 8650A Universal Power Meters
3.1.5
Setting the Calibrator Level
To set the calibrator power, an HP432 power meter with an HP8478B thermistor is placed at the
calibrator output. The 432 output is monitored with a DVM connected to a computer system. The 25
dB pad is switched out. The 50 MHz oscillator is turned on and the 50 MHz amplifiers are powered up.
As the RF power is applied to the thermistor, integrator U10D starts to decrease the DC power to the
thermistor. Integrator U11 senses the error voltage and decreases the gain of the oscillator buffer
amplifier. The actual output power reading is sent to the instrument microprocessor which adjusts the
DAC until there is exactly 1.000 mW at the calibrator output as measured by the HP432/8478 power
meter.
The data that was written to the DAC, to get 1.000 mW, is stored permanently in the EEPROM. This
sets the accuracy of the 1.000 mW reference. While the HP8478 thermistor is on the calibrator output,
it also sets the 1.000 mW reference for 1 GHz. The A-D value is also stored in the EEPROM.
3.1.6
Calibrating the Sensor/Meter Combination
The sensor is connected to the calibrator output. There is +3.00 dBm going to the detector in the
sensor. The 8650 meter measures the detector voltage and temporarily stores it. The 6.25 dB pad is
switched out. The microprocessor increases the DC power in the thermistor until the diode detector in
the sensor provides the same voltage as the temporarily stored value. The microprocessor calculates the
new DC power from the new DAC value. The difference between the new and the old DC power is the
change in RF power. 10 Log (PRFO/PRFN) is the value of the pad. The accuracy is independent of the
detector diode because it is only used at one level. The accuracy is only dependant upon the linearity of
the DAC and the 0.1 % resistors. The accuracy is much better than 0.01 dB. The other two pads are
measured in a similar manner.
During the three attenuator measurements, the detector voltage is measured every 6.25 dB from +20 to
–30 dBm. Then the calibrator is stepped in 1.000 dB steps. This data is used to correct the diode nonlinearity during normal meter usage. In effect, the detector is now calibrated.
3-4
Manual 32089, Rev. A, December 2000
4
Replaceable Parts
4.1
8650A Replaceable Parts
Table 4-1 is a list of assemblies that are available through Giga-tronics.
☛
NOTE: Due to the nature of the surface mount construction of the 8650A series power
meters, discrete components are not called out. It is assumed that the average field repair
facility will not have the ability to replace Surface Mount Parts.
Table 4-1: 8650A List of Assemblies
Nomenclature
Part Number
Cover Assembly
31395
Chassis Cover
31396
Cover Base Pan
31397
Front Feet
HFFB-00001
Rear Feet
HFFB-00002
Ground Strip
GGS0-00007
Front Bezel Subassembly
31391
Detector Input Assembly (single channel)
31383
Detector Input Assembly (dual channel)
31393
Front Panel Board
31351
Front Bezel
31400
Keypad
31404
LCD Display Module
32053
Calibrator
31394
Signal Processor Board (Dual Channel)
31371
Signal Processor Board (Single Channel)
31373
Digital (Host) Board
31356
Manual 32089, Rev. A, December 2000
4-1
Series 8650A Universal Power Meters
4-2
Manual 32089, Rev. A, December 2000
5
Troubleshooting
5.1
8650A Fault Isolation
Instrument Power on
Sequence
Is the Display On?
No
Yes
Is the Fuse blown?
Yes
Replace the fuse/repair
the fault
No
Correct the setting
No
Check/Repair the
Power Supply
No
Does the boot
sequence complete?
Is the Line Voltage
Selection Correct?
No
Yes
Note 1
Cycle power using the
On/Off switch
Yes
Is Front Panel Status
LED Green?
Yes
Note 2
OK now?
Yes
No
Does pressing a button
produce a 'click'?
Repair/Replace the
LCD display
No
Note 3
Unplug linecord, wait
2 minutes, reconnect
OK now?
Yes
Note 4
Re-load the firmware
Yes
Go to Page which
relates to problem
No
Note 4
Re-load the firmware
OK now?
No
Yes
Replace the Host
Board
Figure 5-1: Fault Isolation Tree (Power on Sequence)
Manual 32089, Rev. A, December 2000
5-1
Series 8650A Universal Power Meters
Displays "Bad Sensor"/
"No Sensor Attached"
Note 5
Is it a Giga-tronics cable?
Inspect the cable for
any of the following:
Any bent or broken pins?
Are both ends tight?
Is the cable OK?
No
Replace the cable
Yes
Note 6
Does another sensor
work?
Yes
Replace the sensor
No
Check detector input
flex cable. OK now?
Done
Yes
No
"No Sensor Attached"
"Bad Sensor"
Note 7
Check +/- 6.5 VDC
supply lines. OK?
No
Repair/replace faulty
component
Yes
Repair/replace the
signal processor board
No
From the Service
Menu, clear the
memory. OK now?
Yes
Done
Figure 5-2: Fault Isolation Tree (Sensor Problems)
5-2
Manual 32089, Rev. A, December 2000
Troubleshooting
Sensor will not
calibrate
Note 8
Error beep during
"Check Sensor"
Yes
Is sensor RF connector
center pin OK?
Repair/replace the
sensor
No
Yes
Reseat sensor on
calibrator. OK now?
No
Clear memory. OK
now?
No
No
Check calibrator
output. Is it OK?
Note 9
Note 11
No
Repair/replace the
calibrator
No
Repair/replace the
Signal Processor board
Yes
Error beep during
"Zeroing Sensor"
Yes
Does another sensor
work?
Note 8
Yes
Repair/replace the
sensor
No
Note 8
Error beep during
"Calibrating Sensor"
Yes
Does another sensor
work?
Yes
Repair/replace the
sensor
Yes
Repair/replace the
Signal Processor board
No
Note 10
Check calibrator
output. Is it OK?
Note 11
No
Repair/replace the
calibrator
Figure 5-3: Fault Isolation Tree (Sensor Problems) Continued
Manual 32089, Rev. A, December 2000
5-3
Series 8650A Universal Power Meters
Note 8
Excessive
measurement error?
Yes
Is sensor VSWR in
specification?
No
Repair/replace the
sensor
No
Recalibrate/repair the
calibrator
Yes
Note 11
Is the calibrator output
accurate?
No
Yes
Repair/replace the
signal processor board
Note 12
Excessive zero errors
Yes
Perform zero drift test.
Pass?
Done
Yes
No
Note 13
Is there a DC
component on the RF?
Yes
Use a DC block
Yes
Done
No
Check detector input
flex cable. OK now?
No
No
Check for excessive
power supply ripple
Incorrect low level
readings
Yes
Review low level
application note
Check for noise
sources (fans, motors)
Note 8
Does another sensor
work properly?
No
Yes
Repair/replace the
sensor
Yes
Repair/replace the
power supply
No
Is power supply ripple
excessive?
No
Continue on the next
page
Repair/replace the host
or signal processor
Figure 5-4: Fault Isolation Tree (Measurement Problems)
5-4
Manual 32089, Rev. A, December 2000
Troubleshooting
Note 14
Crest factor errors
Yes
Test crest factor (see
note). Pass?
Yes
Done
No
Note 8
Does another sensor
work properly?
Yes
Repair/replace the
sensor
No
Repair/replace the
signal processor board
Figure 5-5: Fault Isolation Tree (Measurement Problems) Continued
Manual 32089, Rev. A, December 2000
5-5
Series 8650A Universal Power Meters
Meter locks up
Yes
Cycle power with on/off
switch. OK now?
Done
Yes
No
Remove line cord, wait
2 minutes, reconnect.
OK now?
Yes
No
Clear memory. OK
now?
Yes
No
Repair/replace the host
board
No
Reload Firmware. OK
now?
Yes
Note 15
Remote operation
problem
Yes
Perform *idn? and
check response. OK?
Yes
Repair/replace the host
board
No
Done
Analog output failure
Yes
Check configuration
(address,etc). OK
now?
Yes
Clear memory and
reconfigure Analog
Out. OK now?
No
Done
Yes
No
Repair/replace the host
board
No
Check the menu
configuration. OK
now?
Yes
Figure 5-6: Fault Isolation Tree (Other Problems)
5-6
Manual 32089, Rev. A, December 2000
Troubleshooting
Notes:
1.
2.
3.
4.
5.
6.
7.
8.
9.
10.
11.
12.
13.
14.
The instrument power supply generates ± 6.5 V, ± 12 V, + 5 V and + 3.3 V. Check each of these voltages. The supply is
transformer operated and uses individual switch mode regulators for the individual voltages.
If the power supplies are OK and pressing buttons produces a ‘click’, then most likely the instrument computer is functioning
and the LCD display itself is defective or the backlight (or its inverter power supply) needs replacement. The backlight does
have a finite lifetime.
Unplugging the instrument removes standby power and therefore does a more complete reset.
Although this is not a highly likely failure mode, the instrument firmware may be easily reloaded from a PC. The code is
available on the company website: www.gigatronics.com and the procedure for firmware download is located in the
operation manual.
The cables used by Agilent (HP) will fit the connectors on this meter but they do not contain sufficient wires to operate the
sensors.
If another sensor is available, try substituting it.
These power connections are part of the flex cables going from the sensor connectors to the signal processor board.
Following any repair to a sensor, the sensor must be tested for proper VSWR and may need to have the frequency correction
factors determined again.
The calibrator output may be tested using the front panel calibrator control menu and another power meter. The intent here
is not to determine accuracy but functionality.
The calibrator can be removed from the instrument as a sub-assembly and replaced. The calibrator stores its own factory
calibration data and needs no re-calibration when installed.
See the appropriate section in this manual for the procedure. The purpose of the procedure is to determine, under controlled
conditions, the meter and sensor meet the drift specifications.
Giga-tronics power sensors are DC coupled. There must be NO DC component on the measured signal.
The crest factor measurement may be verified by measuring a RF source which has 50% amplitude modulation. Under these
conditions, the crest factor should be 3 dB ± 0.3 dB.
Sending *idn? Should return the meter model, serial number and firmware version. Proper operation of this query verifies
the IEEE 488 hardware and the general software operation. If there is no response, the host board is likely defective. Do be
certain that the instrument address matches the command address and that all cables are properly attached and known to be
good.
Manual 32089, Rev. A, December 2000
5-7
Series 8650A Universal Power Meters
5.2
8650A Disassembly/Assembly Instructions
The following instructions are provided to assist in the removal and replacement of the various
subassemblies in the 8650A.
5.2.1
5.2.2
Cover
1.
Unplug the line cord from the instrument.
2.
Remove the three #6 pan head phillips screws on the rear panel.
3.
Set the instrument front panel on a soft surface (a cloth or piece of cardboard) such that the rear
panel is up.
4.
Hold the cover near the rear panel with both hands and use your thumbs to press on the rear panel
BNC connectors and the power entry module while lifting the cover. The cover has EMI
grounding fingers around the front edge which make the cover fit tightly.
5.
Carefully lift the cover off the instrument and set the instrument down.
6.
When replacing the cover slip it over the rear panel connectors and, with the front panel again
resting on a soft surface press the cover onto the front casting. Be sure the EMI grounding fingers
are properly in place.
7.
Replace the three screws.
Analog (Signal Processing) PC Board
1.
Unplug the line cord from the instrument.
2.
Remove the instrument cover.
3.
Carefully unplug the flex cable(s) from the socket(s) near the front of the board. First lift up the
outer ‘U’ shaped shell of the connector on the board then pull straight up on the flex cable to
remove it.
4.
Remove the large bolt from the front corner of the board near the sensor connector(s).
5.
Pull up on the three plastic fasteners on the remaining corners of the board. These are captive and
do not come out completely.
6.
Remove the board from the instrument.
☛
5-8
NOTE: There is a multi-pin connector on the bottom of this board which connects to the Host
(digital) board. Lift the board straight up with a slight rocking motion to un-mate the
connector.
7.
To replace the board, first line up the pins on the multi-pin connector, then press down on the
board. Next press down on the three plastic latches and reinstall the large bolt. Now make sure the
‘U’ shaped outer shell of the flex cable socket is up and carefully press the flex cable(s) into the
socket(s). Press down the shell to lock the connector.
8.
Replace the instrument cover.
Manual 32089, Rev. A3, August 2001
Troubleshooting
5.2.3
5.2.4
Calibrator
1.
Unplug the line cord from the instrument.
2.
Remove the instrument cover.
3.
Release the ribbon cable connector from the calibrator using the extractor handles on the calibrator
ribbon cable socket.
4.
Remove the three flat head screws holding the calibrator assembly to the side of the instrument.
5.
Lift the calibrator out of the instrument.
6.
When replacing the calibrator, slide the output connector through the hole in the panel, replace
the three screws, and reinsert the ribbon cable connector. Be certain that the extractor handles
lock in place.
7.
Replace the instrument cover.
Digital (Host) PC Board
1.
Unplug the line cord from the instrument.
2.
Remove the instrument cover.
3.
Remove the calibrator.
4.
Disconnect the ribbon cable going to the rear panel RS-232 connector.
5.
Disconnect the ribbon cable going to the rear panel IEEE 488 connector.
6.
Disconnect the power transformer connector from the board by pressing on the two plastic ‘buttons’
on the connector and pulling straight up with a slight rocking motion.
7.
Carefully unplug the flex cable going to the front panel from its socket. First lift up the outer ‘U’
shaped shell of the connector on the board then pull straight up on the flex cable to remove it.
8.
Pull up on the four plastic fasteners on the corners of the board. These are captive and do not come
out completely.
9.
Remove the board from the instrument.
☛
NOTE: There is a multi-pin connector on the bottom of this board which connects to the
Analog board. Lift the board straight up with a slight rocking motion to un-mate the
connector.
10. To replace the board, insert the BNC connectors through the holes in the rear panel, next line up
the pins on the multi-pin connector, then press down on the board. Next press down on the four
plastic latches. Now make sure the ‘U’ shaped outer shell of the flex cable socket is up and carefully
press the flex cable into the socket. Press down the shell to lock the connector. Re-connect the
power transformer, IEEE 488 ,and RS-232 connectors.
11. Reinstall the calibrator.
12. Replace the instrument cover.
Manual 32089, Rev. A3, August 2001
5-9
Series 8650A Universal Power Meters
5.2.5
Front Panel Assembly
1.
Unplug the line cord from the instrument.
2.
Remove the instrument cover.
3.
Carefully unplug the flex cable(s) from the socket(s) near the front of the analog board. First lift up
the outer ‘U’ shaped shell of the connector on the board then pull straight up on the flex cable to
remove it.
4.
Carefully unplug the flex cable from the front panel to the digital board from its socket. First lift up
the outer ‘U’ shaped shell of the connector on the board then pull straight up on the flex cable to
remove it.
5.
Peel off the plastic strips on each side of the front panel casting to reveal the mounting screws.
Since it is likely that these will not re-adhere, new strips may be ordered from Giga-tronics (P/N
31347).
6.
Remove the four screws, two on each side of the front panel casting and slide the panel forward.
7.
Remove the single screw from the shield (near the sensor input area). Just loosen the two at the
other end. Now slide the shield toward the sensor input area and remove it.
8.
Remove the display assembly (with integral backlight) by first unplugging the backlight power
connector on the keyboard interface board. Now remove the three screws at the corners (one
corner has a locating pin).
☛
9.
NOTE: There is a connector on the top edge of the board. To un-mate this connector,
carefully lift (pry from the edges) this side of the display board
The keyboard interface board may now be removed after the five mounting screws are removed.
10. Reverse the above procedure to re-assemble the front panel. Be sure to carefully align the
connector pins of the display when replacing it and to re-connect the backlight power connector.
11. Mount the front panel assembly to the instrument.
☛
NOTE: Use caution when mounting and ensure flex cables are not pinched between chassis
and front panel assembly before tightening mounting screws.
Now make sure the ‘U’ shaped outer shells of the flex cable sockets are up and carefully press the
flex cables into their sockets. Press down the shells to lock the connectors.
12. Replace the instrument cover.
5-10
Manual 32089, Rev. A3, August 2001
Index
Series 8650A Universal Power Meters Index
Numerics
I
1 mW Reference Output Adjustment 2-1
8650A Fault Isolation 5-1
8650A Power Meter Theory of Operation 3-1
8650A Replaceable Parts 4-1
8650A Universal Power Meter Specifications 1-2
Installation
8650A Specifications 1-2
Environmental Requirements 1-1
Safety 1-1
Instrument Plus Power Sensor Linearity 2-13
Setup Parameters 2-14
Test Description 2-13
Test Procedure 2-1
Introduction 1-1, 2-1
Theory of Operation 3-1
A
About This Manual v
Analog Section Operation 3-2
C
Calibrating the Sensor/Meter Combination 3-4
Calibration Procedure 2-1
Calibrator 2-5
Calibrator Attenuator Test 2-8
Calibrator Frequency Check 2-9
Calibrator Operation 3-3
Calibrator Output 1-2
Calibrator Output Power 2-1
Calibrator Performance and Output Power Reference Level
2-5
Conventions Used in This Manual vii
D
Digital Section Operation 3-2
Display Brightness Adjustment 2-3
E
M
Maintenance
Theory of Operation 3-1
Maximum Output Power 2-7
O
Output Power Reference Level 2-5
P
Performance Verification
Calibrator Procedure 2-5
Equipment Requirement 2-4
GPIB Port Check 2-1
Instrument Plus Power Sensor Linearity 2-13
Output Power Reference Level 2-5
Performance Verification Tests 2-4
Preparation 4
R
Environmental Requirements 1-1
Equipment Requirements 2-1
G
General Theory 3-1
GPIB Port Check 2-1, 2-12
Record of Manual Changes ix
Remote Operation 1-5
Return Loss 2-8
S
Safety Precautions 1-1
Setting the Calibrator Level 3-4
Specifications 1-2
T
Theory of Operation 3-1
Manual 32089, Rev. A, December 2000
Index-1