1
SL1400
ScopeCorder LITE
IM 701240-01E
2nd Edition
Product Registration
Thank you for purchasing YOKOGAWA products.
YOKOGAWA provides registered users with a variety of information and
services.
Please allow us to serve you best by completing the product registration
form accessible from our homepage.
http://www.yokogawa.com/tm/
PIM 103-01E
Thank you for purchasing the SL1400 ScopeCorder LITE.
This user’s manual contains useful information about the instrument’s functions and
operating procedures and lists the handling precautions of the SL1400. To ensure
correct use, please read this manual thoroughly before operation. After reading the
manual, keep it in a convenient location for quick reference whenever a question arises
during operation.
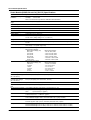
The following manuals are provided for the SL1400. Please read all of them.
Manual Title
Manual No.
Description
SL1400 ScopeCorder
LITE User’s Manual
IM 701240-01E
This manual. Explains all functions and
procedures of the SL1400 excluding the
communication functions.
SL1400 ScopeCorder
LITE Communication
Interface User’s Manual
(CD-ROM)
IM 701240-17E
Describes the communication interface
functions.
Notes
• The contents of this manual are subject to change without prior notice as a result of
continuing improvements to the instrument’s performance and functions. The figures
given in this manual may differ from those that actually appear on your screen.
• Every effort has been made in the preparation of this manual to ensure the accuracy
of its contents. However, should you have any questions or find any errors, please
contact your nearest YOKOGAWA dealer.
• Copying or reproducing all or any part of the contents of this manual without the
permission of Yokogawa Electric Corporation is strictly prohibited.
• The TCP/IP software of this product and the document concerning the TCP/IP
software have been developed/created by YOKOGAWA based on the BSD
Networking Software, Release 1 that has been licensed from University of California.
Trademarks
• Microsoft, Internet Explorer, MS-DOS, Windows, Windows NT, and Windows XP are
either registered trademarks or trademarks of Microsoft Corporation in the United
States and/or other countries.
• Adobe, Acrobat, and PostScript are trademarks of Adobe Systems Incorporated.
• Zip is either a registered trademark or trademark of Iomega Corporation in the United
States and/or other countries.
• UNIX is either a registered trademark or trademark of The Open Group in the United
States and/or other countries.
• Compact-VJE is a trademark of Yahoo Japan Corporation.
• GIGAZoom ENGINE are pending trademark of Yokogawa Electric Corporation.
• For purposes of this manual, the TM and ® symbols do not accompany their
respective trademark names or registered trademark names.
• Other company and product names are trademarks or registered trademarks of their
respective holders.
Revisions
• 1st Edition: June 2006
• 2nd Edition: October 2006
2nd Edition : October 2006(YK)
All Rights Reserved, Copyright © 2006 Yokogawa Electric Corporation
IM 701240-01E
i
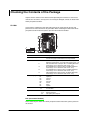
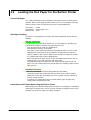
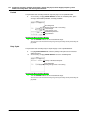
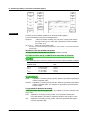
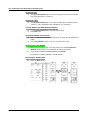
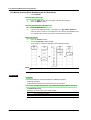
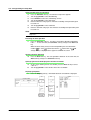
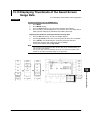
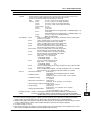
Checking the Contents of the Package
Unpack the box and check the contents before operating the instrument. If some of the
contents are not correct, or if any items are missing or damaged, contact the dealer from
whom you purchased them.
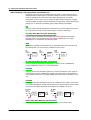
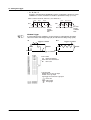
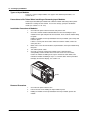
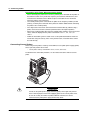
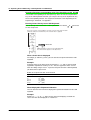
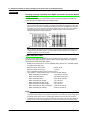
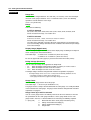
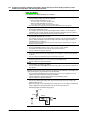
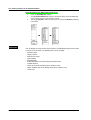
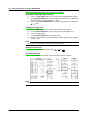
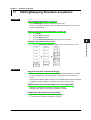
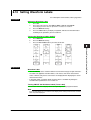
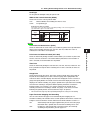
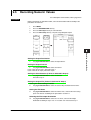
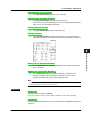
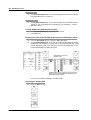
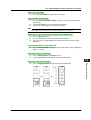
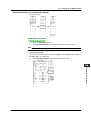
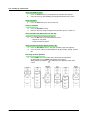
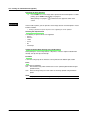
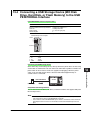
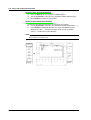
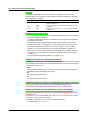
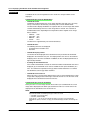
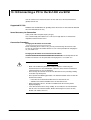
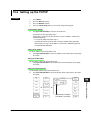
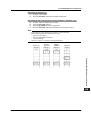
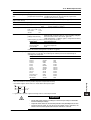
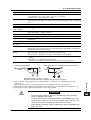
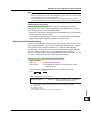
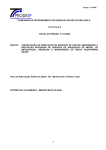
SL1400
Check that the model name and suffix code given on the name plate on the left side
panel of the SL1400 match those on your order. When contacting the dealer from which
you purchased the instrument, please give them the instrument number.
LINK
GP-IB (IEEE488)
100BASE-TX
ACT
POWER
SCSI
VIDEO OUT (SVGA)
ON
OFF
USB
USB PERIPHERAL
TRIG OUT/
EXT CLK IN
Made in Japan
TRIG IN
NO.
LOGIC A
LOGIC B
MODEL
SUFFIX
NO.
START/
STOP
SERIAL (RS-232)
100-120V/200-240V AC
300VA MAX 50/60Hz
MODEL
SUFFIX
Made in Japan
MODEL
Suffix Code Description
701240 (SL1400)
Power cord
The input module is not included with the instrument.
See the next page for information on the input module.
-D
UL/CSA Standard power cord (Part No.:A1006WD)
[Maximum rated voltage: 125 V; Maximum rated current: 7 A]
VDE Standard Power Cord (Part No.: A1009WD) [Maximum
rated voltage: 250 V; Maximum rated current: 10 A]
BS Standard Power Cord (Part No.: A1054WD) [Maximum
rated voltage: 250 V; Maximum rated current: 10 A]
AS Standard Power Cord (Part No.: A1024WD) [Maximum
rated voltage: 250 V; Maximum rated current: 10 A]
GB Standard Power Cord (Part No.: A1064WD) [Maximum
rated voltage: 250 V; Maximum rated current: 10 A]
-F
-Q
-R
-H
Default language
Built-in media drive
Options
-HE
-HJ
-HC
-HK
-HG
-HF
-HL
-HP
-J0
-J3
/C8
/C10
/P4
English
Japanese
Chinese
Korean
German
French
Italian
Spanish
No built-in media drive
PC card drive
Internal hard disk 40 GB (FAT32)
Ethernet interface
Four probe power outputs
NO. (Instrument Number)
When contacting the dealer from which you purchased the instrument, please give them
this number.
ii
IM 701240-01E
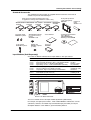
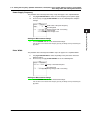
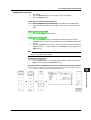
Checking the Contents of the Package
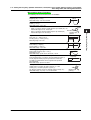
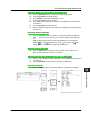
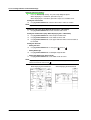
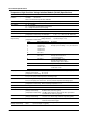
Standard Accessories
The standard accessories below are supplied with the instrument. Check that all
contents are present and undamaged.
Power Cord (one of the following power cords
is supplied according to the instrument’s suffix codes)
UL/CSA Standard
A1006WD
VDE Standard
A1009WD
D
Roll paper flange
B8024CA 2 pieces
BS Standard
A1054WD
F
AS Standard
A1024WD
Q
AAA Alkaline batteries
GB Standard
A1064WD
H
R
• User’s Manual
• Communication Interface
User’s Manual
(CD-ROM) B8024YY
• Handling of the CD-ROM
(for acquisition memory
backup)
A1070EB 4 cells
Cover panels
B8023EN 8 pieces
Rubber feet
B9989EX 4 pieces
(1 sheet)
Front panel protection
cover (transparent)
Printer roll
B8023EA
paper
701966 1 roll
Soft case
B9946EB
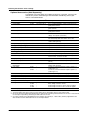
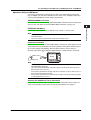
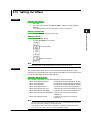
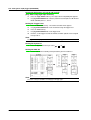
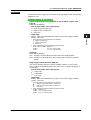
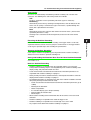
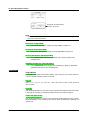
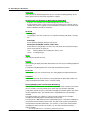
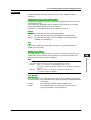
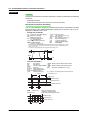
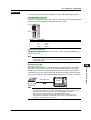
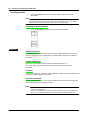
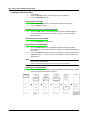
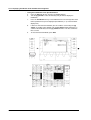
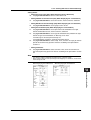
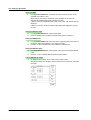
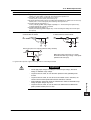
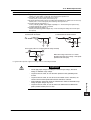
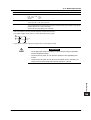
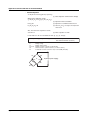
Input Modules (Sold Separately)
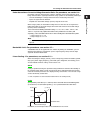
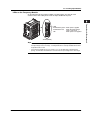
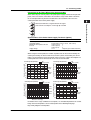
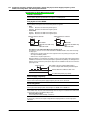
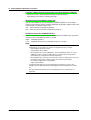
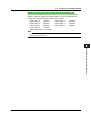
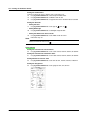
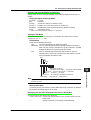
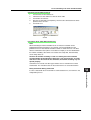
Check that the MODEL indicated on the input module is what you ordered.
MODEL
Name
Abbreviation
701250
701251
701255
701260
High-Speed 10 MS/s, 12-Bit Isolation Module
High-Speed High-Resolution 1 MS/s, 16-Bit Isolation Module
High-Speed 10 MS/s, 12-Bit Non-Isolation Module
High-Voltage 100 kS/s, 16-Bit Isolation Module (with RMS)
HS10M12
HS1M16
NONISO_10M12
HV (with RMS)
701261
701262
701265
Universal (Voltage/Temp.) Module
Universal (Voltage/Temp.) Module (with AAF)
Temperature, High Precision Voltage Isolation Module
UNIVERSAL
UNIVERSAL (AAF)
TEMP/HPV
701270
701271
Strain Module (NDIS)
Strain Module (DSUB, Shunt-Cal)
STRAIN_NDIS
STRAIN_DSUB
701275
Acceleration/Voltage Module (with AAF)
ACCL/VOLT
701280
Frequency Module
FREQ
701250
HS10M12
MODEL
SUFFIX
MODEL
SUFFIX
NO.
Made in Japan
NO.
Made in Japan
Top row:
MODEL
Bottom row: Abbreviated name
This user’s manual refers to the input modules by MODEL (abbreviation).
For example, the High-Speed 10 MS/s, 12-Bit Isolation Module is indicated as 701250
(HS10M12). However, the module may be indicated only by the model (701250) if a
description about the same module is given immediately before it.
IM 701240-01E
iii
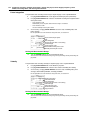
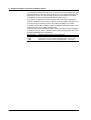
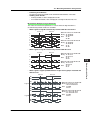
Checking the Contents of the Package
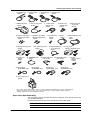
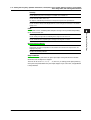
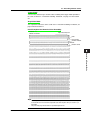
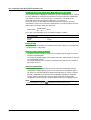
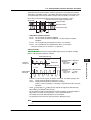
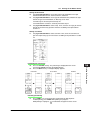
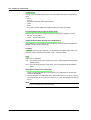
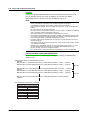
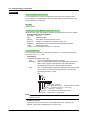
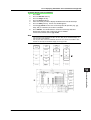
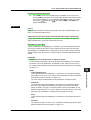
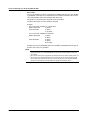
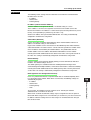
Optional Accessories (Sold Separately)
The optional accessories below are available for purchase separately. Check that all
contents are present and undamaged. For information and ordering, contact your
nearest YOKOGAWA dealer.
Model
Safety standard*1
1. Isolated probe
700929
1000 Vrms CAT II
10:1 safety probe, for the 701250/701251
2. Current probe
701930
300 Vrms CAT III
DC to 10 MHz bandwidth. Used by connecting to the
probe power terminal
3. Current probe
701931
300 Vrms CAT III
DC to 2 MHz bandwidth. Used by connecting to the probe
power terminal
4. Current probe
701933
300 Vrms CAT I
DC to 50 MHz bandwidth. Used by connecting to the
probe power terminal
5. Differential probe
700924
1000 Vrms CAT III*2
Switchable between 1000:1 and 100:1Measurable
voltage: 1400 Vpeak (1000 Vrms)
6. 10:1 passive probe
701940
–
For non-isolated input on the 701255: 600 V or less
For isolated input other than above: 42 V or less
7. 1:1 BNC safety adapter lead
701901
1000 Vrms CATII
Used with the 701954, 701959, 758922, 758929, or
758921 sold separately
8. Alligator clip (dolphin type)
701954
1000 Vrms CAT III
2 pieces in one set (red/black)
9. Safety mini-clip (hook type)
701959
1000 Vrms CAT II
2 pieces in one set (red/black)
10. Alligator clip adapter
758922
300 Vrms CAT II
2 pieces in one set
11. Alligator clip adapter
758929
1000 Vrms CAT II
2 pieces in one set
12. Fork terminal adapter
758921
1000 Vrms CAT II
2 pieces in one set (red/black), for 4-mm screws
Name
13. Cables
*3
Description
366926
–
For measuring low voltage of less than or equal to 42 V
14. Banana-alligator clip cable
366961
–
For measuring low voltage of less than or equal to 42 V
for the 701261, 701262, or 701265
15. High-speed logic probe
700986
–
42 V or less, 8-bit non-isolated/response speed of 1 µs
16. Isolated logic probe
700987
250 Vrms CAT II
8 bits, each channel isolated, response speed of 20 ms
(for AC)
17. Measurement lead for
isolated logic
758917
1000 Vrms CAT II
2 pieces in one set, used with the 758922 or 758929
adapter sold separately
18. Logic probe
702911
–
702912
–
35 V or less, 8-bit non-isolated, response speed 3 µs,
(lead length: 1 m)
35 V or less, 8-bit non-isolated, response speed 3 µs,
(lead length: 3 m)
19. Conversion adapter
366928
–
42 V or less, BNC (jack) to RCA (plug)
20. Modular cable
366973
–
For external start/stop
21. Safety BNC cable (1 m)
701902
1000 Vrms CAT II
–
22. Safety BNC cable (2 m)
701903
1000 Vrms CAT II
–
23. Safety BNC-to-banana adapter 758924
500 Vrms CAT II
–
24. Bridge head
701955
701956
701957
701958
–
–
–
–
NDIS, bridge resistance: 120 Ω
NDIS, bridge resistance: 350 W
DSUB, bridge resistance: 120 W, shunt-cal support
DSUB, bridge resistance: 350 Ω, shunt-cal support
25. Soft carrying case
701967
–
With three pockets
Sold in units of 1 piece.
*1 The actual voltage that can be used is the lower voltage of the specifications of the SL1400 and the cable.
*2 Be sure to connect the GND lead provided with the 700924 to the functional ground terminal of the SL1400. A measurement
of 1400 Vpeak is possible by connecting the GND lead to the SL1400.
*3 Use cables (366926) that YOKOGAWA has been shipping since February 4, 1998. Cables (366926) shipped before this
date cannot be used in combination with the SL1400 input modules.
iv
IM 701240-01E
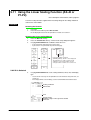
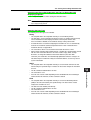
Checking the Contents of the Package
2. Current probe
701930
1. Isolated probe
700929
6. 10:1 passive probe
701940
5. Differential probe
700924
10. Alligator clip adapter
(Rated voltage 300 V)
758922
24. Bridge head
701955(NDIS, 120Ω)
13. Cable
366926
17. Measurement lead
for isolated logic
758917*
21. Safety BNC cable
(1m) 701902
Bridge head
701956(NDIS, 350Ω)
8. Alligator clip
(dolphin type)
701954
12. Fork terminal
adapter
758921
16. Isolated logic probe
700987
20. GO/NO-GO cable
366973
4. Current probe
701933
7. 1:1 BNC safety
adapter lead
701901*
11. Alligator clip adapter
(Rated voltage 1000 V)
758929
15. High-speed logic probe
700986
19. Conversion
adapter
366928
3. Current probe
701931
14. Banana-alligator clip
cable
366961
18. Logic probe
702911 (1 m)/702912 (3 m)
22. Safety BNC cable
(2m) 701903
Bridge head
701957(DSUB, 120Ω)
9. Safety mini-clip
(hook type)
701959
23. Safety
BNC-to-banana
adapter
758924
Bridge head
701958(DSUB, 350Ω)
25. Soft carrying case
701967
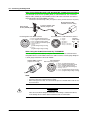
* The 1:1 BNC safety adapter lead (701901) is used by combining the following accessories sold separately:
alligator clip (dolphin type 701954), safety mini-clip (hook type: 701959), alligator adapter (758922 or
758929), and/or the fork terminal adapter (758921).
Spare Parts (Sold Separately)
The spare parts below are available for purchase separately. Check that all contents are
present and undamaged.
For information about the spare parts and ordering, contact your dealer.
IM 701240-01E
Name
Part No.
Minimum Q’ty
Note
Printer roll paper
701966
6
Thermal paper, 210mm × 20 m
v
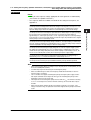
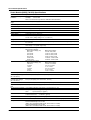
Safety Precautions
This instrument is an IEC safety class I instrument (provided with a terminal for
protective earth grounding).
The general safety precautions described herein must be observed during all phases of
operation. If the instrument is used in a manner not specified in this manual, the
protection provided by the instrument may be impaired. Yokogawa Electric Corporation
assumes no liability for the customer’s failure to comply with these requirements.
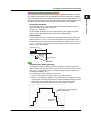
The following symbols are used on this instrument.
Warning: handle with care. Refer to the user’s manual or service manual. This
symbol appears on dangerous locations on the instrument which require special
instructions for proper handling or use. The same symbol appears in the
corresponding place in the manual to identify those instructions.
Protective ground terminal
Functional ground terminal (do not use this terminal as a protective ground
terminal.)
Alternating current
ON (power)
OFF (power)
vi
IM 701240-01E
Safety Precautions
Be sure to comply with the precautions below. Not complying might result in injury or
death.
WARNING
Use the Correct Power Supply
Before connecting the power cord, ensure that the source voltage matches the
rated supply voltage of the instrument and that it is within the maximum rated
voltage of the provided power cord.
Use the Correct Power Cord and Plug
To prevent electric shock or fire, be sure to use the power cord supplied by
YOKOGAWA. The main power plug must be plugged into an outlet with a
protective earth terminal. Do not disable this protection by using an extension
cord without protective earth grounding.
Connect the Protective Grounding Terminal
Make sure to connect the protective earth to prevent electric shock before
turning ON the power. The power cord that comes with the instrument is a threeprong type power cord. Connect the power cord to a properly grounded threeprong outlet.
Do Not Impair the Protective Grounding
Never cut off the internal or external protective earth wire or disconnect the
wiring of the protective earth terminal. Doing so poses a potential shock hazard.
Do Not Operate with Defective Protective Grounding or Fuse
Do not operate the instrument if the protective earth or fuse might be defective.
Also, make sure to check them before operation.
Do Not Operate in an Explosive Atmosphere
Do not operate the instrument in the presence of flammable liquids or vapors.
Operation in such an environment constitutes a safety hazard.
Do Not Remove Covers
The cover should be removed by YOKOGAWA’s qualified personnel only.
Opening the cover is dangerous, because some areas inside the instrument
have high voltages.
Ground the Instrument before Making External Connections
Securely connect the protective grounding before connecting to the item under
measurement or to an external control unit. If you are going to touch the circuit,
make sure to turn OFF the circuit and check that no voltage is present.
Precautions to Be Taken When Using the Modules
• Do not apply input voltage exceeding the maximum input voltage, withstand
voltage, or allowable surge voltage.
• To prevent the possibility of electric shock, be sure to furnish protective earth
grounding of the SL1400.
• To prevent the possibility of electric shock, be sure to fasten the module screws.
Otherwise, the electrical protection function and the mechanical protection
function will not be activated.
• Avoid continuous connection under an environment in which the allowable surge
voltage or greater voltage may occur.
IM 701240-01E
vii
Safety Precautions
Precautions to Be Taken When Using the Probes
• When measuring high voltages using the 701250 (HS10M12) or the 701251
(HS1M16), use the isolated probe (700929), 1:1 safety cable (combination of
701901 and 701954), or differential probe (700924).
• Be sure to connect the GND lead of the differential probe (700924) to the
functional ground terminal of the SL1400. High voltage may appear at the BNC
connector of the differential probe. Be sure to connect the GND lead to the
SL1400 before connecting the probe to the parameter to be measured.
• When using the 701255 (NONISO_10M12), be sure to fasten the module
screws. Fastening the module screws activates the protection function and the
non-isolation function. It is extremely dangerous if you do not fasten the screws.
In addition, when measuring high voltage above 42 V, be sure to use the
passive probe (701940).
• The BNC part of the passive probe (701940) is made of metal. Therefore, use
the probe at 42 V or less for isolated inputs (701250 (HS10M12), 701251
(HS1M16), 701260 (HV (with RMS)), etc.) for safety reasons. (Do not connect
voltage above 42 V to both the High and Low sides.)
For non-isolated inputs (701255 (NONISO_10M12), etc.), fasten the module
screws as described before.
• When applying high voltage using the 701260 (HV (with RMS)), use the 1:1
safety cable (combination of 701901 and 701954) or the isolated probe
(700929).
• The measurement category of the 701260 (HV (with RMS)) is 400V-CAT II for
the low side and 700V-CAT II for the high side. Use caution because the
overvoltage tolerance differs between the low and high sides.
viii
IM 701240-01E
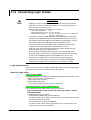
Conventions Used in This Manual
Markings
The following markings are used in this manual.
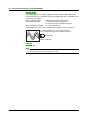
Improper handling or use can lead to injury to the user or damage
to the instrument. This symbol appears on the instrument to
indicate that the user must refer to the users manual for special
instructions. The same symbol appears in the corresponding place
in the user’s manual to identify those instructions. In the manual,
the symbol is used in conjunction with the word “WARNING” or
“CAUTION.”
WARNING
Calls attention to actions or conditions that could cause serious or
fatal injury to the user, and precautions that can be taken to prevent
such occurrences.
CAUTION
Calls attentions to actions or conditions that could cause light injury
to the user or damage to the instrument or user’s data, and
precautions that can be taken to prevent such occurrences.
Note
Calls attention to information that is important for proper operation
of the instrument.
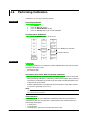
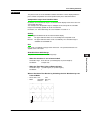
Notations Used in the Procedural Explanations
On pages that describe the operating procedure in Chapters 3 through 17, the following
notations are used to distinguish the procedure from their explanations.
Procedure
Explanation
Follow the numbered steps. All procedures are written with
inexperienced users in mind; experienced users may not need to
carry out all the steps.
This section describes the setup items and the limitations regarding
the procedures. A detailed description of the function is not
provided in this section. For a detailed explanation of the function,
see chapter 2.
Notation of User Controls
Panel Keys and Soft Keys
Bold characters used in the procedural explanations indicate characters that are marked on the
panel keys or the characters of the soft keys or menus displayed on the screen.
Jog Shuttle+SELECT
Jog shuttle+SELECT indicates selecting or setting parameters and entering values using the jog
shuttle, the SELECT key, and other keys. For details on the procedure, see section 4.1 or 4.2.
Unit
k: Denotes 1000.
K: Denotes 1024.
IM 701240-01E
Example: 100 kS/s (sampling rate)
Example: 459 KB (file data size)
ix
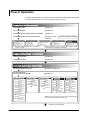
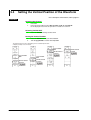
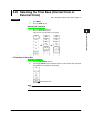
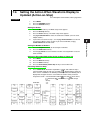
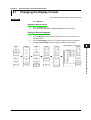
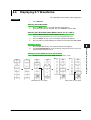
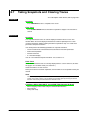
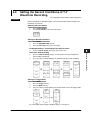
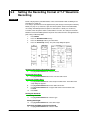
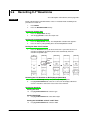
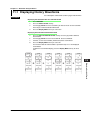
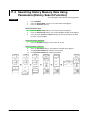
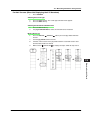
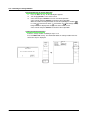
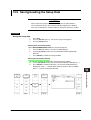
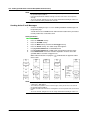
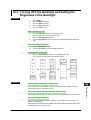
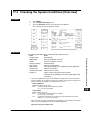
Flow of Operation
The figure below provides an overview of the flow of operations described in this manual.
For a description of each item, see the relevant chapter or section.
Preparations for Measurements
Install the SL1400
Section 3.2
Install the modules
Section 3.3
Connect the power supply and turn it ON/OFF
Section 3.4
Connect the probe and correct the phase
Sections 3.7, 3.8,
and 3.12*1
Voltage Measurement
Connect the
measurement lead*2
Section 3.9
Temp. Measurement
Connect the
thermocouple
Section 3.10
Strain Measurement
Connect the bridge
head
Section 3.11
*1 When measuring logic waveforms
Acceleration Measurement
Connect the
acceleration sensor
Section 3.13
Frequency
Measurement, Etc. *3
Connect the sensor
Section 3.14
*3 Number of rotations, period, duty cycle, power supply frequency,
pulse width, pulse integration, and velocity.
*2 Only when measuring voltage with the 701261,
701262, or 701265.
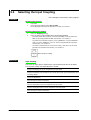
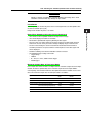
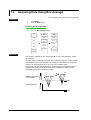
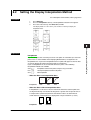
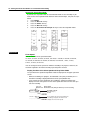
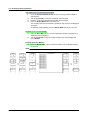
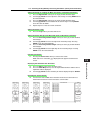
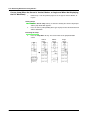
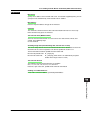
Displaying Waveforms on the Screen
Initialize the SL1400
Section 4.4
Perform auto setup
Section 4.5
Horizontal and Vertical Axes Setting
Set the horizontal (time) axis
Sections 5.2 and 5.20
Set the vertical axis
•Turn the channels ON/OFF
Section 5.1
Voltage Measurement
• Input range
Section 5.3
• Vertical position
Section 5.4
• Input coupling
Section 5.5
• Probe attenuation
and current-to-voltage
conversion ratio
Section 5.6
• Bandwidth limit
Section 5.7
• Zoom in or out of
the vertical axis
Sections 5.8 and 5.9
•Linear scaling
Section 5.11
• Inversion
Section 5.12
• Rms measurement
Section 5.13
Temp. Measurement
• Input coupling
Section 5.5
• Bandwidth limit
Section 5.7
• Temperature
measurement setting
Section 5.14
Strain Measurement
• Bandwidth limit
Section 5.7
• Linear scaling
Section 5.11
• Inversion
Section 5.12
• Strain measurement
setting
Section 5.15
Acceleration
Measurement
• Vertical position
Section 5.4
• Input coupling
Section 5.5
• Bandwidth limit
Section 5.7
• Zoom in or out of
the vertical axis
Sections 5.8 and 5.9
•Acceleration
measurement setting
Section 5.16
Frequency
Measurement, Etc. *
• Vertical position
Section 5.4
• Zoom in or out of the
vertical axis
Sections 5.8 and 5.9
•Offset value
Section 5.10
•Linear scaling
Section 5.11
•Frequency*
measurement setting
Section 5.17
* Number of rotations, period, duty cycle, power supply frequency,
pulse width, pulse integration, and velocity.
Continues to the next page
x
IM 701240-01E
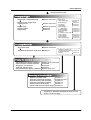
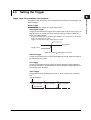
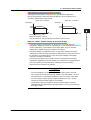
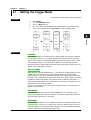
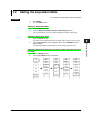
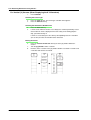
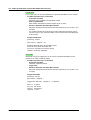
Flow of Operation
From the previous page
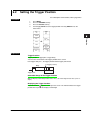
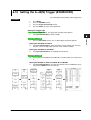
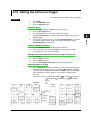
Setting the Trigger
• Trigger type* (simple/enhanced)
Sections 6.5 to 6.17
• Trigger source, trigger slope,
trigger level, etc
Sections 6.5 to 6.17
• Trigger mode
• Trigger position
• Trigger delay
Sections 6.1 and 7.4
Section 6.2
Section 6.3
*Simple trigger
• Input signal trigger
• External trigger
• Line trigger
• Time trigger
Enhanced trigger
• A → B(N) trigger
• A Delay B trigger
• Edge on A trigger
• OR trigger
• B > Time, B < Time, and B
Timeout trigger
• Periodic trigger
• Window trigger
• Wave window trigger
Sections 6.5
and 6.9
Section 6.6
Section 6.7
Section 6.8
Section 6.10
Section 6.11
Section 6.12
Section 6.13
Section 6.14
Section 6.15
Section 6.16
Section 6.17
Acquiring Waveforms
• Acquisition mode
Sections 7.2 and 7.3
• Start/Stop the waveform acquisition
Section 7.1
• Realtime recording to the
internal hard disk (option)
• Acquisition memory
backup
Section 7.5
Section 7.7
Display the waveform and information
• Set the waveform display conditions
• Zoom and auto scroll the waveform
• Display the X-Y waveform
• Snapshot and clear trace
• Set the information display conditions
Sections 8.1 to 8.4 and 8.8
Section 8.5
Section 8.6
Section 8.7
Sections 8.9 to 8.13
Recording in Recorder Mode
• Select the recorder mode
• Perform T-Y waveform recording
• Perform numeric value recording
• Perform X-Y waveform recording
• Reprint on the built-in printer
• Create a PDF file of the reprint image
Section 9.1
Sections 9.2 to 9.4
Section 9.5
Section 9.6
Section 9.7
Section 9.8
Continues to “Waveform Computation, Analysis, and
Search” on the next page
IM 701240-01E
xi
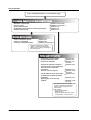
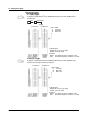
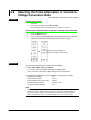
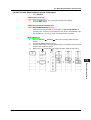
Flow of Operation
From “Acquiring Waveforms” on the previous page
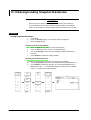
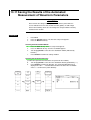
Computing, Analyzing, and Searching Waveforms
• Waveform computation
• History search
• Cursor measurement
• Automated measurement of waveform parameters
• Statistical processing
Sections 10.1 to 10.4
Sections 11.2 and 11.3
Section 11.4
Section 11.5
Section 11.6
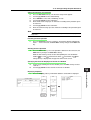
Printing Screen Images
• Print on the built-in printer
• Print on a USB Printer
• Printing on a Network Printer*
Section 12.1
Section 12.2
Sections 15.4 and 12.3
* Configure the network according to
chapter 15, “Ethernet Communication
(Option)” before carrying out printing on
the network printer.
Saving and Loading Data*1
• Format the storage medium
• Save/Load Waveform Data
• Save/Load setup data
• Save/Load snapshot waveforms
• Save the results of the automated
measurement of waveform
parameters
• Save the screen image data
• Create a PDF File of the print image
• Load/Convert realtime recorded
waveforms
• Operate files on the storage
medium*2
Section 13.6
Section 13.8
Sections 13.1
and 13.9
Section 13.10
Section 13.11
Sections 13.12
and 13.13
Section 13.14
Section 13.15
Sections 13.16
to 13.18
*1 Configure the network according to
chapter 15, “Ethernet Communication
(Option)” before saving data to the
network drive.
*2 File operations
• Change the file attribute,
• Delete/copy files,
• Change the directory/file name on the
storage medium, create directories
xii
IM 701240-01E
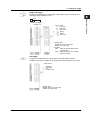
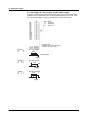
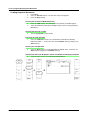
Flow of Operation
Ethernet interface and other operations do not have to be configured in order from
previous chapter. They can be configured independently.
Ethernet Communication (Option)
• Connect the SL1400 to the PC*
Section 15.1
• Set the TCP/IP
Section 15.2
• Save/Load data on a network drive
(FTP client function)
• Send e-mail
• Access the SL1400 from the PC*
(FTP server function)
• Web server function
• Use the SL1400 as a Windows
network drive
Section 15.3
Section 15.5
Section 15.6
Section 15.7
Section 15.11
* Personal computer (PC) or workstation
Other Operations
• Set the menu/message language
• Turn the click sound ON/OFF
• Change the screen font size
• Set the screen color and intensity
• Set the backlight
• Lock the keys
IM 701240-01E
Section 16.1
Section 16.1
Section 16.2
Section 16.3
Section 16.4
Section 16.5
xiii
Contents
Checking the Contents of the Package ......................................................................................... ii
Safety Precautions ....................................................................................................................... vi
Conventions Used in This Manual ............................................................................................... ix
Flow of Operation ......................................................................................................................... x
Chapter 1
Names and Functions of Parts
1.1
1.2
1.3
Chapter 2
Explanation of Functions
2.1
2.2
2.3
2.4
2.5
2.6
2.7
2.8
2.9
Chapter 3
Handling Precautions ..................................................................................................... 3-1
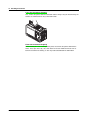
Installing the Instrument ................................................................................................. 3-3
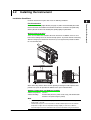
Installing Input Modules ................................................................................................. 3-5
Connecting the Power Supply and Turning the Power Switch ON/OFF ........................ 3-8
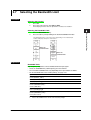
Loading the Roll Paper for the Built-in Printer ............................................................. 3-10
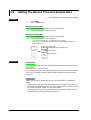
Setting the Date and Time ........................................................................................... 3-13
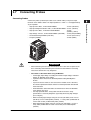
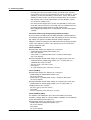
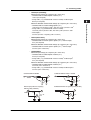
Connecting Probes ...................................................................................................... 3-15
Compensating the Probe (Phase Correction) .............................................................. 3-21
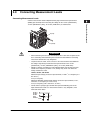
Connecting Measurement Leads ................................................................................. 3-23
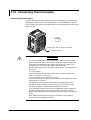
Connecting Thermocouples ......................................................................................... 3-24
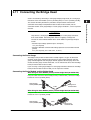
Connecting the Bridge Head ........................................................................................ 3-25
Connecting Logic Probes ............................................................................................. 3-28
Connecting Acceleration Sensors ................................................................................ 3-30
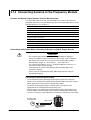
Connecting Sensors to the Frequency Module ............................................................ 3-32
Common Operations
4.1
4.2
4.3
4.4
4.5
4.6
xiv
System Configuration and Block Diagram ..................................................................... 2-1
Setting the Horizontal and Vertical Axes ....................................................................... 2-3
Setting the Trigger ....................................................................................................... 2-17
Setting Waveform Acquisition Conditions and Display Conditions .............................. 2-28
Recording in Recorder Mode ....................................................................................... 2-37
Waveform Computation ............................................................................................... 2-41
Waveform Analysis and Search ................................................................................... 2-43
Communications .......................................................................................................... 2-47
Other Useful Functions ................................................................................................ 2-49
Preparations for Measurements
3.1
3.2
3.3
3.4
3.5
3.6
3.7
3.8
3.9
3.10
3.11
3.12
3.13
3.14
Chapter 4
Panels ............................................................................................................................ 1-1
Panel Keys and Knobs .................................................................................................. 1-5
Display Screens ............................................................................................................. 1-7
Operations and Functions of Keys and the Jog Shuttle ................................................. 4-1
Entering Values and Strings .......................................................................................... 4-3
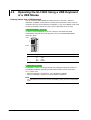
Operating the SL14000 Using a USB Keyboard or a USB Mouse ................................ 4-6
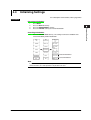
Initializing Settings ....................................................................................................... 4-15
Performing Auto Setup ................................................................................................ 4-17
Performing Calibration ................................................................................................. 4-20
IM 701240-01
Contents
Chapter 5
Horizontal and Vertical Axes
1
Voltage Measurement (Input Module 701250, 701251, 701255, 701260, 701261, 701262,
701265, or 701275)
5.1
Turning Channels ON/OFF ............................................................................................ 5-1
5.2
Setting the Record Time and Sample Rate ................................................................... 5-2
5.3
Setting the Voltage Range ............................................................................................. 5-4
5.4
Setting the Vertical Position of the Waveform ............................................................... 5-6
5.5
Selecting the Input Coupling .......................................................................................... 5-8
5.6
Selecting the Probe Attenuation or Current-to-Voltage Conversion Ratio ................... 5-10
5.7
Selecting the Bandwidth Limit ...................................................................................... 5-11
5.8
Zooming Vertically by Setting the Zoom Rate ............................................................. 5-13
5.9
Zooming Vertically by Setting the Upper and Lower Limits of the Display Range ....... 5-15
5.11 Using the Linear Scaling Function (AX+B or P1-P2) ................................................... 5-18
5.12 Inverting the Waveforms .............................................................................................. 5-21
5.13 Setting the RMS Measurement .................................................................................... 5-22
5.19 Entering Settings on the All Channel Menu ................................................................. 5-46
5.20 Selecting the Time Base (Internal Clock or External Clock) ........................................ 5-49
Temperature Measurement (Input Module 701261, 701262, or 701265)
5.1
Turning Channels ON/OFF ............................................................................................ 5-1
5.2
Setting the Record Time and Sample Rate ................................................................... 5-2
5.5
Selecting the Input Coupling .......................................................................................... 5-8
5.7
Selecting the Bandwidth Limit ...................................................................................... 5-11
5.14 Setting the Temperature Measurement ....................................................................... 5-23
5.19 Entering Settings on the All Channel Menu ................................................................. 5-46
5.20 Selecting the Time Base (Internal Clock or External Clock) ........................................ 5-49
2
3
4
5
6
7
8
9
10
11
Strain Measurement (Input Module 701270 or 701271)
5.1
Turning Channels ON/OFF ............................................................................................ 5-1
5.2
Setting the Record Time and Sample Rate ................................................................... 5-2
5.7
Selecting the Bandwidth Limit ...................................................................................... 5-11
5.11 Using the Linear Scaling Function (AX+B or P1-P2) ................................................... 5-18
5.12 Inverting the Waveforms .............................................................................................. 5-21
5.15 Setting the Strain Measurement .................................................................................. 5-25
5.19 Entering Settings on the All Channel Menu ................................................................. 5-46
5.20 Selecting the Time Base (Internal Clock or External Clock) ........................................ 5-49
Acceleration Measurement (Input Module 701275)
5.1
Turning Channels ON/OFF ............................................................................................ 5-1
5.2
Setting the Record Time and Sample Rate ................................................................... 5-2
5.4
Setting the Vertical Position of the Waveform ............................................................... 5-6
5.5
Selecting the Input Coupling .......................................................................................... 5-8
5.7
Selecting the Bandwidth Limit ...................................................................................... 5-11
5.8
Zooming Vertically by Setting the Zoom Rate ............................................................. 5-13
5.9
Zooming Vertically by Setting the Upper and Lower Limits of the Display Range ....... 5-15
5.16 Setting the Acceleration Measurement ........................................................................ 5-31
5.19 Entering Settings on the All Channel Menu ................................................................. 5-46
5.20 Selecting the Time Base (Internal Clock or External Clock) ........................................ 5-49
12
13
14
15
16
17
18
App
Index
IM 701240-01
xv
Contents
Frequency (Number of Rotations, Period, Duty Cycle, Power Supply Frequency, Pulse
Width, Pulse Integration, and Velocity) Measurement (Input Module 701280)
5.1
Turning Channels ON/OFF ............................................................................................ 5-1
5.2
Setting the Record Time and Sample Rate ................................................................... 5-2
5.4
Setting the Vertical Position of the Waveform ............................................................... 5-6
5.8
Zooming Vertically by Setting the Zoom Rate ............................................................. 5-13
5.9
Zooming Vertically by Setting the Upper and Lower Limits of the Display Range ....... 5-15
5.10 Setting the Offset ......................................................................................................... 5-17
5.11 Using the Linear Scaling Function (AX+B or P1-P2) ................................................... 5-18
5.17 Setting the Frequency (Number of Rotations, Period, Duty Cycle, Power Supply
Frequency, Pulse Width, Pulse Integration, and Velocity) Measurement .................... 5-33
5.19 Entering Settings on the All Channel Menu ................................................................. 5-46
5.20 Selecting the Time Base (Internal Clock or External Clock) ........................................ 5-49
Logic Waveform Measurement
5.1
Turning Channels ON/OFF ............................................................................................ 5-1
5.4
Setting the Vertical Position of the Waveform ............................................................... 5-6
5.8
Zooming Vertically by Setting the Zoom Rate ............................................................. 5-13
5.18 Setting Logic Waveforms ............................................................................................. 5-44
Chapter 6
Triggering
6.1
6.2
6.3
6.4
6.5
6.6
6.7
6.8
6.9
6.10
6.11
6.12
6.13
6.14
6.15
6.16
6.17
6.18
6.19
Chapter 7
Waveform Acquisition
7.1
7.2
7.3
7.4
7.5
7.6
7.7
xvi
Setting the Trigger Mode ............................................................................................... 6-1
Setting the Trigger Position ........................................................................................... 6-3
Setting the Trigger Delay ............................................................................................... 6-5
Setting the Hold Off Time .............................................................................................. 6-6
Setting the Edge Trigger (SIMPLE) ............................................................................... 6-8
Setting the External Trigger (SIMPLE) ........................................................................ 6-11
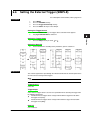
Activating Triggers on the Power Signal (SIMPLE) ..................................................... 6-12
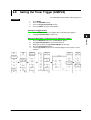
Setting the Timer Trigger (SIMPLE) ............................................................................ 6-13
Setting the Logic Trigger (SIMPLE) ............................................................................. 6-15
Setting the A->B(N) Trigger (ENHANCED) ................................................................. 6-17
Setting the A Delay B Trigger (ENHANCED) ............................................................... 6-20
Setting the Edge on A Trigger (ENHANCED) .............................................................. 6-23
Setting the OR Trigger (ENHANCED) ......................................................................... 6-27
Setting the B > Time, B < Time, or B Timeout (Pulse Width) Trigger (ENHANCED) .. 6-30
Setting the Period Trigger (ENHANCED) .................................................................... 6-34
Setting the Window Trigger (ENHANCED) .................................................................. 6-37
Setting the Wave Window Trigger (ENHANCED) ........................................................ 6-40
Setting the Action-on-Trigger ....................................................................................... 6-45
Activating Manual Triggers .......................................................................................... 6-48
Starting/Stopping Waveform Acquisition ....................................................................... 7-1
Setting the Acquisition Mode ......................................................................................... 7-3
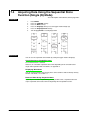
Acquiring Data Using Box Average ............................................................................... 7-6
Acquiring Data Using the Sequential Store Function (Single (N) Mode) ....................... 7-8
Realtime Recording to the Internal Hard Disk (Option) ................................................. 7-9
Setting the Action When Waveform Display Is Updated (Action-on-Stop) .................. 7-13
Backing Up the Acquisition Memory ............................................................................ 7-16
IM 701240-01
Contents
Chapter 8
Waveform Display and Information Display
8.1
8.2
8.3
8.4
8.5
8.6
8.7
8.8
8.9
8.10
8.11
8.12
8.13
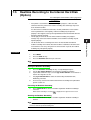
Chapter 9
1
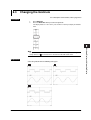
Changing the Display Format ........................................................................................ 8-1
Setting the Display Interpolation Method ....................................................................... 8-3
Changing the Graticule .................................................................................................. 8-5
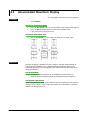
Accumulated Waveform Display .................................................................................... 8-6
Zooming and Auto Scrolling the Waveform ................................................................... 8-8
Displaying X-Y Waveforms .......................................................................................... 8-13
Taking Snapshots and Clearing Traces ....................................................................... 8-16
Turning ON/OFF the Translucent Display ................................................................... 8-17
Turning the Scale Value Display ON/OFF ................................................................... 8-18
Setting Waveform Labels ............................................................................................. 8-19
Turning the Extra Window ON/OFF ............................................................................. 8-20
Turning the Level Indicator Display ON/OFF ............................................................... 8-22
Displaying Channel Information/Displaying Waveforms on a Full Screen (Expanding the
Waveform Display Area) .............................................................................................. 8-23
Selecting the Recorder Mode ........................................................................................ 9-1
Setting the Record Conditions of T-Y Waveform Recording ......................................... 9-3
Setting the Recording Format of T-Y Waveform Recording .......................................... 9-6
Recording T-Y Waveforms .......................................................................................... 9-11
Recording Numeric Values .......................................................................................... 9-13
Recording X-Y Waveforms .......................................................................................... 9-16
Reprinting on the Built-in Printer .................................................................................. 9-20
Creating a PDF File of the Reprint Image .................................................................... 9-24
Chapter 10 Waveform Computation
10.1
10.2
10.3
10.4
Adding, Subtracting, Multiplying, and Dividing Waveforms ......................................... 10-1
Performing Binary Computation ................................................................................... 10-4
Performing Power Spectrum Computation (FFT) ........................................................ 10-7
Shifting the Phase ...................................................................................................... 10-11
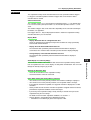
Displaying History Waveforms ..................................................................................... 11-1
Searching History Memory Data Using Zones (History Search Function) ................... 11-5
Searching History Memory Data Using Parameters (History Search Function) .......... 11-8
Measuring Waveforms Using Cursors ....................................................................... 11-11
Automated Measurement of Waveform Parameters ................................................. 11-25
Performing Statistical Processing .............................................................................. 11-32
5
6
8
9
10
11
12
14
15
16
Chapter 12 Printing the Screen Image
12.1
12.2
12.3
4
13
Chapter 11 Waveform Analysis/Search
11.1
11.2
11.3
11.4
11.5
11.6
3
7
Recording in Recorder Mode
9.1
9.2
9.3
9.4
9.5
9.6
9.7
9.8
2
Printing on the Built-in Printer ...................................................................................... 12-1
Printing on a USB Printer ........................................................................................... 12-11
Printing on a Network Printer (Option) ....................................................................... 12-15
17
18
App
Index
IM 701240-01
xvii
Contents
Chapter 13 Saving and Loading Data
13.1
13.2
13.3
13.4
13.5
13.6
13.7
13.8
13.9
13.10
13.11
13.12
13.13
13.14
13.15
13.16
13.17
13.18
13.19
Storing and Recalling the Setup Data .......................................................................... 13-1
PC Cards ..................................................................................................................... 13-3
Internal Hard Disk (Option) .......................................................................................... 13-4
Connecting a USB Storage Device (MO Disk Drive, Hard Disk, or Flash Memory)
to the USB PERIPHERAL Interface ............................................................................. 13-5
Connecting a SCSI Device .......................................................................................... 13-7
Formatting the Storage Medium .................................................................................. 13-8
Changing the SCSI ID Number .................................................................................. 13-12
Saving and Loading Waveform Data ......................................................................... 13-14
Saving/Loading the Setup Data ................................................................................. 13-23
Saving/Loading Snapshot Waveforms ....................................................................... 13-28
Saving the Results of the Automated Measurement of Waveform Parameters ........ 13-32
Saving Screen Image Data ........................................................................................ 13-35
Displaying Thumbnails of the Saved Screen Image Data ......................................... 13-39
Creating PDF Files of the Printed Image ................................................................... 13-43
Loading/Converting Realtime Recorded Waveforms ................................................. 13-50
Changing the File Attributes and Deleting Files ......................................................... 13-53
Copying Files ............................................................................................................. 13-56
Changing the Directory/File Name of the Storage Medium and Creating Directories 13-59
Connecting a PC to the SL1400 via SCSI ................................................................. 13-62
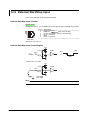
Chapter 14 External Trigger I/O, External Clock Input, and Video Signal Output
14.1
14.2
14.3
14.4
14.5
External Trigger Input (TRIG IN) .................................................................................. 14-1
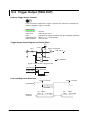
Trigger Output (TRIG OUT) ......................................................................................... 14-2
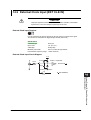
External Clock Input (EXT CLK IN) .............................................................................. 14-3
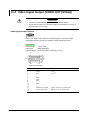
Video Signal Output (VIDEO OUT (SVGA)) ................................................................ 14-4
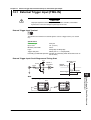
External Start/Stop Input .............................................................................................. 14-6
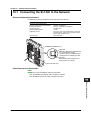
Chapter 15 Ethernet Interface (Option)
15.1
15.2
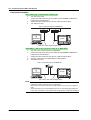
15.3
15.4
15.5
15.6
15.7
15.8
15.9
15.10
15.11
Connecting the SL1400 to the Network ....................................................................... 15-1
Setting up the TCP/IP .................................................................................................. 15-3
Saving/Loading Data to a Network Drive (FTP Client Function) .................................. 15-8
Setting up the Network Printer (LPR Client Function) ............................................... 15-11
Sending Periodic Mail or Action Mail (SMTP Client Function) ................................... 15-13
Accessing the SL1400 from a PC or Workstation (FTP Server Function) ................. 15-17
Using the Web Server Function ................................................................................. 15-20
Setting the Time Difference from GMT (Greenwich Mean Time)/SNTP .................... 15-44
Checking the Presence of the Ethernet Interface and the MAC Address .................. 15-46
Setting the FTP Passive Mode and LPR/SMTP Timeout .......................................... 15-47
Using the Instrument as a Windows Network Drive ................................................... 15-48
Chapter 16 Other Operations
16.1
16.2
16.3
16.4
16.5
xviii
Changing the Message/Menu Language and Turning the Click Sound ON/OFF ........ 16-1
Switching the Screen Display Font Size ...................................................................... 16-2
Setting the Screen Color and Brightness ..................................................................... 16-3
Turning OFF the Backlight and Setting the Brightness of the Backlight ...................... 16-5
Locking the Keys ......................................................................................................... 16-6
IM 701240-01
Contents
Chapter 17 Troubleshooting, Maintenance, and Inspection
17.1
17.2
17.3
17.4
17.5
1
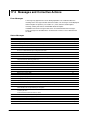
Troubleshooting ........................................................................................................... 17-1
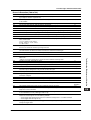
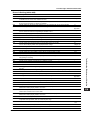
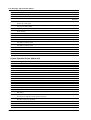
Messages and Corrective Actions ............................................................................... 17-2
Self Test ..................................................................................................................... 17-12
Checking the System Conditions (Overview) ............................................................ 17-15
Recommended Replacement Parts ........................................................................... 17-16
2
3
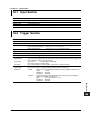
Chapter 18 Specifications
18.1
18.2
18.3
18.4
18.5
18.6
18.7
18.8
18.9
18.10
18.11
18.12
18.13
18.14
Input Section ................................................................................................................ 18-1
Trigger Section ............................................................................................................ 18-1
Time Axis ..................................................................................................................... 18-2
Display ......................................................................................................................... 18-3
Function ....................................................................................................................... 18-3
Built-in printer ............................................................................................................... 18-7
Storage ........................................................................................................................ 18-7
USB PERIPHERAL Interface ....................................................................................... 18-8
Auxiliary I/O Section .................................................................................................... 18-8
Computer Interface .................................................................................................... 18-10
General Specifications ............................................................................................... 18-11
Module Specifications ................................................................................................ 18-14
Logic Probe Specifications ........................................................................................ 18-36
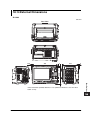
External Dimensions .................................................................................................. 18-37
Appendix
Appendix 1
Appendix 2
Appendix 3
Appendix 4
Appendix 5
Appendix 6
Appendix 7
Appendix 8
Appendix 9
Appendix 10
Appendix 11
Appendix 12
Appendix 13
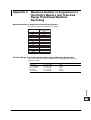
Relationship between the Record Time, Sample Rate and Record
Length in Memory Mode ................................................................................. App-1
Relationship between the Chart Speed, Sample Rate and Record
Length in Recorder Mode ............................................................................... App-2
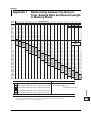
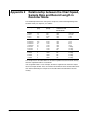
Maximum Number of Acquisitions to the History Memory and Time
Axis Range That Allows Realtime Recording ................................................. App-3
How to Calculate the Area of a Waveform ..................................................... App-4
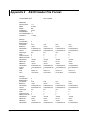
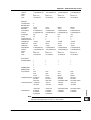
ASCII Header File Format .............................................................................. App-6
List of Default Values ................................................................................... App-10
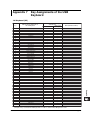
Key Assignments of the USB Keyboard ....................................................... App-13
Waveform Acquisition Operation When the Power Supply Recovers
after a Power Failure .................................................................................... App-17
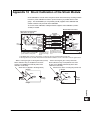
Basic Defining Equation of Strain ................................................................. App-18
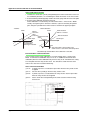
Shunt Calibration of the Strain Module ......................................................... App-19
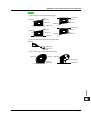
Measurement Principles (Measurement Method and Update Rate)
of the Frequency Module .............................................................................. App-24
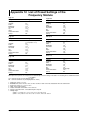
List of Preset Settings of the Frequency Module .......................................... App-28
TCP and UDP Port Number Used in Ethernet Communications .................. App-30
4
5
6
7
8
9
10
11
12
13
14
15
16
17
Index
18
App
Index
IM 701240-01
xix
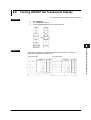
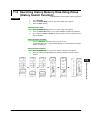
Chapter 1
1.1
Names and Functions of Parts
1
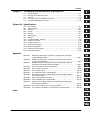
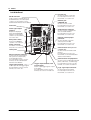
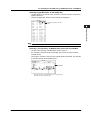
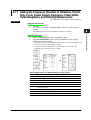
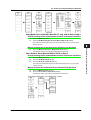
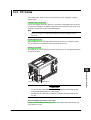
Panels
Names and Functions of Parts
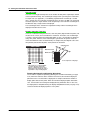
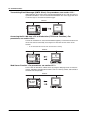
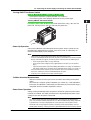
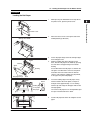
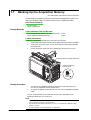
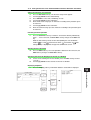
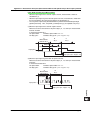
Top Panel
2
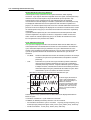
Built-in printer
Prints the displayed information.
For the procedure to set the roll paper, see section 3.5.
For the printout procedure, see sections 9.4, 9.6, 9.7, and 12.1.
3
Handle
4
5
ACQ MEMORY
BACKUP BATTERIES
6
7
8
Built-in printer for the DL750
A built-in printer for a separate Vent holes
model (DL750) is installed here.
It is not used on the SL1400.
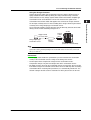
Battery box for memory backup
Stores batteries used to back up the contents of
the acquisition memory when the power is OFF.
For the procedure to install the batteries, see section 7.7.
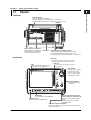
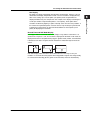
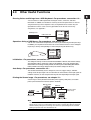
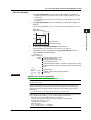
Front Panel
9
10
Soft keys
11
Used to select items on the soft key menu
that appears when setting up the SL1400.
ESC key
LCD
Used to clear the soft key menu and
pop-up menu.
For a description of the displayed
information, see chapter 8.
12
Jog shuttle
MENU
RESET
SELECT
DISPLAY
MODE
Used to change settings
and move the cursor.
Turn the shuttle ring to
vary the rate of change
according to its angle.
RECORD
13
14
START/
STOP
CHART
SPEED
CH
RANGE
FINE
RANGE
15
Panel keys/knobs
ALL CH
POSITION
FINE
POSITION
For a description, see
section 1.2.
16
TRID'D
MANUAL TRIG
PROTECT
FEED
PRINT
IMAGE
SAVE
HISTORY MEASURE
CURSOR
Panel keys
For a description, see section 1.2.
PROTECT key
Locks the keys. See section 16.5.
ZOOM
17
FILE
Probe compensation signal
output terminal (1 kHz/1 VP-P)
Outputs the probe compensation
signal.
For the probe phase correction,
see section 3.8.
Functional ground terminal
Connect the ground cable when be sure to perform phase
correction the probe.
IM 701240-01E
1-1
18
App
Index
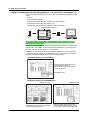
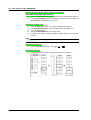
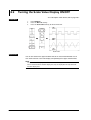
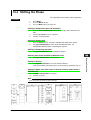
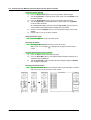
1.1 Panels
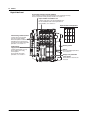
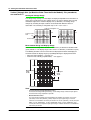
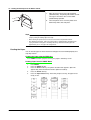
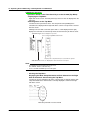
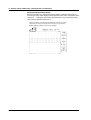
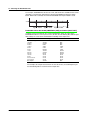
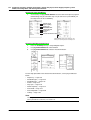
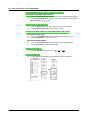
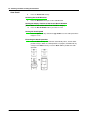
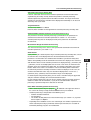
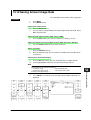
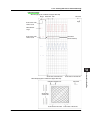
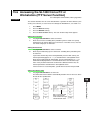
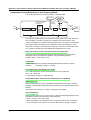
Right Side Panel
Acquisition memory backup ON/OFF
Turns ON/OFF the battery power for backing up the acquisition memory.
For the acquisition memory backup function, see section 7.7.
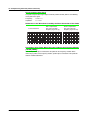
Input module installation slot
A total of eight slots in the top and bottom rows.
For the installation and removal procedure of
input modules, see section 3.3.
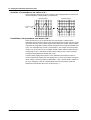
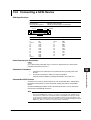
Input channel arrangement
CH1 CH3 CH5 CH7
CH1
CH2
CH3
CH4
CH5
CH6
CH7
CH8
CH2 CH4 CH6 CH8
ON
Functional ground terminal
Used to connect the ground
line from the high-voltage
differential probe or enhance the
grounding of the measurement
system. For the probe connection
procedure, see section 3.7.
Probe power
supply terminal
OFF
ACQ
MEMORY
BACKUP
CH9 CH11 CH13 CH15
CH10 CH12 CH14 CH16
Built-in printer
PROBE
POWER
( 12V)
Stand
Used to supply power (±12 V)
to the probes when using
current probes.
For the probe connection
procedure, see section 3.7.
For the installation procedure,
see section 3.2.
Empty slot protection
cover panel
CH9 CH10
CH11 CH12
CH13 CH14
CH15 CH16
Attached to the slots that are
not used.
Input module connector
1-2
IM 701240-01E
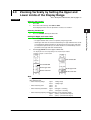
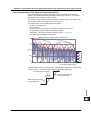
1.1 Panels
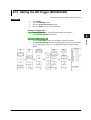
1
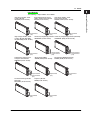
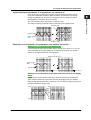
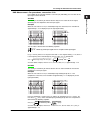
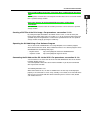
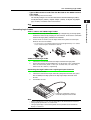
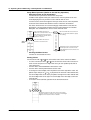
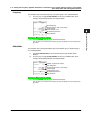
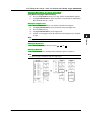
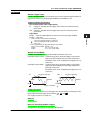
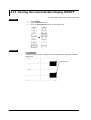
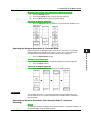
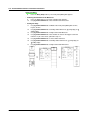
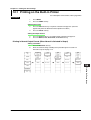
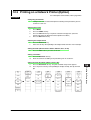
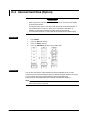
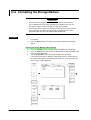
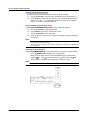
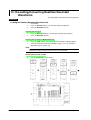
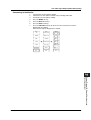
Input Modules
High-Speed High-Resolution
1 MS/s, 16-Bit Isolation Module
HS1M16 (model: 701251)
High-Speed 10 MS/s, 12-Bit
Isolation Module
HS10M12 (model: 701250)
Names and Functions of Parts
The following 11 input modules are available.
2
High-Speed 10 MS/s, 12-Bit
Non-Isolation Module
NONISO_10M12 (model: 701255)
3
4
5
Input terminal
(2ch)
High-Voltage 100 kS/s, 16-Bit
Isolation Module (with RMS)
HV (with RMS) (model: 701260)
Input terminal
(2ch)
Input terminal
(2ch)
Universal (Voltage/Temp.) Module Universal (Voltage/Temp.) Module (with AAF)
UNIVERSAL (AAF) (model: 701262)
UNIVERSAL (model: 701261)
6
7
8
9
Input terminal
(2ch)
Temperature, High Precision
Voltage Isolation Module
TEMP/HPV (model: 701265)
H input terminal
L input terminal
(2ch)
Strain Module (NDIS)
STRAIN_NDIS (model: 701270)
H input terminal
L input terminal
(2ch)
10
Strain Module (DSUB, Shunt-Cal)
STRAIN_DSUB (model: 701271)
11
12
13
H input terminal
L input terminal
(2ch)
Acceleration/Voltage Module
(with AAF)
ACCL/VOLT (model: 701275)
Input terminal
(2ch)
Input terminal
(2ch)
14
Frequency Module
FREQ (model: 701280)
15
16
17
Input terminal
(2ch)
18
Input terminal
(2ch)
App
Index
IM 701240-01E
1-3
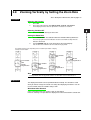
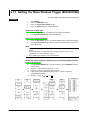
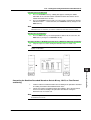
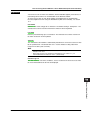
1.1 Panels
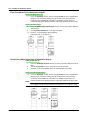
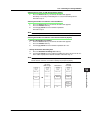
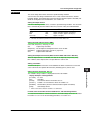
Left Side Panel
PC card slot
Used to save data to a PC card.
For a description on how to use
the terminal, see section 13.2.
GP-IB connector
Used to perform communications via
the GP-IB interface. For a description
on how to use the terminal, see the
Communication Interface User’s Manual.
Ethernet port
(100BASE-TX)
Vent holes
Used to connect to a LAN.
For a description on how to use
the terminal, see section 15.1.
Video signal output
terminal
SCSI interface connector
ACT
SCSI
External start/stop input
connector
OFF
USB
USB PERIPHERAL
TRIG OUT/
EXT CLK IN
TRIG IN
Made in Japan
LOGIC A
LOGIC B
NO.
START/
STOP
SERIAL (RS-232)
MODEL
SUFFIX
Name plate
100BASE-TX
POWER
For details on connecting
the power, see section 3.4.
100-120V/200-240V AC
300VA MAX 50/60Hz
Power connector
VIDEO OUT (SVGA)
ON
Main power switch
For the power ON/OFF
operation, see section 3.4.
Used to connect to a SCSI device
such as a SCSI hard disk.
For a description on how to use
the terminal, see section 13.5.
LINK
GP-IB (IEEE488)
Outputs the displayed
image using SVGA RGB
signals. For a description
on how to use the terminal,
see section 14.4.
RS-232 interface connecter
Used to perform communications
with a personal computer (PC)
via the RS-232 interface.
For a description on how to use the
terminal, see the Communication
Interface User’s Manual.
Trigger input terminal
Used to input external trigger signals.
For a description on how to use the
terminal, see section 14.1.
1-4
Used to externally control the
start/stop of the SL1400.
For a description on how to use
the terminal, see section 14.5.
USB connector for a personal
computer (PC)
Used to connect a PC with a USB
interface.
For a description on how to use
the terminal, see the Communication
Interface User’s Manual.
USB connector for peripherals
Trigger output/external clock
input terminal
Used to output trigger signals or input
clock signals.
For a description on how to use the
terminal, see sections 14.2 and 14.3.
Used to connect a USB keyboard, USB
printer, USB mouse, or USB storage.
For a description on how to use the
terminal, see sections 4.3 and 12.2.
Logic signal input connector
Used to measure logic signals.
For a description on how to use
the terminal, see section 3.12.
IM 701240-01E
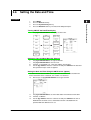
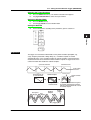
1.2
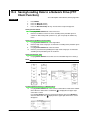
1
Panel Keys and Knobs
Names and Functions of Parts
2
MENU
RESET
SELECT
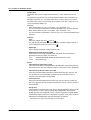
• Menu Key (explained by function in each chapter and section)
Displays a setup menu for measurement conditions (sections 5.2, 5.20, 7.2, 7.3, and
7.5), record conditions (chapter 9), triggers (chapter 6), waveform computation
(chapter 10), store and recall of setup parameters (section 13.1), screen image data
printing (chapter 12) and saving (sections 13.12, 13.13, and 15.3), system
configuration (sections 3.6, 16.1 to 16.3, and 17.4), initialization and calibration
(sections 4.4 to 4.6), remote control (Communication Interface User’s Manual),
network (chapter 15), backlight (section 16.4), self-test (17.3), etc. The displayed
menu varies depending on the mode selected using the MODE key.
DISPLAY
MODE
RECORD
START/
STOP
• DISPLAY Key (Chapter 8)
CHART
SPEED
3
4
5
6
Displays a menu related to the screen display.
• MODE Key (Section 9.1)
CH
RANGE
FINE
RANGE
ALL CH
POSITION
FINE
POSITION
Displays a menu used to select the mode. Three modes are available: Memory, Chart
Recorder, and X-Y Recorder.
• START/STOP Key (Sections 7.1, 9.4, and 9.6)
Starts/Stops waveform acquisition (or waveform recording). Waveform acquisition (or
waveform recording) is in progress when the indicator above the key is illuminated.
• CHART SPEED Key (Section 9.2)
TRIG'D
MANUAL TRIG
7
8
9
This key is valid only when Chart Recorder mode is selected with the MODE key.
Press this key to display a menu used to set the chart speed.
10
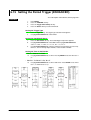
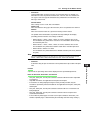
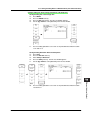
• CH Key (explained by function in each chapter and section)
Displays a menu used to select the channel.
If you select a channel from CH1 to CH16, a menu is displayed that is used to turn the
display of each channel ON/OFF (section 5.1), set the vertical position (section 5.4),
coupling (section 5.5), Probe attenuation or current-to-voltage conversion ratio
(section 5.6), bandwidth limit (section 5.7), vertical axis expansion/reduction (sections
5.8 and 5.9), linear scaling (section 5.11), inverted display of waveforms (section
5.12), and waveform label (section 8.10).
If you select Logic A or Logic B, a menu is displayed that is used to set the vertical
position (section 5.4), vertical axis expansion/reduction (section 5.8), logic probe
(section 5.18), displayed bits (section 5.18), bit label (section 5.18), mapping (section
5.18), and logic waveform label (section 8.10).
11
12
13
14
• ALL CH Key (Section 5.19)
15
Displays a pop-up window containing a list of settings similar to those displayed on
the menu when the CH key is pressed.
• RANGE FINE Key (Section 5.8)
Press the key to illuminate the indicator above the key. In this condition, you can turn
the range knob to expand or reduce the vertical axis by specifying the magnification
(zoom rate).
• POSITION FINE Key
Press the key to illuminate the indicator above the key. In this condition, you can turn
the position knob to set the vertical display position of the waveform in 0.1-division
resolution.
• RANGE Knob (Section 5.3)
Sets the voltage range. You select the target channel with the CH key before you turn
this knob. If you change the setting when waveform acquisition is stopped, the new
setting takes effect when you restart the waveform acquisition.
IM 701240-01E
1-5
16
17
18
App
Index
1.2 Panel Keys and Knobs
• POSITION Knob (Section 5.4)
Sets the vertical display position of the waveform. You select the target channel with
the CH key before you turn this knob.
• MANUAL TRIG Key (Section 6.19)
Press the key to forcibly activate a trigger.
• RESET Key
Resets the numeric entry to the default value.
• SELECT Key
Applies the menu item that you selected using the jog shuttle.
• Arrow Keys(
Keys)
Moves the numeric entry digit (cursor) left or right.
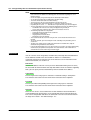
PROTECT
FEED
PRINT
IMAGE
SAVE
HISTORY MEASURE CURSOR
SNAPSHOT
ZOOM
FILE
CLEAR TRACE
• PROTECT Key (Section 16.5)
Pressing this key causes the LED above the key to illuminate, and the front panel
keys to be disabled. Pressing the key again clears the condition.
• Feed Key (Section 3.5)
Feeds the paper in the built-in printer.
• PRINT Key (Section 12.1)
Executes the printing of the screen image. You can enter the print settings on the
PRINT menu that appears when you press the MENU key.
• Image Save Key (Section 13.12)
Saves the screen image data to a storage medium. You can enter the storage
settings of the screen image data on the IMAGE menu that appears when you press
the MENU key.
• SNAPSHOT Key (Section 8.7)
Leaves the current displayed waveform on the screen in black and white. Waveforms
acquired using the snapshot function can be saved and loaded.
• CLEAR TRACE Key (Section 8.7)
Clears the waveform acquired using the snapshot function and accumulated
waveforms.
• HISTORY Key (Sections 11.1 to 11.3)
Displays a menu used to recall data using the history memory function.
• MEASURE Key (Sections 11.5 and 11.6)
Displays a menu used to perform automated measurement of waveform parameters
and statistical processing.
• CURSOR Key (Section 11.4)
Displays a menu used to perform cursor measurements.
• ZOOM Key (Section 8.5)
Displays a menu related to the zoom display of waveforms.
• FILE Key (Chapter 13)
Displays a menu used to save various data to, recall various data, or execute file
operations on a storage medium such as a PC card and external SCSI device
(option).
1-6
IM 701240-01E
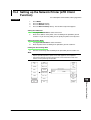
1.3
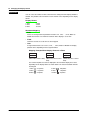
1
Display Screens
Names and Functions of Parts
2
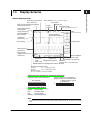
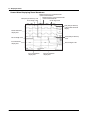
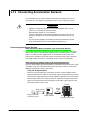
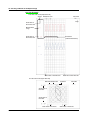
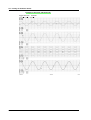
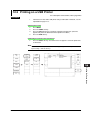
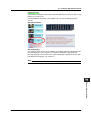
Normal Display Screen
Scale value of the vertical
axis (section 8.9)
Record length (see the explanation below)
3
Record time
Span corresponding to the displayed
waveform (section 5.3)
Sample rate
Trigger
position
4
Acquisition mode
(See the explanation below.)
Setup channel and its
measurement
range (section 5.3)
T/div
(Time per division)
Channel number of
the scale value
Channel number of
the displayed waveform
6
Trigger level
(section 6.5)
Ground level
5
Soft key menu
7
8
Vertical position
(section 5.4)
9
Time from the
trigger position
(section 6.2)
Waveform
acquisition
count
(section 7.2)
Trigger mode
(section 6.1)
Trigger type (chapter 6)
Current date/time
(section 3.6)
Level indicator (section 8.12)
Comment
(sections 12.1 to 12.3 and 13.12)
11
Date/time when the displayed waveform was acquired
12
Waveform acquisition status
Stopped
Pre...: Acquiring pre data
Running
Post...: Acquiring post data
Waiting for trigger
HD out: Continuous writing to hard disk
13
14
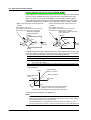
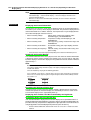
Zoom Waveform Position on the Normal Waveform
<When displaying normal waveforms>
Record length
10
<When displaying zoom waveforms>
Display position of zoom waveform Z1
Display position of zoom
waveform Z2
15
Z1
Z2
16
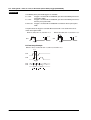
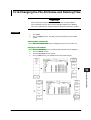
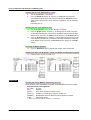
Acquisition Mode Display
Normal:
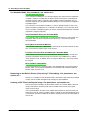
Env:
Avg:
BoxAvg:
Normal mode
Envelope mode
Average mode
Box average mode
17
18
Note
In some cases, the LCD on the SL1400 may include few defective pixels. For details, see section
18.4.
App
Index
IM 701240-01E
1-7
1.3 Display Screens
Screen When Displaying Zoom Waveforms
Display position of zoom waveform Z1
on the normal waveform
T/div (time per division) of Z1
Zoom range of Z1
Display position of zoom waveform Z2
on the normal waveform
Zoom range of Z2
T/div (time per division)
of the normal waveform
display
Normal waveform
display area
Record length of Z1
T/div (time per division)
of Z2
Zoom waveform
display area
Record length of Z2
Z1 zoom waveform
display area
1-8
Z2 zoom waveform
display area
IM 701240-01E
Chapter 2
2.1
Explanation of Functions
1
System Configuration and Block Diagram
2
Explanation of Functions
System Configuration
3
USB PERIPHERAL
interface
4
USB storage device
(MO, HDD, or flash memory)
Save/Load data
SCSI
USB keyboard
External SCSI device
(MO, Zip drive, etc.)
Built-in printer
(rear panel)
5
6
Built-in HDD (option)
• External clock input
• External trigger input
• Video signal output
• Trigger output
Device under
measurement
USB mouse
7
USB PERIPHERAL
interface
SL1400
8
Screen data
USB printer
Signal input
module*1
•
• Probe*2
• FTP server
• FTP client
• Web server
*1 • High-Speed 10 MS/s, 12-Bit
Isolation Module
• High-Speed High-Resolution
1 MS/s, 16-Bit Isolation Module
• High-Speed 10 MS/s, 12-Bit
Non-Isolation Module
• High-Voltage 100 kS/s, 16-Bit
Isolation Module (with RMS)
• Temperature, High Precision
Voltage Isolation Module
• Universal (Voltage/Temp.) Module
• Universal (Voltage/Temp.) Module
(with AAF)
• Strain Module (NDIS)
• Strain Module (DSUB, Shunt-Cal)
• Acceleration/Voltage Module
(with AAF)
• Frequency Module
• GP-IB interface
• RS-232 interface
• USB interface
• Waveform data
(Remote control through
• Setup data
command communications)
• Screen data
• SCSI
(data download)
Personal
computer
(PC)
9
10
11
12
Printer
PC card
13
Shared HDD
14
15
Ethernet interface (option)
*2 • Differential probe
• Current probe
• Logic probe
FTP
server
16
Printer
server
PC
Network printer
17
Printer
18
App
Index
IM 701240-01E
2-1
2.1 System Configuration and Block Diagram
Block Diagram
Module Block Diagram
Plug-in Module CH1 - CH16
CPU Block Diagram
Acquisition Block Diagram
701250(HS10M12)
FLT
12
A/D
AMP
ATT
CPU
ASIC
FLT
ATT
12
A/D
AMP
ACQ Memory
50MW
Main Memory
64 MB
Isolator
Isolation Block
701255(NONISO_10M12)
FLT
ATT
AMP
ATT
AMP
12
A/D
ASIC
Printer
Controller
FLT
A/D
Internal Thermal
Printer (A4 width)
12
701251(HS1M16)
701260(HV(with RMS))
FLT
ATT
AMP
ATT
AMP
16
A/D
ASIC
FLT
Graphic
Controller
GIGAZoom
Engine
10.4 Color TFT
SVGA 800 × 600
16
A/D
(ACQ-ASIC)
Isolator
Isolation Block
VIDEO OUT(SVGA)
701261(UNIVERSAL)
701262(UNIVERSAL(AAF))
RJC
H
FLT
ATT
CPU
16
A/D
AMP
L
RJC
H
PC CARD
ASIC
FLT
ATT
A/D
AMP
16
L
SCSI
Isolator
Isolation Block
701265(TEMP/HPV)
USB
RJC
H
ATT
A/D
AMP
GP-IB
ASIC
RJC
ATT
A/D
AMP
701270(STRAIN_NDIS)
701271(STRAIN_DSUB)
+
+
+
-
AD
AMP
16
ASIC
FLT
Inst.
AMP
AD
AMP
RS-232 Port
Ethernet
Ext. Clk In
16
DAC
Bridge
Power
GP-IB Port
Logic Probe
DAC
Bridge
Power
100 BASE-LAN
POD-B
FLT
Inst.
AMP
+
USB Port
POD-A
Isolator
Isolation Block
RS-232
Logic Probe
16
L
SCSI Port
CPU
16
L
H
40 GB
HDD
Isolator
Isolation Block
Ext. trig In/out
701275(ACCL/VOLT)
Current source
FLT
ATT
16
AD
AMP
ASIC
Current source
FLT
ATT
AD
AMP
16
Isolator
Isolation Block
701280(FREQ)
FLT
ATT
AMP
ASIC
COMP
CPU
ASIC
FLT
ATT
AMP
Isolation Block
COMP
Isolator
Signal Flow on the SL1400
The flow of the signal applied to the input signal varies depending on the input module. Here, the high-speed 10
MS/s, 12-bit isolation module (701250 (HS10M12)) is used as an example for the explanation. (For details on the
flow of the signal of each module, see the block diagram.)
The signal applied to the two input terminals is first processed by the input section of each module.
On the 701250 (HS10M12), (1) the attenuator (ATT) attenuates and the amplifier (AMP) amplifies the input signal,
(2) the filter (FLT) limits its bandwidth, and (3) the A/D converter samples the input signal at a sample rate of 10
MS/s (10 million times per second) and converts the signal to digital data. Then, the signal passes through the
isolator and ASIC and enters the waveform processing ASIC (ACQ-ASIC).
The 16 channels of digital data collected at the CPU board passes through the waveform processing ASIC (ACQASIC) and stored in the acquisition memory (ACQ Memory). The digital data stored in the ACQ memory is
compressed at high speeds by the waveform processing ASIC (ACQ-ASIC), passes through the graphic controller,
and shown on the SVGA TFT color display.
The SL1400 can acquire simultaneously up to 16 analog input channels and 16-bit logic data.
2-2
IM 701240-01E
2.2
1
Setting the Horizontal and Vertical Axes
2
Record Time
3
When using the internal clock*, the time axis scale is set using the length of time within
one screen. The record time is the length of time within one screen. The record time is
set in units of second, minute, hour, and day. The transition from seconds to minutes to
hours to days is automatically performed. The selectable record time varies depending
on the maximum record length installed in the SL1400, the number of channels whose
display is turned ON, and the specified sample rate.
*
Internal clock and external clock (time base selection)
Under the initial setting, the sampling timing of waveform data is controlled by the clock signal
generated from the time base circuit within the SL1400.
The sampling timing can also be controlled by a clock signal applied externally. External clock
signals are input through the external clock input terminal on the left panel facing the SL1400.
This external clock input is useful for observing a signal whose period varies or for observing
waveforms by synchronizing to the clock signal of the signal being measured.
4
5
6
7
8
T/div
T/div is 1/10th the record time or the time per one grid square (1 div).
Record time 5 ms
10 div
Explanation of Functions
Horizontal (Time) Axis «For procedures, see section 5.2.»
9
Record time 10 ms
10 div
10
11
12
1 div = 500 µs
1 div = 1 ms
13
Sample Rate
The sample rate is the number of times the measured waveform is sampled (in unit of S/
s). The sample rate is set according to the measurement purpose or the speed of
variation.
The maximum sample rate varies depending on the module. The SL1400 can display
waveforms correctly up to one-half the frequency of the sample rate as defined by the
Nyquist sampling theorem.*
*
If the sample rate is comparatively low with respect to the input signal frequency, the
harmonics contained in the signal are lost. In this case, some of the harmonics will appear at
low frequencies due to the effects described by the Nyquist sampling theorem. This
phenomenon is called aliasing. You can prevent aliasing by acquiring waveforms with the
acquisition mode set to envelope.
Aliasing signal
Input signal
14
15
16
17
18
Sampling point
App
Index
IM 701240-01E
2-3
2.2 Setting the Horizontal and Vertical Axes
Record Length
The term record length normally refers to the number of data points acquired per channel
in the acquisition memory. The record length changes when you change the record time
or sample rate (see appendix 1). The following equation holds: record length = record
time × sample rate. The maximum record length of the SL1400 is 50 MW. The measured
waveform signal of a single channel can be acquired up to the maximum record length of
50 MW when only a single channel is displayed.
The record length that is stored in the acquisition memory and the record length of the
displayed waveform are the same.
Display along the Time Axis
There are 10 divisions along the time axis, and 1001 points (logical number of points, not
the dots on the screen) are used to draw the waveforms. Therefore, if the record length
is exactly 1 kW (the number of acquired data points is 1001), the waveform is displayed
using 1001 points. However, if the record length is greater than or equal to 2 kW, the
maxim and minimum values are determined (P-P compression) and aligned at the same
time position (total number of points: 2002) to draw the waveform.
Sampled data
Record length
Maximum value
Vertical axis
Minimum value
1001 points*
1000
0
* 1001 points is a logical number
of points. On the screen the
data is compressed to 651 dots
(when the zoom waveform area is
expanded to 751) and displayed.
<P-P compression display>
Time axis
Zooming Horizontally and Drawing Waveforms
The SL1400 is capable of expanding (zooming) the waveform horizontally (see page
2-34). When the zoom rate of the waveform is increased, the number of displayed
points decreases. The waveform is displayed P-P compressed until the number of
display points falls to 2002 points. When the number of displayed points falls below
1001, the waveform can no longer be displayed using continuous lines. In this case,
the display data is interpolated using the display interpolation function (see page 2-33)
so that the number of displayed points is 1001 points.
2-4
IM 701240-01E
2.2 Setting the Horizontal and Vertical Axes
1
Dot Display
2
Explanation of Functions
By default, the display interpolation function works automatically. However, you can
also disable the display interpolation in which case the waveform is displayed using
dots. In this setting, up to 100100 points (100 kpoints) of the acquired data are
displayed without using P-P compression. For example, if the display record length is
10 kW (the number of acquired data points is 10010 points), all the points of the
waveform are drawn by aligning 10 points vertically at the same time axis positions. If
the number of acquired data points exceeds 100100, only the data per given interval
is displayed. In other words, the data is decimated down to 100100 points (100 k
points) for displaying the waveform.
3
4
5
Record Time and Roll Mode Display
If the trigger mode is set to Auto, Auto Level, Single, or Log and the record time is set
greater than or equal to 1 s/div, the waveform is displayed in roll mode. In roll mode, the
displayed waveform is not updated using triggers (update mode). Rather, the oldest data
is deleted as new data is acquired, and the waveform is shifted from right to left on the
screen.
6
7
8
9
Roll mode display allows waveforms to be observed in the same way as on a pen
recorder. It is useful in observing signals with a long period or signals that change slowly.
It is also useful in detecting glitches (spikes in the waveform) that occur intermittently.
10
11
12
13
14
15
16
17
18
App
Index
IM 701240-01E
2-5
2.2 Setting the Horizontal and Vertical Axes
Vertical (Voltage) Axis (for Modules Other Than the Strain Module) «For procedures,
see section 5.3.»
Setting the Voltage Range
The voltage range setting is used to adjust the displayed amplitude of the waveform so
that it can be easily observed. The voltage range is set using a voltage across the top
and bottom edges of the waveform display area (10 divisions). The voltage range
changes by switching the input section to an attenuator with different values of
attenuation. The sensitivity is changed in steps as in 1 V to 2 V to 5 V.
If 10 V is changed to 5 V
10 V
5V
Vertical position
mark
Ground mark
Measurement Range and Display Range
The measurement range of the SL1400 is ±10 divisions (20 divisions of absolute width
(span) around 0 V. The display range of the screen is ±5 divisions (10 divisions of span).
The following functions can be used to move the displayed waveform and display the
waveform outside the display range by expanding/reducing the displayed waveform.
• Move the vertical position → See page 2-7.
• Zoom in or out vertically (expand/reduce) → See page 2-7.
+10 div
+5 div
Measurement
0V
range
20 div
–5 div
Displayed
range
10 div
–10 div
2400 levels
Note
•
•
2-6
For measuring the voltage with high accuracy
To measure the voltage with high accuracy, set the voltage range so that the input signal is
measured with as large amplitude as possible.
Measurement Resolution
The measurement resolution varies depending on the module. For example, the 701250
(HS10M12) and 701255 (NONISO_10M12) sample the input signal using a 12-bit A/D
converter at a resolution of 150 levels per division. The 701251 (HS1M16), 701260 (HV (with
RMS)), 701261 (UNIVERSAL), 701262 (UNIVERSAL (AAF)), 701265 (TEMP/HPV), and
701275 (ACCL/VOLT) sample the input signal using a 16-bit A/D converter at a resolution of
2400 levels per division.
IM 701240-01E
2.2 Setting the Horizontal and Vertical Axes
1
Vertical Position of Waveforms «For procedures, see section 5.4.»
Since the SL1400 can display the waveforms of the analog input channels (CH1 to
CH16) and computation waveforms (Math1 to Math8), the waveforms may overlap
making them difficult to be observed. In this happens, you can change the vertical
display position of waveforms for easier viewing.
The vertical position can be moved within a range of ± 5 div.
The voltage sensitivity per division switches around the vertical position mark.
2
Explanation of Functions
3
4
Position: 3 div
5
Position:0 div
6
Vertical position
mark
7
Position: –3 div
Zooming in or out Vertically «For procedures, see sections 5.8 and 5.9.»
Zooming in or out by Setting the Magnification
8
You can expand or reduce the waveform display vertically in the range of ×0.1 to ×100
(varies depending on the input module) for each displayed waveform. The waveform
display can be zoomed around the vertical position.
9
10
If V Zoom is set to ×2
11
Vertical position
mark
12
Ground mark
1 div = 0.5 V
13
Zooming in or out According to the Upper and Lower Limits of the Display
Range
14
1 div = 1 V
You can zoom in on the desired section of the observed waveform by specifying the
upper and lower limits of the vertical axis to change the display range to a narrower
range for each displayed waveform. Conversely, you can widen the display range to view
waveforms outside the display range.
+10 V
15
16
+6 V
17
Zoom
+4 V
18
–10 V
App
+2 V
Index
IM 701240-01E
2-7
2.2 Setting the Horizontal and Vertical Axes
Input Coupling «For procedures, see section 5.5.»
If you want to measure just the amplitude of an AC signal, it is best to remove the DC
component from the input signal. On the other hand, there are times when you want to
check the ground level or measure the entire input signal (both the DC and AC
components). In these cases, you can change the input coupling setting. By changing
the input coupling, the input method used to input the signal to the vertical control circuit
(voltage axis) is switched. The following types of input coupling are available.
DC
The input signal is directly coupled to the attenuator of the vertical control circuit. Select
DC if you want to measure the entire input signal (DC and AC components).
AC (Only When Measuring the AC Voltage)
The input signal is coupled to the attenuator of the vertical control circuit through a
capacitor. Select AC if you want to measure only the amplitude of the AC signal,
eliminating the DC components from the input signal.
GND
Input signal is coupled to the ground not to the attenuator of the vertical control circuit.
By selecting GND, you can check the ground level on the screen.
GND
DC
AC
Input
terminal
Input
terminal
1 MΩ
Vertical
control
circuit
Vertical
control
circuit
1 MΩ
Input
terminal
Vertical
control
circuit
TC (Only When Measuring the Temperature)
Select TC if you are measuring the temperature using the 701261 (UNIVERSAL),
701262 (UNIVERSAL (AAF)), or 701265 (TEMP/HPV).
DC-RMS
Using the 701260 (HV (with RMS)), both the DC and AC components of the signal are
converted to rms values and displayed. An RMS conversion circuit is connected to the
vertical control circuit of the same input coupling circuit used when the coupling is set to
“DC.”
AC-RMS
Using the 701260 (HV (with RMS)), only the AC component of the signal is converted to
rms values and displayed. An RMS conversion circuit is connected to the vertical control
circuit of the same input coupling circuit used when the coupling is set to “AC.”
DC-RMS
Input
terminal
1 MΩ
AC-RMS
Vertical
control
circuit
RMS
conversion
circuit
Input
terminal
AD
1 MΩ
Vertical
control
circuit
RMS
conversion
circuit
AD
ACCL (Only When Measuring Acceleration)
Select ACCL if you are measuring acceleration on the 701275 (ACCL/VOLT).
2-8
IM 701240-01E
2.2 Setting the Horizontal and Vertical Axes
Probe Attenuation or Current-to-Voltage Conversion Ratio «For procedures, see section 5.6.»
When using a probe, the attenuation setting on the SL1400 must be set equal to the
probe attenuation or current-to-voltage conversion ratio so that the measured voltage
(current) can be read directly.
The SL1400 has the following attenuation settings: 1:1, 10:1, 100:1, 1000:1, 10A:1V,*1 and
100A:1V.*2 If you are using a probe other than the ones provided as accessories (sold
separately), set the attenuation ratio on the SL1400 according to the attenuation of the probe.
2
Explanation of Functions
For voltage (current) measurement, a probe is normally used in connecting the circuit
being measured to the signal input terminal. Using a probe has the following advantages.
• Prevents disturbing the voltage and current of the circuit being measured.
• Inputs the signal with no distortion.
• Expands the measurable voltage (current) range of the SL1400.
1
3
4
5
*1 Output voltage rate: 0.1 V/A
*2 Output voltage rate: 0.01 V/A
6
Note
Use a probe that matches the input capacity of each module. Otherwise, the capacity cannot be
adjusted.
7
8
Bandwidth Limit «For procedures, see section 5.7.»
A bandwidth limit can be applied for each module. By limiting the bandwidth, you can
eliminate high frequency components (such as high frequency noise) from the input
signal for waveform observation.
9
10
Linear Scaling «For procedures, see section 5.11.»
When measuring the voltage (current), strain, or frequency (number of rotations, period,
duty cycle, power supply frequency, pulse width, pulse integration, and velocity), there
are two methods of linear scaling: “AX+B” and “P1-P2.”
11
12
AX+B
Scaling is performed using the specified scaling coefficient A and offset B according to
the equation shown below. Cursor measurement values and automated measurement
values of waveform parameters are displayed using scaled values. You can also assign
a unit to the linearly scaled value.
13
14
Y = AX + B (where X is the measured value and Y is the scaling result)
P1-P2
15
Specify arbitrary scale values (P1:Y and P2:Y) for the measured values of two arbitrary points
(P1:X and P2:X). The conversion equation (y = ax + b) is derived from these four values.
16
Scale value
y = ax + b
P1:Y
17
P2
P2:Y
18
P1
App
P1:X
P2:X
Measured value
Index
Measurement range
In addition, the current input value can be loaded into P1:X or P2:X.
IM 701240-01E
2-9
2.2 Setting the Horizontal and Vertical Axes
Inversion «For procedures, see section 5.12.»
When measuring voltage or strain, the waveform can be displayed with the vertical axis
inverted around the vertical position as shown below.
Normal display
Inverted display
Vertical position
mark
Pulse/Rotate «For procedures, see section 5.20.»
When the time base is set to external clock, one data sample is captured to the
acquisition memory when one pulse of the external clock signal is input. You can specify
the number of pulses of the external signal (in other words, the number of data samples
captured in the acquisition memory) that will correspond to one mechanical rotation (one
cycle). The selectable range is from 1 to 24000 pulses. For example, if the pulse/rotate
setting is set to 100 pulses, then 10 rotations of data samples will be acquired when the
record length is set to 1 kW. When the pulse/rotate setting is set to 1 pulse, one data
sample will correspond to one rotation (one cycle).
The pulse/rotate setting affects only the X-axis (horizontal) measurement values in
cursor measurements and the time axis display on the screen. For example, if the pulse/
rotate setting is 100 pulses and the record length is 1 kW, 1 division will be 1 rotation. In
this case, moving the cursor by 1 division during cursor measurements causes the
horizontal measured value to increase or decrease by “1.”
2-10
IM 701240-01E
2.2 Setting the Horizontal and Vertical Axes
1
RMS Measurement «For procedures, see section 5.13.»
If the module of the selected channel is a 701260 (HV (with RMS)), the rms value of the
input signal can be observed.
This setting is used when you want to observe only the rms values of the AC signal,
eliminating the DC components from the input signal.
Explanation of Functions
AC-RMS
2
3
Example
When the rms value of a 2-Vpeak sinusoid input signal is measured, a DC waveform at
approximately 1.4 V is displayed (see the right figure below).
4
5
2 Vpeak
Approx. 1.4 V
6
7
8
The rms value is derived from the following equation:
1
T
T
u(t)2 dt
Where u(t) is the input signal and T is one period of the input signal.
9
0
If u(t) = Vmsinωt (where Vm is the peak value and ω is the angular velocity (= 2 πf, where f
is the frequency of the sinusoid signal)), the rms value, Vrms, is derived from
Vrms =
2
The average of u(t) over one cycle =
10
2π
1
2π
2
(Vmsinwt) dwt = Vm
2
0
11
As in the above example, when Vm is 2 V, the rms value, Vrms, is approximately 1.4 V.
DC-RMS
12
This setting is used when you want to observe the rms values of both the DC and AC
components of the input signal.
13
Example
When the rms value of a 2-Vpeak sinusoid input signal riding on top of a 1-V DC
component is measured, a DC waveform at approximately 1.7 V is displayed (see the
right figure below).
14
15
2 Vpeak + 1 Vdc
Approx. 1.7 V
16
17
18
If the DC component is expressed as Vdc and the AC component as u(t) = Vmsinωt, the
rms value, Vrms (+DC), of the sinusoid input signal riding on top of the DC component is
derived from the following equation:
Vrms(+DC) =
1
2π
2π
2
(Vmsinwt+Vdc) dwt =
0
Vm
2
2
2
+ (Vdc)
Index
As in the above example, when Vdc is 1 V and Vm is 2 V, the rms value, Vrms (+DC), is
approximately 1.7 V.
IM 701240-01E
App
2-11
2.2 Setting the Horizontal and Vertical Axes
Temperature Measurement «For procedures, see section 5.14.»
Thermocouple Types
The following types of thermocouples are available.
K, E, J, T, L, U, R, S, B, N, W, and Au7Fe
Selectable Temperature Units
You can select °C or K.
Reference Junction Compensation (RJC)
The voltage generated by a thermocouple depends on the temperature of the spot of
measurement and the reference junction temperature. In this case, the function used to
compensate the temperature on the measurement instrument side to the cold junction is
referred to as reference junction compensation. The SL1400 normally performs
reference junction compensation with the built-in RJC circuit. The SL1400 allows you to
turn ON or OFF the internal reference junction compensation.
Burnout
This function is used to accurately detect a burnout in the thermocouple. If the
thermocouple measurement input detects a burnout, the measured value is fixed to the
upper limit of the measurement range of each thermocouple.
Strain Measurement «For procedures, see section 5.15.»
Strain can be measured by connecting a strain gauge bridge (bridge head) or a strain
gauge transducer to the strain module (701270 (STRAIN_NDIS) or 701271
(STRAIN_DSUB)).
Relationship between the Strain (µSTR) and the Transducer Output (mV/V)
The SL1400 allows the unit to be changed between “the strain unit (µSTR: ×10–6 strain)”
and “the output unit of the strain gauge transducer (mV/V)*.” The following relationship
exists between µSTR and mV/V.
*
Unit corresponding to the output of the strain gauge transducer. A value expressing the
transducer output per volt applied to the bridge in mV. You can set the bridge voltage
(excitation: voltage applied to the bridge) from 2 V, 5 V, and 10 V. However, since the mV/V
value is a converted value, the measured value is basically constant.
mV/V = 0.5×(µSTR/1000)
Example
500 (µSTR) → 0.5×500(µSTR/1000) = 0.25 (mV/V)
Gauge Factor (K) when mV/V Is Selected
You can set the gauge factor to an arbitrary value on the SL1400. However, if there are
no specifications on the strain gauge transducer, set K to 2.
If K is not 2, e is derived within the SL1400 using the following equation.
e = (4/K)×(V/E)
e:
Measured value of the strain gauge transducer [mV/V]
V:
Voltage measured on the bridge [V]
E:
Voltage applied to the bridge [V]
K:
Gauge factor
2-12
IM 701240-01E
2.2 Setting the Horizontal and Vertical Axes
1
Shunt Calibration
The 701271 (STRAIN_DSUB) supports shunt calibration.
*
Shunt calibration refers to the act of correcting the gain of the strain measurement by
connecting a known resistance (shunt calibration resistance) to the strain gauge in parallel.
Explanation of Functions
For a description of the basic defining equation of strain, see appendix 9. For details on
shunt calibration, see appendix 10.
2
3
4
Acceleration Measurement «For procedures, see section 5.16.»
The Acceleration/Voltage Module (with AAF) (701275 (ACCL/VOLT)) measures
acceleration using the output signal from the acceleration sensor. Direction connection is
possible to a built-in amplifier type acceleration sensor. Direct connection is not possible
to a charge output type acceleration sensor that does not have a built-in amplifier.
5
6
Current Supply to Acceleration Sensors
The 701275 (ACCL/VOLT) can supply 4 mA of current to the acceleration sensor when
measuring acceleration.
7
Filter
8
If you set the bandwidth limit to Auto, the anti-aliasing filter (AAF) and low-pass filter are
enabled depending on the sample rate to eliminate high-frequency noise from the input
signal. Using the anti-aliasing filter when measuring voltage allows elimination of aliasing
noise resulting from FFT computation. The filter is effective not only during acceleration
measurement but also during voltage measurement.
Frequency Measurement «For procedures, see section 5.17.»
The Frequency Module (701280 (FREQ)) measures frequency, number of rotations,
period, duty cycle, power supply frequency, pulse width, pulse integration, and velocity.
9
10
11
12
Measurement Items
Frequency
13
Frequency (Hz) = 1/Tw (s)
Period
14
Period (s) = Tw (s)
Tw(s)
15
16
RPMs/RPSs
RPMs = Frequency (Hz)/the number of pulses per rotation (Nr) × 60
RPSs = Frequency (Hz)/the number of pulses per rotation (Nr)
17
F (Hz)
18
Nr: The number of
pulses per rotation
App
Index
IM 701240-01E
2-13
2.2 Setting the Horizontal and Vertical Axes
Duty Cycle
Duty cycle (%) = Thigh (s)/Tw (s) or Duty (%) = Tlow (s)/Tw (s)
Tw(s)
Thigh(s)
Tlow(s)
Pulse Width
Pulse width (s) = Thigh (s) or Pulse width (s) = Tlow (s)
Thigh(s)
Tlow(s)
Power Supply Frequency
Power supply frequency (Hz) = 1/Tw (s)
Tw(s)
Pulse Integration (Distance/Flow Rate)
Pulse integrated value = N (count) × physical amount per pulse (I)
Set the physical amount per pulse (I) to distance or flow rate. A suitable user-defined
unit can be assigned to the specified physical amount.
N (count)
l
Velocity
Velocity (km/h) = Distance per pulse l (km)/Tw (s) × 3600
Velocity (m/s) = Distance per pulse l (m)/Tw (s)
The distance and unit can be user defined (angular velocity, etc.).
Tw(s)
Distance
per pulse (l)
2-14
IM 701240-01E
2.2 Setting the Horizontal and Vertical Axes
1
Deceleration Prediction and Stop Prediction
2
The deceleration curve is computed according to the following equation using the
elapsed time after the pulse input stops (∆t).
Frequency (f) = 1/period (∆t)
The deceleration prediction starts after a pulse period (T) of the pulse one period
before the pulse input stopped elapses after the pulse input stopped.
Explanation of Functions
The 701280 (FREQ) automatically performs internal computation and displays waveforms
by predicting the deceleration curve and stop point even when the input pulse is suddenly
cut off. This function allows the measurement of waveforms of deceleration behavior that is
close to the actual physical phenomenon in applications in which the deceleration behavior
of an object that have inertia is measured such as in the brake test of automobiles.
Stop Prediction
6
The function determines the stop point at a constant time after the pulse input stops,
and the frequency is set to 0. The time from the point when the pulse input stops to
the point when the function determines that the object has stopped can be set to ×1.5,
×2, ×3, ... , ×9, and ×10 (10 settings) of the pulse period (T) of the pulse one period
before the pulse input stopped.
7
Deceleration Prediction
4
5
Pulse input stop
T×n
n: 1.5 to 10
f0
T
Deceleration
prediction
t
f = 1/ t
3
8
9
10
Stop prediction
11
0
Filter
Smoothing Filter (Moving Average)
The frequency module can display waveforms by taking the moving average of the
data in realtime. The order of moving average can be set in terms of time in the range
of 0.1 ms to 1 s (up to 25000th order). The order of moving average is equal to the
specified time divided by 40 µs.
The smoothing filter has the following characteristics.
• Converts a waveform that changes in steps to a smooth waveform.
• Improves the resolution by reducing the measurement jitter. The resolution improves
especially when measuring high frequencies or when expanding the display using the
offset function. Consequently, highly accurate measurements can be made.
• Can be used on all measurement parameters of the frequency module.
12
13
14
15
16
17
When using the smoothing filter
Filter order: 400 ms
18
App
Original
waveform
Index
IM 701240-01E
2-15
2.2 Setting the Horizontal and Vertical Axes
• When using the offset function (see this page) and making
measurements by expanding near 100 kHz
Original waveform
•Value/div:
200 Hz/div
•Upper display limit: 101 kHz
•Lower display limit: 99 kHz
When using the smoothing filter
Filter order: 50 ms
The accuracy improves when
the smoothing filter is used.
Pulse Average
Measures the input pulse by dividing the pulse by the specified number of pulses (1 to
4096 pulses). The pulse average has the following characteristics.
• If pulse dropouts are present or pulse interval is fluctuating within a period,
measurements can be made by eliminating the effects from the dropout or
fluctuation (fluctuating component of the waveform used to measure the frequency
or period).
• The measured result is displayed as a value per input pulse even when pulse
average is used. Therefore, there is no need to perform scaling again.
• Can be used when measuring frequency, number of rotations, power supply
frequency, pulse integration, and velocity.
N = 11
f1
f2
f3
When pulse average is used
When pulse average is not used
Offset Function
The 701280 (FREQ) allows you to set the center of observation (offset value) and
expand the area around the offset value for close observation. It allows you to measure
the fluctuation around a certain frequency.
Logic Waveforms «For procedures, see section 5.18.»
Logic waveforms can be measured by connecting logic probes to the logic signal input
connectors (two connectors marked Logic A and Logic B) on the left side panel. A-1 to A8 (8 bits) and B-1 to B8 (8 bits) can be applied to the Logic A and Logic B ports,
respectively.
2-16
IM 701240-01E
2.3
1
Setting the Trigger
2
The trigger used on the SL1400 can be classified into two main types: simple trigger and
enhanced trigger.
Simple Trigger
3
4
This function activates a trigger on a single trigger source.
Input Signal Trigger
A trigger is activated when the trigger source (input signal of CH1 to CH16, Logic A, or
Logic B) reaches or exceeds the preset trigger level (rising) or falls to or below the
trigger level (falling) or both.*
*
Explanation of Functions
Trigger Type «For procedures, see chapter 6.»
A trigger is activated when the specified trigger condition is met. At this point, the waveform is
ready to be displayed on the screen.
Trigger slope refers to the rising or falling edge of the signal.
Trigger level
5
6
7
8
Trigger source
9
When set to rising (
), the trigger occurs here
External Trigger
A trigger is activated using the external signal applied to the EXT TRIG IN terminal on
the side panel of the SL1400.
10
11
Line Trigger
A trigger is activated on the rising edge of the power signal that is being supplied to
the SL1400. Waveforms synchronized to the commercial power supply frequency (50
Hz or 60 Hz) can be observed.
12
13
Timer Trigger
A trigger is activated at specified time intervals (1 min to 24 hours) from a specified
time.
14
Specified date/time
15
Trigger is activated
Trigger is activated
Trigger is activated
16
Specified time
17
18
App
Index
IM 701240-01E
2-17
2.3 Setting the Trigger
Enhanced Trigger
A −>B(N) Trigger
A trigger is activated the Nth time condition B becomes true after condition A has
become true.
A
True
B
True N times
Trigger
Condition A
Condition B
CH1 to CH16
L:
Low level
H:
High level
X:
Don't care
LogicA/LogicB
Disable: Do not use logic input
Enable: Use logic input
Condition
Enter: True when the preset condition is met
Exit:
True when the preset condition is not met
A Delay B Trigger
A trigger is activated the first time condition B becomes true after condition A has
become true and a preset time has elapsed.
Condition A
Condition B
CH1 to CH16
L:
Low level
H:
High level
X:
Don't care
LogicA/LogicB
Disable: Do not use logic input
Enable: Use logic input
Condition
Enter: True when the preset condition is met
Exit:
True when the preset condition is not met
2-18
IM 701240-01E
2.3 Setting the Trigger
1
Edge on A Trigger
A trigger is activated when an edge trigger is detected on any of the channels set to
edge trigger while condition A is true.
True
Explanation of Functions
A
2
3
Edge
detection Trigger
Condition A
CH1 to CH16
L:
Low level
H:
High level
X:
Don't care
:
:
4
5
Rising
Falling
Don't care
6
7
LogicA/LogicB
Disable: Do not use logic input
Enable: Use logic input
8
Condition
True:
While all channels match in the
preset pattern
False: While all channels do not match
the preset pattern
9
10
OR Trigger
A trigger is activated when any of the channels set to edge trigger meets the
condition. For example, a trigger can be activated on the rising edge of CH1 or CH2.
CH1 to CH16
11
12
: Rising
Falling
: Don’t care
13
14
15
16
LogicA/LogicB
Disable: Do not use logic input
Enable: Use logic input
17
18
App
Index
IM 701240-01E
2-19
2.3 Setting the Trigger
B > Time Trigger, B < Time Trigger, and B TimeOut Trigger
A trigger is activated on the falling or rising edge of the pulse when the pulse width
(width over which condition B is met) exceeds (or drops below) a preset time. In the
case of a timeout trigger, a trigger is activated when a preset time elapses.
CH1 to CH16
L:
Low level
H:
High level
X:
Don’t care
LogicA/LogicB
Disable: Do not use logic input
Enable: Use logic input
• B > Time Trigger
Time
B: Pulse width
B
Trigger
• B < Time Trigger
Time
B
Trigger
• B TimeOut Trigger
Time
B
Trigger
2-20
IM 701240-01E
2.3 Setting the Trigger
1
Period Trigger
A trigger is activated by measuring the pulse period (period from the time condition T
is met to the next time when condition T is met).
Explanation of Functions
T
2
CH1 to CH16
L:
Low level
H:
High level
X:
Don’t care
3
4
5
6
7
LogicA/LogicB
Disable: Do not use logic input
Enable: Use logic input
8
• T > Time
A trigger is activated when condition B is met the second time, if the time (T) when
condition B is met the second time is longer than a specified time.
10
When condition B: CH1=H and Time=10 µs
8 µs
8 µs
9
12 µs
11
CH1
B is true B is true B is true
B is true
Trigger activated here
12
• T < Time
A trigger is activated when condition B is met the second time, if the time (T) when
condition B is met the second time is shorter than a specified time.
13
When condition B: CH1=H and Time=10 µs
14
12 µs
12 µs
8 µs
CH1
15
B is true
B is true
B is true B is true
Trigger activated here
16
• T1 < T < T2
A trigger is activated when condition B is met the second time, if the time (T) when
condition B is met the second time is within a specified time range (T1 to T2).
18
When condition B: CH1=H, Time1=10 µs, and Time2=14 µs
8 µs
CH1
8 µs
12 µs
16 µs
12 µs
App
CH1
B is true B is true B is true B is true
B is true
Trigger activated here
IM 701240-01E
17
B is true B is true
Trigger activated here
2-21
Index
2.3 Setting the Trigger
• T < T1, T2 < T
A trigger is activated when condition B is met the second time, if the time (T) when
condition B is met the second time is outside a specified time range (T1 to T2).
When condition B: CH1=H, Time1=6 µs, and Time2=10 µs
8 µs
8 µs
12 µs
8 µs
CH1
8 µs 4 µs
CH1
B is true B is true B is true
B is true
Trigger
activated
here
B is true B is true B is true
B is true
Trigger
activated
here
Window Trigger
A certain voltage range (window) is set and a trigger is activated when the trigger
source level enters this voltage range (IN) or exits from this voltage range (OUT).
IN
OUT
Trigger is activated
Width
Center
Window
Width
Trigger is activated
Window
Center
Trigger is activated
CH1 to CH16
IN:
Enters the window
OUT: Exits from the window
- :
Don’t care
LogicA/LogicB
Disable: Do not use logic input
Enable: Use logic input
Edge trigger is used for the logic input.
: Don’t care
Falling edge
: Rising edge
2-22
IM 701240-01E
2.3 Setting the Trigger
1
Wave Window Trigger
2
Explanation of Functions
This trigger is used to monitor the power supply waveform. It detects abnormalities in the
power supply (disruption, sag, surge, frequency fluctuation, voltage drop, etc.).
A reference waveform (realtime template) is created by setting a tolerance (window width) to a
waveform derived by averaging 1 to 4 cycles of waveforms before the target cycle of the
current waveform. The current waveform is compared against the realtime template. If the
current waveform falls outside the realtime template, a trigger is activated.
3
4
4 cycles of the waveform immediately before
Target waveform
Power supply waveform
5
6
Realtime template
Trigger activated here
7
Averaged waveform
of 1, 2, and 4 cycles
Averaged waveform
+ tolerance width
Compare the target waveform against
the realtime template
Trigger activated when the current waveform
falls outside the realtime template
• Wave Window Trigger Example
Surge
(Trigger)
Disruption
(Trigger)
8
9
10
Sag
(Trigger)
11
12
Sag
(Trigger)
13
CH1 to CH16
ON: Use as a trigger source
OFF: Not use as a trigger source
14
15
16
17
Cycle Frequency: Power supply frequency of the measured item
Reference Cycle
Sync. Ch:
Synchronization channel1 for starting triggers
Level:
Level of the synchronization channel
Hys:
Hysteresis of the synchronization channel
*
IM 701240-01E
Because waveform determination is performed per cycle in wave window trigger,
synchronization signal must be retrieved from the reference channel, and the start and end
points of comparison must be detected. This reference channel is called a synchronization
channel. Sync.Ch is used to specify the synchronization channel, and Level is used to specify
the start level of the synchronization channel. Normally, Sync.Ch is set to Auto (the channel
with the smallest number among the modules that can perform wave window trigger). If the
trigger is not activated adequately, specify an appropriate channel.
2-23
18
App
Index
2.3 Setting the Trigger
Trigger Mode «For procedures, see section 6.1.»
The trigger mode sets the conditions for updating the displayed waveforms. The
following six trigger modes are available.
Auto Mode
If a trigger occurs within a specified amount of time (approximately 50 ms, referred to as
the timeout period), the displayed waveforms are updated. If a trigger is not activated
within the timeout period, the displayed waveforms are automatically updated.
Auto Level Mode
Within the timeout period (approximately 1 s), the waveforms are displayed in the same
fashion as in the auto mode. If a trigger is not activated within the timeout period, then
the center value of the amplitude of the trigger source is detected, and the trigger level is
changed to that value. A trigger is activated using the new value, and the displayed
waveforms are updated.
1/2 the amplitude
Trigger level
1/2 the amplitude
Amplitude
Normal Mode
The waveform display is updated only when a trigger occurs. (The displayed waveforms
are not updated if a trigger does not occur.)
Single Mode
When a trigger is activated, the displayed waveforms are updated only once, and
acquisition stops. This mode is suitable for observing a single-shot signal.
Single (N) Mode (Sequential Store Function)
This mode is selected when using the sequential store function (see section 2.4).
Waveforms are acquired and stored in different memory areas each time a trigger is
activated the specified number of times. Then, acquisition is stopped, and all the
acquired waveforms are displayed. Acquired waveforms can be displayed together, or
they can be displayed individually. This mode is useful for detecting sudden
abnormalities in a waveform.
1st acquisition
2nd acquisition
nth acquisition
Log Mode
In this mode, the trigger settings are disabled. The specified record length of data is
acquired once when acquisition is started, and the displayed waveforms are updated.
2-24
IM 701240-01E
2.3 Setting the Trigger
1
Trigger Delay «For procedures, see section 6.3.»
Normally, the waveform around the trigger point is displayed. However, by setting a
trigger delay, you can display the waveform that is acquired a specified time after the
trigger point.
Explanation of Functions
T (Trigger position)
2
3
Delay
4
Trigger point
5
Trigger Position «For procedures, see section 6.2.»
The trigger position specifies the position of the waveform captured in the acquisition
memory to be displayed on the screen. The point at which the trigger occurred is called
the trigger point. If the trigger delay described in the previous section is set to 0 s, the
trigger point and the trigger position match. By moving the trigger position, you can
observe the pre-trigger section of the waveform before the trigger point.
Display record length
Pre-trigger section
7
8
Trigger position
0%
6
100%
Post-trigger section
9
10
11
12
Trigger Source, Trigger Slope, and Trigger Level «For procedures, see sections 6.5 to
6.16.»
13
Trigger Source
Trigger source refers to the target channel on which trigger conditions are specified. You
can set an external trigger signal or a commercial power supply as a trigger source.
14
Trigger Slope
15
For an edge trigger, trigger slope specifies how the trigger source is to cross a specified
level for activating the trigger. Select the trigger slope from (rising), (falling), and
(both rising and falling).
16
17
Trigger Level
Trigger level refers to the voltage level that is used to determine the trigger slope (rising/
falling edge of the signal) and the like.
18
App
Index
IM 701240-01E
2-25
2.3 Setting the Trigger
Trigger Hysteresis «For procedures, see sections 6.5, and 6.10 to 6.16.»
If there is insufficient trigger level width such as when noise is present in the trigger source,
the trigger point fluctuates each time a trigger is activated. This causes the displayed
waveforms to be unstable. To solve this problem, a specified margin (hysteresis) is added
to the trigger level. You can select the trigger hysteresis from the following:
,
, and
. The hysteresis width varies depending on the input module.
Hysteresis width
Trigger is activated
Trigger Hold-off «For procedures, see section 6.4.»
Trigger hold-off refers to the act of temporarily stopping the detection of the next trigger
once a trigger has been activated. This function is useful when observing a pulse train
signal, such as a PCM code, and you want to display the waveform in sync with
repetitive cycles; or when using the history memory function described later and you
want to change the waveform acquisition period.
Repetition period: T
Trigger level
Input signal
Trigger source
signal
Trigger signal limited by hold off time t (when the trigger slope is set to rising edge)
t
Action-on-Trigger «For procedures, see section 6.18.»
A specified action can be executed each time a trigger is activated. The following five
types of actions are available.
Print the Screen Image Data (PRINT)
Prints the screen image to a specified printer.
Save the Screen Image Data (Image)
Saves the screen image data to the save destination specified in the IMAGE menu.
Save Waveform Data (Save to File)
Saves the waveform data in binary, ASCII, or floating format to the save destination
specified in the FILE menu.
Beep Sound (Buzzer)
Sounds a buzzer.
Send Mail
Sends an e-mail message to a specified address (when Ethernet interface option is
installed).
2-26
IM 701240-01E
2.3 Setting the Trigger
1
Manual Trigger «For procedures, see section 6.19.»
You can activate a trigger regardless of the specified trigger condition by pressing the
MANUAL TRIG key on the front panel.
2
Explanation of Functions
3
4
5
6
7
8
9
10
11
12
13
14
15
16
17
18
App
Index
IM 701240-01E
2-27
2.4
Setting Waveform Acquisition Conditions and
Display Conditions
Acquisition Mode «For procedures, see sections 7.2 and 7.3.»
When storing sampled data in the acquisition memory, it is possible to perform
processing on data and display waveforms based on the processed data. The following
four types of data processing are available.
Normal Mode
In this mode, sampled data are stored in the acquisition memory without data
processing.
Averaging Mode
Averaging is a process in which waveforms are acquired repeatedly to obtain the
average of waveform data at the same time point (the same time in relation to the trigger
point).
The SL1400 takes the simple or exponential average of the waveform data and writes
the results to the acquisition memory. The averaged data is then used to generate the
display. You can set the attenuation constant to a value between 2 and 256 (in 2n steps,
where n is a natural number) and the averaging count to a value between 2 and 65536.
Exponential average (when set to infinite)
Simple average (when set to 2 to 65536)
N
Σ Xn
1
An =
{(N – 1)An–1 + Xn}
N
AN =
An : nth averaged value
Xn : nth measured value
N : Attenuation (2 to 256, 2n steps)
Xn : nth measured value
N : Average count
(acquisition count, 2n steps)
n=1
N
Averaging is effective such as when eliminating the random noise riding on the signal.
Envelope Mode
In normal mode and averaging mode, if you increase the record time, you must reduce
the sample rate (the number of times data is acquired per second in the acquisition
memory) to keep the record length of the acquisition memory the same (see appendix 1).
However, in the envelope mode, the maximum and minimum values are determined at
every time interval from the data sampled at the maximum sample rate of each input
module. The time interval used to determine the values is twice the sample rate of the
normal mode. The maximum and minimum values are paired and stored in the
acquisition memory.
Envelope mode is effective when you want to avoid aliasing, since the sample rate is
kept high irrespective of the time axis setting. It is also effective when you want to detect
glitches (pulse signals which rise very fast) or display an envelope of a modulating
signal.
Envelope curve
2-28
IM 701240-01E
2.4 Setting Waveform Acquisition Conditions and Display Conditions
1
Box Average Mode
2 .....
.....
36
3
4
.
Voltage
Input signal
(500 kS/s)
1
. . . 20 21
2
Explanation of Functions
This mode is valid on the 701250 (HS10M12) and 701255 (NONISO_10M12). The rolling
average of the data sampled at the maximum sample rate is determined. The resultant
data is stored in the acquisition memory and used to generate the display. Box averaging
is effective in eliminating small amounts of noise from the input signal. It can also remove
noise from a single-shot signal.
5
Time
6
b
Voltage
Box averaged data
a
7
Time
8
Sequential Store «For procedures, see section 7.4.»
In the case of the history memory function describe in the next subsection, the waveform
data of each block is updated in order until the measurement is stopped. However, in the
sequential store function, you specify the waveform acquisition count (number of blocks),
and the measurement stops when the specified count is reached. The updating of the
waveform display is carried out after acquiring the entire waveform data. To acquire
waveforms using this function, set the trigger mode to Single(N). The maximum
Single(N) count is equal to N that is explained in the history memory function. The stored
waveform data can be recalled using the history memory function.
The figure below shows an example when data is sequentially stored 100 times.
Display example when the acquisition count is 100
• Displays all waveforms
• Displays only the newest
(When All display is
waveform(When Selected
executed)
Record No. = 0)
• Displays only the oldest
waveform(When Selected
Record No. = –99)
9
10
11
12
13
14
15
16
17
18
App
Index
IM 701240-01E
2-29
2.4 Setting Waveform Acquisition Conditions and Display Conditions
History Memory «For procedures, see section 11.1.»
If the record length is set short on the SL1400, the memory is divided into blocks, and
waveform data is saved to the individual blocks each time a trigger occurs. If N
represents the maximum number of blocks determined by the record length, the oldest
waveform data block is cleared when the number of activated triggers exceeds N. If you
stop the measurement, you can recall the waveform data stored in each block and
display the data on the screen. Once the specified number of waveforms have been
stored, you can display any of the waveforms individually or all of them together. This
function is useful when capturing the changes in the waveform over time.
The following figure indicates an example when N = 100.
Holds waveform data of the last 100 triggers
Currently displayed waveform
(Selected Record No. = 0)
Selected Record No. 0
Displays waveforms before the
currently displayed waveform
(Select the Selected Record
No. in the range of –1 to –99)
Selected Record No. –25
You can also search a particular waveform from the past waveforms that are held
(history search function). For details, see “History Search” in section 2.7.
2-30
IM 701240-01E
2.4 Setting Waveform Acquisition Conditions and Display Conditions
1
Realtime Recording to the Internal Hard Disk (Option) «For procedures, see section
7.5.»
The time axis range and the maximum sample rate that allow realtime recording vary
depending on the number of channels to be recorded in realtime. For details, see
appendix 3.
The following two modes of realtime recording operation are available.
Single:
Starts realtime recording with the start of waveform acquisition and stops
realtime recording when the specified record time is reached.
Continue: Starts realtime recording with the start of waveform acquisition and stops
realtime recording when the specified record time is reached. This
sequence is repeated the specified number of times (count).
2
Explanation of Functions
The data can be recorded in realtime to the internal hard disk (option). The stored data
can be recalled. The realtime recording area is allocated on the internal hard disk in
advance (the default value is 50% of the entire capacity of the internal hard disk). You
can set the realtime recording area in the range of 30% to 70% of the entire capacity of
the internal hard disk when you format the internal hard disk (see section 13.6).
3
4
5
6
7
If you select Single, Auto or Log trigger modes are available. If you select Continue, only
Log is valid.
Auto:
Acquisition is started by pressing START. If the specified record time is
exceeded, old data is overwritten. Acquisition continues until you press
STOP.
Log:
Acquisition is started by pressing START. When the specified record time is
reached, acquisition stops.
How the Internal Hard Disk (Option) Is Used
8
9
10
11
Copy
Copy
Realtime recording
Realtime recording
area
(30 to 70% of the
total capacity)
12
Data storage area
13
PC
14
Input signal
Recall the waveform
data
Measurements other
than realtime recording
(normal measurement)
Acquisition
memory
SCSI, GP-IB, Ethernet,
or USB interface
15
16
Save/Load the waveform data
17
18
App
Index
IM 701240-01E
2-31
2.4 Setting Waveform Acquisition Conditions and Display Conditions
Action-on-Stop «For procedures, see section 7.6.»
A specified action can be carried out when the waveform is displayed after acquiring the
specified record length of data after the measurement is started or when measurement is
stopped. The following five types of actions are available.
Print the Screen Image Data (PRINT)
Prints the screen image to a specified printer.
Save the Screen Image Data (Image)
Saves the screen image data to the save destination specified in the IMAGE menu.
Save Waveform Data (Save to File)
Saves the waveform data in binary, ASCII, or floating format to the save destination
specified in the FILE menu.
Beep Sound (Buzzer)
Sounds a buzzer.
Send Mail
Sends an e-mail message to a specified address (when Ethernet interface option is
installed).
Backing Up the Acquisition Memory «For procedures, see section 7.7.»
If the ACQ MEMORY BACKUP switch on the right side panel of the SL1400 is turned
ON, the history memory data in the acquisition memory is backed up even when the
power supply is cut off. The data held in the acquisition memory is backed up
immediately before the power is turned OFF. This function protects the data in the
acquisition memory from sudden power failures.
Alkaline dry cells or nickel hydride rechargeable batteries (four AAA batteries) are
required for the backup. The backup time varies depending on the operating
environment.
For reference values of the backup time, see section 18.5.
Display Format and Waveform Mapping «For procedures, see section 8.1.»
Display Format
Waveforms can be displayed in divided windows to facilitate the viewing of multi-channel
waveforms and computed waveforms.
Waveform Mapping
You can select the mapping of the input channels to the divided windows from the
following:
Auto:
The input channels whose display is turned ON are assigned in order by the
channel numbers.
Fixed: Waveforms are assigned in order from the top regardless of whether the input
channel display is turned ON/OFF.
User:
The channels can be assigned arbitrarily to the divided windows regardless of
whether the input channel display is ON/OFF.
2-32
IM 701240-01E
2.4 Setting Waveform Acquisition Conditions and Display Conditions
1
Display Interpolation «For procedures, see section 8.2.»
2
Explanation of Functions
In areas where less than 1000 points of data exist in the 10 divisions along the time axis
(referred to as interpolation areas), a continuous waveform cannot be displayed because
there is not enough sampled points. In this case, waveform is displayed by interpolating
between data points. You can select the interpolation method from the following:
3
Linear Interpolation
Linearly interpolates between two points.
4
Sine Interpolation
sin x
Generates interpolation data using the function sin(x)/x then interpolates between
x
two dots using the resulting sine curve. Sine interpolation is suitable for observing sine
waves or similar waves.
5
6
Interpolation OFF
Displays discrete dots without performing interpolation.
Linear Interpolation
Sine Interpolation
7
Interpolation OFF
8
9
If the interpolation is OFF, waveforms are displayed using dots. In this setting, up to
100100 points (100 kpoints) of the acquired data are displayed without using P-P
compression (page 2-4). For details, see page 2-5.
10
11
Graticule «For procedures, see section 8.3.»
You can change the type of graticule that is displayed to suit your needs. For example,
you can show a grid on the screen or show only the frame.
12
Accumulated Display «For procedures, see section 8.4.»
This mode holds each waveform on the screen for a time that is longer than the update
cycle, so that newer waveforms appear overlapped on older waveforms. If you select
Persist, the waveforms are accumulated.
Accumulated display is useful when you want to observe jitters and temporary turbulence
in waveforms. Accumulated display is also possible on waveforms that are recalled using
the history memory function.
13
14
15
16
17
18
App
Index
IM 701240-01E
2-33
2.4 Setting Waveform Acquisition Conditions and Display Conditions
Zooming in on the Waveform Horizontally «For procedures, see section 8.5.»
The displayed waveform can be expanded along the time axis. This function is useful
when the waveform acquisition time is set long and you want to observe a particular
section of the waveform closely. Zooming is not possible if the number of displayed
points on the screen is less than or equal to 10 (less than or equal to 50 for FFT
waveforms). The zoom position is set in units of divisions of the grid.
Display Format When the Waveform Is Zoomed
Zoomed waveforms of two locations can be displayed simultaneously (dual zoom).
Below are the combinations of the display methods of zoom waveforms.
Main:
Main waveform display frame
Z1, Z2: Zoom waveform display frame
<Main>
<Z1>
<Z2>
<Main>
<Z1>
<Z1> or <Z2>
<Z2>
<Z1> or
<Z2>
When displaying Main (main waveform) and Z1 or Z2 (zoomed waveform)
simultaneously, a zoom box indicating the zoom position is displayed within the main
waveform display frame. The center of the zoom area corresponds to the center of the
zoom box.
Z1 box
Z2 box
Main waveform
display frame
Z1 waveform
display frame
Z2 waveform
display frame
Auto Scroll
The zoom box automatically moves (scrolls) in the specified direction. You can scroll
while viewing the expanded waveform.
2-34
IM 701240-01E
2.4 Setting Waveform Acquisition Conditions and Display Conditions
1
X-Y Waveform «For procedures, see section 8.6.»
2
Explanation of Functions
The voltage relationship between signals can be observed by assigning the voltage of
the input signal of the specified channel on the horizontal axis (X-axis) and the voltage of
another input signal (signal that has the display turned ON) on the vertical axis (Y-axis).
Simultaneous observation of X-Y waveforms and normal T-Y waveforms (waveform
display using voltage axis and time axis) is possible.
You can use the X-Y waveform display function to measure the phase angle between
two sine wave signals. For example, the waveform that appears when two sine
waveforms are shown on the X-Y display is called a Lissajous waveform. From this
waveform, the phase angle can be read.
3
4
5
Lissajous waveform
Phase
angle 0°
6
7
Phase
angle 45°
8
Phase
angle 90°
Frequency
ratio
(X:Y)
9
1:1
1:2
1:3
10
Snapshot «For procedures, see section 8.7.»
If the trigger mode is set to a mode other than single, the displayed waveforms are
periodically updated or displayed in roll mode.
The snapshot function allows you to temporarily hold the waveform that would be cleared
when the screen is updated (snapshot waveform) on the screen. The snapshot
waveform is displayed in white, allowing for easy comparison against the updated
waveform. The snapshot waveform is a screen image waveform. You can save, load,
and print the screen image data, but cursor measurements, automated measurement of
waveform parameters, zoom, and computation cannot be performed on it.
11
12
13
14
Snapshot waveforms
15
16
Clear Trace «For procedures, see section 8.7.»
You can clear the snapshot waveform and restart averaging and accumulation using one
key operation.
Pressing the CLEAR TRACE key temporarily clears the measured waveforms from the
screen. Pressing the ESC key redisplays them.
Translucent Display «For procedures, see section 8.8.»
The pop-up menu is shown translucent so that the display under the pop-up menu can
be seen.
17
18
App
Index
IM 701240-01E
2-35
2.4 Setting Waveform Acquisition Conditions and Display Conditions
Scale Values «For procedures, see section 8.9.»
The upper and lower limits (scale values) of the vertical and horizontal axes of each
channel can be displayed.
Waveform Labels «For procedures, see section 8.10.»
A waveform label can be assigned arbitrarily to the input waveform of each channel
using up to eight characters.
Extra Window «For procedures, see section 8.11.»
This area displays data such as cursor measurement values and values resulting from
automated measurement of waveform parameters. The extra window is useful when
reading of the values is difficult because waveforms are overlapping them.
Level Indicators «For procedures, see section 8.12.»
The level of each waveform is displayed using an indication mark to the right of the
waveform display frame.
Trigger position
Level indicator
Waveform label
Scale value
Extra window
(Displays cursor
measurement values)
Channel Information, Numeric Monitor, and Waveform Display Area Expansion «For
procedures, see section 8.13.»
If you clear the setup menu by pressing ESC, channel information is displayed such as
the voltage/division, input coupling, probe attenuation (type), bandwidth limit,
temperature/division , thermocouple type, µSTR/division (or [mV/V]/division),
measurement range, acceleration/div, gain, bias, value/division, measurement mode,
and preset settings. However, some items are skipped when the number of displayed
channels increases.
Pressing ESC once when the channel information is displayed clears the channel
information and shows the numeric monitor.
Pressing ESC once when the numeric monitor is displayed expands the waveform
display area horizontally to cover the entire screen.
If you press SELECT when the channel information or waveform monitor is displayed or
when the waveform display area is expanded and an item is under jog shuttle control in
the setup menu that was showing immediately before you pressed ESC, the item is
displayed at the upper right of the display and can be controlled using the jog shuttle.
2-36
IM 701240-01E
2.5
1
Recording in Recorder Mode
2
Explanation of Functions
The SL1400 is equipped with an A-4 size printer. If Chart Recorder mode is selected in
the menu that appears when MODE is pressed and waveform acquisition is started, T-Y
waveforms (T-Y waveform recording) or numeric values can be recorded in realtime. In
addition, if X-Y Recorder mode is selected and waveform acquisition is started and
stopped, the X-Y waveform over the interval in which waveform was acquired can be
recorded (X-Y waveform recording).
3
4
5
Chart Recorder Mode «For procedures, see sections 9.1 to 9.5.»
Print Style
In Chart Recorder mode, the print style can be selected from the following two styles.
T-Y Waveform Recording
In T-Y waveform recording, recording is performed at the specified chart speed (10
mm/h to 20 mm/s). The scale used in T-Y waveform recording is fixed to 10 mm per
division on the horizontal axis (time axis). The scale on the vertical axis (voltage axis)
can be set to 10 mm per division or [1 division of the 10 equally divided chart
recording zone] per division. The recording can also be stopped automatically after
recording a specified length (shot recording).
6
7
8
9
Numeric Value Recording
Numeric values can be recorded at the specified time interval (1 s to 60 min). Up to 16
channels can be recorded. If waveform acquisition is started on more than 16
channels, 16 channels are recorded in the following order: CH1 to CH6, Logic A, and
Logic B.
10
11
Acquisition Mode during Chart Recorder Mode
12
During Chart Recorder mode, the acquisition mode is set to envelope. The acquisition
mode cannot be changed using the ACQ menu as with the normal operation. However,
the acquisition mode can be changed to normal using other menus. Select normal mode
if you are using the acquired waveform as numeric data such as in an analysis.
13
14
Selectable Trigger Modes in Chart Recorder Mode
The following four trigger modes are available.
15
Auto
Recording on the built-in printer starts at the same time measurement is started by
pressing START/STOP. Recording continues until measurement is stopped by
pressing START/STOP again. The maximum number of divisions of the most recent
data that can be saved (see page 2-39) is saved in the internal memory.
Measurement start
16
17
Measurement stop
18
The maximum number of
divisions of the most recent data
is saved in the internal memory.
Record start
App
Record stop
Index
IM 701240-01E
2-37
2.5 Recording in Recorder Mode
Log
Recording on the built-in printer starts at the same time measurement is started by
pressing START/STOP. Measurement and recording stop automatically when the
maximum number of divisions of measured values that can be saved is recorded. The
maximum number of divisions of measured data that can be saved is saved in the
internal memory.
Measurement stop (the point where the maximum number
of divisions of data that can be saved was measured)
Measurement start
The maximum number of
divisions of the data is saved
in the internal memory.
Record start
Record stop (the point where the maximum number
of divisions of data that can be saved was recorded)
Single (Only during T-Y Waveform Recording)
Recording on the built-in printer starts when the trigger condition is met after
measurement is started by pressing START/STOP. The data is saved to the internal
memory at the same time recording is started. Measurement and recording stop when
the maximum number of divisions of measured values that can be saved is recorded.
The maximum number of divisions of measured data that can be saved is saved in the
internal memory.
Measurement stop (the point where the maximum number of
Measurement start
Trigger condition met
divisions of data that can be saved was measured)
The maximum number of
divisions of the data is saved
in the internal memory.
Record stop (the point where the maximum number
Record start
of divisions of data that can be saved was recorded)
Repeat (Only during T-Y Waveform Recording)
Recording on the built-in printer starts when the trigger condition is met after
measurement is started by pressing START/STOP. The data is saved to the internal
memory at the same time recording is started. Recording stops when the shot record
length of measured values is recorded. Then, the SL1400 enters the trigger-wait
state. The most recent shot record length of measured data is saved to the internal
memory.
Measurement start
Trigger condition met
Trigger-wait
state
Measurement stop
Trigger condition met
Trigger-wait
state
The most recent shot record
length of data is saved in the
internal memory.
Record start
Record stop
Record start
(Point where the shot record
length of data is recorded)
2-38
Record stop
(Point where the shot record
length of data is recorded)
IM 701240-01E
2.5 Recording in Recorder Mode
1
Saving Data in the Internal Memory
*
2
Explanation of Functions
In Chart Recorder mode, up to 1000 divisions of the recorded data are automatically
saved in the internal memory. The required section of the data that has been cleared
from the screen can be redisplayed after the recording is finished by using functions
such as zoom (limited to the data in the range defined by “Number of Data Points That
Can Be Saved” below). As with the normal data (data when the recorder mode is OFF),
cursor measurements, automated measurement of waveform parameters, normal
statistical processing*, zoom, and display setting modification in the DISPLAY menu can
be performed on the redisplayed data. The redisplayed data can also be saved as
waveform data in the same fashion as normal data.
Furthermore, the redisplayed data can be reprinted by changing the print conditions or a
PDF file of the reprint image can be created (see “Reprinting on the Built-in Printer” or
“Creating a PDF File of the Reprinted Image” on page 2-40).
3
4
5
6
Cyclic statistical processing and statistical processing of history data cannot be performed in
Chart Recorder mode.
7
Number of Data Points That Can Be Saved
If the chart speed is slow, the number of data points that can be saved in the internal
memory is reduced. For example, if the chart speed is 10 mm/h, up to 100 divisions of
data (up to 4 days of data) are saved. If the chart speed is 20 mm/s, up to 1000
divisions of data (up to 8 minutes 20 seconds of data) are saved. The maximum
number of divisions that can be saved for each chart speed is as follows:
Chart Speed
Maximum Number of Divisions That Can Be Saved
20 [mm/s] to 1 [mm/s]
1000
100 [mm/min] to 2 [mm/min]
1 [mm/min]
1000
500
100 [mm/h]
50 [mm/h]
25 [mm/h]
20 [mm/h]
10 [mm/h]
1000
500
250
200
100
8
9
10
11
12
13
For the relationship between the chart speed and sample rate, see appendix 2.
Functions That Cannot Be Used in Chart Recorder Mode
When making measurements in Chart Recorder mode, functions of history memory and
waveform computation cannot be used (The HISTORY key and MENU key > MATH
menu cannot be used).
Measured Data Compatibility
The measured data in Chart Recorder mode is not compatible with the measured data in
Memory mode. The measured/saved data in Chart Recorder mode cannot be loaded in
Memory mode, and vice versa.
14
15
16
17
18
App
Index
IM 701240-01E
2-39
2.5 Recording in Recorder Mode
X-Y Recorder Mode «For procedures, see section 9.6.»
X-Y Waveform Recording:
In X-Y waveform recording, the X-Y waveform display starts when waveform acquisition
is started. If reprint is executed from the Reprint Setup menu after the record length of
waveform (fixed to 1 MW) is acquired or after stopping waveform acquisition, the X-Y
waveform acquired up to the point immediately before the measurement was stopped is
recorded on paper.
The scale of the X-Y waveform recording is 10 mm per division for both X- and Y-axes,
and the waveform recording area is ±10 divisions (20 divisions). The screen also shows
the X-Y waveform. Recording to paper can also be started automatically when waveform
acquisition is stopped (auto print).
Acquisition Mode during X-Y Recorder Mode
The acquisition mode is automatically set to normal mode during X-Y record mode. The
acquisition mode cannot be changed using the Menu key > ACQ menu as with the
normal operation.
Saving Data in the Internal Memory
In X-Y recorder mode, up to 1 MW of data is automatically saved in the internal memory.
Also, a PDF file of the reprint image can be created.
Functions That Cannot Be Used during X-Y Recorder Mode
When making measurements in X-Y Recorder mode, functions of history memory and
waveform computation cannot be used (The HISTORY key and MENU key > MATH
menu cannot be used). In addition, items set using the MENU key > ACQ menu cannot
be changed.
Measured Data Compatibility
The measured data in X-Y Recorder mode is not compatible with the measured data in
Memory mode. The measured/saved data in X-Y Recorder mode cannot be loaded in
Memory mode, and vice versa.
Reprinting on the Built-in Printer (Only during T-Y Recording) «For procedures, see
section 9.7.»
After the T-Y recording in Chart Recorder mode is finished, the data stored in the internal
memory can be recalled and reprinted by changing the print conditions.
Creating a PDF File of the Reprint Image «For procedures, see section 9.8.»
After the waveform recording in Chart Recorder mode or X-Y Reorder Mode is finished,
the data stored in the internal memory can be recalled and a PDF file of the reprint
image can be created.
In X-Y Recorder Mode, the most recent 1 MW of data stored in the internal memory are
output to the PDF file. If data exceeding 1 MW is recalled, the waveform displayed on the
screen and the waveform recorded on the printer may differ from the waveform output to
the PDF file.
2-40
IM 701240-01E
2.6
1
Waveform Computation
2
Addition, Subtraction, Multiplication, and Division «For procedures, see section 10.1.»
Addition, subtraction, multiplication, and division can be performed between two arbitrary
waveforms of CH1 to CH16 and Math1 to Math7. These computations are useful in the
following cases.
Addition and subtraction: Comparison with the standard signal, confirmation of the
signal logic, phase comparison, etc.
Multiplication and division: Confirmation of the power waveform by applying the voltage
and current signals, etc.
+Computation
waveform
–Computation
waveform
×Computation
waveform
Explanation of Functions
Various computations can be performed on up to 800 kW of data on the SL1400. (If a waveform
greater than 800 kW is displayed, computation cannot be performed over all the data at once.)
The computed results become Math1 to Math8 waveforms.
3
4
5
6
7
8
Waveform to
be computed
9
Computed
waveform
10
Binary Computation «For procedures, see section 10.2.»
The specified waveform is converted to a digital waveform of 0s and 1s with respect to
the specified threshold level. The computation can be performed on CH1 to CH16 and
Math1 to Math7.
11
12
Power Spectrum Display «For procedures, see section 10.3.»
The power spectrum of the input signal can be displayed by taking the FFT (Fast Fourier
Transform). This is useful when you wish to check the frequency distribution of the input signal.
13
14
15
Power spectrum
waveform
16
The following three FFT windows are available.
Rectangular (Rect)
17
The rectangular window is best suited to transient signals, such as impulse waves, which
attenuate completely within the time window.
18
Hanning and FlatTop
The Hanning and flattop windows allow continuity of the signal by gradually attenuating the parts
of the signal located near the ends of the time window down to the 0 level. Hence, it is best suited
to continuous signals. With the Hanning window, the frequency resolution is high compared to
the flattop window. However, the flattop window has a higher level of accuracy. When the
waveform being analyzed is a continuous signal, select the proper window for the application.
IM 701240-01E
2-41
App
Index
2.6 Waveform Computation
FFT is performed on 1000, 2000, 5000, 10000, 20000, 50000, or 100000 points of
measured data. The data is converted to half the specified number of points and
displayed.
Window
Integral
Rectangular
window
T
Power spectrum
T
Hanning window
Sine wave
T
T
t
Flat top window
T
T
Rectangular window : W(t) = u(t) – u(t – T)
Hanning window
Flat top window
U(t): Step function
t
: W(t) = 0.5 – 0.5 cos(2 π )
T
sin{2 π(1 – 2t/T)}
: W(t) = {0.54 – 0.46 cos(2 π t )}
T
2 π(1 – 2t/T)
FFT Function
Given that the complex function resulting after the FFT is G = R + jI, the power spectrum
can be expressed as follows:
2+ 2
Power spectrum = 10 log
(R 2 I )
R: Real Part, I: Imaginary Part
Reference value (0 dB) of the logarithmic magnitude (Log mag): 1 Vrms2
Phase Shift «For procedures, see section 10.4.»
You can shift the phase of CH1 to CH16 and Math1 to Math7 waveforms and display the
resultant waveforms or perform computation using the phase-shifted data.
Scaling of Computed Waveforms «For procedures, see chapter 10.»
Normally, the SL1400 performs auto scaling when computed waveforms are displayed.
However, you can also select manual scaling. When auto scaling, the upper and lower
limits suitable for displaying the waveform are determined from the first computed
waveform. If you select manual scaling, you can arbitrarily set the upper and lower limits
of the computed waveform display.
2-42
IM 701240-01E
2.7
1
Waveform Analysis and Search
2
Past waveform data (history waveforms) stored in the acquisition memory can be
displayed when waveform acquisition is stopped. You can display a specified history
waveform from the data (up to 2000 waveforms, or the number of triggers) stored in the
acquisition memory.
The number of waveforms N that can be acquired and held as history waveforms varies
from 1 to 2000 depending on the record length and acquisition mode settings. The
waveform currently displayed on the screen (most recent waveform) is counted as the
1st waveform, and up to N–1 waveforms in the past can be displayed.
Explanation of Functions
Displaying History Waveforms «For procedures, see section 11.1.»
3
4
5
6
History Search «For procedures, see sections 11.2 and 11.3.»
You can search history waveforms that meet specified conditions when waveform
acquisition is stopped.
7
Zone Search
8
You can search history waveforms that pass or do not pass a specified search zone.
Waveform stored in the history memory
9
Specified area
10
Selected Record No. 0
11
Detects the waveform that
passed through the specified area
12
Selected Record No. –25
13
Waveform Parameter Search
You can search history waveforms that meet or do not meet the specified search
parameter conditions.
14
Waveform that was saved using the history memory function
15
Item Setup : P-P
Condition : OUT
End Rec
Selected Record No. 0
16
Start Rec
Detects a waveform
whose P-P exceeds
a specified range
17
P-P
T-Range1
Selected Record No. 28
18
T-Range2
App
Index
IM 701240-01E
2-43
2.7 Waveform Analysis and Search
Cursor Measurement «For procedures, see section 11.4.»
The following cursors are available for analyzing the values of each waveform data.
H (Horizontal) Cursors
Two broken lines (H cursors) are displayed on the X-axis (horizontal axis). The voltage of
each H cursor and the voltage difference between the H cursors are measured.
V (Vertical) Cursor
Two broken lines (V cursors) are displayed on the Y-axis (vertical axis). The time from
the trigger position to each V cursor and the time difference between the V cursors are
measured. The voltage value of the signal at each cursor position and the voltage
difference between the cursors are also measured.
H&V Cursors
H cursors and V cursors are displayed simultaneously.
Marker Cursors
Four markers are displayed on the specified waveform. The voltage and the time from
the trigger position of each marker as well as the voltage difference and time difference
between markers are measured.
Degree Cursors
Measures the angle between two angle cursors with respect to a reference angle
corresponding to the width between the zero point and the end point, which are
measurement references.
• H cursor
• V cursor
Cursor1
Cursor1
Cursor2
Cursor2
Cursor measurement value
Cursor measurement value
(when the extra window is not displayed)
(when the extra window is displayed)
• Marker cursor
Marker 1
Marker 2
• Angle cursor
Marker 4
Reference
cursor 1
Reference
width
Marker 3
Cursor1 Unit
2-44
Reference
cursor 2
Cursor2
IM 701240-01E
2.7 Waveform Analysis and Search
Automated Measurement of Waveform Parameters «For procedures, see section 11.5.»
2
Explanation of Functions
Automated measurement can be performed on parameters such as the rise time and
pulse width on the specified channel. There are 29 measurement parameters. Up to 24
parameters from the selected parameters of all channels can be displayed. The
measurement range is up to 10 MW from the measurement start point (Time Range1).
1
3
Measurement
range
4
5
6
Automated measured value
of waveform parameters
7
Statistical Processing «For procedures, see section 11.6.»
Statistical processing is performed on the measured values of automated waveform
parameters described on the previous item. The following five statistics are determined
on the three measured values of automated measurement parameters.
The number of measured values used to determine the maximum value, minimum value,
average value, standard deviation, and statistical processing.
8
9
10
Measurement range
11
12
Values obtained by the
automated measurement
of statistical processing
targets
Statistical processing
results
13
14
The following three statistical processing modes are available.
15
Normal Statistical Processing
Statistical processing is performed on all acquired waveforms while acquiring
waveforms.
16
17
18
App
Index
IM 701240-01E
2-45
2.7 Waveform Analysis and Search
Cyclic Statistical Processing
Divides the displayed waveform using a cycle that is automatically calculated and
determined and performs statistical processing on the values obtained through the
automated measurement of waveform parameters over the determined cycle.
Statistical processing is performed from the oldest measured data of the displayed
waveform. Statistical processing of up to 48000 measured values of automated
waveform parameters is possible. If statistical processing is performed on a single
parameter, statistical processing of up to 48000 cycles is possible.
Example in which CH1 is selected as the waveform used to determine the cycle
CH2
CH1
a
b
c
Automated measurement parameters are measured in each range, a, b, and c, and
statistical processing is performed on the automated measurement parameters in the order
a, b, and c.
The automated measurement parameters of other channels are also measured using
ranges a, b, and c.
Automated measurement can also be made using the cycle of each waveform as the range.
Statistical Processing of History Data
Performs automated measurement of waveform parameters on the waveform that is
acquired using the history memory function and performs statistical processing.
Statistical processing is performed from the oldest waveform.
2-46
IM 701240-01E
2.8
1
Communications
2
Explanation of Functions
Command Communications (GP-IB, Serial (RS-232), USB, and Ethernet) «For
procedures, see the Communication Interface User’s Manual on the CD-ROM.»
3
The SL1400 comes standard with GP-IB, serial (RS-232), and USB interfaces. The
Ethernet interface is available as an option.
Through communication functions, you can output waveform data to a PC for data
analysis or control the SL1400 using an external controller to carry out waveform
measurements.
SL1400
Communication
interface
4
5
6
PC
7
Saving/Loading Data to a Network Drive (FTP Client Function) «For procedures, see
chapter 15.»
Waveform data,*1 screen image data, and setup data can be saved, deleted, or copied
on an FTP server*2 on the network in the same way as the built-in PC card, internal hard
disk (option), or external SCSI device.
*1 The following types of waveform data cannot be loaded from a network drive.
• Waveform data that is 50 MB or more in size.
• Waveform data saved on the all waveform display (All) of the history memory function.
*2 PC or workstation on which the FTP server function is running.
8
9
10
11
Ethernet
12
13
SL1400
FTP server
14
Printing on a Network Printer «For procedures, see section 15.4.»
The screen image data can be printed on a network printer in the same way as the builtin printer or USB printer.
15
16
Ethernet
17
SL1400
18
Printer
App
Index
IM 701240-01E
2-47
2.8 Communications
Transmitting E-mail Messages (SMTP Client) «For procedures, see section 15.5.»
Information from the SL1400 can be transmitted periodically in an e-mail message to a
specified mail address. You can also transmit information such as the trigger time in an
e-mail message as an action for action-on-trigger.
Ethernet
PC
SL1400
E-mail
Accessing the SL1400 from a PC or Workstation (FTP Server Function) «For
procedures, see section 15.6.»
The files on the built-in PC card, internal hard disk (option), or external SCSI device on
the SL1400 can be retrieved by accessing the SL1400 from an FTP client* on the
network.
*
PC or workstation on which the FTP client function is running.
Ethernet
PC
or
Workstation
FTP server
(SL1400)
Web Server Function «For procedures, see section 15.7.»
The SL1400 can function as a Web server. By using the Web page of the SL1400, file
transfer, monitoring of displayed waveforms, basic SL1400 key control, and retrieval of
waveform data are possible.
Ethernet
Web server
(SL1400)
2-48
PC
IM 701240-01E
2.9
1
Other Useful Functions
2
You can connect a USB keyboard for entering file names, comments, and other
information. In addition, the functions of each key on the front panel of the SL1400 are
assigned to the keys on the keyboard. Thus, the keyboard can be used to carry out
operations that are the same as the key operations on the SL1400. For the key
assignments, see appendix 7.
Explanation of Functions
Entering Values and Strings from a USB Keyboard «For procedures, see section 4.3.»
3
4
5
USB keyboard
USB connection
SL1400
6
7
Operations Using a USB Mouse «For procedures, see section 4.3.»
You can use a USB mouse to operate the SL1400 as you would using the front panel keys.
In addition, you can point to a desired item on a menu and click the item. This is analogous
to pressing a soft key corresponding to a menu and pressing the SELECT key.
8
9
SL1400
10
USB mouse
Initialization «For procedures, see section 4.4.»
The settings of each key can be reset to their initial conditions. However, date and time settings,
communication settings, and SCSI ID setting are not initialized. To reset the communicationrelated and SCSI ID settings to factory default, turn ON the power while holding down RESET.
Release RESET after a beep sound is heard. (Date and time settings are not reset.)
Auto Setup «For procedures, see section 4.5.»
This function automatically sets the voltage axis, time axis, trigger settings, and other
settings to suit the input signal. This is useful when the characteristics of the input signal are
unknown. However, the auto setup function may not work depending on the input signal.
11
12
13
14
Printing the Screen Image «For procedures, see chapter 12.»
15
Screen images can be printed on the built-in printer (option), USB printer, or network
printer (when the Ethernet interface option is installed).
16
Built-in printer
Ethernet
Printer server
USB
17
Supporting TCP/IP
(LPR protocol)
SL1400
18
USB printer
Network printer
App
Note
There is a function that enables comments to be entered and displayed using a keyboard that
appears on the screen or a USB keyboard. You can enter a comment describing the displayed
waveform before printing the screen image. The comment is printed along with the waveform
allowing the printed matter to be identified later on.
IM 701240-01E
2-49
Index
2.9 Other Useful Functions
Saving and Loading Data on the Storage Medium «For procedures, see chapter 13.»
The SL1400 allows various data to be stored to and loaded from the following storage
media.
• PC card
• Internal hard disk (option)
• External USB storage (MO disk, hard disk, and flash memory)
• External SCSI device (MO disk, Zip disk, etc.)
• Network drive (when the Ethernet interface option is installed)
Internal hard disk (option)
PC
SL1400
MO/
Zip drive,
etc.
PC card
Saving the Screen Image Data and Displaying the Thumbnails of the
Stored Screen Image Data
The screen image data can be stored to a specified storage medium. The data can be
stored in PNG, JPEG, BMP, and PostScript formats allowing the screen image to be
pasted on a document created with a DTP application.
In addition, the thumbnails (reduced and simplified image) of the screen image data
saved to the storage medium can be displayed on the SL1400 screen. This feature is
useful for checking the contents of the stored screen image data.
Thumbnail Display on the FILE Menu
Selecting a file from the File List and
pressing SELECT displays
the thumbnail screen of the selected
screen image data
Thumbnail screen
Thumbnail Display on the IMAGE Menu
Thumbnail screen
Pressing the Thumbnail soft key displays a
thumbnail screen of the screen image data
saved to the specified format.
2-50
Thumbnail screen
Selecting a file from the File List and
pressing SELECT displays the thumbnail
screen of the selected screen image data
IM 701240-01E
2.9 Other Useful Functions
Saving and Loading Setup Data, Waveform Data, and Snapshot Waveform
1
Data
2
Explanation of Functions
The setup data, waveform data, and snapshot waveform data can be saved to or loaded
from a specified storage medium.
3
Saving the Results of the Automated Measurement of Waveform
Parameters
The automated measured values of waveform parameters can be stored to a specified
storage medium.
4
5
Creating a PDF File of the Print Image «For procedures, see section 13.14.»
By setting the output destination in the PRINT menu to “PDF,” a PDF file of the print
image (image similar to fine print (see section 12.1)) can be created. A print image of the
specified range and magnification is created to the specified file name on the specified
storage medium simply by pressing the PRINT key.
6
7
Operating the SL1400 Using a Free Software Program
The SL1400 can be controlled from a PC using Wirepuller, a free software program,
when connected via the GP-IB, USB, or Ethernet interface. The software program can be
downloaded from the following Web pages.
• English version
• Japanese version
http://www.yokogawa.com/tm/tm-softdownload.htm
http://www.yokogawa.co.jp/tm/F-SOFT/
8
9
10
Connecting the SL1400 and the PC via the SCSI «For procedures, see section 13.19.»
You can connect a PC to the SCSI of the SL1400 and download the files on the internal
hard disk (option) to the PC.
You cannot upload or delete files on the internal hard disk. If you do, the internal hard
disk may become unusable.
The following limitations exist.
While connected to the PC, the File List window of the SL1400 may not be displayed
properly. If the connected PC enters sleep, standby, or rest mode, the SL1400 will not be
able to access its internal hard disk. Before connecting the PC to the SL1400, disable
such modes on the PC.
11
12
13
14
15
16
17
18
App
Index
IM 701240-01E
2-51
Chapter 3
3.1
Preparations for Measurements
1
Handling Precautions
2
Safety Precautions
3
Do Not Remove the Case
4
Do not remove the case from the instrument. Some parts of the instrument use high
voltages, which are extremely dangerous. For internal inspection and adjustment,
contact your nearest YOKOGAWA dealer.
5
If you notice any symptoms of trouble such as unusual odors or smoke coming from the
instrument, immediately turn OFF the power switch and unplug the power cord. If these
symptoms occur, contact your nearest YOKOGAWA dealer.
Preparations for Measurements
If you are using this instrument for the first time, make sure to thoroughly read “Safety
Precautions” on pages vi to viii.
Handle the Power Cord with Care
8
Do not place objects on top of the power cord and keep it away from any heat sources.
When unplugging the power cord from the outlet, never pull by the cord itself. Be sure to
pull by the plug. If the power cord is damaged, contact your dealer for replacement.
Refer to page iii for the part number when placing an order.
9
6
Unplug If Abnormal Behavior Occurs
7
10
General Handling Precautions
Do Not Place Objects on Top of the Instrument
11
Never place other instruments or objects containing water on top of the instrument,
otherwise a breakdown may occur.
12
Do Not Apply Shock to the Input Section
Applying shock to the input connectors or probes may turn into electrical noise and enter
the instrument via the signal lines.
13
Do Not Damage the LCD
14
Since the LCD screen is very vulnerable and can be easily scratched, do not allow any
sharp objects near it. Also, it should not be exposed to vibrations and shocks.
15
Unplug during Extended Non-Use
16
Unplug the power cord from the outlet.
17
18
App
Index
IM 701240-01E
3-1
3.1 Handling Precautions
Carry the Instrument Properly
First, remove the power cord and connection cables. Always carry the instrument by the
handles as shown below or carry it with both hands.
Clean the Instrument Properly
When cleaning the case or the operation panel, first remove the power cord from the
outlet. Then, wipe with a dry, soft, clean cloth. Do not use volatile chemicals such as
benzene or thinner for cleaning, as this may lead to discoloration or deformation.
3-2
IM 701240-01E
3.2
1
Installing the Instrument
2
Installation Conditions
Install the instrument in a place that meets the following conditions:
3
Set the instrument in the proper direction (see page 3-4) and in a level and stable place. Note
that the instrument can be tilted on the stand if the instrument is set with the rear panel facing
down. If placed in an uneven or unstable place, printing quality may deteriorate.
Preparations for Measurements
Flat, Even Surface
4
5
Well-Ventilated Location
There are vent holes on the bottom side of the instrument. In addition, there are vent
holes for the cooling fans in the left side and top panels. To prevent internal overheating,
allow for enough space around the instrument (see the figure below) and do not block
the vent and inlet holes.
6
7
8
9
10
11
10 cm
or more
12
10 cm
or more
13
10 cm
or more
5 cm
or more
14
15
16
When connecting various cables or when opening or closing the built-in printer cover,
provide extra space for operation in addition to the space indicated above.
Ambient Temperature and Ambient Humidity
17
Ambient temperature: 5 to 40°C
Ambient humidity:
20 to 85%RH (when the printer is not used) } No condensation
35 to 85% RH (when using the printer)
18
Note
•
•
IM 701240-01E
To ensure high measurement accuracy, operate the instrument in the 23 ± 5°C temperature
range and 55 ± 10% RH.
Condensation may occur, if the instrument is moved to another place where the ambient
temperature is higher or if the temperature changes rapidly. In such cases, allow the
instrument adjust to the new environment for at least an hour before using the instrument.
3-3
App
Index
3.2 Installing the Instrument
Do Not Install the Instrument in the Following Places.
•
•
•
•
•
•
In direct sunlight or near heat sources.
Where an excessive amount of soot, steam, dust, or corrosive gas is present.
Near strong magnetic field sources.
Near high voltage equipment or power lines.
Where the level of mechanical vibration is high.
On an unstable surface.
Installation Position
Place the instrument in a horizontal position or with the rear panel facing down. When
using the stand, pull it until it locks (see the right figure below). To retract it, press the
stand backward while pressing it inward.
Installed horizontally
Installed with the rear
panel facing down
Installed using the stand
Rubber Feet
If the instrument is installed in a horizontal position as shown in the figure above, rubber
stoppers can be attached to the feet to prevent the instrument from sliding. One set (four
pieces) of rubber feet are included in the package.
3-4
IM 701240-01E
3.3
1
Installing Input Modules
2
3
WARNING
IM 701240-01E
3-5
Preparations for Measurements
• To prevent electric shock and damage to the instrument, make sure to turn OFF
the power before installing or removing the input module.
• Check that the input cable is not connected to the input terminals before
installing or removing the input module.
• To prevent electric shock and to satisfy the specifications, make sure to put the
accessory cover plate on the slots that are not being used.
Using the instrument without the cover plate allows the dust to enter the instrument
and may cause malfunction due to the rise in temperature inside the instrument.
• If the input module happens to come out of the slot while it is in use, it may cause
electric shock or cause damage to the instrument as well as the input module. Make
sure to screw the input module in place at the two locations (top and bottom).
• Do not put your hand inside the slot, because there are protrusions along the
module guide that may injure your fingers.
• Precautions to Be Taken When Using the Modules
• Do not apply input voltage exceeding the maximum input voltage, withstand
voltage, or allowable surge voltage.
• To prevent electric shock, be sure to furnish protective earth grounding of the
SL1400.
• To prevent electric shock, be sure to fasten the module screws. Otherwise,
the electrical protection function and the mechanical protection function will
not be activated.
• Avoid continuous connection under an environment in which the allowable
surge voltage may occur.
• When measuring high voltages using the 701250 (HS10M12) or the 701251
(HS1M16), use the isolated probe (700929), 1:1 safety cable (combination of
701901 and 701954), or differential probe (700924).
• Be sure to connect the GND lead of the differential probe (700924) to the
functional ground terminal of the SL1400. High voltage may appear at the
BNC connector of the differential probe. Be sure to connect the GND lead to
the SL1400 before connecting the probe to the parameter to be measured.
• When using the 701255 (NONISO_10M12), be sure to fasten the module screws.
Fastening the module screws activates the protection function and the non-isolation
function. It is extremely dangerous if you do not fasten the screws. In addition, when
measuring high voltage above 42 V, be sure to use the passive probe (701940).
• The BNC part of the passive probe (701940) is made of metal. Therefore, use
the probe at 42 V or less for isolated inputs (701250 (HS10M12), 701251
(HS1M16), 701260 (HV (with RMS)), 701275 (ACCL, VOLT), and 701280
(FREQ)) for safety reasons. (Do not connect voltage above 42 V to both the
High and Low sides.) For non-isolated inputs (701255 (NONISO_10M12),
etc.), fasten the module screws as described before.
• When applying high voltage using the 701260 (HV (with RMS)), use the 1:1
safety cable (combination of 701901 and 701954) or the isolated probe (700929).
• The measurement category of the 701260 (HV (with RMS)) is 400V-CAT II for
the low side and 700V-CAT II for the high side. Use caution because the
overvoltage tolerance differs between the low and high sides.
• When applying high voltage to the 701280 (FREQ), use the isolated probe (700929).
4
5
6
7
8
9
10
11
12
13
14
15
16
17
18
App
Index
3.3 Installing Input Modules
Types of Input Modules
There are 11 types of input modules. See page iii. For detailed specifications, see
section 18.12.
Precautions to Be Taken When Installing or Removing Input Modules
Switching the installed input module with a different module and turning ON the power
initializes the settings on that channel. To save the settings, specify the destination
media (see sections 13.1 or 13.9).
Installation Procedure of Modules
1.
2.
3.
4.
5.
Check that the power switch on the left side panel is OFF.
Check the channel number indicated above the slots for installing the input
modules on the right side panel of the instrument. Then, install the module along
the guide.
Holding the handles on the top and bottom of the input module, press firmly until
it clicks in place.
If there is a cover plate on the slot in which to install the module, remove the
cover plate, first.
Make sure to screw the two locations, top and bottom, of the input module firmly
into place.
Turn ON the power switch.
Check to see that the correct input module name is displayed at the
corresponding channel number in the overview screen. If it is not correct,
remove the module according to the steps in “Removal” shown below, and
reinstall the module according to steps 1 to 3 shown above. For the procedure
to display the overview display, see section 17.4.
Guide
Removal Procedure
1.
2.
3.
3-6
Check that the power switch is OFF.
Loosen the two screws holding the input module in place.
Holding the handles on the top and bottom of the input module, pull out the
module.
IM 701240-01E
3.3 Installing Input Modules
1
LEDs on the Frequency Module
On the front panel of the frequency module (701280 (FREQ)) are LEDs for each
channel. These LEDs allow you to check the input condition of the pulse.
2
3
1M 35pF
FREQ
ACT
OVER
LED
Illuminated in green: When pulse is applied
Illuminated in red:
When the input voltage
level is over range.
Off:
When pulse is not applied
1M 35pF
Preparations for Measurements
ACT
OVER
4
5
6
701280 (FREQ)
7
Note
•
•
The LEDs on the frequency module illuminates in green when pulse is applied and red when
the input voltage level is over range. It is independent of the start/stop condition of waveform
acquisition of the SL1400.
If the frequency module preset (see section 5.17) is set to “EM Pickup (electromagnetic
pickup),” the LED does not illuminate in red even when the input voltage level is over range.
8
9
10
11
12
13
14
15
16
17
18
App
Index
IM 701240-01E
3-7
3.4
Connecting the Power Supply and Turning the
Power Switch ON/OFF
Before Connecting the Power Supply
Make sure that you observe the following points before connecting the power. Failure to
do so may cause electric shock or damage to the instrument.
WARNING
• Before connecting the power cord, ensure that the source voltage matches the
rated supply voltage of the instrument and that it is within the maximum rated
voltage of the provided power cord.
• Connect the power cord after checking that the power switch of the instrument is
turned OFF.
• To prevent electric shock or fire, be sure to use the power cord for the
instrument that is supplied by YOKOGAWA.
• Make sure to provide protective earth grounding to prevent electric shock.
Connect the power cord to a three-prong power outlet with a protective earth
terminal.
• Do not use an extension cord without protective earth ground. Otherwise, the
protection function will be compromised.
• If an AC outlet that matches the power cord provided is unavailable and
protective grounding cannot be furnished, do not use the instrument.
Connecting the Power Cord
1.
2.
3.
Check that the power switch is turned OFF.
Connect the power cord plug to the power connector on the left side panel.
Connect the plug on the other end of the power cord to the outlet that meets the
conditions below. The AC outlet must be of a three-prong type with a protective
earth ground terminal.
Item
Rated supply voltage*
Permitted supply voltage range
Rated power supply frequency
Permitted power supply frequency range
Maximum power consumption
*
100 to 120 VAC/200 to 240 VAC
90 to 132 VAC/180 to 264 VAC
50/60 Hz
48 to 63 Hz
Approx. 200 VA Max.
(Reference value: 135 VA when the built-in printer
is not used and 16 channels are running)
The instrument can use a 100-V or a 200-V system for the power supply. The maximum rated
voltage of the power cord varies depending on its type. Check that the voltage supplied to the
instrument is less than or equal to the maximum rated voltage of the provided power cord
(see page ii) before using it.
3-prong outlet
Power cord
(standard accessory)
3-8
IM 701240-01E
3.4 Connecting the Power Supply and Turning the Power Switch ON/OFF
1
Turning ON/OFF the Power Switch
Items to Be Checked before Turning ON the Power
• Check that the instrument is properly installed. See section 3.2.
• Check that the power cord is properly connected. See the previous page.
2
Turning ON/OFF the Power Switch
3
Preparations for Measurements
Pressing the power switch located on the left side panel to the “ON (|)” side, turns the
power ON. Pressing it to the “OFF (O)” side turns the power OFF.
4
5
6
7
8
Power Up Operation
Self-test and calibration start automatically when the power switch is turned ON. The
operation takes approximately 30 seconds; if the check results are satisfactory, the
normal waveform display screen will appear.
9
Note
•
•
•
Allow at least 10 s when turning ON the power switch after turning it OFF.
If self-test and calibration do not start when the power is turned ON or if the normal waveform
display screen does not appear, turn OFF the power switch and check the following items.
• Check that the power cord is securely connected.
• Check that the correct voltage is being supplied from the AC outlet. (See the previous
page.)
• If you turn ON the power switch while holding down RESET, the settings are initialized to
their factory default values. For details on the initialization of the settings, see section 4.4.
If the instrument still fails to power up when the power switch is turned ON after checking
these items, contact your nearest YOKOGAWA dealer for repairs.
It may take a few seconds for the startup screen to appear.
10
11
12
13
14
To Make Accurate Measurements
• Allow the instrument to warm up for at least 30 minutes after turning ON the power
switch.
• After warm-up is complete, perform calibration (see section 4.6). If auto calibration is
turned ON, the calibration is automatically executed when the measurement range is
changed or when the waveform acquisition is started.
Power Down Operation
Settings existing immediately before the power is turned OFF (also if the power cord is
removed) are retained. This allows measurements to be performed using those saved
settings the next time the power is turned ON.
15
16
17
18
Note
The settings are stored using an internal lithium battery. The battery lasts for approximately 5
years, if it is used at an ambient temperature of 23°C. When the lithium battery voltage falls below
a specified level, a message is displayed on the screen (error 907) when the power switch is
turned ON. If this message appears frequently, the battery must be replaced quickly. The user
cannot replace the battery. Contact your nearest YOKOGAWA dealer to have the battery replaced.
IM 701240-01E
3-9
App
Index
3.5
Loading the Roll Paper for the Built-in Printer
Printer Roll Paper
Use a dedicated roll paper that is provided by YOKOGAWA. Do not use other types of
roll paper. When you are using the printer for the first time, use the roll paper that came
with the package. Order extra rolls from your nearest YOKOGAWA dealer.
Part number: 701966
Specifications: Thermal paper, 20 m
Minimum Q’ty: 6 rolls
Roll Paper Handling
The paper is a thermal paper that changes color with the application of heat. Note the
following:
Storage Precautions
The paper starts changing color at around 70°C. It is affected by heat, humidity, light,
and chemicals regardless of whether the paper has been used.
• Store the paper rolls in a cool, dry, and dark place.
• After opening the package, use it quickly.
• If the paper is left in contact with plastic film containing plasticizers (such as a vinyl
chloride film or Scotch tape) for an extended time, the paper will lose some of its
ability to reproduce color. If you are going to store the paper in a folder, for example,
use a folder made of paper stock or polypropylene.
• When using glue on the paper, do not use glue containing organic solvents such as
alcohol or ether, as they will change the color of the paper.
• For prolonged storage, we suggest you make copies of results printed on the roll
paper. Due to the characteristics of the thermal paper, the recording section may lose
color over time.
Handling Precautions
• Be sure to use only genuine paper rolls provided by YOKOGAWA.
• Touching the paper with sweaty hands can leave finger prints or blur the printing.
• Rubbing the surface with a hard object can cause the paper to change color due to
the heat caused by friction.
• If chemicals, oil, or other liquids come in contact with the paper, the paper may
change color or the printing may fade.
Precautions to Be Taken When Using the Built-in Printer
Allow enough space around the output area of the printer. If the roll paper is continuously
fed out when the output area is close to a wall, for example, the roll paper that has been
delivered may reenter the output area and get entangled.
3-10
IM 701240-01E
3.5 Loading the Roll Paper for the Built-in Printer
1
Procedure
Loading the Roll Paper
2
1.
While pressing the knob down on the top side of
the printer cover, open the printer cover.
3
Preparations for Measurements
4
5
Printer cover
2.
Release lever: FREE
Move the release lever at the top left side to the
FREE position (up direction).
6
7
8
9
10
3.
Holder
4.
Bearing
Shaft
Bearing
Roll paper flange
Shaft
5.
Guide
Platen
Leading edge
of roll paper
Roll paper
Fit the roll paper flange to the left and right edges
of the roll paper core.
With the leading edge of the roll paper in the
back, load the roll paper in the holder by pressing
the shaft of the roll paper flange in the holder
bearing.
Set the direction of the roll paper as shown in the
left figure. If the direction is reversed, the printer
head does not make contact with the thermal
surface. If this happens, nothing may be printed,
or the paper may not feed properly.
Insert the leading edge of the roll paper evenly
from the bottom side of the platen, and pass it
through so that approximately 2 cm is showing
from the top side. Align the roll paper with the left
and right guides.
To remove a roll paper that is already loaded, pull
the tape in the direction of the arrow.
11
12
13
14
15
16
17
Tape
18
6.
Pull the roll paper out further to straighten out the
paper.
App
Index
IM 701240-01E
3-11
3.5 Loading the Roll Paper for the Built-in Printer
Release lever: HOLD
7.
8.
Move the release lever to the HOLD position
(down direction). The printing will fail with an error
message, if the release arm is in the FREE
position during operation.
Close the printer cover. Push the printer cover
down firmly until it clicks into place.
Note
•
•
•
If you are reusing an old roll paper that had been taken out, the roll paper can be inserted
easily by cutting the leading edge at an angle.
Before closing the printer cover, be sure to set the release arm position to HOLD.
After loading the roll paper, make sure that the paper is feeding properly according to the
steps given below. If the paper is not being fed evenly, continue to feed the paper for
approximately 30 cm. The paper will straighten out.
Feeding the Paper
You can feed the paper to check whether the roll paper has been loaded properly or to
skip dirty sections.
Feeding the Paper with the FEED Key
Press FEED. Each time you press the key, the paper is fed out by 15 mm.
Feeding Paper from the PRINT Menu
1.
2.
3.
4.
5.
3-12
Press MENU.
Press the PRINT soft key.
Press the Print to soft key. The printer selection menu appears. (Net Print
appears only when the Ethernet interface option is installed.)
Press the Printer soft key.
Press the Paper Feed soft key. Each time you press the key, the paper is fed
out by 15 mm.
IM 701240-01E
3.6
1
Setting the Date and Time
2
Procedure
3
Press MENU.
Press the Next 1/2 soft key.
Press the System Config soft key.
Press the Date/Time soft key. The Date/Time dialog box opens.
Preparations for Measurements
1.
2.
3.
4.
4
Turning ON/OFF the Date/Time display
5.
5
Use jog shuttle+SELECT to set Display to ON or OFF.
6
7
8
9
10
Setting the Time and Date Manually (Manual)
6.
7.
8.
9.
Use jog shuttle+SELECT to set Type to Manual.
Use jog shuttle+SELECT to set Date Year.
Likewise, set the Month, Day, Time Hour, Minute, and Second.
Use the jog shuttle to move the cursor to Set and press SELECT. The date and
time specified in steps 6 to 8 are applied.
11
12
13
Setting the Date and Time Using the SNTP Server (Option)
To obtain the time from the SNTP server, you must first connect to the network and
then to the SNTP server. For details, see sections 15.2 and 15.8.
10. After step 5, use jog shuttle+SELECT to set Type to SNTP.
14
15
16
17
11.
12.
13.
Use jog shuttle+SELECT to set Time Hour under Time Difference from GMT.
Likewise, set Minute.
Use the jog shuttle to move the cursor to Set and press SELECT. The time is
obtained from the SNTP server, and the date and time calculated from the
specified GMT time difference are set.
18
App
Index
IM 701240-01E
3-13
3.6 Setting the Date and Time
Explanation
Date (Year/Month/Day)
Set the year, month and day.
Time (Hour/Minute/Second)
Set the time using a 24-hour clock.
Setting the Time Using the SNTP Server
You can use the SNTP server time to set the date and time on the instrument.
This function is available on models with the Ethernet interface installed.
For details on SNTP and GMT, see section 15.8.
The time difference from GMT specified here is linked to the setting of 15.8.
Note
•
•
•
3-14
The date and time information is backed up with the internal lithium battery, even if the power
is turned OFF.
Leap year information is retained.
If you are using the Web server function (when the Ethernet interface option is installed), you
must set the time offset from GMT (Greenwich Mean Time) in addition to the date and time.
For the setup procedure, see section 15.8.
IM 701240-01E
3.7
1
Connecting Probes
2
Connecting Probes
3
Preparations for Measurements
Connect the probes (or other input cables such as BNC cables) to any of the input
terminals of the modules below. The input impedance is 1 MΩ ± 1% and approximately
35 pF in parallel.
• High-Speed 10 MS/s, 12-Bit Isolation Module:
701250 (HS10M12)
• High-Speed High-Resolution 1 MS/s, 16-Bit Isolation Module: 701251 (HS1M16)
• High-Speed 10 MS/s, 12-Bit Non-Isolation Module:
701255
(NONISO_10M12)
• High-Voltage 100 kS/s, 16-Bit Isolation Module (with RMS): 701260 (HV(with RMS))
• Acceleration/Voltage Module (with AAF):
701275 (ACCL/VOLT)
• Frequency Module:
701280 (FREQ)
4
5
6
7
8
9
10
11
WARNING
• When connecting the item to be measured, be sure to turn OFF the power to the
item. Connecting or disconnecting the measurement lead while the item being
measured is turned ON is very dangerous.
• Precautions to Be Taken When Using the Modules
• Do not apply input voltage exceeding the maximum input voltage, withstand
voltage, or allowable surge voltage.
• To prevent electric shock, be sure to furnish protective earth grounding of the
SL1400.
• To prevent electric shock, be sure to fasten the module screws. Otherwise,
the electrical protection function and the mechanical protection function will
not be activated.
• Avoid continuous connection under an environment in which the allowable
surge voltage may occur.
• Use only specified cables. Using cables that do not meet the safety
specifications is extremely dangerous (especially when using high voltages
(42 V or higher).
• When measuring high voltages using the 701250 (HS10M12) or the 701251
(HS1M16), use the isolated probe (700929), 1:1 safety cable (combination of
701901 and 701954), or differential probe (700924).
• When applying high voltage using the 701260 (HV (with RMS)), use the 1:1
safety cable (combination of 701901 and 701954) or the isolated probe
(700929).
IM 701240-01E
3-15
12
13
14
15
16
17
18
App
Index
3.7 Connecting Probes
• The BNC part of the passive probe (701940) is made of metal. Therefore,
use the probe at 42 V or less for isolated inputs (701250 (HS10M12), 701251
(HS1M16), 701260 (HV (with RMS)), 701275 (ACCL, VOLT), and 701280
(FREQ)) for safety reasons. (Do not connect voltage above 42 V to both the
High and Low sides.) For non-isolated inputs (701255 (NONISO_10M12),
etc.), fasten the module screws.
• The measurement category of the 701260 (HV (with RMS)) is 400V-CAT II
for the low side and 700V-CAT II for the high side. Use caution because the
overvoltage tolerance differs between the low and high sides.
• When applying high voltage to the 701280 (FREQ), use the isolated probe
(700929).
• Precautions When Using the High Voltage Differential Probes
Be sure to connect the GND lead of the differential probe (700924/700925) to
the functional ground terminal on the right side panel of the SL1400. Otherwise,
high voltage may appear at the BNC connector making it dangerous.
• Applying a voltage exceeding the value indicated below may damage the input
section. If the frequency is above 1 kHz, damage may occur even when the
voltage is below this value.
• 701250 (HS10M12)
Maximum input voltage (at a frequency of 1 kHz or less):
• Combined with the isolated probe 700929 (10:1)1
600 V (DC+ACpeak)
• Safety cable (1:1) (combined with 701901+701954)5 or direct input9
250 V (DC+ACpeak)
Maximum allowable common mode voltage (at a frequency of 1 kHz or less)
• Combined with the isolated probe 700929 (10:1)2 or safety cable (1:1)
(combined with 701901+701954)8
400 Vrms (CAT I), 300 Vrms (CAT II)
• Direct input10
42 V (DC+ACpeak) (CAT I and CAT II, 30 Vrms)
• 701251 (HS1M16)
Maximum input voltage (at a frequency of 1 kHz or less)
• Combined with the isolated probe 700929 (10:1)1
600 V (DC+ACpeak)
• Safety cable (1:1) (combined with 701901+701954)5 or direct input9
140 V (DC+ACpeak)
Maximum allowable common mode voltage (at a frequency of 1 kHz or less)
• Combined with the isolated probe 700929 (10:1)2 or safety cable (1:1)
(combined with 701901+701954)8
400 Vrms (CAT I), 300 Vrms (CAT II)
• Direct input10
42 V (DC+ACpeak) (CAT I and CAT II, 30 Vrms)
• 701255 (NONISO_10M12)
This module is non-isolated. Be sure to fasten the module screws when
measuring a voltage above 42 V on this module. In addition, use the dedicated
701940 non-isolated passive probe (10:1).
Maximum input voltage (at a frequency of 1 kHz or less)
• Combined with the 701940 passive probe (10:1)
600 V (DC+ACpeak)
• Direct input9
250 V (DC+ACpeak)
3-16
IM 701240-01E
3.7 Connecting Probes
1
• 701260 (HV (with RMS))
Maximum input voltage (at a frequency of 1 kHz or less)
• Combined with the isolated probe 700929 (10:1)1
1000 V (DC+ACpeak)
• Safety cable (1:1) (combined with 701901+701954)5 or direct input9
850 V (DC+ACpeak)
Maximum allowable common mode voltage (at a frequency of 1 kHz or less)
• Combined with the 700929 isolated probe (10:1)
1000 Vrms (CAT II) on the H side3, 400 Vrms (CAT II) on the L side4
• Safety cable (1:1) (combined with 701901+701954)
700 Vrms (CAT II) on the H side6, 400 Vrms (CAT II) on the L side7
• Direct input10
30 Vrms (42 VDC + ACpeak) (CAT I or CAT II)
2
3
Preparations for Measurements
4
5
6
• 701275 (ACCL/VOLT)
Maximum input voltage (at a frequency of 1 kHz or less)
• Combined with the 701940 passive probe (10:1)11 or direct input9
42 V (DC+ACpeak)
Maximum allowable common mode voltage (at a frequency of 1 kHz or less)
• Combined with the 701940 passive probe (10:1)12 or direct input10
30 Vrms (CAT I and CAT II)
7
8
9
• 701280 (FREQ)
Maximum input voltage (at a frequency of 1 kHz or less)
• Combined with the isolated probe 700929 (10:1)1
420 V (DC+ACpeak)
• Safety cable (1:1) (combined with 701901+701954)5 or direct input9
42 V (DC+ACpeak)
Maximum allowable common mode voltage (at a frequency of 1 kHz or less)
• Combined with the isolated probe 700929 (10:1)2
300 Vrms (CAT I and CAT II)
• Safety cable (1:1) (combined with 701901+701954)8 or direct input10
30 Vrms (CAT I and CAT II)
Combined with the 700929
11
12
13
Combined with the 701901 + 701954
H
H
700929
10
701901
*1
*3
L
*4
701954
*5
*6
L
*2
14
*8
*7
15
16
Direct input (cable not complying
with the safety standard)
Combined with the 10:1 passive probe (701940)
H
BNC
H
17
*12
18
*11
*9
L
*10
L
App
Index
IM 701240-01E
3-17
3.7 Connecting Probes
Precautions to Be Taken When Connecting Probes
• When connecting the probe for the first time, perform phase correction of the probe as
described in section 3.8. If you do not, frequency characteristics will not be flat, and
measurements will not be correct. Make the phase correction on each channel to
which the probe is to be connected.
• You cannot perform phase correction of the probe on the frequency module (701280
(FREQ)). Perform phase correction of the probe on another module before connecting
the probe to the 701280 (FREQ).
• If the object to be measured is connected to the instrument directly, without using a
probe, correct measurement cannot be performed due to the input impedance.
• When using a voltage probe other than the isolated probe (700929), correct measured
values cannot be displayed if the probe’s attenuation is not 1:1, 10:1, 100:1, or
1000:1.
• Follow the instructions given in section 5.6 to set the probe attenuation to match the
actual value using the soft key menu. If they do not match, measured values cannot
be read correctly.
Connecting Current Probes
When using current probes* made by YOKOGAWA, use the probe power supply (option)
on the right side panel of the SL1400.
*
Current probes made by YOKOGAWA: 701930, 701931, and 701933
For details on the connection procedure, see the manual that comes with the current
probe.
CAUTION
Do not use the probe power supply terminals (option) on the right side panel of
the SL1400 for purposes other than supplying power to the current probes. Also,
be sure to use only the number of probes allowed. Otherwise, the device
connected to the probe power supply terminal may break.
3-18
IM 701240-01E
3.7 Connecting Probes
1
Precautions to Be Taken When Using Current Probes
When connecting the current probe to the probe power supply terminal on the right side
panel, make sure that the current does not exceed the range shown below. Otherwise,
the SL1400 operation may become unstable due to the activation of the excessive
current protection circuit of the power supply.
A
(Total current consumption of A through D) ≤ 800 mA
4
B
PROBE
POWER
( 12 V)
5
C
D
6
Specifications of the Probe Power Supply Terminals (Option)
Item
Number of probes that can be used
Compatible probes*
Number of current probes that can
be used
Supply voltage
*
4
Current probe (701930, 701931, and 701933)
701930 (150 A):
2
701931 (500 A):
1
701933 (30 A):
2
±12 V
2 outputs (up to a total of 800 mA)
Up to four 700937 current probes can be used, but the 700937 is a discontinued product.
When using the current probe, the number of probes that can be used is limited by the
current generated by the device under measurement (current measured by the current
probe). The characteristics of the measured current versus the current consumption of a
current probe that can be connected to the SL1400 are shown below.
Current consumption [mA]
400
300
200
Positive
current
100
0
Negative
current
-100
-200
-300
-100
-50
0
50
100
200
100
13
0
-100
Negative
current
-200
14
-300
-400
500
400
300
Positive
current
200
100
0
-100
Negative
current
-200
-300
-400
-500
-600
-50
-40
-30
-20
-10
0
10
20
Measured current [A]
0
100 200 300 400
500
30
40
50
15
DC
AC (f = 50 Hz)
Current probe (700937)
Current consumption [mA]
Current consumption [mA]
600
250
16
200
150
Positive
current
100
50
17
0
-50
Negative
current
-100
18
-150
-200
-250
-15
-10
-5
0
5
10
15
Measured current [A]
App
For details on the usage conditions of each probe, see “Relationship between the current
being measured and probe’s current consumption” on the following Web page.
http://www.yokogawa.com/tm/probe/
IM 701240-01E
10
Positive
current
Measured current [A]
DC
AC (f = 50 Hz)
9
12
300
Measured current [A]
Current probe (701933)
8
500
400
-500
-500 -400 -300 -200 -100
150
7
11
DC
AC (f = 50 Hz)
Current probe (701931)
Current consumption [mA]
DC
AC (f = 50 Hz)
Current probe (701930)
-400
-150
3
Preparations for Measurements
When each terminal is assigned names A through D
2
3-19
Index
3.7 Connecting Probes
Connecting Differential Probes (700924)
When using differential probes (700924) made by YOKOGAWA, connect the BNC output
connector to the input terminal of the oscilloscope. In addition, be sure to connect the
GND lead to the functional ground terminal of the SL1400. If necessary, use the auxiliary
grounding lead extension. A measurement of 1400 Vpeak is possible by connecting the
GND lead to the SL1400.
For details on the connection procedure, see the manual that comes with the differential
probe.
Functional ground terminal
GND lead
WARNING
Precautions to Be Taken When Using High Voltage Differential Probes
Be sure to connect the GND lead of the differential probe (700924/700925) to
the functional ground terminal on the right side panel of the SL1400. Otherwise,
high voltage may appear at the BNC connector making it dangerous. Be sure to
connect the GND lead to the SL1400 before connecting the probe to the
parameter to be measured.
3-20
IM 701240-01E
3.8
1
Compensating the Probe (Phase Correction)
2
3
Preparations for Measurements
When making measurements using a probe on the following modules, be sure to perform
phase correction of the probe first.
• High-Speed 10 MS/s, 12-Bit Isolation Module:
701250 (HS10M12)
• High-Speed High-Resolution 1 MS/s, 16-Bit Isolation Module: 701251 (HS1M16)
• High-Speed 10 MS/s, 12-Bit Non-Isolation Module:
701255
(NONISO_10M12)
• High-Voltage 100 kS/s, 16-Bit Isolation Module (with RMS): 701260 (HV (with RMS))
• Acceleration/Voltage Module (with AAF):
701275 (ACCL/VOLT)
• Frequency Module:
701280 (FREQ)
4
5
6
CAUTION
Do not apply external voltage to the probe compensation signal output terminal,
as it may damage the internal circuit.
7
8
Procedure
1.
2.
3.
4.
5.
Turn ON the power switch.
Connect the probe to the input terminal to which the signal is to be applied.
Connect the probe’s tip to the probe compensation signal output terminal on the
front panel and connect the earth wire to the functional earth terminal.
Perform auto setup according to the procedure described in section 4.5.
Insert a flat-head screwdriver to the phase correction hole and turn the variable
capacitor to make the displayed waveform a correct rectangular wave.
9
10
11
12
13
Functional ground
terminal
14
Probe compensation signal output terminal
Phase adjustment
hole
15
16
Explanation
Necessity of Phase Correction of the Probe
The probe comes with its phase corrected approximately to match the input capacitance
of the relevant oscilloscope. However, there is variance in the input resistance and input
capacitance of each input channel of individual oscilloscopes. This results in a mismatch
in the voltage divider ratio between low and high frequency signals and causes uneven
frequency characteristics.
There is a variable capacitor for adjusting the voltage divider ratio (trimmer) for high
frequency signals on the probe. The phase is corrected by adjusting this trimmer so that
even frequency characteristics are obtained.
When using the probe for the first time, make sure to perform phase correction.
Because the input capacitance varies on each channel, probe compensation is also
required when the probe is switched from one channel to another.
IM 701240-01E
3-21
17
18
App
Index
3.8 Compensating the Probe (Phase Correction)
Phase Compensation Signal
The probe compensation signal output terminal (COMP terminal) delivers the following
rectangular wave signal.
Frequency:
1 kHz ± 1%
Amplitude:
1 V ± 10%
Differences in the Waveform Caused by the Phase Correction of the Probe
Correct waveform
Over compensated
(the gain in the high
frequency region is up)
Under compensated
(the gain in the high
frequency region is low)
Precautions to Be Taken When Using the Probe on the Frequency Module
(701280 (FREQ))
You cannot perform phase correction of the probe on the frequency module. When
connecting a probe to the frequency module, perform phase correction of the probe on
another module beforehand.
3-22
IM 701240-01E
3.9
1
Connecting Measurement Leads
2
Connecting Measurement Leads
Connect measurement leads of bipolar banana plug terminal to the input terminal
(binding post terminal) when measuring the voltage on the 701261 (UNIVERSAL),
701262 (UNIVERSAL (AAF)), or 701265 (TEMP/HPV) as shown below.
3
Preparations for Measurements
4
5
H (red)
6
7
L (black)
8
9
WARNING
• When connecting the item to be measured, be sure to turn OFF the power to the
item. Connecting or disconnecting the measurement lead while the item being
measured is turned ON is very dangerous.
• To prevent electric shock, make sure to use the measurement lead suitable for
the voltage range being measured on the input terminals of the 701261
(UNIVERSAL), 701262 (UNIVERSAL (AAF)), or 701265 (TEMP/HPV).
• Applying a voltage exceeding the value indicated below may damage the input
section. If the frequency is above 1 kHz, damage may occur even when the
voltage is below this value.
701261, 701262, and 701265
Maximum input voltage (across the input terminals, H and L1, at a frequency of 1
kHz or less)
42 V (DC+ACpeak)
Maximum allowable common mode voltage (across the input terminals, H or L,
and earth2, at a frequency of 1 kHz or less)
42 V (DC+ACpeak) (CAT I and CAT II, 30 Vrms)
• Do not connect a plug-in type terminal with exposed conducting parts to the
input terminal to be used as a measurement lead. It is very dangerous, if the
connector comes loose.
701261/
701262/
701265
Input
terminal
10
11
12
13
14
15
16
17
H
*1
L
18
*2
Earth
App
Index
IM 701240-01E
3-23
3.10 Connecting Thermocouples
Connecting Thermocouples
If you are connecting the compensation lead of the thermocouple to the input terminal
(binding post terminal) of the 701261 (UNIVERSAL), 701262 (UNIVERSAL (AAF)), or
701265 (TEMP/HPV), loosen the terminal knob, pass the lead through the terminal, and
tighten the knob.
H
L
+ leg
– leg
Compensation lead (or thermocouple wire)
To the thermocouple
CAUTION
• The 701261 (UNIVERSAL), 701262 (UNIVERSAL (AAF)), or 701265 (TEMP/
HPV) is isolated from the SL1400. However, applying a voltage exceeding the
value below may damage the input section. If the frequency is above 1 kHz,
damage may occur even when the voltage is below this value.
Maximum input voltage (across the input terminals, H and L, at a frequency of 1
kHz or less)
42 V (DC+ACpeak)
Maximum allowable common mode voltage (across the input terminal L and
earth at a frequency of 1 kHz or less)
42 V (DC+ACpeak) (CAT I and CAT II, 30 Vrms)
• Correct measurements cannot be made, if the positive and negative legs of the
thermocouple are reversed.
• Immediately after connecting the thermocouple, the heat balance may be
disturbed at the input terminal section and may cause measurement errors.
Therefore, wait about 10 minutes before making a measurement.
• In an environment where the air from the air conditioning is directly applied to
the input terminals or where there are effects from a heat source, the heat
balance may be disturbed at the input terminal section and cause measurement
errors.
When making measurements in this type of environment, take preventive
measures such as changing the position.
3-24
IM 701240-01E
1
3.11 Connecting the Bridge Head
2
3
Preparations for Measurements
Strain is measured by connecting a strain gauge bridge (bridge head) or a strain gauge
transducer to the strain module (701270 (STRAIN_NDIS) or 701271 (STRAIN_DSUB)).
This section will mainly describe the procedures and precautions related to the
connection of the bridge head (Model 701955/701956/701957/701958). For the
connection of other strain gauge bridges or strain gauge transducers, see the respective
manuals.
4
5
CAUTION
Only connect a strain gauge bridge (bridge head) or a strain gauge transducer
to the strain module. Connecting other devices or applying a voltage that
exceeds the values indicated below to the strain module may damage the input
section.
• Maximum input voltage (between Input+ and Input–)
10 V (DC+ACpeak)
• Maximum allowable common mode voltage (between each terminal and earth
ground)
42 V (DC+ACpeak) (CAT I and CAT II, 30 Vrms)
Connecting the Strain Gauge
6
7
8
9
10
The bridge head (701955/701956/701957/701958) supports six types of connection
methods: single-gauge method, single-gauge three-wire method, adjacent-side twogauge method, opposite-side two-gauge method, opposite-side two-gauge three-wire
method, and four-gauge method. For details, see the manual that comes with the bridge
head (701955/701956/701957/701958).
If you are using a strain gauge bridge or a strain gauge transducer other than the bridge
head (701955/701956/701957/701958), see the respective manuals.
11
12
13
Connecting the Strain Module and the Bridge Head
When Using the Strain Module (701270) and the Bridge Head (701955/701956)
Using the cable that comes with the bridge head (701955/701956), connect the bridge
head to the 701270 (STRAIN_NDIS).
14
15
Strain Module
701270(STRAIN_NDIS)
Cable
16
Bridge head
701955/701956
When Using the Strain Module (701271) and the Bridge Head (701957/701958)
17
Using the cable that comes with the bridge head (701957/701958), connect the bridge
head to the 701271 (STRAIN_DSUB).
18
App
Strain Module
701271(STRAIN_DSUB)
IM 701240-01E
Cable
Bridge head
701957/701958
Index
3-25
3.11 Connecting the Bridge Head
When Using a Bridge Head with a MIL Standard (MIL-C-26482) Connector Wiring
The connector on the 701270 (STRAIN_NDIS) is a NDIS connector. Use a connector
adapter cable (700935) by YOKOGAWA to make a MIL-NDIS conversion and connect
the bridge head to the Strain Module (701270).
*
A connector recommended by JSNDI (The Japanese Society for Non-destructive Inspection)
Bridge head with a MIL
standard connector wiring
Strain Module
701270 (STRAIN_NDIS)
Connector adapter cable
(700935) length 1.5 m
Pin arrangement of an NDIS connector
A
F
G
E
A:
B:
C:
D:
E:
F:
B
D
C
G:
Pin arrangement of a MIL standard connector
Terminal
Bridge+ (positive bridge voltage)
A: Signal+
relationship
Input– (negative measurement signal)
B: Signal–
Bridge– (negative bridge voltage)
C:
Excitation+
A F
NDIS
MIL
Input+ (positive measurement signal)
D: Excitation–
B
C
A
E
Floating common
E: NC (no connection)
C D
B
B
Sense+
F: NC (no connection)
D
C
(positive bridge voltage sensing)
D
A
Sense–
(negative bridge voltage sensing)
When Using the A1002JC Connector by YOKOGAWA
You can create your own cable by using the YOKOGAWA A1002JC connector that is
compatible with the strain module and use the cable to connect a strain gauge bridge or
a strain gauge transducer to the strain module.
A1002JC NDIS connector
(2 pieces in one set)
Pin arrangement
When viewed along arrow (1)
A: Bridge+ (positive bridge voltage)
B: Input– (negative measurement signal)
A
F
C: Bridge– (negative bridge voltage)
G
D: Input+ (positive measurement signal)
E
B
E: Floating common
D
C
F: Sense+ (positive bridge voltage sensing)
G :Sense– (negative bridge voltage sensing)
(1)
Note
•
•
•
The connector shell is connected to the case potential (earth) of the SL1400.
Signals A through G are isolated inside the module.
When creating your own cable, we recommend that you use a shielded cable in order to shut
out external noise.
CAUTION
Take extra care when wiring the connectors. If the wiring is shorted or incorrect,
it can damage the SL1400 or other instruments that are connected it.
3-26
IM 701240-01E
3.11 Connecting the Bridge Head
1
Pin Arrangement of the D-Sub Connector
When viewed along arrow (1)
1
Cable
Connector shell
6
7
5
4
8
9
1:
2:
3:
4:
5:
6:
7:
8:
9:
Floating common
Sense– (negative bridge voltage sensing)
Shuntcal– (negative shunt signal)
Shuntcal+ (positive shunt signal)
Sense+ (positive bridge voltage sensing)
Bridge– (negative bridge voltage)
Input– (negative measurement signal)
Input+ (positive measurement signal)
Bridge+ (positive bridge voltage)
(1)
2
3
Preparations for Measurements
D-Sub 9-pin
connector
3
2
4
5
6
7
8
9
10
11
12
13
14
15
16
17
18
App
Index
IM 701240-01E
3-27
3.12 Connecting Logic Probes
CAUTION
• Applying a voltage exceeding the value indicated below may damage the logic
probe or the SL1400. If the frequency is above 1 kHz, damage may occur even
when the voltage is below this value.
Maximum input voltage (at a frequency of 1 kHz or less)
•
•
•
702911/702912 logic probe:
35 V
700986 High-Speed Logic Probe: 42 V (DC+ACpeak)
700987 Isolated Logic Probe:
250 Vrms (except ACpeak is less than or equal to 350
V and DC is less than 250 V)
• On the 702911, 702912, or 700986 logic probe, the 8 input lines on each POD have a
common earth. In addition, the earth for the instrument and the earth for each POD are
also common. Do not connect inputs which have different common voltages, as it may
cause damage to the SL1400, logic probe, or other connected instruments.
• Each input terminal of the isolated logic probe is isolated from all other input
terminals and the isolated logic probe is isolated from the SL1400.
• Make sure to turn OFF the instrument before connecting or disconnecting the
26-pin connector from the logic input connector.
• Do not stack the isolated logic probes during use. Also, allow enough space
around the probes to prevent the temperature inside the probes from increasing.
• Do not use the 700985 logic probe by YOKOGAWA on the SL1400. The
structure of the 700985 allows it to be connected to the logic signal input
connector of the SL1400. However, because it is not electrically compatible,
connecting the 700985 may cause damage to the SL1400 or the 700985.
Logic Input Connector
Connect the 702911, 702912, 700986, or 700987 logic probe to either of the logic signal
input connectors (two connectors marked Logic A and Logic B).
About the Logic Probe
Types of Logic Probes
The following logic probes are available for connecting to the logic input connector of the SL1400.
• 702911 (1 m) and 702912 (3 m) logic probes
• 700986 High-Speed Logic Probe
• 700987 Isolated Logic Probe
*
Do not use the 700985 on the SL1400. Read the caution above.
Types of Connection Leads That Can Be Used
Use the following leads to connect to the point of measurement.
• Types of Connection Leads That Can Be Used on the 702911, 702912,
and 700986 Probes
The following two types are available.
• Connection lead (alligator clip, parts No. B9879PX)
This lead is mainly used to connect to contact circuits. The lead consists of 8 signal
lines (red) and 8 earth lines (black).
• Connection lead (IC clip, parts No. B9879KX)
This lead is mainly used to connect to electronic circuits. The lead consists of 8
signal lines (red) and 2 earth lines (black).
3-28
IM 701240-01E
3.12 Connecting Logic Probes
• Types of Measurement Leads That Can Be Used on the 700987 Isolated
Logic Probe
Use the following measurement lead.
For measuring voltages of 42 V or more: Measurement lead for isolation logic (758917)
An alligator adapter (758922), alligator adapter (758929), or alligator clip (dolphin
type, 701954) is needed to make measurements.
Do not alter the connection leads, as it may cause the leads from satisfying the specifications.
Connecting Logic Probes
2.
Attach the accessory connection lead (IC clip or alligator clip) to the logic probe,
and lock the connector by clamping the lever inwards. To release the connection
lead from the logic probe, pull both levers outwards.
On the 702911 or 702912, use the input switch on the probe to set the input
format to TTL level* or contact.*
*
3
4
5
702911, 702912, and 700986 Logic Probes
1.
2
Preparations for Measurements
Note
1
TTL level: Set to 1 at a voltage greater than or equal to approximately 1.4 V. Contact:
Set to 1 when the input is shorted to the earth line.
6
7
8
9
10
700987 Isolated Logic Probe
1.
2.
Connect the measurement lead to the input terminal of the logic probe.
Set the input switch. The threshold level is set to 50 VAC ± 50% (Hi: 80 to 250
VAC, Lo: 0 to 20 VAC) and 6 V ± 50% (Hi: 10 to 250 VDC, Lo: 0 to 3 VDC)
when set to “AC” and “DC,” respectively.
Connecting the Logic Probe to the Logic Signal Input Connector
3.
4.
5.
Turn OFF the SL1400.
Connect the end with the 26-pin connector (clamp filter with ferrite core, parts
No. A1190MN) of the logic probe to the logic signal input connector of the
SL1400.
Turn ON the SL1400.
11
12
13
14
15
16
17
To the logic signal input connector
on the left side panel of the SL1400
18
Note
•
•
•
IM 701240-01E
App
Each bit is displayed as “L level” when the logic probe is not connected to the instrument.
For logic probe specifications, see section 18.13.
The logic input display is turned OFF by default. For the procedure to turn ON/OFF the
display, see section 5.1.
3-29
Index
3.13 Connecting Acceleration Sensors
An acceleration sensor is connected when measuring acceleration on the 701275
(ACCL/VOLT). For a details on acceleration sensors, see the respective manuals.
CAUTION
• Applying a voltage that exceeds the values indicated below to the 701275
(ACCL/VOLT) may damage the input section.
Maximum input voltage: 42 V (DC+ACpeak)
• Connect acceleration sensors without supplying bias current to the sensor.
Otherwise, damage to the internal circuitry of the acceleration sensors may
result.
• The SL1400 only supports acceleration sensors that are driven by constant
current with driving current of 4 mA and driving voltage of 22 V.
Connecting Acceleration Sensors
When Connecting Built-in Amplifier Type Acceleration Sensors
The SL1400 allows built-in amplifier type (low impedance) acceleration sensors to be
directly connected. To connect built-in amplifier type acceleration sensors, use BNC
cables. Use cables that are appropriate for the acceleration sensors being used.
Connect the acceleration sensors with the bias current turned OFF. After connection,
turn ON the supply current to the acceleration sensors to make measurements.
When Connecting Charge Output Type Acceleration Sensors
Since the charge output type (high impedance) acceleration sensors do not have a builtin amplifier circuit, they cannot be directly connected to the SL1400. Use either of the
following two methods to connect the sensors.
Using the Charge Amplifier
Connect the charge output type acceleration sensor to a charge amplifier using a
highly isolated low-noise cable. The acceleration signal (charge signal) that has been
converted to a voltage signal by the charge amplifier is applied to the SL1400 using a
normal coaxial cable. The SL1400 measures the signal in the voltage measurement
mode. The measured data can be converted to acceleration values using the scale
conversion function of the SL1400.
SL1400
Highly isolated
low-noise cable
Charge output type
acceleration sensor
3-30
Charge amplifier
Normal
coaxial
cable
701275(ACCL/VOLT)
(Voltage measurement)
IM 701240-01E
3.13 Connecting Acceleration Sensors
1
Using the Charge Converter
Charge output type
acceleration sensor
3
4
5
SL1400
Normal
coaxial
cable
Highly isolated
low-noise cable
2
Preparations for Measurements
Connect the charge output type acceleration sensor to a charge converter using a
highly isolated low-noise cable. By driving the charge converter using a constant
current from the SL1400, voltage signals similar to those of the built-in amplifier type
acceleration sensor can be obtained. The SL1400 measures the signals in the
acceleration measurement mode and supplies bias current to the charge converter.
Set the input sensitivity of the SL1400 according to the charge converter gain and the
sensitivity of the charge output type acceleration sensor.
The SL1400 only supports charge converters that are driven by constant current with
driving current of 4 mA and driving voltage of 22 V.
6
Charge
converter
7
701275(ACCL/VOLT)
(Acceleration measurement)
8
Note
The unit of measurement of acceleration on the SL1400 is m/s2. The sensitivity is sometimes
expressed in units of mV/G depending on the acceleration sensor. In such cases, convert the
unit. (1 G = 9.81 m/s2)
9
10
Precautions
• Do not apply shock outside the specifications (see the manual for the acceleration
sensor) to the acceleration sensors. Doing so can damage the sensors.
• Do not impose drastic temperature changes on the acceleration sensors.
Temperature changes may affect the output value of the acceleration sensors.
• By default, the bias current on the acceleration sensors is turned OFF. Be sure to turn
it ON before using the acceleration sensors. Bias current is valid only when measuring
acceleration. When measuring other parameters, it is automatically turned OFF. The
ON/OFF setting of the bias current is retained even when you turn OFF the SL1400.
11
12
13
14
15
16
17
18
App
Index
IM 701240-01E
3-31
3.14 Connecting Sensors to the Frequency Module
Sensors and Signal Output Sources That Can Be Connected
The table below shows the sensor and signal output source that can be connected.
Appropriate input presets are provided for each sensor and signal output source. For the
procedure of presets, see section 5.17.
Sensor and Signal Output Source
Preset Name
5-V logic signal, 5-V output sensor, and sensor with TTL output
Logic 5V
3-V logic signal and 3-V output sensor
Logic 3V
12-V driven relay/sequence circuit and 12-V driven sensor
Logic 12V
24-V driven relay/sequence circuit and 24-V driven sensor
Logic 24V
Sensor/Encoder that outputs positive and negative voltages and
sensor that outputs sine waves
ZeroCross
100-VAC power supply (connected via the 700929 isolated probe)
AC100V
200-VAC power supply (connected via the 700929 isolated probe)
AC200V
Power-generating electromagnetic pickup
EM Pickup
Open collector output (0 to 5 V output) and contact output
Pull-up 5V*
*
For the internal equivalent circuit for “Pull-up 5V,” see page 5-40.
Precautions to Be Taken When Connecting to Sensors or Signal Output Sources
CAUTION
• The maximum input voltage for direct input is indicated below. Applying a
voltage exceeding this value can damage the input section. If you are applying
high voltage that exceeds 42 V, be sure to use the isolated probe (700929).
Maximum input voltage: 42 V (DC+ACpeak) (CAT I and CAT II)
• The minimum input voltage is 0.2 VP-P. At voltage amplitude less than 0.2 VP-P,
the measured values may be unstable.
• Attach/Remove the sensors after confirming that the rotating object to be
measured is stopped.
• Set the preset to electromagnetic pickup (EM Pickup) only when using the
electromagnetic pickup.
Connecting the Electromagnetic Pickup
• The SL1400 allows power-generating electromagnetic pickup to be connected
directly. The SL1400 does not support electromagnetic pickups that require external
power supply or those that require a terminator at the output.
• To connect electromagnetic pickups, use BNC cables. Use cables that are
appropriate for the electromagnetic pickups being used.
• When the input is set to EM Pickup (electromagnetic pickup), determination is not
made on whether the input voltage level exceeds the specified input voltage range.
The LEDs (see page 3-7) do not illuminate even when the voltage level is over range.
SL1400
Rotating object
to be measured
BNC connector
Power-generating
electromagnetic
pickup
3-32
701280(FREQ)
IM 701240-01E
Chapter 4
4.1
Common Operations
Operations and Functions of Keys and the Jog
Shuttle
1
2
This section describes the basic operations of the keys and jog shuttle on the SL1400.
3
Basic Key Operations
Displaying the Setup Menu of the Panel Keys
4
Press a key. The menu corresponding to the key appears.
Press the soft key corresponding to each item.
Common Operations
1.
2.
Setup menu
5
C(
6
or
)
7
B
D(
or
)
8
A
9
10
A: Press the corresponding soft key to switch the selected item.
B: Press the corresponding soft key to display the selection menu.
Press the soft key corresponding to a selection to make the selection.
11
C: Press the corresponding soft key to set the item under jog shuttle control.
Turn the jog shuttle to change the setting.
12
D: Press the corresponding soft key to set the item under jog shuttle control.
Turn the jog shuttle to set the value.
Press the arrow keys to change the selected digit.
You can directly enter the value from a USB keyboard.
13
Note
14
If the setup menu shows Next 1/2, you can press the soft key corresponding to Next 1/2 to show
the 2/2 menu. To show the 1/2 menu again, press the soft key corresponding to Next 2/2. If Next
1/3 is shown, the soft key switches in the following order: Next 1/3, Next 2/3, Next 3/3, Next 1/3,
and so on.
15
16
17
18
App
Index
IM 701240-01E
4-1
4.1 Operations and Functions of Keys and the Jog Shuttle
Operations on the Setup Dialog Box
1.
2.
3.
Show the setup dialog box using basic key operations or other similar means.
Turn the jog shuttle to move the cursor to the desired item.
Press SELECT. The behavior that results when you press SELECT varies
depending on the item as described below. This manual refers to the above
operation as “jog shuttle + SELECT.”
E
F
G
Setup dialog box
Turn the jog shuttle to
move the cursor to the
item you want to set.
When Mode is selected
When Edge Count is selected
Selection menu
Value entry box
E: Press SELECT to display the selection menu.
Turn the jog shuttle to move the cursor to the item you wish to set.
Press SELECT to apply the selected item.
F: Press SELECT to switch the selected item.
G: Press SELECT to display the value entry box.
Turn the jog shuttle to set the value.
Press the arrow keys to change the selected digit.
You can directly enter the value from a USB keyboard.
Clearing the Setup Menu and Setup Dialog Box
Press ESC. The setup menu or setup dialog box shown on top is cleared from the
screen.
Note
•
•
4-2
In the operating procedures in this manual, the step for clearing the setup menu and setup
dialog box is not indicated.
When the setup menu is cleared, the main information on the displayed channels is shown.
For details, see section 8.13.
IM 701240-01E
4.2
1
Entering Values and Strings
2
Entering Values
Entering Values Directly Using the Dedicated Knob
3
The dedicated knobs indicated below can be turned to directly enter values.
• Range knob
• Position knob
RANGE
FINE
RANGE
Common Operations
CH
4
ALL CH
5
POSITION
FINE
POSITION
6
TRIG'D
7
MANUAL TRIG
Entering Values Using the Jog Shuttle
8
After selecting the setup item using the soft key, use the jog shuttle to change the value.
The outer shuttle ring can be used to step through the values in large increments. On
some items, the arrow keys below the jog shuttle can be used to move among the digits.
Resets the value to the initial value.
RESET
SELECT
Parameters that can be specified
using the jog shuttle
9
10
Jog shuttle
11
Decreases the value.
12
Increases the value.
13
Arrow keys: Changes the current digit.
14
Shuttle ring
Note
15
The items that can be changed using the jog shuttle are reset to their initial values when you
press RESET.
16
17
18
App
Index
IM 701240-01E
4-3
4.2 Entering Values and Strings
Entering Strings
The keyboard displayed on the screen is used to enter character strings such as file
names and comments. The jog shuttle, SELECT, and arrow keys are used to operate the
keyboard to enter the character strings.
Operating the Keyboard
1.
2.
3.
4.
Turn the jog shuttle to move the cursor to the character to be entered. You can
also press the soft keys corresponding to
and
to move the cursor vertically.
Press SELECT. The character is confirmed. If a character string is already been entered,
move the cursor to the position in the string at which you want to enter a character.
Repeat steps 1 and 2 to enter all the characters in the string.
Selecting ENT on the keyboard and pressing SELECT confirms the string and the
keyboard disappears. You can also press the ENT soft key to confirm the string and clear
the keyboard. At the same time, the confirmed string is temporarily stored. If you wish to
clear the entire string that you have entered, press RESET before confirming the string.
CAPS: Uppercase character
Moves the cursor upward.
Moves the cursor downward.
Switches between uppercase and lowercase
and a portion of the symbols.
Deletes the character before the entry position.
Switches the insert/overwrite mode.
Recalls the temporary stored string.
See “Operation to Temporarily Store
Character Strings” and “Recall” described later.
Confirms the displayed characters.
CAPS: Lowercase character
• Operation of Temporarily Storing the Character Strings
The strings that are previously confirmed are sequentially sent to the subsequent
memories. When the number of confirmed strings exceeds eight, the strings are
deleted in order starting from the oldest string. Symbols 0 to 7 are used in the
explanation as a matter of convenience, but numbers 0 to 7 do not appear on the
actual screen.
Symbol indicating the
memory storing the string
0
1
2
When string “AA”
is confirmed first
Stores AA
When string “BB”
is confirmed next
Stores BB
Moves and
stores AA
When string “CC”
is confirmed next
Stores CC
Moves and Moves and
stores BB
stores AA
........
7
..........................................................................................................................................................
4-4
When string “HH”
is confirmed next
Stores HH
Moves and Moves and
stores GG stores FF
........
Moves and stores AA
When string “JJ”
is confirmed next
Stores JJ
Moves and Moves and
stores HH stores GG
........
Moves and stores BB
Deletes AA
IM 701240-01E
4.2 Entering Values and Strings
2
3
4
5
• Keys Other Than the Character Keys
DEL:
Deletes the character at the cursor.
INS:
Switches the insert/overwrite mode. When in insert mode, the INSERT
indicator on the keyboard illuminates.
SPACE: Enters a space.
ENT:
Confirms the displayed characters.
CAPS:
Switches between uppercase and lowercase.
6
7
8
Number of Characters and Types That Can Be Used in the Settings
Setup Item
Number of
Characters
Characters That
Can Be Used
Reference
Section
Date/Time
Specified
number
0 to 9
3.6
Waveform labels
1 to 8
All characters (including spaces)
8.10
Unit of linear scaling
0 to 4
All characters (including spaces)
5.11
File name
1 to 16
A to Z, %, _, (, )
13.8 to 13.12,
7.5
Comments for files
0 to 160
All characters (including spaces)
13.8 to 13.11,
7.5
Comments for screen
images
0 to 20
All characters (including spaces)
13.12
Comments for printing
0 to 20
All characters (including spaces)
12.1
Message of annotation
0 to 80
All characters (including spaces)
9.3, 12.1
9
10
11
12
13
Comments for PDF files
0 to 20
All characters (including spaces)
13.14
Title, author, and sub
title of PDF files
0 to 30
All characters (including spaces)
9.8, 13.14
9.8, 13.14
Keyword of PDF files
0 to 90
All characters (including spaces)
E-mail address
0 to 40
ASCII characters (including spaces)
15.5
Comments for e-mail
0 to 30
All characters (including spaces)
15.5
User name, login name,
and password
0 to 15
ASCII characters (including spaces)
15.3, 15.6,
15.7
14
15
Note
•
•
1
Common Operations
• Recalling Strings
Note that the string that is displayed in the entry box of the keyboard is overwritten
when a string is recalled using the procedure in step 1 below.
1.
Every time the soft key is pressed, strings that are temporary stored (strings
that have been entered previously) appear in order in the input box of the
keyboard. When the eight strings that are temporarily stored are displayed, the
most recent string is displayed again.
2.
Make appropriate corrections to the recalled string and confirm it according to
steps 1 to 4 that were described in “Operating the Keyboard” on the previous
page. At this point, the confirmed string is temporarily stored.
The multiple @ characters cannot be entered consecutively.
File names are not case-sensitive. Uppercase and lowercase are distinguished in comments. In
addition, the following five file names cannot be used due to limitations of MS-DOS.
AUX, CON, PRN, NUL, CLOCK, COM1 to COM9, LPT1 to LPT9
16
17
18
App
Index
IM 701240-01E
4-5
4.3
Operating the SL14000 Using a USB Keyboard
or a USB Mouse
Entering Values from a USB Keyboard
You can connect a USB keyboard for entering file names, comments, and other
information. In addition, the functions of each key on the front panel of the SL1400 are
assigned to the keys on the keyboard (see appendix 7). Thus, the keyboard can be used
to carry out operations that are the same as the key operations on the SL1400.
USB PERIPHERAL connector
To connect a USB keyboard to the SL1400, connect a USB cable to the USB
PERIPHERAL connector on the left side panel. There are two USB PERIPHERAL
connectors (ports).
Port 1
Port 2
USB PERIPHERAL
1
2
3
4
Pin No.
Signal Name
1
2
3
4
VBUS:
D–:
D+:
GND:
+5 V
–Data
+Data
Ground
Compatible Keyboards
Keyboards that can be used are determined by the language selected in section 16.1.
The following keyboards conforming to USB Human Interface Devices (HID) Class
Ver1.1 can be used.
• When the language is not Japanese: 104 or 89 English Keyboard
• When the language is Japanese: 109 or 89 Japanese Keyboard
Note
For USB keyboards that have been tested for compatibility, contact your nearest YOKOGAWA
dealer.
4-6
IM 701240-01E
4.3 Operating the SL14000 Using a USB Keyboard or a USB Mouse
1
Connection Procedure
When connecting a USB keyboard, directly connect the keyboard to the SL1500 using a
USB cable as shown below. You can connect/disconnect a USB cable at any time
regardless of the power ON/OFF state of the SL1400 (supports hot-plugging). Connect
the type A connector of the USB cable to the SL1400; connect the type B connector to
the keyboard. When the power switch is ON, the keyboard is detected and enabled
approximately six seconds after it is connected.
2
3
4
USB connection
SL1400
5
6
Note
•
•
•
•
•
•
Common Operations
USB keyboard
Connect the keyboard directly without going through a USB hub.
Do not connect USB devices other than a USB keyboard, USB mouse, USB printer, or USB
storage device to the USB PERIPHERAL connector.
Do not connect multiple keyboards.
Holding down a key on the keyboard does not enter the character or value repetitively.
Do not connect and disconnect multiple USB devices repetitively. To do so, allow at least 10 s
between connection and disconnection.
Do not connect or disconnect the USB cable after the power is turned ON until key operation
is ready (approximately 20 to 30 s).
7
8
9
10
Checking the Keyboard That Is Connected
To check the keyboard that is connected to the SL1400, carry out the procedure below.
1.
Press MENU.
2.
Press the Next 1/2 soft key.
3.
Press the System Config soft key.
4.
Press the USB List soft key to display the USB Device List. Check the USB
keyboard that is connected.
11
12
13
14
15
16
17
Entering File Names, Comments, and Other Items
When a keyboard is displayed on the screen, you can enter the file name, comment, and
other items using a USB keyboard. The character that is entered through each key of the
USB keyboard varies depending on the keyboard type. For details, see appendix 7.
18
App
Index
IM 701240-01E
4-7
4.3 Operating the SL14000 Using a USB Keyboard or a USB Mouse
Executing Functions Corresponding to the Front Panel Keys of the SL1400
The functions corresponding to the front panel keys of the SL1400 are assigned to the
keys on the USB keyboard. Therefore, you can press the key on the keyboard to carry
out the corresponding function. The assignment of functions varies depending on the
keyboard type. For details, see appendix 7.
Entering Values Directly from a USB Keyboard
You can directly enter values from a USB keyboard for items with the
SL1400 setup menu.
or
icon on the
Press the soft key corresponding to the item, enter the value from the USB
keyboard, and press the Enter key. The entered value is applied.
Black area
When you enter a value from the USB keyboard,
the entered value appears in the black area.
When a Prefix Unit Is Displayed
For voltage (V) and time (s) items, you can also enter the prefix unit from the USB
keyboard.
Example
Selecting “Upper” in the above menu and entering “1”, “0”, and “m” from the USB
keyboard is equivalent to entering “10 mV”. Thus, the Upper box shows “0.010V”
when the voltage range is 5.00 V. If you enter the prefix unit from a USB keyboard,
you do not have to press Enter.
Below are the prefix units that can be entered.
Input Key
Prefix Unit
K or k
m
U or u
N or n
P or p
103 (kilo)
10–3 (milli)
10–6 (micro)
10–9 (nano)
10–12 (pico)
When Displayed in Exponential Notation
You can also enter the menu items displayed in exponential notation from the USB
keyboard.
Example
Entering “2”, “.”, “3”, “E”, “1”, “Enter” for the menu item displaying “0.0000E+00”
causes the value to be displayed as “2.3000E+01”.
4-8
IM 701240-01E
4.3 Operating the SL14000 Using a USB Keyboard or a USB Mouse
1
Operations Using a USB Mouse
You can use a USB mouse to operate the SL1400 as you would using the front panel
keys. In addition, you can click a desired item on a menu. This is analogous to pressing
a soft key corresponding to a menu and pressing SELECT.
USB PERIPHERAL Connector
3
The USB mouse is connected to the USB PERIPHERAL connector on the left side panel
of the SL1400. For details on the USB PERIPHERAL connector, see page 4-6.
5
A wheel USB mouse conforming to USB HID Class Version 1.1 can be used.
Note
•
4
Common Operations
Compatible USB Mouse
•
2
For USB mouse devices that have been tested for compatibility, contact your nearest
YOKOGAWA dealer.
Some items cannot be specified when using a mouse without a wheel.
6
7
Connection Procedure
Connect the USB mouse to the USB PERIPHERIAL connector as shown below. You can
connect/disconnect the USB mouse connector regardless of the power ON/OFF state of
the SL1400 (supports hot-plugging). When the power switch is ON, the mouse is
detected, and a pointer ( ) is displayed approximately 6 seconds after it is connected.
8
9
10
SL1400
USB mouse
11
Do not connect USB devices other than a USB keyboard, USB mouse, or USB printer to the
USB PERIPHERAL connector.
There are two USB PERIPHERAL connectors. However, do not connect mouse devices to
both connectors at the same time.
Do not connect and disconnect multiple USB devices repetitively. To do so, allow at least 10 s
between connection and disconnection.
Do not connect or disconnect the USB cable after the power is turned ON until key operation
is ready (approximately 20 to 30 s).
12
Note
•
•
•
•
13
14
15
Checking the USB Mouse That Is Connected
The procedure to check the type of USB mouse that is connected to the SL1400 is the
same as the procedure used to check the type of USB keyboard. See page 4-7.
16
17
18
App
Index
IM 701240-01E
4-9
4.3 Operating the SL14000 Using a USB Keyboard or a USB Mouse
USB Mouse Operation
Operations Similar to the Front Panel Keys on the SL1400 (Top Menu)
• Displaying the Top Menu
Right-click on the screen. The front panel keys on the SL1400 are displayed as the
top menu.
• Selecting Items on the Top Menu
Left-click the item you want to select. The setup menu corresponding to the
selected item is displayed on the right side of the screen. The top menu is cleared
from the screen.
Pointing to an item with a sub menu (items with a > mark displayed to the right)
displays the sub menu. As with the top menu, left-click the item you want to select.
Top menu: Right-click to display the top menu.
Select using the pointer and left-click.
Displays the setup menu that you select with the pointer.
Sub menu: Sub menus are displayed for items that have lower layers.
Note
•
•
The following keys do not appear on the top menu.
ESC, RESET, SELECT, and arrow keys
There is no WIDE SCREEN key on the front panel.
• Clearing the Top Menu
Displaying the Main Setup Information of Each Channel on the Right
Side of the Screen after Clearing the Top Menu
Left-click on an area outside the top menu. The top menu is cleared, and the main
setup information of the channel that is currently displayed is shown on the right
side of the screen.
Main setup information of each channel
4-10
IM 701240-01E
4.3 Operating the SL14000 Using a USB Keyboard or a USB Mouse
Expanding the Waveform Display Area after Clearing the Top Menu
Left-click WIDE SCREEN on the top menu. The top menu is cleared, and the
waveform display area is displayed expanded.
1
2
3
4
Common Operations
5
Select WIDE SCREEN using the pointer and left-click to
expand the waveform display area.
6
• Displaying the Shortcut Dialog Box
As shown in the following figure, a shortcut menu is provided in addition to the
setup menu so that certain items can be executed even while a dialog box or a
window is open. The shortcut menu appears when you right-click on the screen
while a dialog box or a window is open. In this case, the top menu is not displayed.
Shortcut menu
Right-click when a dialog box or a window
is displayed to show the shortcut menu.
Setup menu
7
8
9
10
11
12
13
14
Dialog box or window
15
16
17
18
App
Index
IM 701240-01E
4-11
4.3 Operating the SL14000 Using a USB Keyboard or a USB Mouse
Setup Menu Operation (Similar to the Soft Key Operation)
• Selecting an Item on the Setup Menu
Left-click the item you want to select on the setup menu.
If another menu appears when you select an item, move the pointer to the new
menu displaying the item you want to select and left-click the item.
If an item such as ON or OFF appears when you select an item, move the pointer
to the new frame and left-click within the frame to switch the selected item.
For menus in which items are selected using jog shuttle+SELECT, left-click the
desired item. Left-click again to confirm the new setting and close the selection
dialog box. For scrollable items, turn the mouse wheel to scroll.
Left-click within this frame to
switch the selected item for each
click. Point to the item you wish
to select and left-click the item to
apply the selection.
Selection
items
On menu with this mark, left-click
twice on the desired item to apply
the setting.
Left-click within this frame to
show the selection menu.
Turning the mouse wheel when this
mark is present scrolls the menu
item (displays the items that are not
displayed).
• Clearing the Menu Screen
Left-click an area outside the menu.
Setting Values
For menu items with a
or
icon, the numeric value can be entered as follows:
• To select a menu item with a or icon, left-click the center of the menu item. If
there are two setup items in a single menu item, you can repetitively left-click to
select either item.
• Turn the mouse wheel downward to increase the value.
• Turn the mouse wheel upward to decrease the value.
• To change the selected digit, move the pointer to the left or right of the value. The
pointer shape changes to
or . If you point to the left of the value and left-click,
the current digit moves to the left; if you point to the right of the value and left-click,
the current digit moves to the right. The current digit moves one digit at a time for
each left-click.
• To reset the value to default, right-click on the desired menu item.
Moving the pointer in this area causes the pointer
shape to change. Left-click to move the current digit.
Right-click to reset the value to default.
4-12
IM 701240-01E
4.3 Operating the SL14000 Using a USB Keyboard or a USB Mouse
Selecting Toggle Box Items on the Dialog Box
1
• Left-click the item you want to select. The item is selected. Click the selected item
again to deselect it.
• To close the dialog box, left-click an area outside the dialog box.
2
3
Left-click the item you wish to
select.
4
Common Operations
5
6
7
Note
To close an error dialog box also, left-click an area outside the error dialog box.
8
Selecting a File, Directory, or Medium Drive on the File List Window
• Left-click a file, directory, or medium drive name to select it.
• If a scroll bar is shown on the file list window, you can turn the mouse wheel to
scroll the file list.
• To cancel the selection, left-click an area outside the file list window. The selection
is cancelled, and the file list window closes.
9
10
11
12
Scroll bar
13
14
Move the pointer to the file, directory, or storage drive
you want to select and left-click.
15
16
17
18
App
Index
IM 701240-01E
4-13
4.3 Operating the SL14000 Using a USB Keyboard or a USB Mouse
Setting the Measurement Range
When the waveform of a channel measuring a voltage is displayed, point near the
measurement range value displayed at the upper left of the screen. The pointer shape
changes to . Turning the mouse wheel upward increases the measurement range
value; turning it downward decreases it.
Moving the pointer to the position indicated below changes the pointer
shape. You can change the setting of the items that are set with the
RANGE knob by turning the wheel in this condition.
4-14
IM 701240-01E
4.4
1
Initializing Settings
<For a description of this function, refer to page 2-49.>
2
Procedure
3
Executing Initialization
Press MENU.
Press the Next 1/2 soft key.
Press the INITIALIZE/CAL soft key.
Press the Initialize soft key to execute initialization.
4
Common Operations
1.
2.
3.
4.
5
Canceling Initialization
4.
Press the Initialize Undo soft key. The settings return to the conditions that
existed immediately before initialization.
6
7
8
9
10
Execute initialization
Cancel initialization
11
Note
If you turn OFF the power switch, the settings that existed immediately before initialization are
cleared. Therefore, the “Undo” operation is not possible in this case.
12
13
14
15
16
17
18
App
Index
IM 701240-01E
4-15
4.4 Initializing Settings
Explanation
The values specified by the keys can be reset to the factory default values. This is useful
when you want to clear previous settings or start the measurement from scratch.
Initialization
Initialization refers to the act of restoring the factory default condition.
For a list of the factory default settings, see appendix 6.
Settings That Cannot Be Initialized
•
•
•
•
•
•
Date and time settings
Settings related to communications and Ethernet interface
SCSI ID number setting
Menu/message language setting
Setting of the time difference from GMT
ON/OFF setting of the internal hard disk motor
Canceling Initialization
If you initialize the settings by mistake, you can press the Initialize Undo soft key to
revert to the condition that existed before initialization.
Initializing All the Settings
Turning ON the power switch while holding down RESET also initializes settings related
to communications and Ethernet interface and SCSI ID settings. The stored setup data
(see section 13.1) is cleared. If you initialize the SL1400 in this fashion, the settings
cannot be set back to their original condition.
4-16
IM 701240-01E
4.5
1
Performing Auto Setup
<For a description of this function, refer to page 2-49.>
2
Procedure
3
Executing Auto Setup
6.
7.
Apply the signal to be measured.
Press MENU.
Press the Next 1/2 soft key.
Press the INITIALIZE/CAL soft key.
Press the Trace soft key. The channel selection menu appears. The menu does
not appear for channels without modules.
Turn the jog shuttle+SELECT to select the target channel.
Press the Auto Setup soft key. Auto setup is executed.
When auto setup is executed, waveform acquisition starts automatically.
5
6
7
Canceling Auto Setup
8.
4
Common Operations
1.
2.
3.
4.
5.
Press the Auto Setup Undo soft key. The settings are set back to the original
condition.
8
9
Execute auto setup
Cancel auto setup
10
11
12
13
14
15
16
17
18
App
Index
IM 701240-01E
4-17
4.5 Performing Auto Setup
Explanation
Auto setup automatically sets the settings such as voltage range, record time, and trigger
level that are appropriate for the input signal.
Center Position after Auto Setup
The center position is always 0 V.
Target Channels
Auto setup is performed on all channels or on the specified channel.
Applicable Modules
701250 (HS10M12), 701251 (HS1M16), 701255 (NONISO_10M12), 701260 (HV (with
RMS)), 701261 (UNIVERSAL), 701262 (UNIVERSAL (AAF)), and 701275 (ACCL/VOLT)
Canceling Auto Setup
Pressing the Auto Setup Undo soft key sets the SL1400 back to the condition that
existed immediately before auto setup. However, if you turn OFF the power switch, the
settings that existed immediately before auto setup are cleared. Therefore, the “Undo”
operation is not possible in this case. The settings that existed immediately before auto
setup are cleared, if you execute initialization after auto setup.
Applicable Waveforms for Auto Setup
Frequency:
Approx. 10 kHz
Absolute value of the input voltage: Maximum value is between approximately 20 mV
(1:1) and ((maximum range)×10)
Type:
Repetitive waveform (that is not complex)
When the input coupling is set to DC
Note
The auto setup function may not work properly, if the waveform includes DC components or
high-frequency components.
4-18
IM 701240-01E
4.5 Performing Auto Setup
1
Settings after Auto Setup
Waveform acquisition and display conditions
START/STOP
START
Acquisition mode
Normal
Number of acquisitions
Infinite
Time base
Int
Accumulate mode
OFF
Zoom target
Channels whose display is turned ON
Vertical-axis settings
Voltage range
Coupling
Bandwidth limit
Display ON/OFF
Position
Variable mode
V Zoom
Scaling
Horizontal-axis settings
Record time
Trigger settings
Trigger mode
Trigger type
Trigger source
3
Value that causes the absolute value of the input waveform
to be 1.6 to 4.5 divisions
0 V or the center value between the maximum and
minimum values of the input signal
DC
FULL
Turns ON channels whose absolute value of the input
voltage is greater than or equal to 20 mV (1:1)
0 division
OFF
×1
OFF
Value that the displays 1.6 to 4 periods of the waveform
with the shortest period of the auto setup target waveforms
4
Common Operations
Offset voltage
2
5
6
7
8
9
Trigger coupling
Hysteresis
Hold off time
Trigger position
Trigger delay
Auto
SIMPLE
Channel whose waveform amplitude is greater than or
equal to 1 division with the longest period
Center level between the maximum and minimum values/
rising
DC
(high sensitivity)
0.0 ns
50.0%
0.0 µs
Computation settings
Math
OFF
13
Other settings
Realtime output
Accumulation
Logic A and Logic B display
OFF
OFF
OFF
14
Trigger level/slope
Items other than those listed above are not applicable for auto setup.
10
11
12
15
Note
If none of the input waveforms are detected on the target module, the waveform acquisition is
not started.
16
17
18
App
Index
IM 701240-01E
4-19
4.6
Performing Calibration
Calibrate the SL1400 when observing voltages.
Procedure
Executing Calibration
1.
2.
3.
4.
Press MENU.
Press the Next 1/2 soft key.
Press the INITIALIZE/CAL soft key.
Press the Cal Exec soft key to execute calibration.
Performing Auto Calibration
5.
Press the Auto Cal soft key to select ON.
Turn ON/OFF auto calibration
Execute calibration
Explanation
Calibration
The following parameters are calibrated. Perform calibration when you want to measure
waveforms with high accuracy.
• Ground level offset
• A/D converter gain
Precautions to Be Taken When Performing Calibration
• Allow the instrument to warm up for at least 30 minutes after the power is turned ON
before performing calibration. If calibration is performed immediately after the power is
turned ON, the calibration may be inaccurate due to drift caused by fluctuation in the
temperature of the instrument.
• Perform calibration when the temperature of the instrument is stable and is between
5°C and 40°C (preferably at 23°C±5°C).
Note
The calibration described above is performed automatically when power is turned ON or when
the Cal Exec soft key is pressed.
Auto Calibration
If Auto Cal is set to ON, auto calibration is performed the first time the record time is
changed or the first time measurement is started after the time shown below passes.
After turning ON the power
• 3 minutes pass.
• 10 minutes pass.
• 30 minutes pass, and every 30 minutes from here on after.
4-20
IM 701240-01E
Chapter 5
Horizontal and Vertical Axes
5.1
1
Turning Channels ON/OFF
2
Procedure
1.
2.
3
Press CH.
Press one of the soft keys from CH1 to CH16, Logic A, and Logic B.
4
Turning the Display ON/OFF
3.
Press the Display soft key to select ON or OFF.
5
CH1 to CH16, Logic A, or Logic B
Horizontal and Vertical Axes
Turn the display
6
The displayed menu varies
depending on the installed
input module.
7
8
9
Press the Next soft key to display the next
menu.
10
Explanation
Select a channel from CH1 to CH16, Logic A, and Logic B, and turn ON/OFF the input
waveform display.
• CH1 to CH16, Logic A, and Logic B waveforms can be displayed simultaneously.
• When you are entering the settings of a selected channel, the channel name and the
specified measurement range are displayed at the upper left of the screen.
11
Note
13
•
•
•
•
The screen can be split into up to 16 display areas using the DISPLAY menu (section 8.1).
Scale values (section 8.9) and waveform labels (section 8.10) can also be displayed.
When displaying history waveforms or waveforms recalled from the PC card, the waveforms
applied to the channels cannot be displayed. To compare waveforms, use the snapshot
function.
Channels that do not have input modules installed cannot be turned ON.
A waveform icon is displayed to the left of the channel name at the top of the CH1 to CH16 or
Logic A/B setup menu. The icon color is the same as the color of the displayed waveform
(see section 16.3). The icon shape varies depending on the channel setup menu as follows:
CH1 to CH16
12
14
15
16
Logic A/B
17
Waveform icon Channel name
18
App
Index
IM 701240-01E
5-1
5.2
Setting the Record Time and Sample Rate
<For a description of this function, refer to page 2-3.>
Procedure
1.
2.
Press MENU.
Press the ACQ soft key.
Setting the Record Time
3.
4.
Select the Record Time soft key to select Record Time.
Turn the jog shuttle to set the record time.
Setting the Sample Rate
5.
6.
Select the Sample Rate soft key to select Sample Rate.
Turn the jog shuttle to set the sample rate.
•
•
If you set a small sample rate, the record time can be set long.
If you change the record time and sample rate, the record length for storing the
sampled data varies.
Sample rate
Sampling interval (1/sample rate)
Record time
Record length
Explanation
Record Time
The record time specifies the length of time of the input waveform to be displayed on a
single screen.
Selectable range: 100µs to 30 days
The selectable record time varies depending on the maximum record length installed in
the SL1400, the number of channels whose display is turned ON, and the specified
sample rate.
Sample Rate
Sample rate refers to the number of times the measured waveform is sampled per
second.
• The maximum sample rate varies depending on the input module. To effectively use
the record length provided by the SL1400, we recommend that the sample rate be set
less than the maximum sample rate of the input module.
• For the maximum sample rate (or data update rate) of each input module, see the
specifications of the respective module in chapter 18.
5-2
IM 701240-01E
5.2 Setting the Record Time and Sample Rate
1
Record Time and Roll Mode
The display switches to roll mode if you set the record time to 1 s to 30 days under the
following conditions.
• Acquisition mode is set to a mode other than averaging.
• The trigger mode is set to auto, auto level, single, or log.
• The time base is set to the internal clock signal.
Sampling Interval
The term record length normally refers to the number of data points acquired per channel
in the acquisition memory. The record length changes when you change the record time
or sample rate (see appendix 1). The following equation holds: record length = record
time × sample rate. The maximum record length of the SL1400 is 50 MW. The measured
waveform signal of a single channel can be acquired up to the maximum record length of
50 MW when only a single channel is displayed.
The time over which the signal of the measured waveform of a single channel that can
be recorded with a record length of 50 MW is shown below.
Sample Rate
In Seconds
In Minutes
In Hours
In Days
10 MS/s
5
–
–
–
1 MS/s
50
–
–
–
100 kS/s
300
5
–
–
10 kS/s
3600
60
1
–
1 kS/s
36000
600
10
–
200 S/s
180000
3000
50
208
5
Horizontal and Vertical Axes
Record Length
6
7
8
9
10
11
The record length that is stored in the acquisition memory and the record length of the
displayed waveform are the same.
12
13
Note
•
3
4
Sampling interval is the inverse of the sample rate. It indicates the interval at which the
measured waveform is sampled.
•
2
The record time and sample rate are displayed at the upper right of the screen. If you change
the record time while waveform acquisition is stopped, the new record time is displayed in
parentheses at the upper right of the screen. The new value takes effect the next time
acquisition is started.
For the relationship between the record time, sample rate, and record length, see appendix 1.
14
15
16
17
18
App
Index
IM 701240-01E
5-3
5.3
Setting the Voltage Range
<For a description of this function, refer to page 2-6.>
Procedure
Selecting the Channel
1.
2.
Press CH.
Press one of the soft keys from CH1 to CH16.
For the displayed menus when this operation is executed, see section 5.1.
Setting the Voltage Range
3.
Turn the RANGE knob to set the voltage range.
Explanation
Voltage Range (When Variable Is OFF)
The voltage range adjusts the displayed amplitude of the waveform. Set the voltage that
corresponds to the area between the top and bottom edges of the waveform display area
(10 divisions) for each channel. Set the voltage in 1-2-5 steps as in 1 V → 2 V → 5V.
When Variable is set to OFF, the Position and V Zoom settings are valid.
Note
•
•
The specified range is displayed at the upper left of the screen. If you change the range while
waveform acquisition is stopped, the new range is displayed in parentheses at the upper left
of the screen. The new value takes effect the next time acquisition is started.
Changing the range while acquisition is stopped has no affect on cursor measurement and
automated measurement of waveform parameters. The displayed values are for the range
setting that were used when the measurement was made.
Selectable Range
The selectable range varies depending on the input module as follows:
Input Module
Selectable Range
701250 (HS10M12)
701251 (HS1M16)
701255 (NONISO_10M12)
701260 (HV (with RMS))
701261 (UNIVERSAL)
701262 (UNIVERSAL(AAF))
701265 (TEMP/HPV)
701275 (ACCL/VOLT)
50 mV to 200 V
10 mV to 200 V
50 mV to 200 V
200 mV to 2 kV
50 mV to 200 V
50 mV to 200 V
1 mV to 100 V
50 mV to 100 V
The values are those when the probe attenuation is set to 1:1. Multiply the above values by 10,
100, and 100 for probe attenuation of 10:1, 100:1, and 1000:1, respectively.
Display Position of Range
If you turn the RANGE knob while waveform acquisition is stopped, the top row of the
range display shows the range for the displayed waveform, and the bottom row shows
the new range. The new range takes effect the next time acquisition is started.
Top row:
Range corresponding to the displayed waveform*
Bottom row: Changed range*
* If the range corresponding to the displayed waveform and the
changed range are the same, only the bottom row is displayed.
5-4
IM 701240-01E
5.3 Setting the Voltage Range
1
Voltage Range (When Variable Is ON)
When Variable is ON, you can adjust the displayed amplitude of the waveform by
changing the Upper and Lower values. For the operating procedure, see section 5.9.
Even if you change the range using the RANGE knob when Variable is ON, the new
range is not applied to the waveform amplitude. This is because the Upper and Lower
values are not changed. The new range takes effect when Variable is turned OFF.
2
3
Note
4
If you turn the jog shuttle while waveform acquisition is stopped and change the Upper and
Lower values, the displayed waveforms also change.
5
If you turn the RANGE knob while waveform acquisition is stopped, the top row of the
range display shows the span (range that can be displayed between the top and
bottom edges of the waveform display area (10 divisions), see section 5.9) for the
displayed waveform, and the bottom row shows the new range. The new range takes
effect the next time acquisition is started.
Horizontal and Vertical Axes
Display Position of Range
6
7
8
Top row:
Span corresponding to the displayed waveform*
Bottom row: Changed range*
9
* If you change the range while waveform acquisition is stopped, the
range value in the bottom row is shown in parentheses. The span
value in the top row does not change.
10
11
12
13
14
15
16
17
18
App
Index
IM 701240-01E
5-5
5.4
Setting the Vertical Position of the Waveform
<For a description of this function, refer to page 2-7.>
Procedure
Selecting the Channel
1.
2.
Press CH.
Press one of the soft keys from CH1 to CH16, Logic A, and Logic B.
For the displayed menus when this operation is executed, see section 5.1.
Selecting Variable OFF
3.
Press the Variable soft key to select OFF.
Setting the Vertical Position
4.
5.
Press the Position soft key to select Position.
Turn the jog shuttle to set the vertical position.
The displayed menu varies depending on the installed input module.
A display example is shown below.
Turn Variable
OFF
Set the vertical
position
Turn Variable
OFF
Set the vertical
position
5-6
Set the vertical
position
Turn Variable
OFF
Set the vertical
position
IM 701240-01E
5.4 Setting the Vertical Position of the Waveform
1
Explanation
Selectable Range
2
Set the vertical display position of the waveform for each channel.
Selectable range: ±5 divisions from the center position of the waveform display area
Resolution:
0.01 division
3
Checking the Vertical Position
For input waveforms and computed waveforms, the ground level and vertical position are
marked to the left of the waveform display area.
4
5
Horizontal and Vertical Axes
Vertical position
mark
6
Ground level
mark
7
Note
Data exceeding the measurement range (see section 2.2) is cut when the vertical position or
upper and lower limits (when Variable is ON) are changed, and the waveform appears clipped as
shown below.
8
9
10
11
12
13
14
15
16
17
18
App
Index
IM 701240-01E
5-7
5.5
Selecting the Input Coupling
<For a description of this function, refer to page 2-8.>
Procedure
Selecting the Channel
1.
2.
Press CH.
Press one of the soft keys from CH1 to CH16.
For the displayed menus when this operation is executed, see section 5.1.
Selecting the Input Coupling
3.
4.
Press the Coupling soft key.
Press the soft key corresponding to the desired input coupling.
•
•
•
To measure RMS values using the 701260 (HV (with RMS)), select AC-RMS or DCRMS. For the setup procedure of RMS measurements, see section 5.13.
To measure the temperature using the 701261 (UNIVERSAL), 701262 (UNIVERSAL
(AAF)), or 701265 (TEMP/HPV), select TC. For the setup procedure of temperature
measurements, see section 5.14.
To measure acceleration on the 701275 (ACCL/VOLT), select ACCL. For the setup
procedure of acceleration measurements, see section 5.16.
Select the input coupling
Explanation
Input Coupling
Select how the input signal is coupled to the vertical control circuit from the list below.
The selectable settings vary depending on the module.
AC
Acquires and displays only the AC component of the input signal.
DC
Acquires and displays all the components (DC and AC) of the input signal (selectable only when
measuring voltage).
GND
Checks the ground level.
TC
Select this type to measure temperature.
AC-RMS
Converts and displays only the AC component of the input signal.
DC-RMS
Converts and displays both DC and AC components of the input signal.
ACCL
Select this type to measure acceleration.
5-8
IM 701240-01E
5.5 Selecting the Input Coupling
1
Input Coupling and Frequency Characteristics
The frequency characteristics when AC or DC is specified are shown below.
Note that low-frequency signals and signal components are not acquired if AC is
selected as indicated in the figure below.
2
3
When “DC” is selected
When “AC” is selected
Attenuation
Attenuation
4
0 dB
–3 dB
0 dB
–3 dB
5
–3 dB point*
Input frequency
–3 dB point*
The lower frequency –3 dB
point when using AC coupling*
Horizontal and Vertical Axes
Input frequency
6
* The value varies for each input module. For details, see section 18.12.
7
Notes for 701261, 701262, 701265, 701275, and 701280
• If the input coupling is changed from TC to DC or DC to TC while waveform
acquisition is stopped on the 701261 (UNIVERSAL), 701262 (UNIVERSAL (AAF)), or
701265 (TEMP/HPV), the waveforms are no longer drawn. If you set the input
coupling to the original setting, the waveforms are redrawn.
• If the input coupling is changed from ACCL to some other setting or some other
setting to ACCL while waveform acquisition is stopped on the 701275 (ACCL/VOLT),
the waveforms are no longer drawn. If you set the input coupling to the original
setting, the waveforms are redrawn.
• If you change the contents of the function of the FV setting while the waveform
acquisition is stopped on the 701280 (FREQ), the waveforms are no longer drawn. If
you set the contents of the function to the setting that was present during
measurement, the waveforms are redrawn.
CAUTION
8
9
10
11
12
13
• If the input coupling is AC and the frequency of the input signal is less than 1
Hz, the signal at the input terminal of the module is not attenuated to 1/10 even
if the probe with 10:1 attenuation and input resistance of 10 MΩ is used. Make
sure not to apply a voltage that has a signal component less than 1 Hz that
exceeds the maximum input voltage of each module.
• Do not apply a voltage exceeding the maximum input voltage or maximum
allowable common mode voltage of the input modules. This may cause damage
to the input section.
14
15
16
17
18
App
Index
IM 701240-01E
5-9
5.6
Selecting the Probe Attenuation or Current-toVoltage Conversion Ratio
<For a description of this function, refer to page 2-9.>
Procedure
Selecting the Channel
1.
2.
Press CH.
Press one of the soft keys from CH1 to CH16.
For the displayed menus when this operation is executed, see section 5.1.
Selecting the Probe Attenuation or Current-to-Voltage Conversion Ratio
3.
4.
5.
Press the Next 1/2 soft key.
Press the Probe soft key.
Press the soft key corresponding to the desired attenuation ratio or current-tovoltage conversion ratio according to the probe that you are using.
Select the probe attenuation or
current-to-voltage conversion ratio
Explanation
Select the desired setting for each channel from the following:
1:1, 10:1, 100:1, 1000:1, 10A:1V, or 100A:1V
• 1:1 to 1000:1 represent the probe attenuation for voltage probes.
• 10A:1V and 100:1V represent the output voltage rate of current probes.
Set the probe attenuation for the accessory probes (sold separately) as follows:
• Isolated probe (700929):
10:1
• Current probe (701933):
10A:1V
• Current probe (701930 and 701931):
100A:1V
• Differential Probe (700924):
1000:1 or 100:1
• 10:1 passive probe (701940):
10:1
Note
If the attenuation or current-to-voltage conversion ratio is not set correctly according to the probe
that you are using, the voltage and scale values of the input signals will not be displayed
correctly. For example, if you set the attenuation to 1:1 when you are actually using a 10:1
probe, the displayed value for the waveform amplitude will be 1/10th the actual value.
5-10
IM 701240-01E
5.7
1
Selecting the Bandwidth Limit
2
Procedure
3
Selecting the Channel
1.
2.
Press CH.
Press one of the soft keys from CH1 to CH16.
4
For the displayed menus when this operation is executed, see section 5.1.
Selecting the Bandwidth Limit
5
Press the Bandwidth soft key.
Press the soft key corresponding to the desired bandwidth limit value.
Horizontal and Vertical Axes
3.
4.
6
The displayed position of the menu varies depending on the installed input
module. A display example is shown below.
7
8
Select the
bandwidth limit
9
Select the
bandwidth limit
10
11
Explanation
Bandwidth Limit
12
High frequency components can be eliminated from the input signal.
• Select the bandwidth limit (cutoff frequency) for each channel.
• The selectable bandwidth limits vary depending on the input module as follows:
• For the bandwidth limit of the 701280 (FREQ), see page 5-40.
Input Module
Selectable Bandwidth Limits
701250 (HS10M12)/
701255 (NONISO_10M12)
500 Hz, 5 kHz, 50 kHz, 500 kHz, or Full
701251 (HS1M16)
400 Hz, 4 kHz, 40 kHz, or Full
701260 (HV(with RMS))
100 Hz, 1 kHz, 10 kHz, or Full
701261 (UNIVERSAL)1
701262 (UNIVERSAL(AAF))1
701265 (TEMP/HPV)
2 Hz, 8 Hz, 30 Hz, or Full
701270 (STRAIN_NDIS)/
701271 (STRAIN_DSUB)
10 Hz, 100 Hz, 1 kHz, or Full
701261 (UNIVERSAL)2
701262 (UNIVERSAL (AAF))2
701275(ACCL/VOLT)
40 Hz, 400 Hz, 4 kHz, Auto, or Full
1
2
13
14
15
16
17
18
When measuring temperature
Auto is not available on the 701261 when measuring voltage.
App
Index
IM 701240-01E
5-11
5.7 Selecting the Bandwidth Limit
For example, bandwidth limits of 400 Hz, 4 kHz, and 40 kHz are available on the 701251
(HS1M16). The frequency characteristics when the bandwidth is limited are shown
below. When Full is selected, the maximum bandwidth of the input module is used.
–3 dB
Approx. 400 Hz
Approx. 4 kHz
Approx. 40 kHz
FULL
Bandwidth Limit on the 701262 (UNIVERSAL (AAF)) and 701275 (ACCL/VOLT)
If voltage is being measured on the 701262 (UNIVERSAL (AAF)) or if you set the
bandwidth limit on the 701275 (ACCL/VOLT) to Auto, the anti-aliasing filter and low-pass
filter settings are set to values shown below according to the sample rate.
Sample Rate
Anti-Aliasing Filter
Low-Pass Filter
200 kS/s or higher
100 kS/s
50 kS/s
20 kS/s
10 kS/s
5 kS/s
2 kS/s
1 kS/s
500 S/s
200 S/s
100 S/s
50 S/s
5 S/s to 20 S/s
2 S/s or less
Ext sample
40 kHz
40 kHz
20 kHz
8 kHz
4 kHz
2 kHz
800 Hz
400 Hz
200 Hz
80 Hz
40 Hz
20 Hz
20 Hz
20 Hz
40 kHz
OFF
OFF
OFF
OFF
4 kHz
4 kH
4 kHz
400 Hz
400 Hz
400 Hz
40 Hz
40 Hz
40 Hz
40 Hz
OFF
For example, for sample rates between 100 kS/s to 50 kS/s, the cutoff frequency of
the anti-aliasing filter is set to 40% of the sample rate.
5-12
IM 701240-01E
5.8
1
Zooming Vertically by Setting the Zoom Rate
<For a description of this function, refer to page 2-7.>
2
Procedure
3
Selecting the Channel
1.
2.
Press CH.
Press one of the soft keys from CH1 to CH16, Logic A, and Logic B.
4
For the displayed menus when this operation is executed, see section 5.1.
Selecting Variable OFF
5
Press the Variable soft key to select OFF.
Horizontal and Vertical Axes
3.
6
Setting the Zoom Rate
4.
Press RANGE FINE. The indicator above the RANGE FINE key illuminates.
Press the key again to clear the indicator. You can set the zoom rate only when the
indicator is illuminated.
5.
7
Turn the RANGE knob to set the zoom rate of the vertical display.
You can also select V Zoom in the menu and turn the jog shuttle.
8
The displayed menu varies depending on the installed input module. A display
example is shown below.
9
Turn Variable
OFF
10
Set the
magnification
Turn Variable
OFF
Turn Variable
OFF
Set the
magnification
Set the
magnification
11
12
Set the
magnification
13
Note
Pressing RESET while the jog shuttle control is set to V Zoom sets the zoom rate to ×1.
14
15
Explanation
The displayed waveform can be expanded/reduced vertically. This function is useful
when you want to change the vertical axis setting after displaying waveforms. You can
use this function when the Variable setting is OFF.
16
Waveform to Be Zoomed
Select a waveform from CH1 to CH16, Logic A, and Logic B.
However, zooming is not possible if the display of the selected waveform is turned OFF.
17
18
App
Index
IM 701240-01E
5-13
5.8 Zooming Vertically by Setting the Zoom Rate
Zoom rate: V Zoom
The following zoom rates are available.
×0.1, ×0.111, ×0.125, ×0.143, ×0.167, ×0.2, ×0.25, ×0.33, ×0.4,
×0.5, ×0.556, ×0.625, ×0.667, ×0.714, ×0.8, ×0.833, ×1, ×1.11,
×1.25, ×1.33, ×1.43, ×1.67, ×2, ×2.22, ×2.5, ×3.33, ×4, ×5,
×6.67, ×8, ×10, ×12.5, ×16.7, ×20, ×25, ×40, ×50, and ×100
However, the selectable range of zoom rates may be limited as follows:
• 701260 (HV (with RMS))
500 V range: ×0.25 to ×100
1 kV range:
×0.5 to ×100
2 kV range:
×1 to ×100
• When Measuring Acceleration on the 701275 (ACCL/VOLT)
×0.5 to ×50
• 701280 (FREQ)
×0.33 to ×100
Zoom Position
The waveform is zoomed around the vertical position. If the waveform is zoomed
vertically using V Zoom, the top row displays the span corresponding to the displayed
waveform (display range), and the bottom row displays the specified range.
If V Zoom is set to × 2
Range 10 V
Span 5 V
Range 10 V
Vertical position
mark
Ground level
mark
Top row:
Span corresponding to
the displayed waveform
Bottom row: Specified range
5-14
IM 701240-01E
5.9
1
Zooming Vertically by Setting the Upper and
Lower Limits of the Display Range
<For a description of this function, refer to page 2-7.>
2
Procedure
3
Selecting the Channel
1.
2.
Press CH.
Press one of the soft keys from CH1 to CH16.
4
For the displayed menus when this operation is executed, see section 5.1.
5
Selecting Variable ON
Press the Variable soft key to select ON.
6
Setting the Upper and Lower Limits
4.
Press the Upper or Lower soft key.
•
•
5.
Horizontal and Vertical Axes
3.
The upper and lower limits can be set separately using the jog shuttle.
If both Upper and Lower are selected simultaneously, the upper and lower limits can be
set simultaneously without changing the spacing between the two. If Upper and Lower
are assigned to separate soft keys, the values cannot be set simultaneously, because
you cannot select Upper and Lower simultaneously.
Turn the jog shuttle to set the upper or lower limit.
7
8
9
The displayed menu varies depending on the installed input module.
A display example is shown below.
10
Turn Variable ON
11
Turn Variable ON
Set the upper limit
Set the lower limit
12
Set the upper limit
13
Set the lower limit
14
Note
Pressing RESET sets the maximum and minimum values of the measurement range to the
upper and lower limits.
• When measuring voltage
Upper:
+Voltage range
Lower:
–Voltage range
• When measuring strain
Upper:
+Fs
Lower:
–Fs
• When measuring acceleration
Upper:
5000/(gain × sensitivity)
Lower:
–5000/(gain × sensitivity)
• When measuring frequency and other parameters on the frequency module
Upper:
(Offset) + (measurement range×3)
Lower:
(Offset) – (measurement range×3)
15
16
17
18
App
Index
IM 701240-01E
5-15
5.9 Zooming Vertically by Setting the Upper and Lower Limits of the Display Range
Explanation
Zooming Vertically According to the Upper and Lower Limitsof the Display
Range (Variable)
If you turn Variable ON, you can vertically zoom in or out the displayed waveform by
setting the upper and lower limits of the display range.
ON
You can zoom in on the desired section of the observed waveform by specifying the upper and
lower limits of the vertical axis according to the displayed waveform. In addition, you can widen
the display range to view waveforms outside the display range. The A/D conversion resolution
and accuracy remain the same as those for the original waveform, when the waveform is
expanded/reduced with Variable turned ON.
+10 V
+6 V
Zoom
+4 V
–10 V
+2 V
OFF
The waveform is not zoomed in or out vertically using the upper and lower limit settings. In this
setting, the vertical position (section 5.4), vertical zoom by setting the zoom rate (section 5.8),
and offset (section 5.10) can be changed.
Upper and Lower Limits
You can set the upper and lower limits to the smaller of the two values, ±(10 times the
specified measurement range) or ±2000 V. Make sure the upper limit value (Upper) is
greater than the lower limit value (Lower).
• Below are the ranges on the 701270 (STRAIN_NDIS) and 701271 (STRAIN_DSUB)
according to the range unit.
When the range unit is µSTR:
±30000 µSTR
When the range unit is mV/V:
±15 mV/V
• Up to ±2000000 unit on the 701275 (ACCL/VOLT).
• Up to (offset) ± (measurement range × 3) on the 701280 (FREQ).
• When measuring the frequency:
–1500 kHz to 1700 kHz
• When measuring RPMs:
–300 krpm to 350 krpm
• When measuring RPSs:
–5000 rps to 7000 rps
• When measuring the period:
–150 s to 200 s
• When measuring the duty cycle:
–500% to 700%
• When measuring the pulse width:
–150 s to 200 s
• When measuring the pulse integration: –2.5E+22 to 2.5E+22
• When measuring the velocity:
–2.5E+22 to 2.5E+22
Note
If you change the range using the RANGE knob after you set the upper and lower limits, the
measurable range changes even though the range on the screen does not change. If you set the
measurable range smaller than the specified upper and lower limits and start the waveform
acquisition, the section of the waveform exceeding the measurable range may not be displayed.
The measurable range is up to approximately ±10 divisions (around 0) when Variable is OFF.
5-16
IM 701240-01E
1
5.10 Setting the Offset
2
Procedure
3
Selecting the Channel
1.
2.
Press CH.
Press one of the soft keys from CH1 to CH16 in which the 701280 (FREQ) is
installed.
4
For the displayed menus when this operation is executed, see section 5.1.
5
Selecting Variable OFF
Horizontal and Vertical Axes
3.
Press the Variable soft key to select OFF.
6
Setting the Offset
4.
5.
Press the Offset soft key.
Turn the jog shuttle to set the offset.
7
8
Turn Variable OFF
9
10
Set the offset value
11
Note
Pressing RESET while the jog shuttle control is set to Offset sets the offset to 0.
12
Explanation
The 701280 (FREQ) allows you to set the center of observation (offset value) and
expand the area around the offset value for close observation. This feature allows you to
measure the fluctuation around a certain frequency.
Selectable Range of Offset
The selectable range of offset varies depending on the measurement item.
• When measuring the frequency:
±(100 times the measurement range or 200 kHz)
• When measuring RPMs:
±(100 times the measurement range or 50 krpm)
• When measuring RPSs:
±(100 times the measurement range or 1000 rps)
• When measuring the period:
±(100 times the measurement range or 50 s)
• When measuring the duty cycle:
±(100 times the measurement range or 100%)
• When measuring the pulse width:
±(100 times the measurement range or 50 s)
• When measuring the pulse integration: ±(100 times the measurement range or
1.0000E+22)
• When measuring the velocity:
±(100 times the measurement range or
1.0000E+22)
•
IM 701240-01E
14
15
16
17
18
App
Note
•
13
You can change the waveform position with respect to the vertical position (the center when
zooming the waveform vertically) by changing the offset.
If you change the offset while waveform acquisition is stopped, the change does not take
effect. The new value takes effect the next time acquisition is started.
5-17
Index
5.11 Using the Linear Scaling Function (AX+B or
P1-P2)
<For a description of this function, refer to page 2-9.>
The linear scaling function is applied when measuring voltage on the voltage module or
strain on the strain module.
Procedure
Selecting the Channel
1.
2.
Press CH.
Press one of the soft keys from CH1 to CH16.
For the displayed menus when this operation is executed, see section 5.1.
Selecting the Linear Scaling Method
3.
4.
5.
Press the Next 1/2 soft key.
Press the Linear Scale soft key. A Linear Scale setup dialog box appears.
Use jog shuttle+SELECT to set Mode to AX+B or P1-P2.
•
•
If you select AX+B, proceed to step 6 on this page.
If you select P1-P2, proceed to step 6 on the next page.
If the input module is 701271
(STRAIN_DSUB), “Shunt” is also displayed.
The Shunt item is used to perform shunt
calibration on the strain module. For the
setup procedure of Shunt, see section 5.15.
If AX+B Is Selected
6.
Use jog shuttle+SELECT to set the scaling coefficient, offset, unit, and display
type.
•
•
Set the unit as necessary. For the procedure to set the character string of the unit, see
section 4.2.
If the display format is set to Floating, set the Decimal Number and SubUnit values.
Scaling coefficient
Offset value
Unit
Display format
Number of digits to the right of the decimal
Prefix unit
5-18
IM 701240-01E
5.11 Using the Linear Scaling Function (AX+B or P1-P2)
1
If P1-P2 Is Selected
6.
Use jog shuttle+SELECT to set the values before scaling, P1:X and P2:X.
•
•
7.
You can also read the measured value into P1:X by selecting Get Measure P1:X and
pressing Exec.
You can also read the measured value into P2:X by selecting Get Measure P2:X and
pressing Exec.
Use jog shuttle+SELECT to set the scaled values (values after scaling), P1:Y
and P2:Y.
4
Scale value y
(Value after scaling)
y = ax + b
5
P2
Horizontal and Vertical Axes
P1: Y
6
P1
P2: X
P1: X
Measurement range
7
Measured value x
(Value before scaling)
8
As necessary, use jog shuttle+SELECT to enter the unit.
For the procedure to set the character string of the unit, see section 4.2.
9.
3
Set the value corresponding to P1:X in P1:Y and the value corresponding to P2:X in P2:Y.
P2: Y
8.
2
If the display format is set to Floating, use jog shuttle+SELECT to set the
Decimal Number and SubUnit values.
9
10
Value at point P1 before scaling
Scaled value at point P1
Value at point P2 before scaling
Scaled value at point P2
11
Read the measured value into the value of point P1 before scaling
Read the measured value into the value of point P2 before scaling
Unit
Display format
Number of digits to the right of the decimal
Prefix unit
12
13
Explanation
14
Selecting the Linear Scaling Method
Select the linear scaling method from the following:
15
OFF
Disables linear scaling.
AX+B
Scaling is performed using the specified scaling coefficient A and offset B according to the
equation shown below. Cursor measurement values and automated measurement values of
waveform parameters are displayed using scaled values. You can also assign a unit to the
scaled value.
Y = AX + B (where X is the measured value and Y is the scaling result)
P1-P2
Specify arbitrary scale values (P1:Y and P2:Y) for the values of two arbitrary points (P1:X and
P2:X). The conversion equation (y = ax + b) is derived from these four values.
• Range of values of the two arbitrary points (P1:X and P2:X)
Same as the measurement range. You can also read in the measured values.
• Range of scale values (P1:Y, P2:Y)
–9.9999E+25 to +9.9999E+25
• Initial scale values
P1:X +0.0000E+00, P1:Y +0.0000E+00
P2:X +1.0000E+00, P2:Y +1.0000E+00
IM 701240-01E
5-19
16
17
18
App
Index
5.11 Using the Linear Scaling Function (AX+B or P1-P2)
Setting AX+B
The selectable range of scaling coefficient A and offset B is as follows:
Selectable range of A and B: –9.9999E+30 to +9.9999E+30
Initial value of A:
+1.0000E+00, initial value of B: +0.0000E+00
Reading in the Measured Values When the Linear Scaling Method is P1-P2
(Get Measure)
Regardless of whether waveform acquisition is started or stopped, the current value
(value indicated by the level indicator) can be read into P1:X or P2:X.
Unit
Number of characters that can be entered: Up to 4 characters
Display Type
When measuring voltage on the voltage module or strain on the strain module, select the
display type for the linear scaled values from the two types below.
Exponent
Exponential display.
Floating
Floating point display.
Use Decimal Number to select the number of digits to the right of the decimal from Auto, 0 to 3.
Use SubUnit to select the sub unit from Auto, p, n, µ, m, None, k, M, G, and T.
• Decimal Number
If a setting between 0 and 3 is selected, the selected number of digits is displayed to the right
of the decimal point. If Auto is selected, the value is displayed using 5 digits total (example:
1.0000 and 250.00). The initial setting is Auto.
• SubUnit
If a setting other than Auto is selected, the value is displayed using the specified sub unit. If
Auto is selected, the most suitable unit for the value is automatically set. The initial setting is
Auto. If the value cannot be displayed using a decimal value, exponential display is enabled.
Displaying the Scaled Values
The linearly scaled values of the upper and lower limits of the vertical axis of each
channel can be displayed. For details, see section 8.9.
Note
•
•
•
•
•
5-20
Linear scaling cannot be performed when measuring temperature, acceleration, or frequency.
Linear scaling is not available for the following waveforms.
Snapshot waveforms
Accumulated waveforms (excluding the most recent waveform)
Linear scaling is set for each channel.
The scaling coefficient A and offset B that you entered are held even if you turn OFF the
linear scaling function.
Computation is performed using the linearly scaled values.
IM 701240-01E
1
5.12 Inverting the Waveforms
<For a description of this function, refer to page 2-10.>
2
Procedure
3
Selecting the Channel
1.
2.
Press CH.
Press one of the soft keys from CH1 to CH16.
4
For the displayed menus when this operation is executed, see section 5.1.
Turning Waveform Inversion ON/OFF
5
Press the Next 1/2 soft key.
Press the Invert soft key to select ON.
Horizontal and Vertical Axes
3.
4.
6
7
Turn waveform inversion
ON/OFF
8
9
10
Explanation
11
The input signals to CH1 to CH16 can be inverted independently.
The waveform is inverted around the vertical position.
12
Note
•
•
•
Cursor measurements, automated measurement of waveform parameters, and computation
are performed on the inverted waveform.
The trigger function is executed on the original waveform even if the waveform is inverted.
When measuring strain, inversion is not possible on waveforms after measurements. The
invert ON/OFF change takes effect in the next measurement.
13
14
15
16
17
18
App
Index
IM 701240-01E
5-21
5.13 Setting the RMS Measurement
<For a description of this function, refer to page 2-11.>
Procedure
Selecting the Channel
1.
2.
Press CH.
Press one of the soft keys from CH1 to CH16 in which the 701260 (HV (with
RMS)) is installed.
For the displayed menus when this operation is executed, see section 5.1.
Selecting the Input Coupling of the RMS Measurement
3.
Press the Coupling soft key followed by the DC-RMS or AC-RMS soft key.
Select the input coupling
Explanation
Input Coupling of the RMS Measurement
On the 701260 (HV (with RMS)) input module, you can select the RMS measurement
mode (AC-RMS or DC-RMS coupling) that displays the RMS value of the input signal in
addition to the waveform measurement mode (AC, DC, or GND coupling) that displays
the RMS value of the input signal.
For details on the RMS measurement, see page 2-11. For details on the input coupling
circuit of AC-RMS/DC-RMS, see page 2-8.
Notes When Measuring RMS Values
If an AC component that is less than 40 Hz is acquired in the RMS measurement mode,
ripples are produced as a result of the RMS conversion circuit characteristics, and
correct RMS values cannot be displayed. DC signals are correctly measured.
5-22
IM 701240-01E
1
5.14 Setting the Temperature Measurement
<For a description of this function, refer to page 2-12.>
2
Procedure
3
Selecting the Channel
1.
2.
Press CH.
Press one of the soft keys from CH1 to CH16 in which the 701261
(UNIVERSAL), 701262 (UNIVERSAL(AAF)), or 701265(TEMP/HPV)) is
installed.
4
For the displayed menus when this operation is executed, see section 5.1.
5
Horizontal and Vertical Axes
Selecting the Input Coupling of the Thermocouple
3.
6
Press the Coupling soft key to select TC.
Selecting the Thermocouple Type
4.
7
Press the Type soft key to select the thermocouple from K to Au7Fe.
8
Setting the Display Range
5.
6.
7.
Press the Upper soft key.
Turn the jog shuttle to set the upper limit.
Likewise, set Lower.
9
10
Selecting the Temperature Unit
8.
9.
Press the Next 1/2 soft key.
Press the Unit soft key to select °C or K.
11
Setting the RJC
10.
12
Press the RJC soft key to select OFF or ON.
Setting the Burnout
11.
13
Press the Burn Out soft key to select OFF or ON.
14
15
16
17
18
AC is not available on the 701265.
App
Index
IM 701240-01E
5-23
5.14 Setting the Temperature Measurement
Explanation
Thermocouple Type
Select the type to match the thermocouple that you are using.
Select the thermocouple type from the list below.
When the input terminal is open, the displayed value is set to a value less than or equal
to the lower limit of the measurement range.
Type
Measurement Range
K
E
J
T
L
U
R
S
B
N
W
Au7Fe
–200 to 1300°C
–200 to 800°C
–200 to 1100°C
–200 to 400°C
–200 to 900°C
–200 to 400°C
0 to 1700°C
0 to 1700°C
400 to 1800°C
0 to 1300°C
0 to 2300°C
0 to 300 K
Temperature Unit
Select the temperature unit from °C and K. The default setting is °C.
Displayed Range
To display the measured waveform, the upper and lower limits need to be set according
to the input.
Selectable Range
–5432 to 5432°C (resolution: 0.1°C)
–5432 to 5432 K (resolution: 0.1 K)
The minimum span is 2°C (or 2 K).
Reference Junction Compensation (RJC)
The SL1400 normally performs reference junction compensation with the built-in RJC
circuit when measuring temperature with the thermocouple. The SL1400 allows you to
turn ON or OFF the internal reference junction compensation.
Normally, turn it ON.
ON
Select this setting to enable the reference junction compensation by the internal RJC circuit.
OFF
Select this setting when checking the temperature measurement value or when using an external
reference junction (0 °C).
Note
If a voltage corresponding to a certain temperature t is applied at the input with the RJC turned
OFF and the measured temperature does not match temperature t, the instrument may be
damaged. In this happens, contact your nearest YOKOGAWA dealer.
Burnout
Specify the behavior when the thermocouple input detects a burnout. By default, this is
set to OFF.
ON
Fix the measured value to the upper limit of the measurement range of each thermocouple if a
burnout is detected.
OFF
Not detect burnouts.
5-24
IM 701240-01E
1
5.15 Setting the Strain Measurement
<For a description of this function, refer to page 2-12.>
2
Procedure
3
Selecting the Channel
1.
2.
Press CH.
Press one of the soft keys from CH1 to CH16 in which the 701270
(STRAIN_NDIS) or 701271 (STRAIN_DSUB) is installed.
4
For the displayed menus when this operation is executed, see section 5.1.
5
Selecting the Measurement Range
Press the Range Unit soft key, and then press the µSTR (the unit of strain) or
mV/V (the unit of the output value of the strain gauge transducer) soft key.
Note
Be sure to execute balancing when you change the measurement range.
Turn the jog shuttle to select the Range from 500µSTR to 20000µSTR.
8
If mV/V Is Selected
4.
6
7
If µSTR Is Selected
4.
Horizontal and Vertical Axes
3.
Turn the jog shuttle to select the Range from 0.25 mV/V to 10 mV/V.
9
Note
If the range unit is set to mV/V, a numeric value is displayed at the right side of the range
display. This value is the maximum input at the current bridge voltage converted to volts. It
indicates the maximum input voltage at the selected range.
10
11
Setting the Display Range
5.
6.
7.
12
Press the Upper/Lower soft key to set the jog shuttle control to Upper.
Turn the jog shuttle to set the upper limit.
Likewise, set Lower.
13
Note
Pressing RESET sets the maximum and minimum values of the measurement range to the
upper and lower limits.
14
When Range
Unit is µSTR
15
When Range
Unit is mV/V
16
17
18
App
Index
IM 701240-01E
5-25
5.15 Setting the Strain Measurement
Setting the Gauge Factor
8.
Press the Excitation/Gauge Factor soft key to set the jog shuttle control to
Gauge Factor.
Turn the jog shuttle to set the gauge factor in the range of 1.90 to 2.20.
9.
Selecting the Bridge Voltage
10.
11.
Press the Excitation/Gauge Factor soft key.
Press the 2V, 5V, or 10V soft key to select the Excitation (bridge voltage).
Note
•
•
The bridge voltage can be set to 5 V or 10 V only when the following conditions are met.
• When the bridge resistance is 350 Ω or more.
• When the strain gauge transducer supports the bridge voltage of 5 V or 10 V.
Be sure to execute balancing when you change the bridge voltage.
Executing Balancing
12.
Press the Balance soft key. Balancing is executed.
Note
Perform balancing by connecting a bridge box or strain gauge transducer and without applying a
load to the strain gauge.
Setting the Bandwidth, Linear Scaling, and Waveform Label
For the setup procedure of bandwidth, linear scale, and waveform label, see section 5.7,
5.11, and 8.10, respectively.
5-26
IM 701240-01E
5.15 Setting the Strain Measurement
1
Executing Shunt Calibration (only on the 701271 (STRAIN_DSUB))
To execute shunt calibration, the strain corresponding to the shunt resistor to be used
must be calculated in advance. For the calculation procedure, see appendices 9 and 10.
Be sure to execute balancing before executing shunt calibration.
13.
14.
15.
2
3
Press the Next 1/2 soft key.
Press the Linear Scale soft key. A Linear Scale setup dialog box appears.
Use jog shuttle+SELECT to set the Mode to Shunt.
4
Reading the Connected Shunt Resistance and Calibrating
16.
18.
For the procedure to set the character string of the unit, see section 4.2.
19.
5
Horizontal and Vertical Axes
17.
Use jog shuttle+SELECT to set a strain corresponding to the calculated shunt
resistance in P2:Y.
Use jog shuttle+SELECT to select Shunt Cal. Then, press Exec to read the
current input value into P2:X.
Enter the Unit as necessary.
6
7
If the Display Type is set to Floating, set the Decimal Number and SubUnit
values.
8
9
10
11
12
Note
•
•
•
•
•
In a normal shunt calibration, set only P2:Y (P1:Y is 0).
Scale the strain value using a shunt resistor. P1:X is the input value when a shunt resistor is
not connected. P1:Y is the strain value corresponding to P1:X. P2:X is the input value when a
shunt resistor is connected. P2:Y is the strain value corresponding to the shunt resistance.
The line connecting points P1 and P2 is used to perform scaling.
When Shunt Cal Exec is executed, the relay circuit for shunt calibration built into the strain
module is turned ON/OFF to automatically set P1:X and P2:X to the input value when the
shunt resistor is connected and the input value when the shunt resistor is not connected,
respectively.
If you change P1:X, P1:Y, P2:X, or P2:Y, the linear scaling setting is also changed.
Executing Shunt Cal changes P1:X and P2:X to the current input values.
13
14
15
16
17
Inverting the Waveforms
For details on the inverted display, see section 5.12.
18
App
Index
IM 701240-01E
5-27
5.15 Setting the Strain Measurement
Explanation
Range Unit
The unit can be changed between “the strain unit (×10–6 strain): µSTR” and “the output
unit of the strain gauge transducer: mV/V.” The default value is µSTR. The following
equation is used to derive the mV/V range.
mV/V = 0.5×(µSTR/1000)
Range
Select from the following:
If µSTR Is Selected
500 µSTR, 1000 µSTR, 2000 µSTR, 5000 µSTR, 10000 µSTR, or 20000 µSTR
For the measurement range, see section 18.12.
If mV/V Is Selected
0.25 mV/V, 0.5 mV/V, 1 mV/V, 2.5 mV/V, 5 mV/V, or 10 mV/V
For the measurement range, see section 18.12.
The value that is indicated at the right side of the range display is the maximum input
at the current bridge voltage converted to volts. It indicates the maximum input voltage
at the selected range.
Display Range (Upper/Lower)
You can change the upper and lower limits of the display range according to the input for
easier viewing of the measured waveforms.
Selectable range: –3.0000E+04 to +3.0000E+04 (when set to µSTR)
–1.5000E+01 to +1.5000E+01 (when set to mV/V)
Be sure the upper limit value (Upper) is greater than the lower limit value (Lower).
Bridge Voltage (Excitation)
You can select the voltage to be applied to the bridge head.
• 2V:
When the bridge head resistance (bridge resistance) is 120 Ω to 1000 Ω
• 5V*:
When the bridge resistance is 350 Ω to 1000 Ω
• 10V*: When the bridge resistance is 350 Ω to 1000 Ω
The bridge voltage cannot be changed while waveform acquisition is in progress.
*
The bridge voltage can be set to 5 V or 10 V only when the following conditions are met.
• The bridge resistance is greater than or equal to 350 Ω.
• Strain gauge transducer that supports the bridge voltage of 5 V or 10 V.
Gauge Factor
You can set the gauge factor of the strain gauge.
Selectable range: 1.90 to 2.20 (the resolution is 0.01)
The gauge factor is a unique constant defined for the strain gauge. It is usually described
in the manual for the strain gauge. The gauge factor cannot be changed while waveform
acquisition is in progress.
Gauge Factor (K) If mV/V Is Selected
You can set the gauge factor to an arbitrary value on the SL1400. However, if there are
no specifications on the strain gauge transducer, set the gauge factor to 2.00. If the
gauge factor is not 2.00, e is derived within the SL1400 using the following equation.
e = (4/K)×(V/E)
e:
Measured value of the strain gauge transducer [mV/V]
V:
Voltage measured on the bridge [V]
E:
Voltage applied to the bridge [V]
K:
Gauge factor
5-28
IM 701240-01E
5.15 Setting the Strain Measurement
1
Bandwidth Limit
See section 5.7.
2
Executing Balancing
Balancing automatically compensates the unbalanced portion of the bridge resistance.
The execution of balancing takes a few seconds.
Executable range of balancing: ±10000 µSTR (when set to µSTR)
±5 mV/V (when set to mV/V)
Inverting the Waveforms
3
4
5
See section 5.12.
Horizontal and Vertical Axes
Precautions to Be Taken When Making Strain Measurements
6
• Be sure to execute balancing when measuring the strain.
• Select a bridge voltage of 5 V or 10 V when the bridge resistance is greater than or
equal to 350 Ω. If a bridge voltage of 5 V or 10 V is applied when the bridge
resistance is less than 350 Ω, correct measurements will not be made.
• If using a strain gauge transducer, use a bridge voltage in the recommended voltage
range of the transducer.
• Correction cannot be executed if a strain gauge bridge (bridge head) or a strain gauge
transducer is not connected to the channel on which balancing is to be executed.
• If balancing fails on any of the specified channels, an error message and information
on the failed channel is displayed.
• If the power is turned ON, a new strain gauge is connected, or the measurement
range, bridge voltage, or gauge factor is changed, balancing must be performed again
before making measurements.
The scale value indicates “imbalance” immediately after power-up or when the range
is changed. If this indication is showing, execute balancing.
• If you switch the unit, the unit of all related parameters of the channel is switched
accordingly (upper and lower limits, trigger level, measured values of automated
measurement parameters, cursor measurement values, etc.).
7
8
9
10
11
12
13
14
15
16
17
18
App
Index
IM 701240-01E
5-29
5.15 Setting the Strain Measurement
Shunt Calibration (Only on the 701271(STRAIN_DSUB))
Shunt calibration is used to correct the gain of strain measurements by inserting a known
resistance (shunt calibration resistance (shunt resistance)) in parallel with the strain
gauge. It is a type of scaling. The Strain Module (701271(STRAIN_DSUB) supports
shunt calibration and has a built-in relay circuit for shunt calibration. To execute shunt
calibration, a bridge head that supports shunt calibration (701957/701958) is needed.
• When correcting the gain on the negative side
(normal)
• When correcting the gain on the positive side
(normal)
Shunt calibration relay circuit
(Turns ON/OFF automatically when shunt calibration
that is built into the strain module is executed.)
Shunt calibration relay circuit
(Turns ON/OFF automatically when shunt calibration
that is built into the strain module is executed.)
Shunt resistor, when correcting
the positive side
Shunt resistor(Applied
to the bridge head)
Bridge+
Bridge+
120 Ω
120 Ω
In+
In-
120 Ω
120 Ω
In+
Bridge
voltage
In-
120 Ω
120 Ω
Bridge-
Bridge
voltage
Bridge-
In addition to the normal shunt calibration (when the shunt calibration relay circuit is ON),
the SL1400 allows the setting of a zero point when the relay circuit is OFF. This function
is effective when the strain value is not 0 after the execution of balancing.
P1:X
If (Shunt Cal) Exec is executed, the input value when the relay circuit is OFF is applied.
P1:Y
Sets the value (usually 0) when the relay circuit is OFF.
P2:X
If (Shunt Cal) Exec is executed when the relay circuit is ON, the input value when the
relay circuit is ON is applied.
P2:Y
Set the strain value corresponding to the shunt resistance when the relay circuit is ON.
• Shunt calibration
After execution
Gain is corrected.
Strain
Before execution
Current measured
value*
P2:X
Strain input
P2:Y
The strain value corresponding to the shunt
resistor is set to P2:Y of the setup menu.
* Automatically obtained when shunt calibration is executed.
For details on shunt calibration, see appendix 10.
Note
•
•
5-30
When executing shunt calibration, select an appropriate range so that the measured values
do not exceed the range when the shunt calibration relay circuit is ON. The SL1400 attempts
shunt calibration within the current specified range.
If shunt calibration fails (the measured value exceeds the range, for example), an error
message is displayed. If this happens, change the range and execute shunt calibration again.
IM 701240-01E
1
5.16 Setting the Acceleration Measurement
<For a description of this function, refer to page 2-13.>
2
CAUTION
3
Before connecting the acceleration sensor, check that the bias current to the
sensor is OFF (see step 9 below). If you connect the acceleration sensor with
the bias current turned ON, damage may occur to the internal circuitry of the
acceleration sensor.
4
5
Horizontal and Vertical Axes
Procedure
Selecting the Channel
1.
2.
6
Press CH.
Press one of the soft keys from CH1 to CH16 in which the 701275 (ACCL/
VOLT) is installed.
7
For the displayed menus when this operation is executed, see section 5.1.
Selecting the Input Coupling of the Acceleration
3.
8
Press the Coupling soft key followed by the ACCL soft key.
Setting the Gain
4.
9
Press the Gain soft key and select a value in the range of ×0.1 to ×100.
Setting the Sensitivity
5.
6.
7.
10
Press the Next 1/2 soft key.
Press the Sensitivity soft key.
Turn the jog shuttle to set the sensitivity of the acceleration sensor in the range
of 0.10 mV/Unit to 2000.00 mV/Unit.
11
12
Setting the Unit
2
The default unit is m/s . Change it as necessary.
8.
Press the Unit soft key to display a software keyboard, and enter the unit
according to the procedure given in section 4.2.
13
14
Connecting Acceleration Sensors
9.
10.
Press the Bias soft key to select OFF.
Connect the acceleration sensor according to the explanation given in section
3.13.
Setting the Bias Current Supply
11.
15
16
Press the Bias soft key to select ON.
17
18
App
Index
IM 701240-01E
5-31
5.16 Setting the Acceleration Measurement
Setting the Bandwidth Limit and Waveform Label
For the setup procedure of the bandwidth limit, see section 5.7. For the setup procedure
of the waveform label, see section 8.10.
Explanation
Gain
Set the ratio of the output signal with respect to the input signal in the range of ×0.1 to
×100.
The default value is ×1.
Sensitivity
Set the sensitivity of the acceleration sensor in the range of 0.10 mV/Unit to 2000.00 mV/
Unit.
Unit
Set the unit of the acceleration to be displayed on the screen using up to 4 characters.
The default setting is m/s2. Change the unit as necessary.
Up to 8 character strings assigned to the unit are stored. The stored strings can be
recalled using the soft key. In addition, the stored strings can be used on the
acceleration modules of other channels. This function is useful when you are assigning
the same unit to multiple channels. The stored strings held even when the power is
turned OFF.
Bias Current Supply to the Acceleration Sensor
When Bias is turned ON, a 4-mA bias current is supplied to the acceleration sensor. Do
not connect the acceleration sensor with Bias turned ON.
Bandwidth Limit
See section 5.7.
5-32
IM 701240-01E
5.17 Setting the Frequency (Number of Rotations, Period,
Duty Cycle, Power Supply Frequency, Pulse Width,
Pulse Integration, and Velocity) Measurement
<For a description of this function, refer to page 2-13.>
Procedure
1
2
3
Selecting the Channel
1.
2.
Press CH.
Press one of the soft keys from CH1 to CH16 in which the 701280 (FREQ) is
installed.
For the displayed menus when this operation is executed, see section 5.1.
3.
4.
6
Press the Input Setup soft key. A setup dialog box opens.
Use jog shuttle+SELECT to select a preset according to the type of signal
applied to the frequency module.
•
•
5
Horizontal and Vertical Axes
Selecting the Preset
4
7
If you select a preset (Logic 5V to EM Pickup), the input is set to a value appropriate for
the signal. (You need to set a portion of the items.)
If you select User (user-defined), all the setup items can be set arbitrarily. For a
description of the setup items, see the next page.
8
9
10
11
12
13
Typical Applications and Signal Examples of the Presets
Preset
Application and Signal Example
Logic 5V
5-V logic signal, 5-V output sensor, and sensor with TTL output
Logic 3V
3-V logic signal and 3-V output sensor
Logic 12V
12-V driven relay/sequence circuit and 12-V driven sensor
Logic 24V
24-V driven relay/sequence circuit and 24-V driven sensor
14
15
Pull-up 5V
Open-collector output sensor and contact circuit
ZeroCross
Sensor/Encoder that outputs positive and negative voltages and sensor that
outputs sine waves
AC100V
When measuring a supply voltage of 100 VAC using the isolated probe (700929)
AC200V
When measuring a supply voltage of 200 VAC using the isolated probe (700929)
EM Pickup
Power-generating electromagnetic pickup
16
17
18
App
Index
IM 701240-01E
5-33
5.17 Setting the Frequency (Number of Rotations, Period, Duty Cycle, Power Supply Frequency, Pulse
Width, Pulse Integration, and Velocity) Measurement
Setting the Input Conditions
5.
As necessary, use jog shuttle+SELECT to set the items of the preset (Logic 5V
to EM Pickup) that you selected in step 4. If you select User (user-defined), all
the setup items can be set arbitrarily.
Voltage range
Input coupling
Probe type
Bandwidth limit
Threshold level
Hysteresis
Slope
Chatter elimination time
The Pull Up setup menu appears only
when you set the preset to Pull-up 5 V.
Selecting the Measurement Item
6.
7.
8.
Press the FV Setup soft key. A setup dialog box opens.
Use jog shuttle+SELECT to select Function.
Use jog shuttle+SELECT to select the measurement item.
For the setup procedure of the selected measurement item, see the pages indicated
below.
• Frequency → Page 5-35
• Revolution (rpm) → Page 5-35
• Revolution (rps) → Page 5-35
• Period → Page 5-36
• Duty cycle → Page 5-36
• Power frequency → Page 5-37
• Pulse width → Page 5-37
• Pulse integration → Page 5-38
• Velocity → Page 5-38
Note
The Range unit and Offset unit are linked to the unit of the measurement item selected in step 8.
For the procedure to set the offset, see section 5.10.
5-34
IM 701240-01E
5.17 Setting the Frequency (Number of Rotations, Period, Duty Cycle, Power Supply Frequency, Pulse Width,
Pulse Integration, and Velocity) Measurement
1
Frequency
The procedure after selecting Frequency in step 8 on page 5-34 is explained below.
9.
2
As necessary, use jog shuttle+SELECT to enter the smoothing filter, pulse
average, deceleration prediction, and stop prediction.
3
4
Smoothing filter
Moving average order of smoothing
Pulse average
Pulse average count
Deceleration prediction
5
6
Setting the Measurement Range
10.
Horizontal and Vertical Axes
Stop prediction
Turn the RANGE knob to set the measurement range.
You can also set the measurement range by pressing the Range soft key and turning the
jog shuttle.
7
8
RPMs/RPSs
The procedure after selecting Revolution (rpm) or Revolution (rps) in step 8 on page 534 is explained below.
9.
10.
Use jog shuttle+SELECT to set the number of pulse per rotation (Pulse/
Rotate).
As necessary, use jog shuttle+SELECT to enter the smoothing filter, pulse
average, deceleration prediction, and stop prediction.
9
10
11
Number of pulses per rotation
12
Smoothing filter
Moving average order of smoothing
Pulse average
Pulse average count
Deceleration prediction
13
Stop prediction
14
Setting the Measurement Range
11.
Turn the RANGE knob to set the measurement range.
You can also set the measurement range by pressing the Range soft key and turning the
jog shuttle.
15
16
17
18
App
Index
IM 701240-01E
5-35
5.17 Setting the Frequency (Number of Rotations, Period, Duty Cycle, Power Supply Frequency, Pulse
Width, Pulse Integration, and Velocity) Measurement
Period
The procedure after selecting Period in step 8 on page 5-34 is explained below.
9.
As necessary, use jog shuttle+SELECT to enter the smoothing filter, pulse
average, deceleration prediction, and stop prediction.
Smoothing filter
Moving average order of smoothing
Pulse average
Pulse average count
Deceleration prediction
Stop prediction
Setting the Measurement Range
10.
Turn the RANGE knob to set the measurement range.
You can also set the measurement range by pressing the Range soft key and turning the
jog shuttle.
Duty Cycle
The procedure after selecting Duty in step 8 on page 5-34 is explained below.
9.
10.
Use jog shuttle+SELECT to select the polarity of the pulse to be measured
(Measure Pulse).
As necessary, use jog shuttle+SELECT to set the smoothing filter.
Polarity of the measured pulse
Smoothing filter
Moving average order of smoothing
Setting the Measurement Range
11.
Turn the RANGE knob to set the measurement range.
You can also set the measurement range by pressing the Range soft key and turning the
jog shuttle.
5-36
IM 701240-01E
5.17 Setting the Frequency (Number of Rotations, Period, Duty Cycle, Power Supply Frequency, Pulse Width,
Pulse Integration, and Velocity) Measurement
1
Power Supply Frequency
The procedure after selecting Power Freq. in step 8 on page 5-34 is explained below.
9.
10.
Use jog shuttle+SELECT to select the center frequency of the power supply.
As necessary, use jog shuttle+SELECT to set the smoothing filter and pulse
average.
2
3
4
Center value of the power frequency
Smoothing filter
Moving average order of smoothing
Pulse average
Pulse average count
5
Horizontal and Vertical Axes
6
Setting the Measurement Range
11.
7
Turn the RANGE knob to set the measurement range.
You can also set the measurement range by pressing the Range soft key and turning the
jog shuttle.
Pulse Width
8
9
The procedure after selecting Pulse Width in step 5 on page 5-32 is explained below.
9.
10.
Use jog shuttle+SELECT to select the polarity of the pulse to be measured
(Measure Pulse).
As necessary, use jog shuttle+SELECT to set the smoothing filter.
10
11
Polarity of the measured pulse
12
Smoothing filter
Moving average order of smoothing
13
14
Setting the Measurement Range
11.
Turn the RANGE knob to set the measurement range.
You can also set the measurement range by pressing the Range soft key and turning the
jog shuttle.
15
16
17
18
App
Index
IM 701240-01E
5-37
5.17 Setting the Frequency (Number of Rotations, Period, Duty Cycle, Power Supply Frequency, Pulse
Width, Pulse Integration, and Velocity) Measurement
Pulse Integration
The procedure after selecting Pulse Integ in step 8 on page 5-34 is explained below.
9.
10.
Use jog shuttle+SELECT to set the physical amount per pulse (Unit/Pulse).
Use jog shuttle+SELECT to select the method for resetting the integrated value
of the pulse count.
•
•
11.
Over Limit Reset: ON
Automatically resets the pulse count when the range is exceeded.
Over Limit Reset: OFF
You can manually reset the pulse count.
As necessary, use jog shuttle+SELECT to set the unit, smoothing filter, and
pulse average.
For the procedure to set the character string of the unit, see section 4.2.
Physical amount per pulse
Unit
Smoothing filter
Moving average order of smoothing
Pulse average
Pulse average count
Reset method of the pulse count
Manually reset the pulse count
Setting the Measurement Range
12.
Turn the RANGE knob to set the measurement range.
You can also set the measurement range by pressing the Range soft key and turning the
jog shuttle.
Velocity
The procedure after selecting Velocity in step 8 on page 5-34 is explained below.
9.
10.
11.
Use jog shuttle+SELECT to set the distance per pulse.
Use jog shuttle+SELECT to select the time unit for calculating the velocity.
As necessary, use jog shuttle+SELECT to set the unit, smoothing filter, pulse
average, deceleration prediction, and stop prediction.
For the procedure to set the character string of the unit, see section 4.2.
Distance per pulse
Time unit and unit
Smoothing filter
Moving average order of smoothing
Pulse average
Pulse average count
Deceleration prediction
Stop prediction
Setting the Measurement Range
12.
Turn the RANGE knob to set the measurement range.
You can also set the measurement range by pressing the Range soft key and turning the
jog shuttle.
5-38
IM 701240-01E
5.17 Setting the Frequency (Number of Rotations, Period, Duty Cycle, Power Supply Frequency, Pulse Width,
Pulse Integration, and Velocity) Measurement
1
Explanation
Preset
• When you select a preset, settings appropriate for each signal are set automatically.
(You need to set a portion of the items.)
• The 10 presets below are available. For details on the settings of each preset, see
appendix 12.
Logic 5V, Logic 3V, Logic 12V, and Logic 24V
Use this preset when the output from the sensor changes in the range of 0 to 5 V (or 3 V, 12 V,
or 24 V: supply voltage applied to the sensor). The voltage range is automatically set to the
optimum voltage range, and the threshold level is automatically set to one-half the voltage.
ZeroCross
Use this preset when the input voltage changes around 0 V. The input coupling is automatically
set to AC, and the threshold level is automatically set to 0 V. Select the voltage range so that the
maximum amplitude of the input voltage is within the voltage range.
AC100V and AC200V
Use this preset when measuring the supply voltage of 100-V or 200-V power supply systems.
The probe type is automatically set to 10:1; the voltage range is automatically set to a value
suitable for the input voltage and probe factor; and the coupling is automatically set to AC. Be
sure to use the isolated probe (700929) when measuring the power supply voltage.
EM Pickup (Electromagnetic Pickup)
Use this preset when connecting the electromagnetic pickup directly. The voltage range is
automatically set to ±1 V, and the threshold level is automatically set to 0 V.
•
•
•
5
6
7
8
9
11
Note
•
•
4
10
User (User-Defined)
Use this preset when entering the input conditions arbitrarily. Pull-up cannot be specified.
•
3
Horizontal and Vertical Axes
Pull-up 5V
Use this preset when the sensor output is open collector or contact output. The pull-up setting on
the next page can be specified only when this preset is selected. The pull-up voltage is
approximately 5 V, and the pull-up resistor is 4.7 kΩ. If you turn pull-up ON, set the input voltage
in the range of 0 V to 5 V. If the input voltage exceeds this range, the protection circuit is tripped
and the pull-up resistor is automatically cut off.
2
When measuring high voltage exceeding 42 V (AC+DCpeak) on the 701280 (FREQ), be sure
to use the isolated probe (700929).
Use EM Pickup only when connecting the electromagnetic pickup.
When set to EM Pickup, the LEDs of the frequency module do not illuminate in red even
when the range is exceeded.
The SL1400 does not support electromagnetic pickups that require power supply or those
that require terminators at the output. For these types of electromagnetic pickup, furnish
appropriate measures on the sensor end.
The output from the electromagnetic pickup must be within 42 VP-P. The minimum sensitivity
is 0.2 VP-P. If the output is less than the minimum sensitivity, the measured values may be
unstable.
When using the pull-up function, do not let the voltage exceed the 0 to 5 V range. If the
voltage exceeds the range, the protection circuit will be tripped, and the pull-up circuit will be
cut off.
12
13
14
15
16
17
18
App
Index
IM 701240-01E
5-39
5.17 Setting the Frequency (Number of Rotations, Period, Duty Cycle, Power Supply Frequency, Pulse
Width, Pulse Integration, and Velocity) Measurement
Input Conditions
The following nine input conditions are available.
Voltage Range (V Range)
• Select the voltage range (±FS) from the following:
• When the probe attenuation is set to 1:1
±1 V, ±2 V, ±5 V, ±10 V, ±20 V, or ±50 V (±FS)
• When the probe attenuation is set to 10:1
±10 V, ±20 V, ±50 V, ±100 V, ±200 V, or ±500 V (±FS)
• You can change the setting only when you select the ZeroCross or User preset.
Coupling
• Set the input coupling to DC or AC.
• The setting is the same as with the input coupling of other modules. See the functional
explanation given in “Input Coupling” on page 2-8 and the explanation given in section 5.5.
• You can change the setting only when you select the User preset.
Probe Type
• Set the probe attenuation to 1:1 or 10:1.
• The setting is the same as with the probe of other modules. See the functional explanation
given in “Probe attenuation or current-to-voltage conversion ratio” on page 2-9 and the
explanation given in section 5.6.
• You can change the setting only when you select the Logic 5V (3V/12V/24V), Pull-up 5V,
ZeroCross, or User preset.
Bandwidth Limit
• Select the bandwidth limit from 100 Hz, 1 kHz, 10 kHz, 100 kHz, and Full.
• You cannot select Full if you select the AC100V or AC200V preset.
• You can change the setting on all presets.
Threshold Level
• Set the threshold level within the voltage range. The resolution is a value corresponding to
1% of FS.
• You can change the setting only when you select the User preset.
Hys (Hysteresis)
• Select the hysteresis from ±1%, ±2.5%, and ±5% of the voltage range.
• You can change the setting on all presets.
Slope
• Set the slope to
(rising) or
(falling).
• You can change the setting only when you select the Logic 5V (3V/12V/24V), Pull-up 5V, or
User preset.
Chatter Elimination
Eliminates the chatter that occurs such when the contact is turned ON/OFF. The changes in the
signal (chattering) over the specified time can be discarded.
• Set the chatter elimination time in the range of 0 to 1000 ms (1-ms resolution). If 0 ms is
selected, the chatter elimination function is turned OFF.
• Chatter elimination is effective against both the rising and falling signals.
• You can change the setting on all presets.
Pull Up
• You can turn ON/OFF pull-up only when you select the Pull-up 5V preset. Pull-up is not
possible in other presets.
• When using pull-up, set the input voltage in the range of 0 to 5 V. If a voltage exceeding this
range is applied, the internal protection circuit will cut off the pull-up circuit.
Internal equivalent circuit when using pull-up
+ 5V
4.7 kΩ
990 kΩ
10 kΩ
5-40
IM 701240-01E
5.17 Setting the Frequency (Number of Rotations, Period, Duty Cycle, Power Supply Frequency, Pulse Width,
Pulse Integration, and Velocity) Measurement
1
Measurement Items (Functions)
The following nine measurement items are available.
2
Frequency
Frequency (Hz) = 1/Tw (s)
Measurable range: 0.01 Hz to 200 kHz
Tw (s)
3
Period
Period (s) = Tw (s)
Measurable range: 5 µs to 50 s
Duty
Duty cycle (%) = Thigh (s)/Tw (s)
Or, duty cycle (%) = Tlow (s)/Tw (s)
Measuring range: 0 to 100%
Pulse Width
Pulse width (s) = Thigh (s)
or pulse width (s) = Tlow (s)
Measurable range: 2 µs to 50 s
Velocity
Velocity (km/h) = Distance per pulse l (km)/Tw (s) × 3600
Velocity (m/s) = Distance per pulse l (m)/Tw (s)
The distance and unit can be user defined (angular velocity, etc.).
Measurable range: F (=1/Tw) = 0.01 Hz to 200 kHz
5
6
Tw (s)
Thigh (s) Tlow (s)
7
Thigh (s) Tlow (s)
8
Power Supply Frequency
Power supply frequency (Hz) = 1/Tw (s)
Resolution 0.01 Hz
Measurable range: (50 Hz, 60 Hz, or 400 Hz) ± 20 Hz
Pulse Integration (Distance/Flow Rate)
Pulse integrated value = N (count) × physical amount per pulse (I)
Set the physical amount per pulse (I) to distance or flow rate.
A suitable user-defined unit can be assigned to the specified
physical amount.
Measurable range: Up to 2×10⁹ count
4
Horizontal and Vertical Axes
RPMs/RPSs
F (Hz)
• RPMs = Frequency (Hz)/the number of pulses per rotation (Nr) × 60
Measurable range: 0.01 to 100000 rpm
Nr: The number
• RPSs = Frequency (Hz)/the number of pulses per rotation (Nr)
of pulses per
Measurable range: 0.001 to 2000 rps
rotation
Tw (s)
9
10
N (count)
l
11
Tw (s)
Distance per
pulse (l)
12
13
14
15
16
17
18
App
Index
IM 701240-01E
5-41
5.17 Setting the Frequency (Number of Rotations, Period, Duty Cycle, Power Supply Frequency, Pulse
Width, Pulse Integration, and Velocity) Measurement
Setup Items for Each Measurement Item
Number of Rotations
Pulse/Rotation (Pulse/Rotate)
Set the number of pulses per rotation in the range of 1 to 99999 pulses.
Duty Cycle or Pulse Width
Measure Pulse
Set the polarity of the pulse to be measured to positive or negative.
• Duty
Positive: Measures the ratio of the positive pulses.
Negative: Measures the ratio of the negative pulses.
• Pulse Width
Positive: Measures the width of the positive pulse.
Negative: Measures the width of the negative pulse.
• When Positive is selected
Tp
Ta
Tb
• When Negative is selected
Tp
Pulse width:
Measures the width of Tp
Duty:
Measures Ta/Tb
Ta
Tb
Pulse width:
Measures the width of Tp
Duty:
Measures Ta/Tb
Precautions to Be Taken When Measuring the Duty Cycle
The output is set to 0% or 100% when either of the conditions below is met when measuring
the duty cycle.
• When there is no pulse input after a time equal to 4 times the period (T) of the pulse that
was input immediately before.
• When there is no pulse input for 20 s.
When the polarity is set to Positive, the output is set to 0% when the pulse input is low when the
condition is met and 100% when the pulse input is high. When the polarity is set to Negative, the
output is set to 0% when the pulse input is high when the condition is met and 100% when the
pulse input is low.
T: Pulse period
The output is set to 0% when a time equal to
T × 4 or 20 s elapses after the last pulse was input.
Status when the condition is met: Low
0% (when the polarity is positive)
Power Supply Frequency
Center Frequency
Set the center value of the power supply frequency to 50 Hz, 60 Hz, or 400 Hz.
Pulse Integration
Unit/Pulse
Set the physical amount per pulse in the range of –9.9999E+30 to 9.9999E+30.
Over Limit Reset
Select ON to reset the pulse count automatically when the range is exceeded. Select OFF to not
reset the pulse count. The default setting is OFF.
Executing Manual Reset
To reset the pulse count manually, select Exec.
Unit
As necessary, enter the unit of pulse integration to be displayed on the screen using up to 4
characters.
5-42
IM 701240-01E
5.17 Setting the Frequency (Number of Rotations, Period, Duty Cycle, Power Supply Frequency, Pulse Width,
Pulse Integration, and Velocity) Measurement
1
Velocity
Distance/Pulse
Set the distance per pulse in the range of –9.9999E+30 to 9.9999E+30.
2
Time Unit
Set the time unit to hour, min, or sec.
The output is automatically converted to a velocity with respect to the specified time.
Unit
Set the unit of the velocity to be displayed on the screen using up to 4 characters. The default
setting is m/s.
3
4
Filter
Smoothing
Set the moving average order of smoothing in the range of 0.0 to 1000.0 ms.
5
Horizontal and Vertical Axes
Computation such as smoothing filter and pulse average can be performed depending
on the measurement item.
6
Pulse Average
Set the number of times to perform pulse average in the range of 1 to 4096.
7
Deceleration Prediction
ON
Automatically computes and predicts the deceleration curve from the time elapsed since the
stopping of the pulse.
8
OFF
Disables deceleration prediction.
9
Stop Prediction
10
Set the time from the point when the pulse input stops to the point when the function
determines that the object has stopped.
The time can be set to ×1.5, ×2, ×3, ... , ×9, and ×10 (10 settings) of the pulse period (T)
of the pulse one period before the pulse input stopped. If you select OFF, stop prediction
is not performed.
11
12
13
14
15
16
17
18
App
Index
IM 701240-01E
5-43
5.18 Setting Logic Waveforms
<For a description of this function, refer to page 2-16.>
Procedure
Selecting the Channel
1.
2.
Press CH.
Press the Logic A or Logic B soft key.
For the displayed menus when this operation is executed, see section 5.1.
Selecting the Input Signal Type
3.
4.
5.
Press the Probe soft key. The logic probe selection menu appears.
Press one of the soft keys from 700986 to 702912 to select the type of logic
probe that is connected.
If you select 702911 or 702912 for the logic probe, select the input signal type.
Only when the logic probe is set
to 702911 or 702912
Setting the Bit Display
6.
7.
8.
Press the Next 1/2 soft key.
Press the Display Bits soft key. The bit display ON/OFF dialog box appears.
Use jog shuttle+SELECT to turn the bit display ON/OFF.
You can turn ON all items at once by selecting All ON.
You can turn OFF all items at once by selecting All OFF.
9.
10.
11.
5-44
Press the Bit Label soft key. The bit label setting dialog box appears.
Use jog shuttle+SELECT to set the bit label according to the procedure given
in section 4.2.
Press the Bit Mapping soft key to select how to assign the bit display. Select
Fixed or Auto.
IM 701240-01E
5.18 Setting Logic Waveforms
1
Explanation
Types of Logic Probes
2
Select the logic probe from 700986, 700987, 702911, and 702912.
Input Signal Type
3
If the logic probe is 702911 or 702912, select the input signal type.
TTL
TTL level voltage signal:
Indicates 1 at a voltage greater than equal to approximately 1.4 V.
CONT
Voltage-free contact signal:
Indicates 1 when signal is shorted to the earth line.
4
5
Horizontal and Vertical Axes
Bit Display ON/OFF (Display Bits)
You can specify whether to display the waveform for each bit.
6
Bit Label
Alphanumeric characters that can be entered: Up to 8 characters
7
Bit Mapping
8
Fixed
A space is allocated for bits that are turned OFF.
9
Auto
A space is not allocated for bits that are turned OFF.
Only the bits that are turned ON are displayed in order from the top.
10
Example When Bit 7 of Logic A is OFF
Fixed
Auto
A1
A1
A2
A2
A3
A3
A4
A4
A5
A5
A6
A6
11
12
13
A8
14
A8
Note
If you are observing the logic channel waveforms measured on the SL1400 using a software
application such as XViewer or if you are reading the logic channel data using the WAVeform
communication command, set the logic probe type of both LogicA and LogicB the same. If they
are not the same, correct waveforms may not be displayed or correct data may not be output.
15
16
17
18
App
Index
IM 701240-01E
5-45
5.19 Entering Settings on the All Channel Menu
Procedure
Displaying the All Channel Menu
1.
2.
3.
Press ALL CH.
Press the Display, Range etc. or Lin-Scale, Unit etc. soft key. A setup list of
the vertical axis (excluding inversion, linear scale, and unit) or a setup list of
inversion, linear scaling, and unit is displayed.
Set each item.
•
•
Use jog shuttle+arrow keys to move the cursor.
Use jog shuttle+SELECT to set each item.
Setup list of the vertical axis
(excluding inversion, linear scaling, and unit)
Setup list of inversion, linear scaling, and unit
5-46
IM 701240-01E
5.19 Entering Settings on the All Channel Menu
Copying All the Settings of the Vertical Axis (Only to the Same Type of Modules)
2.
3.
4.
Press the Copy to Same Module soft key.
Use jog shuttle+SELECT to select the copy source.
Turn the jog shuttle to move the cursor to Exec and press SELECT. All the
settings of the vertical axis are copied only to the same type of modules.
1
2
3
4
5
Horizontal and Vertical Axes
6
7
Note
8
The waveform color and label are not copied.
9
Turning the Display of All Channels ON/OFF and Variable ON/OFF
2.
Select Display or Var. in the All line to select ON or OFF.
•
•
*
Use jog shuttle+arrow keys to move the cursor.
Use jog shuttle+SELECT to set each item.
Corresponds to the setting of the vertical zoom according to the upper and lower limits
of the display range for channels other than those in which a strain module is installed.
10
11
12
13
14
15
16
17
18
App
Index
IM 701240-01E
5-47
5.19 Entering Settings on the All Channel Menu
Executing Balancing When Measuring Strain
2.
3.
Press the Strain Balance soft key.
Use jog shuttle+SELECT to select the channel on which to execute balancing.
Select a channel in which a strain module is installed.
4.
Turn the jog shuttle to move the cursor to Exec and press SELECT. Balancing
is executed.
Explanation
You can display the setup menu of all the channels (excluding logic input) over the entire
screen to set the channels. The following items can be specified.
• Waveform color
• Display ON/OFF
• Measurement range
• Input coupling
• Bandwidth limit
• Probe attenuation or current-to-voltage conversion ratio
• Variable ON/OFF
• Zoom rate and vertical position (when Variable is OFF)
• Upper and lower limits of the display range (when Variable is ON)
• Linear scale
5-48
IM 701240-01E
1
5.20 Selecting the Time Base (Internal Clock or
External Clock)
<For a description of this function, refer to page 2-3.>
2
Procedure
1.
2.
3
Press MENU.
Press the ACQ soft key.
4
Selecting the Time Base
3.
4.
Press the Time Base soft key.
Press the Int or Ext soft key.
5
If you select Ext, the Pulse/Rotate menu appears.
Horizontal and Vertical Axes
6
7
8
9
10
If Time Base Is Set to Ext
Setting Pulse/Rotate
5.
6.
Press the Pulse/Rotate soft key.
Turn the jog shuttle to set the number of pulses of the external clock signal that
corresponds to one rotation (or one period).
11
12
13
14
15
Set the pulse/rotate
Note
Pressing RESET while the jog shuttle control is set to Pulse/Rotate sets the number of pulses to
1.
16
17
18
App
Index
IM 701240-01E
5-49
5.20 Selecting the Time Base (Internal Clock or External Clock)
Explanation
Time Base
Select from the following:
Int
Internal clock signal (the specified record time and sample rate are valid)
Ext
Clock signal applied to the external clock input terminal (the specified record time and sample
rate are valid)
If Ext Is Selected
Apply a clock signal of the following specifications to the TRIG OUT/EXT CLK IN
terminal (shared with the trigger output terminal) on the left side panel.
TRIG OUT/
EXT CLK IN
Item
Specifications
Connector type
Frequency range
Input level
Valid edge
Minimum pulse width
External clock frequency range
Rise/Fall time of the clock
RCA jack
See Note below
TTL (0 to 5 V)
Rising
400 ns or more for high and low
1 MHz maximum
2 µs or less
Note
•
The upper limit frequency of the external clock is as follows:
Input Module
Upper Limit Frequency
701250/701251/701255
701260/701270/701271/701275
701280
701261/701262
1 MHz
100 kHz
25 kHz
100 kHz when measuring voltage, 500 Hz when measuring
temperature
500 Hz
701265
•
If the external clock frequency exceeds the upper limit frequency of the module, sampling is
executed at the upper limit frequency.
Circuit Diagram and Timing Chart of the External Clock Input
+5 V
100 Ω
4.7 kW
LCX14 or equivalent
EXT CLK IN
100 pF
HC245 or equivalent
EXT TRIG OUT
1 µs or more
400 ns or
400 ns or
more
more
Sample edge
(Rising)
5-50
IM 701240-01E
5.20 Selecting the Time Base (Internal Clock or External Clock)
1
CAUTION
Applying a voltage exceeding the maximum allowable input voltage to the TRIG
OUT/EXT CLK IN terminal may damage the input section.
2
3
Pulse/Rotate
You can specify the number of pulses of the external signal that is to correspond to one
mechanical rotation (one cycle).
Range of the number of pulses: 1 to 24000
•
•
•
•
You cannot set the acquisition mode to envelope or box average.
You cannot display waveforms in roll mode.
No function is provided for frequency-dividing the clock signal.
Since the time axis setting cannot be changed, change the record length setting or
zoom in on the time axis if you want to change the display range of the time axis.
• The time measured by the cursor measurement or automated measurement of
waveform parameters is expressed in the number of pulses of the clock signal. No
unit is displayed.
• Realtime recording to the internal hard disk cannot be selected.
• The following trigger settings are invalid.
• Trigger delay
• Hold off
• B > Time, B < Time, and B Timeout trigger
• Period trigger
Maximum Sample Rate of Each Input Module
If the sample rate of the SL1400 is set higher than the maximum sample rate of the input
module, the data is updated only at the maximum sample rate of the input module.
Consequently, all of the data within the data update interval of the module are the same
data. The maximum sample rate of each input module is as follows:
Input Module
During Internal
Clock
During External
Clock
701250/701255:
10 MHz
1 MHz
701251:
1 MHz
1 MHz
701260/701270/701271/701275:
100 kHz
100 kHz
701261/701262 (when measuring voltage):
(when measuring temperature):
100 kHz
500 Hz
100 kHz
500 Hz
701280:
25 kHz
25 kHz
701265:
500 Hz
500 Hz
5
Horizontal and Vertical Axes
Notes When Sampling Using the External Clock Signal
4
6
7
8
9
10
11
12
13
14
15
16
17
18
App
Index
IM 701240-01E
5-51
Chapter 6
Triggering
6.1
1
Setting the Trigger Mode
<For a description of this function, refer to page 2-24.>
2
Procedure
1.
2.
3.
4.
5.
Press MENU.
Press the TRIGGER soft key.
Press the Mode soft key.
Press the soft key corresponding to the desired mode to set the trigger mode.
If you select Single(N), turn the jog shuttle to set the Single(N) Count.
3
4
5
6
Triggering
7
8
9
Explanation
Auto Mode
If the trigger condition is met within the 50-ms timeout period, the waveform is updated
on each trigger occurrence. If the trigger condition is not met after the timeout period
elapses, the waveform is automatically updated. If the time axis setting is in the range in
which the display mode is set to roll mode, the display is set to roll mode. However,
triggering operates in normal mode when using simple trigger with the trigger source set
to Time, even if auto mode is specified.
Auto Level Mode
11
12
13
Within the timeout period (approximately 1 s), the waveforms are displayed in the same
fashion as in the auto mode. If a trigger does not occur within the timeout period
(approximately 1 s), the center value of the amplitude of the trigger source is detected,
the trigger level is automatically changed to the center value, and the trigger is generated
to update the displayed waveform. The auto-level mode is valid only if the trigger is a
simple trigger and the trigger source is between CH1 and CH16. For all other cases, the
operation is the same as for auto mode.
If the time axis setting is in the range in which the display mode is set to roll mode, the
display is set to roll mode.
14
15
16
Normal Mode
17
The display is updated only when the trigger conditions are met. The display is not
updated if the trigger does not occur. Therefore, to check the waveform or ground level
when no trigger is detected, use auto mode.
18
App
Single Mode
When the trigger condition is met, the displayed waveforms are updated only once, and
acquisition stops. In the time axis setting range in which the display mode is set to roll
mode, the display is set to roll mode. When a trigger occurs, the specified record length
of data is acquired and the displayed waveform stops.
IM 701240-01E
10
6-1
Index
6.1 Setting the Trigger Mode
Single(N) Mode
When the trigger condition is met, the waveform is acquired the specified number of
times and stops. After waveform acquisition is finished, all the waveforms are displayed.
This mode is used when acquiring a waveform using the sequential store function.
Log Mode
In this mode, the trigger settings are disabled. The specified record length of data is
acquired once when acquisition is started, and the displayed waveforms are updated. If
the time axis setting is in the range in which the display mode is set to roll mode, the
display is set to roll mode.
Note
•
•
6-2
The trigger mode setting applies to both simple and enhanced triggers.
In Recorder mode (see chapter 9), select the trigger mode from Auto, Repeat, Single, and
Log. For details on the Repeat mode, see section 9.2.
IM 701240-01E
6.2
1
Setting the Trigger Position
<For a description of this function, refer to page 2-25.>
2
Procedure
1.
2.
3.
4.
3
Press MENU.
Press the TRIGGER soft key.
Press the Position soft key.
Turn the jog shuttle to set the trigger position. Pressing RESET resets the
value to 50%.
4
5
6
Triggering
7
8
9
Explanation
Trigger Position
10
Trigger position = Trigger point + trigger delay
You can select the location of the trigger position on the screen.
If the trigger delay is 0 s, the trigger position and the trigger point match.
11
T (Trigger position)
12
Delay
13
Trigger point
14
Selectable Range of the Trigger Position
With the display record length taken to be 100%, set in the range of 0 to 100% (in 0.1%
steps).
15
Displaying the Trigger Position
A position marker ( ) appears at the top of the screen. The marker indicates the trigger
position with respect to the display record length.
16
17
18
App
Index
IM 701240-01E
6-3
6.2 Setting the Trigger Position
Time Reference Mark
A ↓ mark is displayed at the time reference position of the acquisition data separately
from the trigger position.
• When Set to a Mode Other Than Roll Mode
Normally, the time reference point and the trigger position are displayed at the same
position, because they match.
If the waveform acquisition is stopped in the middle of the operation, the preset trigger position
and the actual trigger position (trigger point) are offset, because not all the data of the pretrigger section and post-trigger section have been acquired. In this case, the time reference
mark is offset from the trigger position mark, because it indicates the actual trigger point.
When the time reference mark is displayed
overlapped with the trigger position mark (
)
When the time reference mark is displayed
offset from the trigger position mark
Preset trigger position
Trigger point
Time from the
trigger point
Time from the trigger position
Pre-trigger
Post-trigger
• When Set to Roll Mode Display
If the trigger mode is set to Auto or Auto Level, the reference point is the point when
the waveform acquisition was stopped.
If the trigger mode is set to Log, the reference point is the point when the waveform
acquisition was started.
When trigger mode is set to Log
When trigger mode is set to Auto/Auto Level
Time reference point Time reference point
Time from the reference point
Time from the reference point
Notes for Setting the Trigger Position
• If you change the trigger position while waveform acquisition is stopped, the new setting
will not become effective until acquisition is started, and the waveform is updated.
• Note that cursor time measurements are with respect to the trigger position. Changing
the trigger position therefore changes the measurement values (except when in roll
mode display).
• If you change the record time, the time axis setting is rescaled with respect to the
trigger position.
6-4
IM 701240-01E
6.3
1
Setting the Trigger Delay
<For a description of this function, refer to page 2-25.>
2
Procedure
1.
2.
3.
4.
Press MENU.
Press the TRIGGER soft key.
Press the Delay soft key.
Turn the jog shuttle to set the trigger delay. Pressing RESET resets the value
to 0.0 µs.
3
4
5
6
Triggering
7
8
9
Explanation
Although the display usually shows the waveform before and after the trigger point, it is
possible to display the acquired waveform after a fixed time period elapses using the
delay function.
10
11
Selectable Range of the Trigger Delay
0 to 10 s (resolution: 0.1 µs)
12
T (Trigger position)
Delay
13
14
Trigger point
Notes for Setting the Trigger Delay
15
When record time is changed, the trigger delay remains unchanged.
16
17
18
App
Index
IM 701240-01E
6-5
6.4
Setting the Hold Off Time
<For a description of this function, refer to page 2-26.>
Procedure
1.
2.
3.
4.
5.
Press MENU.
Press the TRIGGER soft key.
Press the Trigger Cond. Setup soft key.
Press the Hold Off soft key.
Turn the jog shuttle to set the hold off time. Pressing RESET resets the value
to 0.0 µs.
Note
The hold off time setting applies to both simple and enhanced triggers.
Explanation
This function prevents a trigger from being activated for a specified time, even if the
trigger conditions are met during this time. This is effective when you want to activate the
trigger in sync with a periodic signal as shown in the figure below.
Repetition period:T
Trigger level
Input signal
Trigger source
signal
Trigger signal limited by hold off time t (when the trigger slope is set to rising edge)
t
6-6
IM 701240-01E
6.4 Setting the Hold Off Time
1
Selectable Range of the Hold Off Time
0 to 10 s (resolution: 0.1 µs)
2
Notes for Setting the Hold Off Time
• If you are setting the hold off time to 50 ms or greater, set the trigger mode to normal.
• When used with A->B(N) or A Delay B trigger, the hold off time applies only to
condition B.
• The hold off time is set to 0 ns for Period trigger, and this function is invalid.
3
4
5
6
Triggering
7
8
9
10
11
12
13
14
15
16
17
18
App
Index
IM 701240-01E
6-7
6.5
Setting the Edge Trigger (SIMPLE)
<For a description of this function, refer to page 2-17.>
Procedure
1.
2.
3.
4.
Press MENU.
Press the TRIGGER soft key.
Press the Trigger Cond. Setup soft key.
Press the Select soft key to select Simple.
Setting the Trigger Source
5.
6.
Press the Source soft key. The trigger source selection menu appears.
Use jog shuttle+SELECT to select the channel to be used as the trigger source
from CH1 to CH16.
Note
The menu does not appear for channels without modules.
Setting the Trigger Level
7.
8.
Press the Level soft key.
Turn the jog shuttle to set the trigger level. Pressing RESET sets the trigger
level to 0.
Note
The trigger level setting applies to both simple and enhanced triggers.
Setting the Trigger Slope
9.
Press the Slope soft key to select
,
, or
.
Setting the Hysteresis
10.
Press the Hysteresis soft key to select
,
, or
.
Setting the Hold Off
11.
6-8
Set the hold off time according to the procedures given in section 6.4.
IM 701240-01E
6.5 Setting the Edge Trigger (SIMPLE)
1
Explanation
This function activates a trigger when the trigger source signal crosses a specified level.
2
Trigger Source
Select the trigger source from CH1 to CH16.
3
Note
If you set the trigger source to a value other than CH1 to CH16, see the sections below.
• Time:
Section 6.8, “Setting the Timer Trigger (SIMPLE)”
• LogicA or Logic B:
Section 6.9, “Setting the Logic Trigger (SIMPLE)”
• Ext (TRIG IN terminal of the side panel): Section 6.6, “Setting the External Trigger (SIMPLE)”
• Line (commercial power supply signal): Section 6.7, “Generating Triggers on the Power
Signal (SIMPLE)”
4
5
6
Trigger Level
Selectable range:
Resolution:
Triggering
When Measuring Voltage
7
Within voltage range
Varies depending on the input module (see the table below).
When Measuring Temperature
Selectable range:
Resolution:
8
Measurement range of each thermocouple
0.1°C or 0.1 K (set within the measurement range (varies
depending on the thermocouple type)
For a description of the measurement range of thermocouples,
see section 5.14.
9
10
When Measuring Strain
Selectable range:
Resolution:
±(Measurable range)
1 µSTR or 0.0005 mV/V
11
Trigger Level Resolution
12
The selectable resolution varies depending on the input module.
When Measuring Voltage (When Probe Attenuation Is 1:1)
13
Input Module
701250/701255/
701261/701262
701251
701265
701260
701275
Voltage Range
1 mV
2mV
5 mV
–
–
–
–
–
–
0.001 mV
0.002 mV
0.005 mV
–
–
–
–
–
–
10 mV
20 mV
50 mV
–
–
0.05 mV
0.01 mV
0.02 mV
0.05 mV
0.01 mV
0.02 mV
0.05 mV
–
–
–
–
–
0.05 mV
100 mV
200 mV
500 mV
0.1 mV
0.2 mV
0.5 mV
0.1 mV
0.2 mV
0.5 mV
0.1 mV
0.2 mV
0.5 mV
–
0.2 mV
0.5 mV
0.1 mV
0.2 mV
0.5 mV
1V
2V
5V
0.001 V
0.002 V
0.005 V
0.001 V
0.002 V
0.005 V
0.001 V
0.002 V
0.005 V
0.001 V
0.002 V
0.005 V
0.001 V
0.002 V
0.005 V
10 V
20 V
50 V
0.01 V
0.02 V
0.05 V
0.01 V
0.02 V
0.05 V
0.01 V
0.02 V
0.05 V
0.01 V
0.02 V
0.05 V
0.01 V
0.02 V
0.05 V
100 V
200 V
500 V
0.1 V
0.2 V
–
0.1 V
0.2 V
–
0.1 V
–
–
0.1 V
0.2 V
0.5 V
0.1 V
–
–
1 kV
2 kV
–
–
–
–
–
–
0.001 kV
0.002 kV
–
–
14
16
17
18
App
Index
The resolution is 0.01 division on all modules.
IM 701240-01E
15
6-9
6.5 Setting the Edge Trigger (SIMPLE)
When Measuring Temperature
Range
Resolution
K, E, J, T, L, U, N, R, S, B, W
Au7Fe
0.1°C
0.1 K
Trigger Slope
Select how the trigger source is to cross the specified level for activating the trigger from
the following three choices.
: Activated when the trigger source changes from below the trigger level to above
the trigger level (rising).
: Activated when the trigger source changes from above the trigger level to below
the trigger level (falling).
: Activated on either a rising edge or falling edge.
Trigger Hysteresis
Sets a width to the trigger level so that triggers are not activated by small changes in the
trigger signal. Select the trigger hysteresis from the following three types.
When Measuring Voltage
: Approximately ±0.1 division of hysteresis around the trigger level.
: Approximately ±0.5 division of hysteresis around the trigger level.
: Approximately ±1 division of hysteresis around the trigger level.
When Measuring Temperature
: Approximately ±0.5°C (K)
: Approximately ±1°C (K)
: Approximately ±2°C (K)
When Measuring Strain
: Hysteresis of approximately ±2.5% of the range around the trigger level.
: Hysteresis of approximately ±12.5% of the range around the trigger level.
: Hysteresis of approximately ±25% of the range around the trigger level.
When Measuring Acceleration
: Hysteresis of approximately ±0.1 divisions of the range around the trigger level.
: Hysteresis of approximately ±0.5 divisions of the range around the trigger level.
: Hysteresis of approximately ±1 divisions of the range around the trigger level.
When Measuring Frequency and Other Parameters on the Frequency
Module
: Hysteresis of approximately ±0.01 divisions of the range around the trigger level.
: Hysteresis of approximately ±0.5 divisions of the range around the trigger level.
: Hysteresis of approximately ±1 divisions of the range around the trigger level.
Trigger is activated (When set to rising edge
Trigger level
)
Hysteresis width
Hold Off
See section 6.4.
6-10
IM 701240-01E
6.6
1
Setting the External Trigger (SIMPLE)
<For a description of this function, refer to page 2-17.>
2
Procedure
1.
2.
3.
4.
3
Press MENU.
Press the TRIGGER soft key.
Press the Trigger Cond. Setup soft key.
Press the Select soft key to select Simple.
4
Setting the Trigger Source
5.
6.
5
Press the Source soft key. The trigger source selection menu appears.
Use jog shuttle+SELECT to select Ext.
6
7.
Press the Slope soft key to select
or
Triggering
Setting the Trigger Slope
7
.
Setting the Hold Off
8.
8
Set the hold off time according to the procedures given in section 6.4.
9
10
11
12
13
Explanation
The external signal that is input through the TRIG IN terminal on the left side panel of the
SL1400 can be used to generate triggers.
14
Note
For details on the TRIG IN terminal, see section 14.1.
15
Trigger Source
16
Select Ext.
Trigger Slope
17
Select how the trigger source is to cross the specified level for activating the trigger from
the following two choices.
: Activated when the trigger source changes from below the trigger level to above
the trigger level (rising).
: Activated when the trigger source changes from above the trigger level to below
the trigger level (falling).
App
Index
Hold Off
See section 6.4.
IM 701240-01E
18
6-11
6.7
Activating Triggers on the Power Signal
(SIMPLE)
<For a description of this function, refer to page 2-17.>
Procedure
1.
2.
3.
4.
Press MENU.
Press the TRIGGER soft key.
Press the Trigger Cond. Setup soft key.
Press the Select soft key to select Simple.
Setting the Trigger Source
5.
6.
Press the Source soft key. The trigger source selection menu appears.
Use jog shuttle+SELECT to select Line.
Setting the Hold Off
7.
Set the hold off time according to the procedures given in section 6.4.
Explanation
A triggers can be activated on the rising edge of the power signal that is being supplied
to the SL1400. Waveforms synchronized to the commercial power supply frequency (50
Hz or 60 Hz) can be observed.
Trigger Source
Select Line. The power signal that is being supplied to the SL1400 becomes the trigger
source.
Hold Off
See section 6.4.
6-12
IM 701240-01E
6.8
1
Setting the Timer Trigger (SIMPLE)
<For a description of this function, refer to page 2-17.>
2
Procedure
1.
2.
3.
4.
3
Press MENU.
Press the TRIGGER soft key.
Press the Trigger Cond. Setup soft key.
Press the Select soft key to select Simple.
4
Setting the Trigger Source
5.
6.
5
Press the Source soft key. The trigger source selection menu appears.
Use jog shuttle+SELECT to select Time.
6
7.
8.
9.
10.
11.
Press the Date/Time soft key. A setup dialog box opens.
Use jog shuttle+SELECT to set the Date and Time.
When you are done, Use jog shuttle+SELECT to select Set.
Press the Time Interval soft key.
Turn the jog shuttle to set the ß for activating triggers in the range of 1 min to
24 hours.
Triggering
Setting the Date/Time and the Interval for Activating Triggers
7
8
9
10
11
12
13
14
15
16
17
18
App
Index
IM 701240-01E
6-13
6.8 Setting the Timer Trigger (SIMPLE)
Explanation
The trigger is activated at specified time intervals from the specified time.
Trigger Source
Select Time.
Reference Date and Time for Activating Triggers
Set the date and time for activating the trigger.
Time Interval for Activating Triggers
The following intervals can be specified.
1 min, 2 min, 3 min, 4 min, 5 min, 6 min, 7 min, 8 min, 9 min, 10 min, 15 min, 20 min, 25
min, 30 min, 40 min, 45 min, 50 min, 1 hour, 2 hour, 3 hour, 4 hour, 5 hour, 6 hour, 7
hour, 8 hour, 9 hour, 10 hour, 11 hour, 12 hour, 18 hour, and 24 hour
Trigger Position
Like the normal trigger, you can set the trigger position to observe the phenomenon
occurring around the specified time. Initially, the trigger position is set to 50% and
positioned at the center of the screen. To observe only the waveform after the trigger set
the trigger position to 0%. To observe only the waveform before the trigger set it to
100%.
Notes on the Timer Trigger
• Depending on the time interval setting, a trigger may occur while the waveform is
being acquired or during the pre-trigger period (a preparation period for observing the
waveform before the trigger time). In such cases, the trigger is ignored.
• If the trigger time is set to a time in the past, the trigger is activated when the current
time becomes
Specified time + time interval × N (where N is an integer).
• If you specify the acquisition count, the waveforms are acquired the specified number
of times. If it is set to infinite, the waveforms are acquired until you press START/
STOP to stop the waveform acquisition. For the procedure to set the acquisition
count, see section 7.2.
• You can save the waveform to a PC card or internal hard disk (optional), output the
waveform on the built-in printer, and do other operations by using the action-on-trigger
function.
6-14
IM 701240-01E
6.9
1
Setting the Logic Trigger (SIMPLE)
<For a description of this function, refer to page 2-17.>
2
Procedure
1.
2.
3.
4.
3
Press MENU.
Press the TRIGGER soft key.
Press the Trigger Cond. Setup soft key.
Press the Select soft key to select Simple.
4
Setting the Trigger Source
5.
6.
5
Press the Source soft key. The trigger source selection menu appears.
Use jog shuttle+SELECT to select Logic A or Logic B.
6
7.
8.
Triggering
Specifying the Bit for Assigning the Trigger Slope
7
Press the Logic Bit soft key. The bit selection menu appears.
Use jog shuttle+SELECT to set the bit to assign the trigger slope.
8
Setting the Trigger Slope
9.
Press the Slope soft key to select
or
.
9
Setting the Hold Off
10.
Set the hold off time according to the procedures given in section 6.4.
10
11
12
13
14
15
16
17
18
App
Index
IM 701240-01E
6-15
6.9 Setting the Logic Trigger (SIMPLE)
Explanation
This is the edge trigger when the trigger source is set to a logic waveform.
Trigger Source
Select Logic A or Logic B.
Bit to Assign the Trigger Slope (Logic Bit)
Select the trigger source from Bit 1 to Bit 8.
Trigger Slope
Select how the trigger source is to cross the specified level for activating the trigger from
the following two choices.
: Activated when the trigger source changes from below the trigger level to above
the trigger level (rising).
: Activated when the trigger source changes from above the trigger level to below
the trigger level (falling).
Hold Off
See section 6.4.
6-16
IM 701240-01E
1
6.10 Setting the A->B(N) Trigger (ENHANCED)
<For a description of this function, refer to page 2-18.>
2
Procedure
1.
2.
3.
4.
3
Press MENU.
Press the TRIGGER soft key.
Press the Trigger Cond. Setup soft key.
Press the Select soft key to select Enhanced.
4
Setting the Trigger Type
5.
6.
5
Press the Type soft key. The trigger type selection menu appears.
Use jog shuttle+SELECT to select A->B(N).
6
7.
Triggering
Setting Condition A
7
Press the Set Pattern soft key. The A->B(N) trigger setup menu appears.
• Setting the Condition A Pattern
8.
Use jog shuttle+SELECT to select the pattern of each channel (CH1 to CH16)
from H, L, and X. For logic input channels, select Disable or Enable.
• Setting the Condition A Condition
9.
9
Use jog shuttle+SELECT to set Condition to Enter or Exit.
Setting Condition B
10.
10
Set the pattern and condition of condition B in a similar fashion as in steps 8 and
9.
• Setting the Number of Times Condition B Is to Be Met
11.
8
Use jog shuttle+SELECT to set Count (the number of times condition B is to be
met). Pressing RESET resets the value to 1.
11
12
13
14
15
16
17
18
App
Index
IM 701240-01E
6-17
6.10 Setting the A->B(N) Trigger (ENHANCED)
Setting the Bit Patterns of Logic A and Logic B
(Only when using logic input channels)
12.
13.
Press the Logic Pattern soft key. The Logic Pattern setup dialog box appears.
Use jog shuttle+SELECT to select the pattern of each bit (Bit A1 to Bit A8 and
Bit B1 to Bit B8) from H, L, and X.
Setting the Trigger Level
14.
15.
16.
17.
18.
Press the Select CH soft key. The channel selection menu appears.
Use jog shuttle+SELECT to set the channel to assign the trigger level.
Press the Level soft key.
Use jog shuttle+SELECT to set the trigger level.
Likewise, set the trigger level for all channels on which patterns were assigned
in steps 8 to 10.
Note
The trigger level setting applies to both simple and enhanced triggers.
Setting the Hysteresis
19.
Press the Hysteresis soft key to select
,
, or
.
Setting the Hold Off
20.
Set the hold off time according to the procedures given in section 6.4.
Note
The pattern settings of conditions A and B apply to all trigger types.
6-18
IM 701240-01E
6.10 Setting the A->B(N) Trigger (ENHANCED)
1
Explanation
This function activates a trigger when the Nth time condition B becomes true after
condition A has become true.
2
Condition A and Condition B (Set Pattern)
Pattern of each channel:
3
CH1 to CH16, Logic A, or Logic B
Select from the following:
• CH1 to CH16 (Other Than Logic Inputs)
4
H: Above the preset trigger level
L: Below the preset trigger level
X: Don’t Care
5
• Logic Input
Enable: Make the combination of the pattern1 of each bit the trigger condition
Disable: Don’t Care
6
Triggering
1 Select the pattern of each pattern from the following:
H: Above a certain level2
L: Below a certain level2
X: Don’t Care
2 Varies depending on the logic probe being used as follows:
702911/702912/700986: Approx. 1.4 V
700987:
6 V ± 50% (for DC input)
700987:
50 V ± 50% (for AC input)
7
8
Condition
Select from the following:
Enter: A trigger is activated when all channels match the specified pattern.
Exit:
A trigger is activated when any of the channels no longer match the specified pattern.
9
10
Number of Times Condition B Is to Be Met (Count)
11
1 to 255 times
Trigger Level
12
The trigger level setting applies to both simple and enhanced triggers.
See “Trigger Level” in section 6.5.
13
Trigger Hysteresis
Sets a width to the trigger level so that triggers are not activated by small changes in the
trigger signal. Select the trigger hysteresis from
,
, and
.
See “Trigger Hysteresis” in section 6.5.
14
15
Hold Off
See section 6.4.
16
Note
•
•
IM 701240-01E
If you want to use a simple pattern trigger (only one pattern condition for activating the
trigger), set all of the status of condition B to Xs (Don’t care) and set a pattern for condition A.
If you want to set the trigger only on the condition of the pattern of each bit of the logic input
(trigger on the AND of each bit), then specify the following settings.
• Condition A pattern
Set the logic input channels to be used to Enable and all other channels to X (Don’t care)
• Condition B pattern
All Xs (Don’t care)
• Bit pattern of logic input
Set arbitrarily.
6-19
17
18
App
Index
6.11 Setting the A Delay B Trigger (ENHANCED)
<For a description of this function, refer to page 2-18.>
Procedure
1.
2.
3.
4.
Press MENU.
Press the TRIGGER soft key.
Press the Trigger Cond. Setup soft key.
Press the Select soft key to select Enhanced.
Setting the Trigger Type
5.
6.
Press the Type soft key. The trigger type selection menu appears.
Use jog shuttle+SELECT to select A Delay B.
Setting Condition A
7.
Press the Set Pattern soft key. The A Delay B trigger setup menu appears.
Setting the Condition A Pattern
8.
Use jog shuttle+SELECT to select the pattern of each channel (CH1 to CH16)
from H, L, and X. For logic input channels, select Disable or Enable.
Setting the Condition A Condition
9.
Use jog shuttle+SELECT to set Condition to Enter or Exit.
Setting Condition B
10.
Set the pattern and condition of condition B in a similar fashion as in steps 8 and
9.
Setting the Delay Time
11.
6-20
Use jog shuttle+SELECT to set Delay. Pressing RESET resets the value to 0.0
µs.
IM 701240-01E
6.11 Setting the A Delay B Trigger (ENHANCED)
1
Setting the Bit Patterns of Logic A and Logic B
(Only when using logic input channels)
12.
13.
Press the Logic Pattern soft key. The Logic Pattern setup dialog box appears.
Use jog shuttle+SELECT to select the pattern of each bit (Bit A1 to Bit A8 and
Bit B1 to Bit B8) from H, L, and X.
2
3
Setting the Trigger Level
14.
15.
16.
17.
18.
Press the Select CH soft key. The channel selection menu appears.
Use jog shuttle+SELECT to set the channel to assign the trigger level.
Press the Level soft key.
Use jog shuttle+SELECT to set the trigger level.
Likewise, set the trigger level for all channels on which patterns were assigned
in steps 8 to 10.
The trigger level setting applies to both simple and enhanced triggers.
Press the Hysteresis soft key to select
,
, or
8
.
Setting the Hold Off
20.
6
7
Setting the Hysteresis
19.
5
Triggering
Note
4
9
Set the hold off time according to the procedures given in section 6.4.
10
11
12
13
14
Note
15
The pattern settings of conditions A and B apply to all trigger types.
16
17
18
App
Index
IM 701240-01E
6-21
6.11 Setting the A Delay B Trigger (ENHANCED)
Explanation
This function activates a trigger the first time condition B becomes true after condition A
has become true and a preset time has elapsed.
Condition A and Condition B (Set Pattern)
Pattern of each channel: CH1 to CH16, Logic A, and Logic B
Select from the following:
• CH1 to CH16 (Other Than Logic Inputs)
H: Above the preset trigger level
L: Below the preset trigger level
X: Don’t Care
• Logic Input
Enable: Make the combination of the pattern1 of each bit the trigger condition
Disable: Don’t Care
*1 Select the pattern of each pattern from the following:
H: Above a certain level2
L: Below a certain level2
X: Don’t Care
2 Varies depending on the logic probe being used as follows:
702911/702912/700986: Approx. 1.4 V
700987:
6 V ± 50% (for DC input)
700987:
50 V ± 50% (for AC input)
Condition
Select from the following:
Enter: A trigger is activated when all channels match the specified pattern.
Exit:
A trigger is activated when any of the channels no longer match the specified
pattern.
Delay Time
0 to 10 s (resolution is 100 ns)
Trigger Level
The trigger level setting applies to both simple and enhanced triggers.
See “Trigger Level” in section 6.5.
Trigger Hysteresis
Sets a width to the trigger level so that triggers are not activated by small changes in the
trigger signal. Select the trigger hysteresis from
,
, and
.
See “Trigger Hysteresis” in section 6.5.
Hold Off
See section 6.4.
Note
If you want to activate only one pattern trigger, use the A->B(n) trigger function (see section
6.10).
6-22
IM 701240-01E
1
6.12 Setting the Edge on A Trigger (ENHANCED)
<For a description of this function, refer to page 2-19.>
2
Procedure
1.
2.
3.
4.
3
Press MENU.
Press the TRIGGER soft key.
Press the Trigger Cond. Setup soft key.
Press the Select soft key to select Enhanced.
4
Setting the Trigger Type
5.
6.
5
Press the Type soft key. The trigger type selection menu appears.
Use jog shuttle+SELECT to select Edge on A.
6
7.
Triggering
Setting Condition A
7
Press the Set Pattern soft key. The Edge on A trigger setup menu appears.
Setting the Condition A Pattern
8.
Use jog shuttle+SELECT to select the pattern of each channel (CH1 to CH16)
from H, L, and X. For logic input channels, select Disable or Enable.
Setting the Condition A Condition
9.
9
Use jog shuttle+SELECT to set Condition to True or False.
Setting the Edge Trigger OR
10.
8
10
Use jog shuttle+SELECT to select the edge trigger OR status of each channel
(CH1 to CH16) from , , and –. For logic input channels, select Disable or
Enable.
11
12
13
14
15
16
17
18
App
Index
IM 701240-01E
6-23
6.12 Setting the Edge on A Trigger (ENHANCED)
Setting the Bit Pattern/Status of Logic A and Logic B
(Only when using logic input channels)
11.
12.
13.
Press the Logic Pattern soft key. The Logic Pattern setup dialog box appears.
Use jog shuttle+SELECT to select the pattern of each bit (Bit A1 to Bit A8 and
Bit B1 to Bit B8) of condition A from H, L, and X.
Like wise, use jog shuttle+SELECT to select the edge trigger OR status from
, , and –.
Setting the Trigger Level
14.
15.
16.
17.
18.
Press the Select CH soft key. The channel selection menu appears.
Use jog shuttle+SELECT to set the channel to assign the trigger level.
Press the Level soft key.
Use jog shuttle+SELECT to set the trigger level.
Likewise, set the trigger level for all channels on which patterns were assigned
in steps 7 to 8.
Note
The trigger level setting applies to both simple and enhanced triggers.
Setting the Hysteresis
19.
Press the Hysteresis soft key to select
,
, or
.
Setting the Hold Off
20.
Set the hold off time according to the procedures given in section 6.4.
Note
The pattern settings of conditions A apply to all trigger types.
6-24
IM 701240-01E
6.12 Setting the Edge on A Trigger (ENHANCED)
1
Explanation
This function activates a trigger on the OR logic of the edge trigger of each channel while
condition A is true.
2
Conditions A/Edge Or (Set Pattern)
Pattern of Each Channel of Condition A: CH1 to CH16, Logic A, and
Logic B
3
Select from the following:
4
• CH1 to CH16 (Other Than Logic Inputs)
H: Above the preset trigger level
L: Below the preset trigger level
X: Don’t Care
5
• Logic Input
6
Triggering
Enable: Make the combination of the pattern1 of each bit the trigger condition
Disable: Don’t Care
1 Select the pattern of each pattern from the following:
H: Above a certain level2
L: Below a certain level2
X: Don’t Care
2 Varies depending on the logic probe being used as follows:
702911/702912/700986: Approx. 1.4 V
700987:
6 V ± 50% (for DC input)
700987:
50 V ± 50% (for AC input)
7
8
9
Condition
Select from the following:
True: A trigger is activated while all channels match the specified pattern.
False: A trigger is activated while any of the channels do not match the specified
pattern.
10
11
Edge Trigger of Each Channel (Edge Or)
This setting is possible only if the channel’s condition A pattern is set to X (Don’t
Care). If you set all condition A patterns to X (Don’t Care), the trigger will operate as
an OR trigger.
• CH1 to CH16 (Other Than Logic Inputs)
12
13
: Rising edge
: Falling edge
– : Don’t Care
14
• Logic Input
Enable: Make the combination of the pattern1 of each bit the trigger condition
Disable: Don’t Care
15
1 Select the pattern of each pattern from the following:
: When the signal goes above a certain level2
: When the signal goes below a certain level2
– : Don’t Care
2 Varies depending on the logic probe being used as follows:
700986: Approx. 1.4 V
700987: 6 V ± 50% (for DC input)
700987: 50 V ± 50% (for AC input)
16
17
18
App
Index
IM 701240-01E
6-25
6.12 Setting the Edge on A Trigger (ENHANCED)
Trigger Level
The trigger level setting applies to both simple and enhanced triggers.
See “Trigger Level” in section 6.5.
Trigger Hysteresis
Sets a width to the trigger level so that triggers are not activated by small changes in the
trigger signal. Select the trigger hysteresis from
,
, and
.
See “Trigger Hysteresis” in section 6.5.
Hold Off
See section 6.4.
6-26
IM 701240-01E
1
6.13 Setting the OR Trigger (ENHANCED)
<For a description of this function, refer to page 2-19.>
2
Procedure
1.
2.
3.
4.
3
Press MENU.
Press the TRIGGER soft key.
Press the Trigger Cond. Setup soft key.
Press the Select soft key to select Enhanced.
4
Setting the Trigger Type
5.
6.
5
Press the Type soft key. The trigger type selection menu appears.
Use jog shuttle+SELECT to select OR.
6
7.
8.
Press the Set Pattern soft key. The OR trigger setup menu appears.
Use jog shuttle+SELECT to select the edge trigger OR status of each channel
(CH1 to CH16) from , , and –. For logic input channels, select Disable or
Enable.
Triggering
Setting the Edge Trigger OR
7
8
9
10
11
12
13
14
15
16
17
18
App
Index
IM 701240-01E
6-27
6.13 Setting the OR Trigger (ENHANCED)
Setting the Status of Each Bit of Logic A and Logic B
(Only when using logic input channels)
9.
10.
Press the Logic Pattern soft key. The Logic Pattern setup dialog box appears.
Use jog shuttle+SELECT to select edge trigger OR status of each bit (Bit A1 to
Bit A8 and Bit B1 to Bit B8) from , , and –.
Setting the Trigger Level
11.
12.
13.
14.
15.
Press the Select CH soft key. The channel selection menu appears.
Use jog shuttle+SELECT to set the channel to assign the trigger level.
Press the Level soft key.
Use jog shuttle+SELECT to set the trigger level.
Likewise, set the trigger level for all channels on which patterns were assigned
in step 8.
Note
The trigger level setting applies to both simple and enhanced triggers.
Setting the Hysteresis
16.
Press the Hysteresis soft key to select
,
, or
.
Setting the Hold Off
17.
6-28
Set the hold off time according to the procedures given in section 6.4.
IM 701240-01E
6.13 Setting the OR Trigger (ENHANCED)
1
Explanation
This function activates a trigger on the OR logic of edge triggers. You can set trigger
conditions on all channels (CH1 to CH16). For example, a trigger can be activated on the
rising edge of CH1 or CH2.
2
Edge Trigger of Each Channel (Set Pattern)
3
Select from the following:
• CH1 to CH16 (Other Than Logic Inputs)
4
: Rising edge
: Falling edge
– : Don’t Care
5
• Logic Input
Enable: Make the combination of the status1 of each bit the trigger condition
Disable: Don’t Care
6
Triggering
1 Select the status of each bit from the following:
:
When the signal goes above a certain level2
:
When the signal goes below a certain level2
– :
Don’t Care
2 Varies depending on the logic probe being used as follows:
702911/702912/700986: Approx. 1.4 V
700987:
6 V ± 50% (for DC input)
700987:
50 V ± 50% (for AC input)
7
8
9
Trigger Level
The trigger level setting applies to both simple and enhanced triggers.
See “Trigger Level” in section 6.5.
10
Trigger Hysteresis
Sets a width to the trigger level so that triggers are not activated by small changes in the
trigger signal. Select the trigger hysteresis from
,
, and
.
See “Trigger Hysteresis” in section 6.5.
11
12
Hold Off
13
See section 6.4.
Note
The OR trigger is equivalent to setting the pattern of condition A of Edge on A trigger to all Xs
(Don’t Care).
14
15
16
17
18
App
Index
IM 701240-01E
6-29
6.14 Setting the B > Time, B < Time, or B Timeout
(Pulse Width) Trigger (ENHANCED)
<For a description of this function, refer to page 2-20.>
Procedure
1.
2.
3.
4.
Press MENU.
Press the TRIGGER soft key.
Press the Trigger Cond. Setup soft key.
Press the Select soft key to select Enhanced.
Setting the Trigger Type
5.
6.
Press the Type soft key. The trigger type selection menu appears.
Use the jog shuttle+SELECT to select B > Time, B < Time, or B TimeOut.
Setting the Condition B Pattern
7.
8.
Press the Set Pattern soft key. The B > Time trigger, B < Time trigger, and B
TimeOut trigger setup menu appears.
Use jog shuttle+SELECT to select the pattern of each channel (CH1 to CH16)
from H, L, and X. For logic input channels, select Disable or Enable.
Setting the Pulse Width
9.
6-30
Use jog shuttle+SELECT to set Time. Pressing RESET resets the value to 0.1
µs.
IM 701240-01E
6.14 Setting the B > Time, B < Time, or B Timeout (Pulse Width) Trigger (ENHANCED)
1
Setting the Bit Patterns of Logic A and Logic B
(Only when using logic input channels)
10.
11.
Press the Logic Pattern soft key. The Logic Pattern setup dialog box appears.
Use jog shuttle+SELECT to select the pattern of each bit (Bit A1 to Bit A8 and
Bit B1 to Bit B8) from H, L, and X.
2
3
Setting the Trigger Level
12.
13.
14.
15.
16.
Press the Select CH soft key. The channel selection menu appears.
Use jog shuttle+SELECT to set the channel to assign the trigger level.
Press the Level soft key.
Use jog shuttle+SELECT to set the trigger level.
Likewise, set the trigger level for all channels on which patterns were assigned
in step 8.
The trigger level setting applies to both simple and enhanced triggers.
Press the Hysteresis soft key to select
,
, or
8
.
Setting the Hold Off
18.
6
7
Setting the Hysteresis
17.
5
Triggering
Note
4
9
Set the hold off time according to the procedures given in section 6.4.
Note
10
The pattern settings of conditions B apply to all trigger types.
11
12
13
14
15
16
17
18
App
Index
IM 701240-01E
6-31
6.14 Setting the B > Time, B < Time, or B Timeout (Pulse Width) Trigger (ENHANCED)
Explanation
The following three pulse width triggers are available.
B > Time:
A trigger is activated when condition B goes false after holding true for the
preset pulse width.
B < Time:
A trigger is activated when condition B goes false after holding true for less
than the preset pulse width.
B Time Out: A trigger is activated when condition B has held true for the preset pulse
width.
The point where the trigger is activated differs between B > Time and B Time Out as
shown in the figure below.
When B > Time, CH1 = H, and Time = 4 µs
5 µs
When B Time Out, CH1 = H, and Time = 4 µs
4 µs
5 µs
1 µs
CH1
1 µs
CH1
Trigger
Trigger
B<Time Setup Example
When B < Time, condition B: CH1 = H, CH2 = H, and Time = 4 µs
3 µs
CH1
CH2
Trigger
CH1
CH2
6-32
L
L
H
H
3 µs
L
H
L
H
L
5 µs
IM 701240-01E
6.14 Setting the B > Time, B < Time, or B Timeout (Pulse Width) Trigger (ENHANCED)
1
Condition B (Set Pattern)
Pattern of each channel: CH1 to CH16, Logic A, and Logic B
2
Select from the following:
• CH1 to CH16 (Other Than Logic Inputs)
H: Above the preset trigger level
L: Below the preset trigger level
X: Don’t Care
3
• Logic Input
4
Enable: Make the combination of the pattern1 of each bit the trigger condition
Disable: Don’t Care
5
1 Select the pattern of each pattern from the following:
H: Above a certain level2
L: Below a certain level2
X: Don’t Care
2 Varies depending on the logic probe being used as follows:
702911/702912/700986: Approx. 1.4 V
700987:
6 V ± 50% (for DC input)
700987:
50 V ± 50% (for AC input)
6
Triggering
7
Pulse Width (Time)
8
0.1 µs to 10 s (resolution : 0.1 µs)
Notes for Setting the B>Time, B<Time, or B Time Out Trigger
9
Correct operation is not guaranteed if adjacent pulses are less than 0.1 µs apart or if the
pulse width is less than 0.1 µs (typical).
0.1 µs or more
10
11
Trigger Level
The trigger level setting applies to both simple and enhanced triggers.
See “Trigger Level” in section 6.5.
12
Trigger Hysteresis
13
Sets a width to the trigger level so that triggers are not activated by small changes in the
trigger signal. Select the trigger hysteresis from
,
, and
.
See “Trigger Hysteresis” in section 6.5.
14
Hold Off
15
See section 6.4.
16
17
18
App
Index
IM 701240-01E
6-33
6.15 Setting the Period Trigger (ENHANCED)
<For a description of this function, refer to page 2-21.>
Procedure
1.
2.
3.
4.
Press MENU.
Press the TRIGGER soft key.
Press the Trigger Cond. Setup soft key.
Press the Select soft key to select Enhanced.
Setting the Trigger Type
5.
6.
Press the Type soft key. The trigger type selection menu appears.
Use jog shuttle+SELECT to select Period.
Setting the Condition B Status
7.
8.
9.
Press the Set Pattern soft key. The Period trigger setup menu appears.
Use jog shuttle+SELECT to select Mode and use jog shuttle+SELECT to
select T > Time, T < Time, T1 < T < T2, or T < T1, T2 < T.
Use jog shuttle+SELECT to select the pattern of each channel (CH1 to CH16)
from H, L, and X. For logic input channels, select Disable or Enable.
Setting the Time of Satisfaction
• For T > Time or T < Time
10.
Use jog shuttle+SELECT to set Time. Pressing RESET resets the value to 0.1
µs.
• For T1 < T < T2 or T < T1, T2 < T
10.
6-34
Use jog shuttle+SELECT to set Time1 and Time2. Press RESET resets Time1
to 0.1 µs and Time2 to 0.2 µs.
IM 701240-01E
6.15 Setting the Period Trigger (ENHANCED)
1
Setting the Bit Patterns of Logic A and Logic B
(Only when using logic input channels)
11.
12.
Press the Logic Pattern soft key. The Logic Pattern setup dialog box appears.
Use jog shuttle+SELECT to select the pattern of each bit (Bit A1 to Bit A8 and
Bit B1 to Bit B8) from H, L, and X.
2
3
Setting the Trigger Level
13.
14.
15.
16.
17.
Press the Select CH soft key. The channel selection menu appears.
Use jog shuttle+SELECT to set the channel to assign the trigger level.
Press the Level soft key.
Use jog shuttle+SELECT to set the trigger level.
Likewise, set the trigger level for all channels on which patterns were assigned
in step 9.
The trigger level setting applies to both simple and enhanced triggers.
Press the Hysteresis soft key to select
,
, or
6
7
Setting the Hysteresis
18.
5
Triggering
Note
4
8
.
Note
9
The pattern settings of conditions B apply to all trigger types.
10
11
12
13
14
15
16
17
18
App
Index
IM 701240-01E
6-35
6.15 Setting the Period Trigger (ENHANCED)
Explanation
The following four period triggers are available.
T > Time:
A trigger is activated when condition B is met the second time if the
time when condition B is met the second time is longer than a specified
time.
T < Time:
A trigger is activated when condition B is met the second time if the
time when condition B is met the second time is shorter than a specified
time.
T1 < T < T2:
A trigger is activated when condition B is met the second time if the
time when condition B is met the second time is within a specified time
range.
T < T1, T2 < T: A trigger is activated when condition B is met the second time if the
time when condition B is met the second time is outside a specified time
range.
Condition B (Set Pattern)
Pattern of each channel: CH1 to CH16, Logic A, and Logic B
Select from the following:
• CH1 to CH16 (Other Than Logic Inputs)
H: Above the preset trigger level
L: Below the preset trigger level
X: Don’t Care
• Logic Input
Enable: Make the combination of the pattern1 of each bit the trigger condition
Disable: Don’t Care
1 Select the pattern of each pattern from the following:
H: Above a certain level2
L: Below a certain level2
X: Don’t Care
*2 Varies depending on the logic probe being used as follows:
702911/702912/700986: Approx. 1.4 V
700987:
6 V ± 50% (for DC input)
700987:
50 V ± 50% (for AC input)
Time of Satisfaction
• For T > Time or T < Time
Time:
0.1 µs to 9999999.9 µs
• For T1 < T < T2 or T < T1, T2 < T
Time1:
Time2:
0.1 µs to 9999999.9 µs
0.2 µs to 10000000.0 µs
Trigger Level
The trigger level setting applies to both simple and enhanced triggers.
See “Trigger Level” in section 6.5.
Trigger Hysteresis
Sets a width to the trigger level so that triggers are not activated by small changes in the
trigger signal. Select the trigger hysteresis from
,
, and
.
See “Trigger Hysteresis” in section 6.5.
Hold Off
The hold function is invalid for the period trigger.
6-36
IM 701240-01E
1
6.16 Setting the Window Trigger (ENHANCED)
<For a description of this function, refer to page 2-22.>
2
Procedure
1.
2.
3.
4.
3
Press MENU.
Press the TRIGGER soft key.
Press the Trigger Cond. Setup soft key.
Press the Select soft key to select Enhanced.
4
Setting the Trigger Type
5.
6.
5
Press the Type soft key. The trigger type selection menu appears.
Use jog shuttle+SELECT to select Window.
6
7.
8.
Press the Set Pattern soft key. The Window trigger setup menu appears.
Use jog shuttle+SELECT to select the pattern of each channel (CH1 to CH16)
from IN, OUT, and –. For logic input channels, select Disable or Enable.
Triggering
Setting the Trigger Conditions
7
8
9
10
11
12
13
14
15
16
17
18
App
Index
IM 701240-01E
6-37
6.16 Setting the Window Trigger (ENHANCED)
Setting the Status of Each Bit of Logic A and Logic B
(Only when using logic input channels)
9.
10.
Press the Logic Pattern soft key. The Logic Pattern setup dialog box appears.
Use jog shuttle+SELECT to select the status of each bit (Bit A1 to Bit A8 and
Bit B1 to Bit B8) from , , and –.
Selecting the Target Waveform
11.
12.
Press the Select CH soft key. The channel selection menu appears.
Use jog shuttle+SELECT to select the target channel.
Setting the Window (When the Target Waveform Is Not Logic)
Setting the Center Level
13.
14.
Press the Center/Width soft key to set the jog shuttle control to Center.
Turn the jog shuttle to set the center level.
Setting the Window Width
15.
16.
Press the Center/Width soft key to set the jog shuttle control to Width.
Turn the jog shuttle to set the window width.
Setting the Hysteresis
17.
Press the Hysteresis soft key to select
,
, or
.
Setting the Hold Off
18.
6-38
Set the hold off time according to the procedures given in section 6.4.
IM 701240-01E
6.16 Setting the Window Trigger (ENHANCED)
1
Explanation
Window Trigger Target
You can set trigger conditions on all channels (CH1 to CH16) other than logic waveforms. A
trigger occurs if any of the specified trigger conditions (OR condition) is met.
2
3
Trigger Condition (Set Pattern)
• CH1 to CH16 (Other Than Logic Inputs)
4
IN:
A trigger is activated when the trigger source enters the area between two
preset levels.
OUT: A trigger is activated when the trigger source exits the area between two
preset levels.
5
• Logic Input
Enable:
Disable:
Make the combination of the status1 of each bit the trigger condition
Don’t Care
6
Triggering
1 Select the status of each bit from the following:
: When the signal goes above a certain level2
: When the signal goes below a certain level2
– : Don’t Care
*2 Varies depending on the logic probe being used as follows:
702911/702912/700986: Approx. 1.4 V
700987:
6 V ± 50% (for DC input)
700987:
50 V ± 50% (for AC input)
7
8
9
Window (Center/Width)
A window is specified by a center level and width around the center level.
Selectable range of Center: ±(Voltage range) when measuring voltage, measurement
range of the thermocouple when measuring temperature.
(Resolution: Same as the resolution of the trigger level. See
section 6.5.)
Selectable range of Width: ±(Voltage range) when measuring voltage, measurement
range of the thermocouple when measuring temperature
around the center level.
(Resolution: Same as the resolution of the trigger level. See
section 6.5.)
IN
Trigger is activated
Width
Window
Center
OUT
Width
Trigger is activated
10
11
12
13
14
Window
15
Center
16
Trigger is activated
Trigger Hysteresis
Sets a width to the trigger level so that triggers are not activated by small changes in the
trigger signal. Select the trigger hysteresis from
,
, and
.
See “Trigger Hysteresis” in section 6.5.
17
18
Hold Off
App
See section 6.4.
Notes for Activating Window Triggers
Index
The operation is the same as the OR trigger for logic input.
IM 701240-01E
6-39
6.17 Setting the Wave Window Trigger (ENHANCED)
<For a description of this function, refer to page 2-23.>
Procedure
1.
2.
3.
4.
Press MENU.
Press the TRIGGER soft key.
Press the Trigger Cond. Setup soft key.
Press the Select soft key to select Enhanced.
Setting the Trigger Type
5.
6.
Press the Type soft key. The trigger type selection menu appears.
Use jog shuttle+SELECT to select Wave Window.
Setting the Trigger Conditions
7.
8.
Press the Set Pattern soft key. The Wave Window trigger setup menu appears.
Use jog shuttle+SELECT to select the pattern of each channel (CH1 to CH16)
from ON and OFF.
Note
•
•
•
The wave window trigger does not apply to the 701265 (TEMP/HPV) and the 701280
(FREQ).
Wave window trigger is not applicable when measuring temperature on the 701261
(UNIVERSAL) or 701262 (UNIVERSAL (AAF)).
Wave window trigger cannot be used in Recorder mode.
Setting the Cycle Frequency, Reference Cycle, Synchronization Channel,
Level, and Hysteresis
8.
10.
11.
12.
13.
6-40
Use jog shuttle+SELECT to set Cycle Frequency. Pressing RESET resets the
value to 50 Hz.
Likewise, set the Reference Cycle to 1, 2, or 4.
Likewise, set Sync. Ch to Auto or CH1 to CH16.
If you select a setting other than Auto in step 11, set the Level of the
synchronization channel.
Likewise, set Hys to
,
, or
.
IM 701240-01E
6.17 Setting the Wave Window Trigger (ENHANCED)
1
Selecting the Target Waveform
14.
15.
Press the Select CH soft key. The channel selection menu appears.
Use jog shuttle+SELECT to select the target channel.
2
Setting the Window Width
16.
17.
3
Press the Width soft key.
Turn the jog shuttle to set the window width.
4
Setting the Hold Off
18.
Set the hold off time according to the procedures given in section 6.4.
5
6
Triggering
7
8
9
Explanation
This trigger is used to detect abnormalities in the power waveform (disruption, sag,
surge, frequency fluctuation, voltage drop, etc.). A realtime template is created
automatically using 1 to 4 waveforms before the current waveform, and comparison is
made between the current waveform and the realtime template. A trigger occurs if the
current waveform falls outside the realtime template.
4 previous waveforms
Current waveform
Realtime template
11
12
Power supply
waveform
Averaged waveform
of 1 to 4 waveforms
10
Trigger activated
here
13
14
15
Averaged waveform
+ tolerance width
Disruption
(Trigger)
Sag
(Trigger)
Realtime
template
Compare the current waveform against
the realtime templateTrigger activated
when the current waveform falls outside
the realtime template
16
17
Surge
(Trigger)
18
App
Sag
(Trigger)
Index
IM 701240-01E
6-41
6.17 Setting the Wave Window Trigger (ENHANCED)
Operating Conditions of the Wave Window Trigger
Target waveform:
AC waveform or triangular waveform between 40 and 1 kHz.
(Rectangular waveforms such as inverter waveforms and waveforms
with a fast rising edge are excluded)
Sample rate:
10 kS/s to 500 kS/s
Acquisition mode: Normal
Trigger mode:
Normal, Single, or Single(N)
Applicable Modules
• 701250 (HS10M12)
• 701251 (HS1M16)
• 701255 (NONISO_10M12)
• 701260 (HV(with RMS))
• 701261 (UNIVERSAL) (only when measuring voltage)
• 701262 (UNIVERSAL (AAF)) (only when measuring voltage)
• 701270 (STRAIN_NDIS)
• 701271 (STRAIN_DSUB)
• 701275 (ACCL/VOLT)
A trigger is activated if any of the specified trigger conditions (OR condition) is met.
Notes When Using the Wave Window Trigger
The wave window trigger cannot be used in the following cases:
• When the acquisition mode is set to Average or Envelope
• When the record time is less than or equal to 25 KW and T/div is less than 100 ms.
Normally, set the trigger mode to Normal, Single, or Single(N). Wave window triggers are
not easily triggered when the trigger mode is set to Auto or Auto Level.
The wave window trigger is used to detect rapid changes in the waveform. If a difference
is observed after comparing 1 to 4 cycles (reference cycles) of the previous waveform
and the current waveform, a trigger is activated. Therefore, if an abnormal waveform
such as surge is contained in the 1 to 4 cycles of the previous waveform immediately
after waveform acquisition is started (during which measured data of size equal to the
pretrigger section is acquired), a trigger is activated on the normal waveform. If this
happens, the trigger point may appear as though it is delayed by several cycles as
shown in the figure below. This phenomenon is unavoidable due to the principles of the
wave window trigger.
Trigger appears as though it is delayed by 1 cycle.
Surge
Pre-trigger time
Trigger occurrence
6-42
IM 701240-01E
6.17 Setting the Wave Window Trigger (ENHANCED)
The time difference from the abnormal waveform to the trigger point varies depending on
the reference cycle as shown below. (When the frequency of the trigger is low the time
difference will be 0 cycles in most cases.)
Reference Cycle
Time Difference
1 cycle
2 cycles
4 cycles
0 or 1 cycle
0, 1, or 2 cycles
0, 1, 2, 3, or 4 cycles
1
2
3
4
When using the wave window trigger, it is recommended that a pretrigger equal to the
reference cycle be specified. This allows abnormal waveforms to be observed on the
screen even when the above phenomenon occurs.
Trigger Condition (Set Pattern)
5
6
Triggering
ON: Use the channel as a target channel for the wave window trigger.
OFF: Do not use the channel as a target channel for the wave window trigger.
7
Cycle Frequency
Set the frequency of the measured power supply in the range of 40 to 1000 Hz. The
resolution is 1 Hz. The default value is 50 Hz.
If the actually frequency is within ±10% of the specified value, it is automatically
tracked.
Reference Cycle
Select how many waveforms before the current waveform are used to create the
realtime template (wave window).
1 (1 waveform), 2 (2 waveforms), or 4 (4 waveforms)
The waveforms of the specified number of reference cycles are used to create the
realtime template.
Sync. Ch, Level, and Hys
Select the channel used to detect the waveform determination start point of the wave
window trigger. Select the synchronization channel from Auto or CH1 to CH16.
If you select Auto, the synchronization channel is automatically set using the following
conditions.
Target channel: Channel with the smallest channel number among the target
channels of the wave window trigger.
Level:
1/2 the peak-to-peak value over 0.5 s after starting the waveform
acquisition.
Hysteresis:
Same as the hysteresis of an edge trigger (see section 6.5)
If you select a setting other than Auto, set the level and hysteresis of the
synchronization channel.
8
9
10
11
12
13
14
15
16
Setting the Level
The selectable range of the level is the same as that of the simple trigger.
17
Setting the Hysteresis
Sets a width to the trigger level so that triggers are not activated by small changes in
the trigger signal. Select the trigger hysteresis from
,
, and
.
See “Trigger Hysteresis” in section 6.5.
18
App
Index
IM 701240-01E
6-43
6.17 Setting the Wave Window Trigger (ENHANCED)
Window Width
The realtime template is created by applying a tolerance width (window width) to the
averaged waveform. The selectable range of the window width varies depending on the
measured item as follows:
When measuring voltage:
(Voltage range)/1000 to voltage range
When measuring strain:
11 µSTR to (measurement range)×2
Or, 0.0005 mV/V to (measurement range)×2
When measuring acceleration: 0.01 Unit to (Unit/div)×10
(The resolution is the same as the resolution of the trigger level. See section 6.5.)
For example, if Width is set to 2 V, a window width of
±1 V is created with respect to the reference waveform.
1V
1V
Window width
Reference waveform
Hold Off
See section 6.4.
Note
If a trigger waveform such as a surge is input immediately before the completion of the pretrigger, the trigger point may be delayed by up to 4 cycles.
6-44
IM 701240-01E
1
6.18 Setting the Action-on-Trigger
<For a description of this function, refer to page 2-26.>
2
Procedure
1.
2.
3.
3
Press MENU.
Press the TRIGGER soft key.
Press the ACTION soft key.
4
Setting the Action
4.
5.
6.
7.
Press the Sequence soft key to select Single or Continue.
If you select Continue, turn the jog shuttle to set the number of actions.
Pressing RESET resets the count to Infinite.
10
Press MENU.
Press the Next 1/2 soft key.
Press the Others soft key.
Press the Action Mode (Power ON) soft key to select ON or OFF.
11
Executing Action-on-Trigger
15.
7
9
Setting the Execution Mode of the Action-on-Trigger at Power ON
11.
12.
13.
14.
6
8
Setting the Number of Actions
9.
10.
5
Triggering
8.
Press the Mode soft key. The Mode setup menu appears.
Press the On Trigger soft key.
Press the Action soft key. The Action setup menu appears.
Use jog shuttle+SELECT to select the action to be enabled. (You can select
multiple actions.)
If you select Save to File in step 7, use the jog shuttle+SELECT to set the file
save format to Binary, ASCII, or Float. If you select Send Mail, use jog
shuttle+SELECT to set Mail Count.
12
Press START/STOP. Waveform acquisition is started, and action-on-trigger is
executed. While action-on-trigger is in execution,
is displayed at the upper
left of the screen. In addition, if the following action is specified, the following
icon is displayed at the upper left of the screen while the action is being
executed.
Image/Save to File: Save destination medium (
PC card,
SCSI device,
internal HD,
network drive, or
USB storage
device)
Send Mail:
13
14
15
16
17
18
App
Index
IM 701240-01E
6-45
6.18 Setting the Action-on-Trigger
Aborting Action-on-Trigger
16.
Press START/STOP. Waveform acquisition is stopped, and action-on-trigger is
aborted.
Explanation
Mode
A specified action is executed each time a trigger is activated. When action-on-trigger is
enabled, the trigger mode is set to Single.
Action
The following five types of actions are available.
Print the Screen Image Data (PRINT)
Prints the screen image on the printer (Printer (built-in printer), USB (USB printer), or
Net Print (network printer)) specified by Print to in the PRINT menu.
Save the Screen Image Data (Image)
Saves the screen image data to the destination (PC card, internal HD (optional), SCSI
device, or USB storage device) specified in the IMAGE SAVE menu.
Save Waveform Data (Save to File)
Saves the waveform data in binary, ASCII, or floating format to the destination (PC
card, internal HD (optional), SCSI device, or USB storage device) specified in the
FILE menu. The save format is synchronized to data type (see section 13.8) on the
FILE menu.
Buzzer
Sounds a buzzer.
Send Mail
Sends an e-mail message to a specified address (when Ethernet interface option is
installed). Set the number of mail transmissions in the range of 1 to 1000.
For the procedure to set the address, see section 15.5.
Note
If action-on-trigger is started, the data is acquired using single mode trigger regardless of the
trigger mode setting, and the specified action is carried out.
Sequence and ACQ Count
Sequence
Single:
Continue:
Performs the action once.
Performs the action the number of times specified by ACQ Count.
ACQ Count
2 to 65536: Repeats the action the specified number of counts.
Infinite:
Repeats the action until waveform acquisition is stopped.
PRINT, Image, and Save to File Operations
Operates according to the settings in the PRINT, IMAGE, and FILE menus.
6-46
IM 701240-01E
6.18 Setting the Action-on-Trigger
1
File Name When Action Is Set to Image or Save to File
If the Auto Naming of the IMAGE menu or the FILE menu is OFF, numbers are
automatically assigned to the file names. Otherwise, the file is saved using the specified
method.
For details, see section 13.8 or 13.12.
2
3
Send Mail Operation
4
Sends e-mail messages to the address specified by pressing MENU and selecting
Next 1/2 > Network > Mail Setup > Mail Address.
Setting the Execution Mode of the Action-on-Trigger at Power ON (Action
Mode(Power On))
6
Triggering
You can select whether to enable action-on-trigger at power-on. Turn this ON if you want
to continue the action-on-trigger operation after a power failure.
ON: At power ON, the action-on-trigger is set to the mode that was used when the
power was turned OFF.
OFF: Action Mode is turned OFF at power ON.
The default setting is OFF.
5
7
8
Notes When Using the Action-on-Trigger
• Action-on-trigger cannot be used if the acquisition mode is Average.
• You cannot change the settings while the action-on-trigger is in progress.
• The action-on-trigger operation may slow down if there is access from the network
while the following action is in progress.
Printing/saving of the screen image data and saving of the waveform data
• You cannot use action-on-trigger or action-on-stop when the realtime recording to the
internal hard disk is ON.
9
10
11
12
Notes When Action Is Set to Image or Save to File
• Do not specify the root directory of the medium as the save destination directory.
(Only up to 512 files can be saved to the root directory of a medium that has been
formatted using the SL1400.)
• The maximum number of files that can be created in a single directory is 5000. Do not
place files in the save destination folder before starting the action-on-trigger operation.
• If you select Image and Save to File simultaneously, separate the folders specified by
the IMAGE menu and the FILE menu.
• If you select Numbering for the file name assignment method (Auto Naming) in the
IMAGE menu and the FILE menu, the creation of files takes an extended period when
the number of saved files becomes large. When creating more than 2000 files, select
Date for Auto Naming.
• When 5000 files are saved, the action-on-trigger operation ends.
13
14
15
16
17
18
App
Index
IM 701240-01E
6-47
6.19 Activating Manual Triggers
<For a description of this function, refer to page 2-27.>
Procedure
1.
2.
Press START/STOP. The waveform acquisition starts.
Press MANUAL TRIG to manually activate the trigger.
Explanation
You can manually activate the trigger by pressing the MANUAL TRIG key on the front
panel.
6-48
IM 701240-01E
Chapter 7
Waveform Acquisition
7.1
1
Starting/Stopping Waveform Acquisition
2
Procedure
3
Starting/Stopping Waveform Acquisition
Press START/STOP. Waveform acquisition starts or stops.
Waveform acquisition is in progress when the RECORD indicator above the START/
STOP key is illuminated.
5
Setting the Waveform Acquisition Mode at Power ON
1.
2.
3.
4.
Press MENU.
Press the Next 1/2 soft key.
Press the Others soft key.
Press the Start Mode(Power On) soft key to select ON or OFF.
6
7
Setting the Start/Stop Response Time
Waveform Acquisition
5.
4
Press the START/STOP Response Time soft key to select Quick or >1sec.
8
9
10
11
12
Explanation
13
Waveform Acquisition and Indicator Display
• Waveform acquisition is in progress when the RECORD indicator above the START/
STOP key is illuminated. The word “Running” is displayed at the lower left of the
screen.
• If the RECORD indicator above START/STOP is not illuminated, waveform acquisition
is stopped. The word “Stopped” is displayed at the lower left of the screen.
14
15
16
Operation When the Acquisition Mode Is Set to Averaging Mode
• Averaging is stopped when waveform acquisition is stopped.
• Averaging starts again when waveform acquisition is restarted.
17
START/STOP Operation during Accumulation
18
• Accumulation is suspended when acquisition is stopped.
• It is resumed when waveform acquisition is restarted.
App
Index
IM 701240-01E
7-1
7.1 Starting/Stopping Waveform Acquisition
Conditions When Waveform Acquisition Cannot Be Started or Stopped
• When the SL1400 is being controlled remotely via communications.
• While printing is in progress or during auto setup.
Waveform Acquisition Mode at Power ON
You can select whether to start the waveform acquisition at power on. For example,
select ON if you want to start the waveform acquisition when power supply recovers after
a power failure. The default setting is OFF.
ON: Starts waveform acquisition at power on.
OFF: Does not start the waveform acquisition at power on.
Response Time of the START/STOP Key
You can set whether the SL1400 responds immediately when START/STOP is pressed
or when the key is held down for at least 1 second.
Quick: Immediate response.
>1sec: Responds when the key is held down for at least 1 second.
Note
•
•
•
7-2
If you start the waveform acquisition after changing the waveform acquisition conditions
indicated below, the past data that is stored in the acquisition memory is cleared.
• Setup conditions on the ACQ menu
• Setup conditions of the module
• Input coupling of the 701261 (UNIVERSAL), 701262 (UNIVERSAL (AAF)), or 701265
(TEMP/HPV) (when a change is made between TC and some other setting) and the
thermocouple type setting (when measuring temperature)
• Input coupling of the 701275 (ACCL/VOLT) (when a change is made between ACCL and
some other setting) and the sensitivity setting (when measuring acceleration)
• FV and offset settings of the 701280 (FREQ)
• Trigger setup conditions
A snapshot function that keeps the current displayed waveform on the screen is also
available. You can update the display without stopping waveform acquisition (see section
8.7).
For a description of the behavior when the Start Mode (Power On) is ON or OFF, see
appendix 8.
IM 701240-01E
7.2
1
Setting the Acquisition Mode
<For a description of this function, refer to page 2-28.>
2
Procedure
1.
2.
3
Press MENU.
Press the ACQ soft key.
4
Setting the Acquisition Mode
3.
4.
Press the Mode soft key.
Press the Normal, Envelope, Average, or Box Average soft key.
5
You may not be able to select some modes depending on the trigger mode setting.
6
Setting the Acquisition Count
5.
Press the Count soft key.
You cannot set the acquisition count when the trigger mode is Single, Single (N), or Log.
6.
8
If the acquisition mode is Average and you set Count to Infinite, proceed to step 7.
Setting the Attenuation (When the acquisition mode is Average and Count
is Infinite)
7.
8.
7
Waveform Acquisition
Turn the jog shuttle to set the acquisition count. Pressing RESET resets the
count to Infinite.
Press the Weight soft key.
Turn the jog shuttle to set the attenuation.
9
10
11
12
13
14
15
16
17
18
App
Index
IM 701240-01E
7-3
7.2 Setting the Acquisition Mode
Explanation
Acquisition Mode
The acquisition modes below are available. The default setting is Normal.
• Normal Mode
Sampled data is stored in the acquisition memory without special processing.
• Envelope Mode
The maximum and minimum values are determined every acquisition interval from the
data sampled at 10 MS/s. The maximum and minimum values are stored to the
acquisition memory and an envelope waveform is displayed.
• Average Mode
Sampled data is averaged and stored to the acquisition memory. The averaging
method varies depending on the acquisition count setting.
If the acquisition count is set to Infinite, exponential averaging is performed. You are
required to set the attenuation (Weight).
If the acquisition count is set to a value in the range of 2 to 65536, simple averaging is
performed. The specified value is the average count.
• Exponential average
(when set to Infinite)
• Simple average (when set to
a value from 2 to 65536)
N
1
An =
{(N – 1)An–1 + Xn}
N
nth
An:
averaged value
Xn : nth measured value
N : Attenuation (2 to 256, 2n steps)
Σ Xn
AN =
n=1
N
nth
Xn :
measured value
N : Average count
(acquisition count, 2n steps)
You cannot use averaging mode when the trigger mode is Single, Single (N), or Log.
In addition, you cannot use averaging mode when realtime recording is in progress.
• Box Average Mode
For details, see section 7.3.
Note
For the procedure to switch the acquisition mode in Chart Recorder mode, see section 9.2.
Acquisition Count
Set the values in the range indicated below. If you set the value to Infinite, acquisition will
continue until you press START/STOP. The default value is Infinite. You cannot change
the acquisition count during measurement. The new value is activated when the
measurement is stopped.
Normal, Envelope, and Box Average: 2 to 65536 (in 1 step) and Infinite
Average:
2 to 65536 (in 2n steps) and Infinite
7-4
IM 701240-01E
7.2 Setting the Acquisition Mode
1
Notes on Averaging
• Averaging is effective only for repetitive waveforms.
• Correct averaging is not possible if the waveform has imperfect triggering (incomplete
synchronization). Thus, the displayed waveform will be distorted. When working with
this type of signal, set the trigger mode to Normal, so that the waveform display is
updated only when the trigger is activated (see section 6.1).
• Roll mode display is disabled during averaging.
• Averaging is not possible when the trigger mode is Single, Single (N), or Log.
• If you stop the waveform acquisition by pressing START/STOP, the averaging
process also stops. Averaging restarts from the beginning when acquisition resumes.
• If you are using simple averaging, the SL1400 terminates acquisition automatically
when the specified number of acquisitions (acquisition count) is completed.
• Averaging is not possible when realtime recording is in progress.
• When acquiring waveforms in averaging mode, the data that is retained in the history
memory is 1 record.
2
3
4
5
6
7
Waveform Acquisition
8
9
10
11
12
13
14
15
16
17
18
App
Index
IM 701240-01E
7-5
7.3
Acquiring Data Using Box Average
<For a description of this function, refer to page 2-29.>
Procedure
1.
2.
Press MENU.
Press the ACQ soft key.
Selecting Box Average Mode
3.
4.
Press the Mode soft key.
Press the Box Average soft key.
Explanation
When the input signal
is set to 50 kS/s
Voltage
This function is valid only on the 701250 (HS10M12) and 701255 (NONISO_10M12)
input modules.
At sample rates that allow box averaging, data is normally sampled at 10 MS/s and the
sampled data is decimated according to the record time and stored to the acquisition
memory. The internal sample rate is the same as the envelope mode.
When you use the box averaging function, moving average is computed on a given
number of data points (not simply decimating the sampled data), and the result is
sampled and stored to the acquisition memory.
1
2
••••
•
21
••• 20
•••••
36
Time
b
Voltage
Box averaged data
a
Time
7-6
IM 701240-01E
7.3 Acquiring Data Using Box Average
1
Number of Data Points on Which Moving Average Is Computed
Sample Rate (S/s)
Number of Data Points
10 M*
5M
2M
1M
500 k
200 k
100 k
50 k
20 k
10 k or less
1 point
2 points
4 points out of 5 points
8 points out of 10 points
16 points out of 20 points
32 points out of 50 points
64 points out of 100 points
128 points out of 200 points
256 points out of 500 points
256 points out of (10 M ÷ sample rate)
*
2
3
4
5
Same operation as the normal mode.
6
7
Waveform Acquisition
8
9
10
11
12
13
14
15
16
17
18
App
Index
IM 701240-01E
7-7
7.4
Acquiring Data Using the Sequential Store
Function (Single (N) Mode)
<For a description of this function, refer to page 2-29.>
Procedure
1.
2.
3.
4.
5.
6.
Press MENU.
Press the TRIGGER soft key.
Press the Mode soft key.
Press the Single(N) soft key to set the trigger mode to Single (N).
Press the Single(N) Count soft key.
Turn the jog shuttle to set Single(N) Count.
Explanation
You can use the sequential store function by setting the trigger mode to Single(N).
Acquisition Count (Single(N) Count)
Set a value between 1 and 2000.
However, the selectable acquisition count varies depending on the selected record
length and acquisition mode. For details, see appendix 3.
Displaying Waveforms
You can recall waveforms from memory in the same fashion as with the history memory
function. For details, see section 11.1.
Notes on When Using Sequential Store
If you stop the waveform acquisition by pressing START/STOP, sequential store also
stops. Sequential store restarts from the beginning when acquisition resumes.
7-8
IM 701240-01E
7.5
1
Realtime Recording to the Internal Hard Disk
(Option)
<For a description of this function, refer to page 2-31.>
2
3
CAUTION
4
5
6
7
Waveform Acquisition
• If the power is cut off when realtime recording is in progress, a disk area that
cannot be freed may result in the realtime recording area or damage may occur
to the internal hard disk.
If a disk area that cannot be freed results, the disk performance in the realtime
area may deteriorate. Consequently, realtime recording may not operate
properly. If this happens, back up the required data on the internal hard disk and
format the internal hard disk.
• Do not apply shock to the SL1400 when realtime recording is in progress.
Damage may occur to the internal hard disk, or the realtime recording may not
operate properly.
• The Real Time drive is a working area on the SL1400 internal hard disk for
realtime recording. Never delete files from the drive or add files to the drive from
an external PC such as by using the FTP server function. If you do, the realtime
recording may not operate properly.
8
9
Procedure
1.
2.
3.
Press MENU.
Press the ACQ soft key.
Press the RealTime Out soft key to select HD.
10
11
Note
The RealTime Out menu does not appear if Time Base is set to Ext.
12
Setting the Realtime Recording
4.
5.
6.
7.
8.
Press the RealTime Out Setup soft key. A setup dialog box opens.
Use the jog shuttle+SELECT to set Sequence to Single or Continue.
If you select Continue in step 5, use the jog shuttle+SELECT to set Count to a
value in the range of 2 to 128.
Use jog shuttle+SELECT to select the auto naming method from OFF,
Numbering, and Date.
As necessary, enter the File Name and Comment according to the procedures
given in section 4.2.
Press START/STOP to start the waveform acquisition. Realtime recording is
executed.
While realtime recording is executing,
15
17
is displayed in the upper left of the screen.
18
Aborting the Realtime Recording
10.
14
16
Executing the Realtime Recording
9.
13
Press START/STOP to stop the waveform acquisition. Realtime recording is
aborted.
App
Note
Index
If you stop the waveform acquisition by pressing START/STOP, realtime recording is aborted
even if it is within the specified recording time.
IM 701240-01E
7-9
7.5 Realtime Recording to the Internal Hard Disk (Option)
Explanation
The data can be recorded in realtime to the internal hard disk (option).
The internal hard disk consists of the following drives.
RealTime:
A drive for realtime recording. You can set the capacity of this drive in
the range of 30% to 70% of the entire capacity of the internal hard disk
(see section 13.6).
HD-0, HD-1:* A drive for saving various data.
*
HD-0 only if the internal hard disk is partitioned to 2; HD-0 and HD-1 if the internal hard disk is
partitioned to 3.
Waveforms That Are Realtime Recorded
All normal waveforms displayed on the screen are realtime recorded.
Possible Time Axis Range and Maximum Sample Rate for Realtime
Recording
Varies depending on the number of channels that are to be realtime recorded as follows:
Number of
Channels Used
Time Axis Range
Maximum Sample
Rate
12 or more
6 to 11
4 or 5
3
1 or 2
200 s to 30 days
1 min to 30 days
30 s to 30 days
20 s to 30 days
10 s to 30 days
5 kS/s
10 kS/s
20 kS/s
50 kS/s
100 kS/s
Sequence/Count
Single:
Acquisition is started by pressing START. When the specified record length is
reached, acquisition stops.
Continue: Acquisition is started by pressing START. When the specified record length is
reached, acquisition stops. This sequence is repeated the specified number
of times (count).
Trigger Mode for Realtime Recording
If you select Single, Auto or Log trigger modes are available. If you select Continue, only
Log is valid.
Auto: Acquisition is started by pressing START. If the specified record length is
exceeded, old data is overwritten. Acquisition continues until you press STOP.
Log:
Acquisition is started by pressing START. When the specified record length is
reached, acquisition stops.
7-10
IM 701240-01E
7.5 Realtime Recording to the Internal Hard Disk (Option)
Auto Naming
1
File names are automatically created during realtime recording. You can also enter
comments. The following three auto naming modes are available.
2
OFF
The file is assigned the name specified by File Name (up to 16 characters).
Numbering
3
Automatically creates files by attaching a four-digit number, 0000 to 4999, to the file
name. You can specify a common name (up to 4 characters, specified through File
Name) that is placed before the number.
4
Date
Automatically creates files using the date and time for the file names. (The file name
specified by File Name is void.)
Selecting Date is convenient for file management, because the file names do not
overlap.
Executing the Realtime Recording
5
6
7
Aborting the Realtime Recording
Waveform Acquisition
Press START/STOP to start the realtime recording. If the trigger mode is set to Auto,
acquisition continues until the next time you press START/STOP. If the trigger mode is
set to Log, the operation stops after recording the specified time.
8
9
If you stop the waveform acquisition by pressing START/STOP, realtime recording is
aborted even if it is within the specified recording time.
10
Saving and Loading the Waveform Data That Has Been Realtime Recorded
11
See section 13.15.
Notes on Realtime Recording
• Realtime recording is not possible when the acquisition mode is set to Average.
• During realtime recording, only the executing/aborting of the realtime recording, zoom
display setting, and protection function are valid.
• Cursor measurements and automated measurement of waveform parameters are
suspended while realtime recording is in progress.
• History memory waveforms, loaded waveforms, and computed waveforms cannot be
displayed while realtime recording is in progress.
• The following operations are possible on the data that is realtime recorded to the hard
disk (history memory function cannot be used).
• Cursor measurement and automated measurement of waveform parameters (up to
10 MW)
• Zooming on the Waveform
• Various computations
• X-Y waveform display (uses compressed data)
• Saving/Loading of waveform data
• Printer output
• When realtime recording to the internal hard disk, do not connect a PC to the SCSI
connector.
• Realtime recording is not possible when action-on-trigger is ON.
• Realtime recording is not possible if the record length is less than 1 MW.
• Key response slows down while realtime recording is in progress.
IM 701240-01E
7-11
12
13
14
15
16
17
18
App
Index
7.5 Realtime Recording to the Internal Hard Disk (Option)
• The maximum number of files that can be created in the realtime recording area of the
internal hard disk is 128. If the number of files reaches 128, delete unneeded files by
operating the SL1400. You can also copy the files to an area outside the realtime
recording area of the internal hard disk or to other storage media.
• If you specify a setting that exceeds the number of files that can be created in the
realtime recording area (for example, if Sequence is set to Continue and Count is set
to 30 when there are already 100 files in the realtime recording area), realtime
recording is not possible. In addition, realtime recording is not possible if there is not
enough free space in the realtime recording area.
• Zoom waveforms can be displayed using the ZOOM menu while realtime recording is
in progress. However, there is a limitation on the number of display points that can be
expanded depending on the record length.
7-12
Record Length
Number of Display Points That Can Expanded
1 MW to 10 MW
25 MW
50 MW
Record time in which the number of displayed points is 250 k or more
Record time in which the number of displayed points is 500 k or more
Record time in which the number of displayed points is 1 M or more
IM 701240-01E
7.6
Setting the Action When Waveform Display Is
Updated (Action-on-Stop)
<For a description of this function, refer to page 2-32.>
1
2
Procedure
1.
2.
3.
3
Press MENU.
Press the TRIGGER soft key.
Press the ACTION soft key.
4
Setting the Action
4.
5.
6.
7.
8.
Press the Sequence soft key to select Single or Continue.
Press the ACQ Count soft key.
Turn the jog shuttle to set the number of actions. Pressing RESET resets the
count to Infinite.
7
9
10
Setting the Execution Mode of the Action-on-Stop at Power ON
12.
13.
14.
15.
6
8
Setting the Number of Actions
9.
10.
11.
5
Waveform Acquisition
Press the Mode soft key. The Mode setup menu appears.
Press the On Stop soft key.
Press the Action soft key. The Action setup menu appears.
Use jog shuttle+SELECT to select the action to be enabled. (You can select
multiple actions.)
If you select Save to File in step 7, use the jog shuttle+SELECT to set the file
save format to Binary, ASCII, or Float. If you select Send Mail, use jog
shuttle+SELECT to set Mail Count.
Press MENU.
Press the Next 1/2 soft key.
Press the Others soft key.
Press the Action Mode (Power ON) soft key to select ON or OFF.
11
12
Executing Action-on-Stop
16.
Press START/STOP. Waveform acquisition is started, and action-on-stop is
executed. While action-on-stop is in execution,
is displayed in the upper left
of the screen. In addition, if the following action is specified, the following icon is
displayed at the upper left of the screen while the action is being executed.
Image/Save to File: Save destination medium (
PC card,
SCSI device,
internal HD,
network drive, or
USB storage
device)
Send Mail:
13
14
15
16
17
18
App
Index
IM 701240-01E
7-13
7.6 Setting the Action When Waveform Display Is Updated (Action-on-Stop)
Aborting Action-on-Stop
17.
Press START/STOP. Waveform acquisition is stopped, and action-on-stop is
aborted.
Explanation
Mode
The specified record length of data is acquired when measurement is started, and the
waveform is displayed. Then, the specified action is executed. In addition, the specified
action is also executed when measurement is stopped. When action-on-stop is enabled,
the trigger mode is set to Log.
Action
The following five types of actions are available.
Print the Screen Image Data (PRINT)
Prints the screen image on the printer (Printer (built-in printer), USB (USB printer), or
Net Print (network printer)) specified by Print to in the PRINT menu.
Save the Screen Image Data (Image)
Saves the screen image data to the destination (PC card, internal HD (optional), SCSI
device, or USB storage device) specified in the IMAGE SAVE menu.
Save Waveform Data (Save to File)
Saves the waveform data in binary, ASCII, or floating format to the destination (PC
card, internal HD (optional), SCSI device, or USB storage device) specified in the
FILE menu. The save format is synchronized to data type (see section 13.8) on the
FILE menu.
Buzzer
Sounds a buzzer.
Send Mail
Sends an e-mail message to a specified address (when Ethernet interface option is
installed). Set the number of mail transmissions in the range of 1 to 1000.
For the procedure to set the address, see section 15.5.
Note
If action-on-stop is executed, the data is acquired in Log mode regardless of the trigger mode
setting, and the specified action is carried out. The specified action is also carried out when the
measurement is stopped in the middle of the measurement.
Sequence and ACQ Count
Sequence
Single:
Continue:
Performs the action once.
Performs the action the number of times specified by ACQ Count.
ACQ Count
2 to 65536: Repeats the action the specified number of counts.
Infinite:
Repeats the action until waveform acquisition is stopped.
PRINT, Image, and Save to File Operations
Operates according to the settings in the PRINT, IMAGE, and FILE menus.
7-14
IM 701240-01E
7.6 Setting the Action When Waveform Display Is Updated (Action-on-Stop)
1
File Name When Action Is Set to Image or Save to File
If the Auto Naming of the IMAGE menu or the FILE menu is OFF, numbers are
automatically assigned to the file names. Otherwise, the file is saved using the specified
method.
For details, see section 13.8 or 13.12.
2
3
Send Mail Operation
4
Sends e-mail messages to the address specified by pressing MENU and selecting
Next 1/2 > Network > Mail Setup > Mail Address.
5
Setting the Execution Mode of the Action-on-Stop at Power ON (Action
Mode(Power On))
Notes When Using the Action-on-Stop
• Action-on-stop cannot be used if the acquisition mode is Average.
• You cannot change the settings while the action-on-stop is in progress.
• The action-on-stop operation may slow down if there is access from the network while
the following action is in progress.
Printing/saving of the screen image data and saving of the waveform data
• You cannot use action-on-stop when the realtime recording to the internal hard disk is
ON.
6
7
Waveform Acquisition
You can select whether to enable action-on-stop at power-on. Turn this ON if you want to
continue the action-on-stop operation after a power failure.
ON: At power ON, the action-on-stop is set to the mode that was used when the
power was turned OFF.
OFF: Action Mode is turned OFF at power ON.
The default setting is OFF.
8
9
10
11
12
Notes When Action Is Set to Image or Save to File
• Do not specify the root directory of the medium as the save destination directory.
(Only up to 512 files can be saved to the root directory of a medium that has been
formatted using the SL1400.)
• The maximum number of files that can be created in a single directory is 5000. Do not
place files in the save destination folder before starting the action-on-stop operation.
• If you select Image and Save to File simultaneously, separate the folders specified by
the IMAGE menu and the FILE menu.
• If you select Numbering for the file name assignment method (Auto Naming) in the
IMAGE menu and the FILE menu, the creation of files takes an extended period when
the number of saved files becomes large. When creating more than 2000 files, select
Date for Auto Naming.
• When 5000 files are saved, the action-on-stop operation ends.
13
14
15
16
17
18
App
Index
IM 701240-01E
7-15
7.7
Backing Up the Acquisition Memory
<For a description of this function, refer to page 2-32.>
The data held in the acquisition memory can be backed up immediately before the power is shut
down even if the power supply is cut off due to reasons such as a sudden power failure.
Data That Is Backed Up
• Waveform data
• History memory data
Backup Batteries
Types of Batteries That Can Be Used
• AAA alkaline dry cells (AA/R6) (JIS, IEC model: LR6):
• Nickel hydride rechargeable batteries:
4 cells
4 cells
Loading the Batteries
The battery storage box is located on the right side of the top panel.
1.
Lift the handle and remove the screws from the battery storage box using a screwdriver.
2.
Remove the storage box cover, and insert four batteries while paying attention
to their direction.
3.
Set the storage box cover back to the original place and fasten the screws.
Acquisition memory backup battery box
Acquisition memory
backup switch
ON
OFF
ACQ
MEMORY
BACKUP
Backup Procedure
1.
2.
Turn ON the ACQ MEMORY BACKUP switch on the right side panel of the
SL1400. The acquisition memory backup starts.
To stop the acquisition memory backup, turn OFF the ACQ MEMORY BACKUP
switch.
The time needed to back up the acquisition memory varies depending on the
operating environment. See section 18.5.
Note
•
•
•
7-16
When using the nickel hydride rechargeable batteries, be sure to charge them before use.
(The SL1400 does not have a charge function.)
You cannot check the battery level on the SL1400. Use a commercially sold battery level
checker or the like.
For a description of the backup operation, see appendix 8.
IM 701240-01E
Chapter 8
Waveform Display and Information Display
8.1
Changing the Display Format
1
<For a description of this function, refer to page 2-32.>
2
Procedure
1.
3
Press DISPLAY.
Setting the Display Format
2.
3.
4
Press the Format soft key.
Press one of the soft key from 1 Zone to 16 Zone to select the format.
5
Setting the Waveform Mapping
4.
5.
6.
7.
Press the Next 1/2 soft key.
Press the Mapping soft key to select Auto, Fixed, or User. If you select User,
proceed to step 6.
Press the Set Mapping soft key. The waveform mapping setup menu appears.
Use jog shuttle+SELECT to set the mapping number of each channel.
When Mapping is set to User
6
7
8
Waveform Display and Information Display
9
10
11
12
13
14
15
16
17
18
App
Index
IM 701240-01E
8-1
8.1 Changing the Display Format
Explanation
You can select the number of zones into which the analog waveform display window is
divided. The position of the waveform of each channel varies depending on the display
format.
Display Format
1 Zone
3 Zone
8 Zone
2 Zone
4 Zone
16 Zone
Waveform Mapping
• Auto
Zones are arranged from top to bottom in order: CH1, CH2, ... , CH16, Math1 to
Math8. But no zones are shown for channels whose display is set to OFF.
• Fixed
Channels are that are set to OFF are also mapped.
• User
Assign numbers from 0 to 7 to CH1, CH2, ... , CH16, Math1 to Math8. The display
position varies depending on the assigned number.
Mapping Example When Display Format Is 2 Zone
CH1,
CH2, CH4
Fixed
(When CH6 to CH16 = OFF)
CH1, CH4
CH2,
Auto
(When CH3, CH5 to CH16 =
OFF)
0, 2, 4
1, 3, 5
User
(When CH3, CH5 to CH16 =
OFF)
The number of points that can be displayed in the waveform display area varies
depending on the display format as shown below. The vertical resolution remains
unchanged.
1 Zone ( ): 512 points
2 Zone ( ): 256 points
3 Zone ( ): 170 points
4 Zone ( ): 128 points
8 Zone ( ): 64 points
16 Zone ( ): 32 points
8-2
IM 701240-01E
8.2
Setting the Display Interpolation Method
1
<For a description of this function, refer to page 2-33.>
2
Procedure
1.
2.
3.
3
Press DISPLAY.
Press the Interpolation soft key. The interpolation selection menu appears.
Press one of the soft keys from OFF, Sine, or Line.
4
If the display mode is X-Y or T-Y&X-Y, press the Next 1/2 soft key to display the
Interpolation menu.
5
6
7
8
Waveform Display and Information Display
9
Explanation
10
Interpolation
Any area along the time axis having less than 1000 points in 10 divisions (less than 500
points in the Z1 and Z2 window when displaying Main&Z1&Z2) is recognized as an
interpolation area. If you leave interpolation off, these points will appear as discrete dots
(so that the display will show gaps between dots or vertical lines).
If you set interpolation on, the SL1400 will connect the points. Three following
interpolation methods are available.
Sine (
):
Interpolates between two points using the sin(x)/x function.
Line (
):
Linearly interpolates between two points.
OFF (
):
No interpolation.
11
12
13
14
• When the Area Is an Interpolation Area
15
Interpolate :
OFF
Sine
16
Line
• When the Area Is Not an Interpolation Area
If interpolation is set to Sine or Line, the instrument draws lines between points that
are aligned vertically. If the number of data points is greater than or equal to 2002, PP compression is performed (maximum and minimum values are determined at
certain intervals), and two points are displayed on a single vertical line (1 raster).
17
18
App
Interpolate :
IM 701240-01E
OFF
Index
Sine/Line
8-3
8.2 Setting the Display Interpolation Method
Number of Data Points Used for Waveform Display
When the area is not an interpolation area on the T-Y waveform display and Interpolation
is set to Sine or Line, the aforementioned P-P compressed values are displayed.
However, if Interpolation is set to OFF or if X-Y waveforms are being displayed, the
acquisition data is decimated, and data that has been picked up at certain intervals are
displayed. The number of data points used to display the waveform is 100 k.
If the record length is greater than or equal to 100 kW, the data is decimated to 100 kW,
and 100 points are displayed on a vertical line. Otherwise, all points are displayed.
If the number of data points per division is greater than or equal to 100 for a realtime
recorded waveform or when in roll mode, the maximum and minimum values at certain
number of data points of acquisition data are displayed using linear interpolation.
Data Interpolation and Envelope Mode
When the acquisition mode is envelope, the data is interpolated using an area regardless
of the specified interpolation method (see the following figure). This is because in
envelope mode the maximum and minimum values are determined over a certain
interval, and the data time position cannot be pinpointed.
True data
8-4
IM 701240-01E
8.3
Changing the Graticule
1
<For a description of this function, refer to page 2-33.>
2
Procedure
1.
2.
3
Press DISPLAY.
Press the Graticule soft key to select the graticule.
If the display mode is X-Y or T-Y&X-Y, press the Next 1/2 soft key to display the Graticule
menu.
4
5
6
7
8
Waveform Display and Information Display
9
Note
The graticule setting is linked to the RECORD COND menu > Print Setup > Graticule Type
setting. However, if
is selected, OFF is selected in the RECORD COND menu.
10
11
Explanation
Select the graticule from the following three types.
12
13
14
15
16
17
18
App
Index
IM 701240-01E
8-5
8.4
Accumulated Waveform Display
<For a description of this function, refer to page 2-33.>
Procedure
1.
Press DISPLAY.
Setting the Accumulate Mode
2.
3.
Press the Accumulate soft key. The accumulate mode selection menu appears.
Press the OFF or Persist soft key to select the accumulate mode.
If you select Persist, proceed to step 4.
Setting the Accumulate Time
4.
Turn the jog shuttle to set the Count in the range of 2 to 128 (2n steps).
Explanation
Normally, the display is updated every time a trigger is activated making it difficult to
capture transient conditions such as sudden distortion of waveforms. By using the
accumulate function, the waveform display of the acquired data remains on the screen
for the specified time.
Accumulate Mode
Persist: Persistence mode. Waveforms are accumulated in red. Waveforms are
displayed for the specified time period by gradually lowering the brightness.
Accumulate Time (Count)
When using persistence mode, set the number of times to accumulate the waveforms in
the range of 2 to 128 (in 2n steps). If you select Infinite, the accumulation is carried out
infinitely. The default value is 16.
8-6
IM 701240-01E
8.4 Accumulated Waveform Display
1
Notes on Accumulation
• Automated measurement of waveform parameters is performed on the most recent
waveform.
• When printing accumulated waveforms using the built-in printer, they are printed using
two tones.
• If the waveform acquisition is forcibly stopped by pressing START/STOP, the
accumulation is temporarily suspended. When the acquisition is restarted, the display
is cleared and accumulation continues.
• You cannot change the parameters on the HISTORY menu when accumulating
waveforms on the display.
• Accumulated display is not possible in roll mode display.
• When you turn OFF the accumulate mode, accumulated waveforms are cleared. To
display the acquired waveforms again, specify the record number on the HISTORY
menu.
• If you display the waveforms again by setting the accumulate mode to Persist, the
accumulated waveforms are not cleared. To clear them, execute clear trace.
• Even if you change the display format during accumulated display, the waveforms that
are already displayed accumulated are not cleared. To clear them, execute clear
trace.
2
3
4
5
6
7
8
Waveform Display and Information Display
Clearing Accumulated Waveforms
9
You can clear accumulated waveforms by pressing CLEAR TRACE.
10
11
12
13
14
15
16
17
18
App
Index
IM 701240-01E
8-7
8.5
Zooming and Auto Scrolling the Waveform
<For a description of this function, refer to page 2-34.>
Procedure
1.
Press ZOOM.
Zooming on the Waveform
Selecting the Display Mode
2.
3.
Press the Mode soft key. The display mode selection menu appears.
Press the soft key corresponding to the desired mode.
If you select Main, you cannot carry out the following operations.
Selecting the Display Format of Zoomed Waveforms
4.
Press the Format soft key. The format selection menu appears.
If you set Mode to Main in step 3, the format selection menu is not displayed.
5.
Press the soft key corresponding to the desired format.
Setting the Waveform to Be Zoomed
6.
7.
Press the Allocation soft key. The menu for setting the waveform to be zoomed
appears.
Use jog shuttle+SELECT to select the waveform to be zoomed.
Select All ON to select all waveforms that are currently displayed.
Setting the Zoom Rate
8.
Press the Z1 Mag/Z2 Mag soft key to set the jog shuttle control to Z1 Mag.
If you set Mode to Z1, Z1 Mag is displayed. If you select Z2, Z2 Mag is displayed. If you
select Z1 and Z2, the Z1 Mag and Z2 Mag menu is displayed.
9.
10.
Turn the jog shuttle to set the zoom ratio of the Z1 zoom box.
Likewise, set the zoom rate of the Z2 zoom box with Z2 Mag.
By setting the jog shuttle control to both Z1 Mag and Z2 Mag, the zoom rate of both Z1
and Z2 can be set simultaneously.
Setting the Zoom Position
11.
Press the Z1 Position/Z2 Position soft key to set the jog shuttle control to Z1
Position.
If you set Mode to Z1, Z1 Position is displayed. If you select Z2, Z2 Position is displayed. If
you select Z1 and Z2, the Z1 Position and Z2 Position menu is displayed.
12.
13.
Turn the jog shuttle to set the zoom position of the Z1 zoom box.
Likewise, set the zoom position of the Z2 zoom box with Z2 Position.
By setting the jog shuttle control to both Z1 Position and Z2 Position, the zoom positions of
both Z1 and Z2 can be moved simultaneously.
8-8
IM 701240-01E
8.5 Zooming and Auto Scrolling the Waveform
1
2
3
4
5
When Mode Is Set to Main&Z1, Main&Z2, Z1 Only, and Z2 Only in Step 3
Change the Range of the Automated Measurement of Waveform Parameters
14.
15.
Press the Next 1/2 soft key.
Press the Fit Meas Range to Z1 or Fit Meas Range to Z2 soft key.
7
The range of the automated measurement of waveform parameters is set to the zoom
range of Z1 or Z2.
8
Moving the Zoom Box to the Most Recent Position of the Waveform
Press the Move Z1 to Front or Move Z2 to Front soft key.
9
The zoom box moves to the most recent position of the waveform.
When Mode Is Set to Main&Z1&Z2 or Z1&Z2 in Step 3
Change the Range of the Automated Measurement of Waveform Parameters
14.
15.
16.
10
Press the Next 1/2 soft key.
Press the Fit Meas Range soft key.
Press the Fit to Z1 or Fit to Z2 soft key.
11
The range of the automated measurement of waveform parameters is set to the zoom
range of Z1 or Z2.
12
Moving the Zoom Box to the Most Recent Position of the Waveform
17.
18.
Waveform Display and Information Display
16.
6
13
Press the Move to Front soft key.
Press the Z1 to Front or Z2 to Front soft key.
The zoom box moves to the most recent position of the waveform.
14
Menu example when Mode is set to Main&Z1&Z2 or Z1&Z2
15
16
17
18
App
Index
IM 701240-01E
8-9
8.5 Zooming and Auto Scrolling the Waveform
Auto Scroll
8.
Press the Auto Scroll soft key.
Selecting the Scroll Direction
9.
Press the Direction soft key to set the scroll direction.
Setting the Display Position of the Search Result Window
(When Mode Is Set to Main&Z1&Z2 or Z1&Z2 in Step 3)
10.
Press the Result Window soft key to select Z1 or Z2.
Setting the Scroll Speed
11.
Press the Speed soft key and turn the jog shuttle to set the scroll speed in the
range of 1 to 10.
Executing the Scroll Operation
12.
8-10
Press the Exec soft key. The zoom box automatically moves, and the zoom
position changes. While the scroll operation is in progress, the Exec soft key
changes to the Abort soft key. Press the Abort soft key to abort the scroll
operation.
IM 701240-01E
8.5 Zooming and Auto Scrolling the Waveform
1
Explanation
Zooming on the Waveform
Zoomed waveforms of two locations can be displayed simultaneously (dual zoom). You
can also specify which channels to zoom. Zooming is not possible if the number of
displayed points on the screen is less than or equal to 10 (less than or equal to 50 for
FFT waveforms).
3
Display Mode of Zoomed Waveforms
4
Main:
Z1 Only:
Z2 Only:
Main&Z1:
5
Zoomed Trace (Allocation)
The traces whose Allocation is turned ON are zoomed. If the allocation is OFF, the trace
is not zoomed. You cannot allocate channels whose display is turned OFF.
As with the normal waveform, six display formats (Main*, 1 Zone, 2 Zone, 3 Zone, 4
Zone, 8 Zone, and 16 Zone) are available. You cannot set different formats for Z1 and
Z2.
Selecting Main results in the same format as Main Format in the DISPLAY menu.
• Sets the record time that is displayed in the zoom box.
• If the time base is set to an external clock signal, select the magnification from the
following:
×2, ×2.5, ×5, ×10, ×25, ×50, ×100, ×250, ×500, ×1000, ×2500..., ten-fold multiples of1,
2.5, 5, up to ×1000000
• The maximum zoom rate varies depending on the display record length.
Maximum zoom rate: Display record length ÷ 10
• The maximum magnification during realtime recording with respect to the record
length of the main waveform is as follows:
Record Length of the Zoom Window
1 M or 10 MW
25 MW
50 MW
1000 MW or more
250 kW
500 kW
1 MW
2.5 MW
8
9
10
12
13
Zoom Rate (Z1 Mag/Z2 Mag)
Main Waveform Record Length
7
11
Display Format of Zoomed Waveforms
*
6
Waveform Display and Information Display
Displays only the main (unzoomed) waveform.
Displays only the zoomed waveform of zoom box Z1.
Displays only the zoomed waveform of zoom box Z2.
Displays the main waveform in the top window and zoomed waveform of
zoom box Z1 in the bottom window.
Main&Z2:
Displays the main waveform in the top window and zoomed waveform of
zoom box Z2 in the bottom window.
Z1&Z2:
Displays the zoomed waveform of zoom box Z1 in the top window and the
zoomed waveform of zoom box Z2 in the bottom window.
Main&Z1&Z2: Displays the main waveform in the top window, the zoomed waveform of
zoom box Z1 in the lower left window and the zoomed waveform of zoom
box Z2 in the lower right window.
14
15
16
17
18
App
• For details on the record length, see appendix 1.
• You can set different zoom rates for Z1 and Z2 (zoomed waveform of two locations).
IM 701240-01E
2
8-11
Index
8.5 Zooming and Auto Scrolling the Waveform
Zoom Position (Z1Position and Z2Position)
• The zoom position can be set by specifying the zoom center position (center of the
zoom box) in the range of –5 to +5 divisions with the center of the waveform display
area set to 0 division. The resolution is as follows:
Selectable steps of zoom position: Record time × 10 ÷ display record length
• The zoom box enclosed by solid lines is Z1, and the one enclosed by dashed lines is
Z2. Since each box is independent, you can set the position separately.
Changing the Range of the Automated Measurement of Waveform
Parameters (Fit Meas Range to Z1/Fit Meas Range to Z2)
Set the range of the automated measurement of waveform parameters to the zoom
range of Z1 or Z2. This setting is effective even when the automated measurement of
waveform parameters is turned OFF.
Moving the Zoom Box to the Most Recent Position of the Waveform (Z1 to
Front/Z2 to Front)
Moves the zoom box of Z1 or Z2 to the most recent position (right end) of the main
waveform.
Auto Scroll
The zoom box automatically moves (scrolls) in the specified direction. You can scroll
while viewing the expanded waveform.
Scroll Direction
Set the scroll direction to << (left) or >> (right).
Display Position of the Search Result Window
When the zoom mode is Main&Z1&Z2 or Z1&Z2, you can select the window, Z1 or Z2,
that will display the searched waveform.
Scroll Speed
Set the scroll speed using 10 levels from 1 to 10. The speed increases as the number
gets larger.
Note
•
•
8-12
Auto scroll is not possible while the data acquisition is in progress.
You can only change the Direction and Speed while auto scroll is in progress.
IM 701240-01E
8.6
Displaying X-Y Waveforms
1
<For a description of this function, refer to page 2-35.>
2
Procedure
1.
3
Press DISPLAY.
Selecting the Display Mode
2.
3.
4
Press the Mode soft key. The mode selection menu appears.
Press one of the soft keys from T-Y, X-Y, and T-Y&X-Y to set the mode.
5
Selecting the X Axis Mode (When Mode Is Set to X-Y or T-Y&X-Y)
4.
Press the X Axis soft key to select Single or Quad.
6
If you select Single proceed to step 7; if you select Quad proceed to step 5.
5.
6.
Press the Select soft key. The X-Y waveform selection menu appears.
Press the soft key corresponding to the desired X-Y waveform from XY1 to XY4.
Setting the X-Axis
Press the X Trace soft key. The channel selection menu appears.
Use jog shuttle+SELECT to set the channel to assign to the X-axis. If you set X
Axis to Quad, proceed to step 10.
Setting the Y-Axis (When X Axis Is Set to Quad)
9.
8
Waveform Display and Information Display
7.
8.
7
9
10
As with the X axis, press the Y Trace soft key to set the Y axis.
11
12
13
14
When X Axis is set to Quad
15
When X Axis is set to Quad
16
17
18
App
Index
IM 701240-01E
8-13
8.6 Displaying X-Y Waveforms
Setting the Display Range
10.
11.
12.
Press the Start Point/End Point soft key to set the jog shuttle control to Start
Point.
Turn the jog shuttle to set the start point of the X-Y waveform display.
Likewise, press the Start Point/End Point soft key to set the jog shuttle control
to End Point and set the end point of the X-Y waveform display.
Explanation
X-Axis Mode
Single:
Quad:
The X-axis is set to a common trace, and the Y-axis displays all the waveforms
whose display is turned ON.
The X-axis trace and Y-axis trace are set individually for XY1 to XY4.
Assigning X (Horizontal) and Y (Vertical) Axes (When X Axis Is Set to
Quad)
The channels that are assigned to the X and Y axes depending on the X-axis mode are
as follows:
X-Axis Mode
X-Y Waveform
Single
Quad
XY1
XY2
XY3
XY4
X-Axis
Y-Axis
CH1 to CH16 and
Math1 to Math8
All channels that are turned
ON
CH1 to CH8, Math1 to
Math4
CH1 to CH8, Math1 to
Math4
CH9 to CH16, Math5 to
Math8
CH9 to CH16, Math5 to
Math8
CH1 to CH8, Math1 to
Math4
CH9 to CH16, Math5 to
Math8
CH1 to CH8, Math1 to
Math4
CH9 to CH16, Math5 to
Math8
Number of X-Y Waveforms That Can Be Displayed
The number of X-Y waveforms that can be displayed is 16 for Single and 4 for Quad.
The display of each X-Y waveform is turned ON/OFF by turning the Y-axis trace display
ON/OFF.
Display Mode
You can select from the following three display modes.
T-Y&X-Y: The top window displays T-Y (normal) waveforms. The bottom window
displays X-Y waveforms.
X-Y:
Displays only X-Y waveforms.
T-Y:
Displays only T-Y waveforms.
8-14
IM 701240-01E
8.6 Displaying X-Y Waveforms
Number of Data Points to Be Used for Waveform Display
1
Same as “Number of Data Points to Be Used for Waveform Display” described in section
8.2.
See section 8.2.
2
X-Y Waveform Display Range (Start Point/End Point)
3
The X-Y display shows the range selected on the T-Y waveform.
You can set the start (fine dashed line) and end (coarse dashed line) positions in the
range of –5 to +5 divisions from the center of the waveform display frame. The start and
end points are not displayed if only X-Y waveforms are displayed.
The resolution is as follows:
Resolution: Record time ÷ record length
4
5
6
Notes on Displaying X-Y Waveforms
7
8
Waveform Display and Information Display
• The divided windows of the T-Y waveform display when using the T-Y & X-Y mode
are displayed according to Format in the DISPLAY menu.
• The zoom function applies only to T-Y waveforms. In addition, Main, Z1, or Z2 can be
selected for the T-Y waveform.
• To expand the X-Y waveform, change Upper and Lower settings or V Zoom of each
channel. The displayed waveform can be expanded/reduced.
• To change the display position of the X-Y waveform, change the position of each
channel. (For voltage input)
• X-Y waveform is not displayed when the horizontal axis of a waveform trace is in units
of time and the horizontal axis of another waveform trace is in units of frequency.
• Logic waveforms are not applicable to X-Y waveform display.
9
10
11
12
13
14
15
16
17
18
App
Index
IM 701240-01E
8-15
8.7
Taking Snapshots and Clearing Traces
<For a description of this function, refer to page 2-35.>
Procedure
Snapshot
Press SNAPSHOT to take a snapshot of the screen.
Clear Trace
Press CLEAR TRACE while the waveform acquisition is stopped. The waveform is
cleared.
Explanation
Snapshot
The snapshot function leaves the current displayed waveform on the screen. This
function allows the current displayed waveform to remain temporarily on the screen
(snapshot waveform) without requiring waveform acquisition to stop. It is useful when
you want to compare waveforms.
You cannot perform the following operations on snapshot waveforms.
• Cursor measurements and automated measurement of waveform parameters
• Zoom and computation
• Position movement
• X-Y waveform display
You can save and load snapshot waveforms. See section 13.10.
Clear Trace
Clears all the waveforms that are currently displayed on the screen. However, this does
not apply in X-Y Recorder mode (see section 9.1).
Loaded waveforms are also cleared.
When you restart the waveform acquisition, the waveforms in the acquisition memory are
cleared.
Note
The data corresponding to the waveforms that have been cleared by executing clear trace
remains in the history memory. You can display the waveform again by selecting the desired
waveform record using Select Record on the HISTORY menu.
Conditions When SNAP SHOT and CLEAR TRACE Cannot Be Used
• When engaging remote mode using the communication interface.
• When printing
• During auto setup
8-16
IM 701240-01E
8.8
Turning ON/OFF the Translucent Display
1
<For a description of this function, refer to page 2-35.>
2
Procedure
1.
2.
3.
3
Press DISPLAY.
Press the Next1/2 soft key.
Press the Translucent soft key to select ON or OFF.
4
5
6
7
8
Waveform Display and Information Display
9
Explanation
When this is turned to ON, the popup menu becomes translucent. The contents
underneath the popup menu can be seen.
Translucent: OFF
10
Translucent: ON
11
12
13
14
15
16
17
18
App
Index
IM 701240-01E
8-17
8.9
Turning the Scale Value Display ON/OFF
<For a description of this function, refer to page 2-36.>
Procedure
1.
2.
3.
Press DISPLAY.
Press the Next 1/2 soft key.
Press the Scale Value soft key to select ON or OFF.
Scale value
Explanation
You can turn ON/OFF the upper and lower limits of the vertical and horizontal axes of
each channel and the scale value display corresponding to the upper and lower limits.
Note
The scale values are displayed to the left of the waveform display area. If the scale values do not
fit in the section left of the waveform display area, they are displayed on the right side of the
waveform display area.
8-18
IM 701240-01E
8.10 Setting Waveform Labels
1
<For a description of this function, refer to page 2-36.>
2
Procedure
Setting the Waveform Label
1.
2.
3
Press CH.
Press one of the soft keys from CH1 to CH16, Logic A, and Logic B.
4
For the displayed menus when this operation is executed, see section 5.1.
3.
4.
Press the Next 1/2 soft key.
Press the Label soft key to display a keyboard, and enter the waveform label
according to the procedure given in section 4.2.
6
Turning the Waveform Labels ON/OFF
5.
6.
7.
5
Press DISPLAY.
Press the Next 1/2 soft key.
Press the Trace Label soft key to select ON or OFF.
7
8
Waveform Display and Information Display
9
10
11
12
Explanation
13
Waveform Label
• You can arbitrary set the waveform label of each channel using up to eight characters.
• The labels are applied to waveform labels, scale values, and cursor measurement
values. However, only the first 5 characters are displayed when displaying the cursor
measurement values.
• In Recorder mode, a function called “Channel Label” is available for printing the
waveform label specified here. See section 9.3.
14
15
16
Turning ON/OFF the Waveform Labels (Trace Label)
You can select whether to display labels corresponding to the displayed waveforms.
17
Note
If the waveform display area is small due to the display format setting or zoom format, waveform
labels may not be displayed.
18
App
Index
IM 701240-01E
8-19
8.11 Turning the Extra Window ON/OFF
<For a description of this function, refer to page 2-36.>
Procedure
1.
2.
3.
4.
Press DISPLAY.
Press the Extra Window soft key. The extra window selection menu appears.
Press the ON or OFF soft key.
If you select ON, use the jog shuttle to set the height of the extra window in the
range of 0 to 8.
If the display mode is X-Y or T-Y&X-Y, press the Next 1/2 soft key to display the Extra
Window menu.
Explanation
An extra window is provided to display information other than waveforms when
waveforms obscure the information in the display area. The following two types of
information can be displayed in the extra window.
• Cursor measurement values
• Automated measured value of waveform parameters
Example of Cursor Measurement Values
Extra window
(Displays cursor measurement values)
8-20
IM 701240-01E
8.11 Turning the Extra Window ON/OFF
1
Number of Points Displayed Vertically When Extra Window Is ON
When the extra window is turned ON, the vertical axis size of the waveform display
window is reduced according to the Height setting. The vertical resolution does not
change, but the number of displayed points varies as follows.
Height setting = 8:
384 points
Height setting = 7:
400 points
Height setting = 6:
416 points
Height setting = 5:
432 points
Height setting = 4:
448 points
Height setting = 3:
464 points
Height setting = 2:
480 points
Height setting = 1:
496 points
Height setting = 0:
512 points
(When display format is set to Single)
2
3
4
5
Note
Use of the extra window together with certain zoom formats may cause scale values to overlap
making them difficult to be read.
6
7
8
Waveform Display and Information Display
9
10
11
12
13
14
15
16
17
18
App
Index
IM 701240-01E
8-21
8.12 Turning the Level Indicator Display ON/OFF
<For a description of this function, refer to page 2-36.>
Procedure
1.
2.
3.
Press DISPLAY.
Press the Next 1/2 soft key.
Press the Level Indicator soft key to select ON or OFF.
Explanation
Level Indicator
The level of each waveform is displayed using an indicator to the right of the waveform
display area.
Level indicator
8-22
IM 701240-01E
8.13 Displaying Channel Information/Displaying
Waveforms on a Full Screen (Expanding the
Waveform Display Area)
1
2
<For a description of this function, refer to page 2-36.>
Procedure
3
Displaying the Channel Information
1.
Press ESC while the setup menu is displayed. The setup menu displayed on the
right side of the screen disappears, and the key information about the channel
(CH1 to CH16) whose display is turned ON is displayed.
Displaying the Numeric Monitor
2.
Press ESC on the screen showing the channel information. The channel
information disappears, and the numeric monitor of the channels (CH1 to CH16,
Logic A, and Logic B) whose display is turned ON is displayed.
Press SELECT in step 1, 2, or 3. If there is a parameter under jog shuttle control
in the setup menu that was cleared immediately before you pressed the ESC
key, the parameter is displayed at the upper right of the screen and can be set
using the jog shuttle.
Press ESC to clear the parameter display.
Setup menu
(A)
(B)
Channel information
(C)
ESC
ESC
Numeric
monitor
*
14
ESC
15
*
(D)
ESC
ESC
Full screen display of the waveform
IM 701240-01E
11
13
SELECT
(C)
(D)
10
12
*
(B)
8
9
Immediately Before Pressing the ESC Key
5.
6
Waveform Display and Information Display
Press ESC on the screen showing the numeric monitor. The numeric monitor
disappears, and the waveform display area is expanded horizontally.
If you press ESC again, the channel information is displayed.
Displaying the Parameter That Was Controlled by the Jog Shuttle
4.
5
7
Expanding the Waveform Display Area
3.
4
* If there are two parameters in a single setup menu
such as the Z1 Position and Z2 Position settings of
the zoom rate (see section 8.5), the parameter
controlled by the jog shuttle switches each time
you press SELECT.
The jog shuttle icon ( or ) is usually white, but
it sometimes turns yellow. Yellow indicates that
two parameters are selected simultaneously
(controlled by the jog shuttle).
Taking Z1 Position and Z2 Position as an example,
pressing SELECT once selects Z1 Position.
Pressing SELECT again selects Z2 Position.
Pressing SELECT once more turns the icon yellow
and Z1 Position and Z2 Position are controlled by
the jog shuttle. If you press SELECT yet again, the
icon returns to a white color, and the jog shuttle
controls only Z1 Position.
8-23
16
17
18
App
Index
8.13 Displaying Channel Information/Displaying Waveforms on a Full Screen (Expanding the Waveform
Display Area)
Note
•
•
Each time you press the ESC key, the display switches cyclically as follows: channel
information display → numeric monitor display → full screen display of waveforms full →
channel information display.
When the SL1400 receives communication commands, the screen switches to channel
information display.
Explanation
Displaying the Channel Information
Pressing ESC once when the setup menu is displayed clears the channel information of
the channel (CH1 to CH16) whose display is turned ON. The parameters displayed in the
channel information are as follows: However, not all parameters may be displayed when
the number of displayed channels increases.
• When measuring voltage:
Voltage range setting, input coupling, probe
attenuation (type), and bandwidth limit.
• When measuring temperature:
Temperature setting, thermocouple type, and
bandwidth limit.
• When measuring strain:
µSTR (or [mV/V]) setting, measurement range, and
bandwidth limit
• When measuring acceleration:* Acceleration setting, gain, input coupling, and bias
setting.
• When measuring the frequency:* Value/div setting, measurement mode setting, and
preset setting.
*
Some parameters may not be displayed depending on the amount of information present.
Displaying the Numeric Monitor
The channel information clears when you press ESC once when the channel information
is displayed, and the numeric monitor of the channels (CH1 to CH16, Logic A, and Logic
B) whose display is turned ON is displayed. The update interval of the numeric monitor is
approximately 1 s.
Note
Notation of the Numeric Monitor of Logic Waveforms
The numeric monitor of logic waveforms (Logic A or Logic B) is displayed in binary or
hexadecimal notation.
Select the notation by carrying out the following procedure.
Press CURSOR > Type soft key > Vertical soft key, press the Logic Setup soft key that appears
when Trace is set to All, LogicA, LogicB, or LogicA & LogicB, and set Format to Binary or Hexa.
See section 11.4.
• Binary
• Hexadecimal
Expanding the Waveform Display Area
Pressing the ESC key once when the numeric monitor is displayed clears the numeric
monitor and expands the waveform display area horizontally to cover the entire screen.
The waveform display area is expanded at power up.
Displaying the Parameter That Was Controlled by the Jog Shuttle
Immediately Before Pressing the ESC Key
If the channel information is displayed or the waveform display area is expanded and there is a
parameter under jog shuttle control in the setup menu* that was cleared immediately before you
pressed the ESC key, the parameter is displayed at the upper right of the screen and can be set
using the jog shuttle. To clear the display of the parameter, press the ESC key.
*
8-24
ZOOM, CURSOR, MEASURE, and HISTORY menus as well as the X-Y mode menu under
DISPLAY
IM 701240-01E
Chapter 9
Recording in Recorder Mode
9.1
1
Selecting the Recorder Mode
<For a description of this function, refer to page 2-37.>
2
Procedure
3
Note
If you change the recorder mode by carrying out the procedure in this section, the acquired
waveform data is cleared. Be sure to save data that you need before changing the recorder
mode. For the procedure to save the data, see chapter 13.
1.
2.
4
Press MODE to display the mode selection menu.
Press the Chart Recorder or X-Y Recorder soft key.
5
If you change the recorder mode to a different mode, the acquired waveform data is
cleared. Be sure to save data that you need before changing the recorder mode. For the
procedure to save the data, see chapter 13.
6
7
8
9
If Chart Recorder Is Selected
Recording in Recorder Mode
Then, configure the respective recorder mode.
10
Continue with the procedures described in sections 9.2 to 9.5.
If X-Y Recorder Is Selected
11
Continue with the procedures described in section 9.6.
12
Explanation
Recorder Mode
You must select the recorder mode to record in recorder mode. There are two recorder
modes, Chart Recorder and X-Y Recorder.
13
Functions That Cannot Be Used in Chart Recorder Mode
14
The following functions (keys) cannot be used during recorder mode.
• Waveform acquisition conditions (MENU key > ACQ menu)
• History memory (History key)
• Waveform computation (MENU key > MATH menu)
• Display mode (DISPLAY key > Mode menu)
15
16
Functions That Cannot Be Used during X-Y Recorder Mode
17
The following functions (keys) cannot be used during recorder mode.
• Waveform acquisition conditions (MENU key > ACQ menu)
• History memory function (History key)
• Waveform computation (MENU key > MATH menu)
• Trigger (MENU key > Trigger menu)
• Display (DISPLAY key)
• Zoom (ZOOM key)
18
App
Index
IM 701240-01E
9-1
9.1 Selecting the Recorder Mode
SL1400 Settings in Chart Recorder Mode
If you select Chart Recorder mode, the SL1400 settings change as follows:
Menu
Soft key
Setting
ACQ
Record Length
Mode
Time Base
RealTime Out
Fixed to 2.5 MW
Envelope*
Int
OFF
DISPLAY
Accumulate
Mode
OFF
T-Y
MATH
Mode
OFF
MEASURE
Mode
Statistics and History Statistics set to OFF
*
The acquisition mode can be changed to Normal. For details, see section 9.2.
If the recorder mode is switched from Memory to Chart Recorder mode back to Memory,
Items under MENU key > ACQ menu and the record time setting return to the settings
that existed before switching to Chart Recorder mode.
SL1400 Settings in X-Y Recorder Mode
If you select X-Y Recorder mode, the SL1400 settings change as follows:
Menu
Soft key
Setting
ACQ
Record Length
Fixed to 1 MW
Trigger
Mode
Auto
If the recorder mode is switched from Memory to X-Y Recorder mode back to Memory,
Items under MENU key > ACQ menu and the trigger mode setting return to the settings
that existed before switching to X-Y Recorder mode.
9-2
IM 701240-01E
9.2
1
Setting the Record Conditions of T-Y
Waveform Recording
<For a description of this function, refer to page 2-37.>
2
Procedure
Before carrying out the procedure below, select Chart Recorder mode according to the
procedures in section 9.1.
3
Selecting the Chart Speed
4
1.
2.
Press CHART SPEED.
Turn the jog shuttle to select the chart speed.
5
6
Setting the Record Conditions
1.
2.
3.
7
Press MENU.
Press the RECORD COND soft key.
Press the Print Style soft key to select Wave.
8
Enabling/Disabling T-Y Recording to the Built-in Printer
4.
9
Press the Printer Output soft key to select ON or OFF.
5.
6.
Recording in Recorder Mode
Setting the Shot Recording
Press the Shot Recording soft key. A menu used to select the length of the
shot recording is displayed.
Press the soft key corresponding to the desired length of the short recording.
10
11
12
13
14
Setting the Trigger Mode
1.
2.
3.
4.
15
Press MENU.
Press the Trigger soft key.
Press the Mode soft key.
Press the soft key corresponding to the desired mode to select the trigger mode.
16
17
18
App
Index
For a description of other trigger condition settings, see chapter 6.
IM 701240-01E
9-3
9.2 Setting the Record Conditions of T-Y Waveform Recording
Setting the Acquisition Mode
By default, the acquisition mode in Chart Recorder mode is set to envelope. If you
want to select the acquisition mode between normal and envelope, carry out the steps
below.
1.
Press MENU.
2.
Press the Next 1/2 soft key.
3.
Press the Others soft key.
4.
Press the Next 1/2 soft key.
5.
Press the Chart Recorder Sample soft key to select the acquisition mode.
Explanation
Chart Speed
You can select the chart speed from below.
10 mm/h, 20 mm/h, 25 mm/h, 50 mm/h, 100 mm/h, 1 mm/min, 2 mm/min, 5 mm/min,
10 mm/min, 20 mm/min, 25 mm/min, 50 mm/min, 100 mm/min, 1 mm/s, 2 mm/s,
5 mm/s, 10 mm/s, or 20 mm/s
You can change the chart speed even while the recording is in progress. However, the
waveform acquired in the internal memory up to that point is cleared.
Display Position of the Chart Speed and Acquisition Mode
The specified chart speed and acquisition mode are displayed at the upper right of the
screen.
• While the recording is in progress, the horizontal scale (time per division) for T-Y
waveform recording is displayed below the chart speed (bottom row).
• If you change the chart speed when the recording is stopped, the bottom row
displays the new chart speed. The new chart speed takes effect the next time you
start the recording.
Top row:
Chart speed
Bottom row: Horizontal scale (time per division) for T-Y recording
Acquisition mode
Env (Envelope)
Normal
If you change the chart speed while the
recording is stopped, the bottom row
displays the new chart speed.
9-4
IM 701240-01E
9.2 Setting the Record Conditions of T-Y Waveform Recording
1
T-Y Recording to the Built-in Printer (Printer Output)
Set whether to carry out T-Y recording to the built-in printer. If set to ON, the waveform is
recorded on the built-in printer and acquired to the internal memory. If set to OFF, the
waveform is acquired only to the internal memory and not recorded on the built-in printer.
2
3
Shot Recording
When the specified length of waveform is recorded, the waveform acquisition and
recording stop.
You can select the length of the shot recording from OFF (no shot recording), 20 cm, 50
cm, 1 m, and 2 m.
4
5
Trigger Mode
6
In Chart Recorder mode, you can select the trigger mode from Auto, Log, Single, or
Repeat. For details on the trigger mode in Chart Recorder mode, see page 2-37.
Auto
7
Starts recording to the built-in printer simultaneously with the start of the waveform
acquisition. Recording continues until the waveform acquisition is stopped.
Log
Starts recording to the built-in printer simultaneously with the start of the waveform
acquisition. Waveform acquisition and recording stop when the maximum number of
divisions (see page 2-39) of the waveform data that can be saved is recorded.
Starts recording when the trigger conditions are met after starting the waveform
acquisition. Waveform acquisition and recording stop when the maximum number of
divisions (see page 2-39) of the waveform data that can be saved is recorded.
Repeat
Starts recording when the trigger conditions are met after starting the waveform
acquisition. Recording stops when the shot record length of waveform data is
recorded. Then, the SL1400 enters the trigger-wait state. This operation is repeated
until the waveform acquisition is stopped.
9
Recording in Recorder Mode
Single
8
10
11
12
13
Acquisition Mode
By default, the acquisition mode in Chart Recorder mode is set to envelope. You can
select the acquisition mode from normal and envelope. The operation of envelope and
normal modes is the same as that when recorder mode is disabled. For details, see page
2-28.
14
15
16
17
18
App
Index
IM 701240-01E
9-5
9.3
Setting the Recording Format of T-Y Waveform
Recording
Procedure
Before carrying out the procedure below, select Chart Recorder mode according to the
procedures in section 9.1.
The settings specified here are not applied to the print settings of the A4 print in Memory
Mode (see page 12-3). However, if you turn OFF the power switch in Recorder Mode,
the settings immediately before the power is turned OFF is stored (see section 3.4).
Therefore, when the power switch is turned ON the next time, the settings in Recorder
Mode that existed immediately before the power was turned OFF are also applied to the
print settings in Memory Mode.
1.
2.
3.
4.
Press MENU.
Press the RECORD COND soft key.
Press the Print Style soft key to select Wave.
Press the Print Setup soft key. The print setup dialog box opens.
Selecting the Display (Recording) Format
5.
Use jog shuttle+SELECT to select the format.
Setting the Extra Area
6.
Use jog shuttle+SELECT to turn the extra area ON or OFF.
Setting the Flexible Zone
7.
8.
9.
10.
Use jog shuttle+SELECT to select Setup in Flexible Zone. The flexible zone
setup dialog box appears.
Use jog shuttle+SELECT to turn the mode ON or OFF.
Use jog shuttle+SELECT to set Upper and Lower of the waveform to be
recorded.
Press ESC.
Setting the Graticule
Selecting the Grid
11.
Use jog shuttle+SELECT to select the type.
Setting Dark/Light
12.
Use jog shuttle+SELECT to select dark or light.
Selecting the Width of the Vertical Scale
13.
9-6
Use jog shuttle+SELECT to select the width.
IM 701240-01E
9.3 Setting the Recording Format of T-Y Waveform Recording
1
When Setup of Flexible Zone is selected
2
3
ESC
4
5
6
Setting the Details
Setting the Print Interval of Scale Values
14.
7
Use jog shuttle+SELECT to select the print interval of the scale.
Setting the Print Interval of Channel Label
15.
8
Use jog shuttle+SELECT to select the print interval of the channel label (Ch
Label).
9
Setting the Print Interval of the Time
Use jog shuttle+SELECT to select print interval of the time.
10
Selecting the Gauge Printing
17.
Use jog shuttle+SELECT to select the print interval of the gauge.
11
Setting the Annotation
18.
19.
Use jog shuttle+SELECT to select the print interval of the annotation.
Use jog shuttle+SELECT to select the type of annotation to be printed.
•
•
20.
12
If you select Ch Message, proceed to step 20.
If you select Ch Information or Ch Data, proceed to step 21.
Use jog shuttle+SELECT to select Setup. Then, enter the message you want to
print using up to 80 characters according to the procedure in section 4.2. You
can enter a message for each channel.
13
14
Setting a Comment
21.
Recording in Recorder Mode
16.
Use jog shuttle+SELECT to select Comment. Then, enter the comment you
want to print using up to 20 characters according to the procedure in section 4.2.
15
Setting the Paper Feed after Stopping the Recording
22.
Use jog shuttle+SELECT to turn After Feed ON or OFF.
16
17
When Annotation Type is set to Ch Message
and the Setup is selected
18
ESC
App
Index
IM 701240-01E
9-7
9.3 Setting the Recording Format of T-Y Waveform Recording
Explanation
Set the recording format for printing the T-Y waveform to the built-in printer. For a T-Y
waveform recording print example on the built-in printer, see the next section.
Selecting the Display (Recording) Format
Select the number of divisions of the recording area for recording to the built-in printer.
This setting is linked with the DISPLAY menu > Format setting.
1 Zone
2 Zone
3 Zone
4 Zone
8 Zone
16 Zone
Extra Area
You can set the extra area only when the format is set to 1 Zone, 2 Zone, 3 Zone, or 4
Zone.
When the Format Is 1 Zone
If the extra area is turned ON, the top 16 cm of the recording area (20 cm) is used to
record waveforms, and the remaining 4 cm is used to record waveform information
(extra area). Annotations (see page 9-10) and logic waveforms are recorded in the
extra area. The default setting is OFF.
When the Format Is 2 Zone, 3 Zone, or 4 Zone
If the extra area is turned ON, the area below each of the divided waveform recording
area is used to record waveform information (extra area). If the extra area is turned
OFF, the extra area between each waveform recording area disappears. The vertical
axis of each waveform recording area is adjusted automatically according to the paper
size and recorded. The default setting is ON.
Flexible Zone
Paper feed direction
100 %
Upper: 20 %
Lower: 0 %
0%
Recording area
Recording area
The flexible zone can be set only when the display (recording) format is 1 Zone and the
extra area is OFF. The position in the recording area (20 cm) where each waveform is to
be recorded is set with Upper and Lower (%). The Upper value can be set in the range of
2% to 100%. The Lower value can be set in the range of 0% to 98%. The resolution of
each value is 1%. The minimum zone width (the difference between the Upper and
Lower values) is 2%.
[Example] • When Flexible Zone on CH1 is set to Upper = 20% and Lower = 0%
The CH1 waveform is recorded in the area from the bottom to 4 cm of the
recording area.
• When Flexible Zone on CH2 is set to Upper = 80% and Lower = 20%
The CH2 waveform is recorded in the area from 4 cm to 16 cm from the
bottom of the recording area.
Paper feed direction
100 %
Upper: 80 %
Lower: 20 %
0%
Graticule
Grid (Type)
Select the grid type from , OFF, or . This setting is linked with the DISPLAY menu >
Graticule setting. However, if OFF is selected, the DISPLAY menu is set to .
9-8
IM 701240-01E
9.3 Setting the Recording Format of T-Y Waveform Recording
1
Dark/Light
Set the graticule dark/light setting to Light or Dark.
2
Width of the Vertical Graticule (Width)
Select how to set the vertical graticule width.
1Div:
Grid that divides the recording area into 10 areas
10mm:
mm graticule type
3
4
Graticule lines that are printed
The format of the scale lines that are printed depending on the selected graticule
type and width is given in the table below.
1 Div
10 mm
5
Grid Type
Graticule
Width
OFF
1 div
No graticule lines
1 div
10 mm
No graticule lines
10 mm
6
7
Details
Print Interval of Scale Values (Scale)
8
Select the interval for the scale values (see section 8.9) printed at the top and bottom
edges of the recording area from OFF, 200 mm, 400 mm, or 800 mm. If OFF is
selected, the scale values are not printed.
9
Select the interval for printing waveform channel labels (see section 8.10) from OFF,
200 mm, 400 mm, or 800 mm. The channel label is printed near each waveform. If
OFF is selected, the channel labels are not printed.
Time Print
Select the interval for printing the time from OFF, 200 mm, 400 mm, or 800 mm. The
time is printed at the top row of the recording area. If OFF is selected, the times are
not printed.
Recording in Recorder Mode
Print Interval of Channel Labels (Ch Label)
10
11
12
13
Gauge Print
Select whether to not print (OFF), print (ON), or print in detail (Fine) on the right (or
left) side of the recording area. If ON is selected a gauge that equally divides the
vertical axis of the waveform display area into two is displayed. If Fine is selected, a
gauge that equally divides the vertical axis of the waveform display area into 10 is
displayed. In realtime recording, the gauge is printed on the right side of the recording
area when the recording is completed. When reprinting waveforms saved to the
internal memory (see section 9.7), the gauge is printed on the left side of the
recording area when the recording is started. The gauge, scale values, an arrow
indicating the ground position, and measurement range* are printed.
*
15
16
17
The measurement range may not be printed depending on the setting of T-Y Recording.
18
Paper Feed after Stopping the Recording
You can select whether the paper is fed automatically after stopping the T-Y
waveform recording. This function can be used on products with firmware version 6.52
or higher. Check the firmware version under Soft Version described in section 17.4.
ON:
Automatically feeds the paper approximately 40 mm so that the gauge
information that is printed after the waveform recording can be seen.
OFF:
Disables the auto feed function. To feed the paper, do it manually
according to the procedure given on page 3-12.
IM 701240-01E
14
9-9
App
Index
9.3 Setting the Recording Format of T-Y Waveform Recording
Annotation
Channel information, channel messages, or measured values (Ch Data) is printed.
Use Annotation to select the print interval from OFF, 200 mm, 400 mm, and 800 mm.
Use Type to set the type of annotation to be printed from below.
• Ch Information
Prints settings such as the measurement range, filter, and module.
• Ch Message
Prints the character string (up to 80 characters) that is assigned to each channel.
• Ch Data
Records the measured values at a given interval using numeric values.
The position where annotations are printed varies depending on the display
(recording) format and extra area settings as follows:
• When Format Is 1 Zone, 2 Zone, 3 Zone, or 4 Zone and Extra Area Is ON
The annotations are printed in the extra area. They are not printed in the
waveform recording area.
• When Format Is 1 Zone, 2 Zone, 3 Zone, or 4 Zone and Extra Area Is OFF
The annotations are printed at the bottom row of the waveform recording area.
• When Format Is 8 Zone or 16 Zone
The annotations are printed between the divided waveform recording areas
(between the grids).
Note
If all of the conditions below are met, only up to 67 characters of channel message are printed.
When Format is 1 Zone, 2 Zone, 3 Zone, or 4 Zone, Extra Area is OFF, and Scale is not OFF
Comment
A comment string of up to 20 characters can be printed at the lower right section. This
setting is linked with the PRINT menu > Comment setting.
9-10
IM 701240-01E
9.4
1
Recording T-Y Waveforms
2
Procedure
Before carrying out the procedure below, set the recording conditions and recording
format of T-Y waveform recording according to the procedures in sections 9.2 and 9.3.
3
4
Starting the T-Y Waveform Recording
Press START/STOP. Waveform acquisition starts, and T-Y waveform recording
starts.
5
Stopping the T-Y Waveform Recording
6
Press START/STOP when T-Y waveform recording is in progress. Waveform
acquisition and T-Y waveform recording stop.
7
Explanation
Starting/Stopping the T-Y Waveform Recording
Changing the Settings during T-Y Waveform Recording
• You can change the input conditions even while T-Y waveform recording is in
progress. The recording does not stop.
• Calibration is not executed while the T-Y waveform recording is in progress.
• You cannot change the recording format while the T-Y waveform recording is in
progress.
• You can change the chart speed while the T-Y waveform recording is in progress.
However, the waveform acquired in the internal memory up to that point is cleared.
The waveform after the chart speed change is acquired in the internal memory.
8
9
Recording in Recorder Mode
If you press START/STOP and start the waveform acquisition, T-Y waveform recording
to the built-in printer also starts. To abort the T-Y waveform recording, press START/
STOP to stop the waveform acquisition. However, if the T-Y waveform recording to the
built-in printer was set to OFF in section 9.2, the waveform is acquired only to the
internal memory. T-Y waveform recording to the built-in printer is not performed.
10
11
12
13
14
15
16
17
18
App
Index
IM 701240-01E
9-11
9.4 Recording T-Y Waveforms
Print Example of the T-Y Waveform Recording
Format:
Graticule Type:
Width:
Triad
10 mm
Time
Chart speed
T/div
Gauge
Scale value
Scale value
V/div
(Value/div)
Channel
label
Arrow
indicating
the ground
position
Scale value
Scale value
Annotation (channel information)
9-12
IM 701240-01E
9.5
1
Recording Numeric Values
<For a description of this function, refer to page 2-37.>
2
Procedure
Before carrying out the procedure below, select Chart Recorder mode according to the
procedures in section 9.1.
1.
2.
3.
4.
3
4
Press MENU.
Press the RECORD COND soft key.
Press the Print Style soft key to select Numeric.
Press the Print Setup soft key. The print setup dialog box opens.
5
6
7
8
9
Recording in Recorder Mode
10
Setting the Output Destination
5.
11
Use jog shuttle+SELECT to select the output device.
Setting the Output Interval
12
6.
Use jog shuttle+SELECT to select the interval.
If you select Chart in step 5, proceed to step 7.
If you select File in step 5, proceed to step 8.
13
Setting the Print Direction (If Chart Is Selected in Step 5)
7.
14
Use jog shuttle+SELECT to select the direction.
Proceed to step 11.
15
Setting the Output File (If Chart Is Selected in Step 5)
Setting the Auto Naming Function
8.
Use jog shuttle+SELECT to select the auto naming method of the file name.
Setting the File Name
9.
Use jog shuttle+SELECT to select File Name. Then, enter the file name using
up to 16 characters according to the procedure in section 4.2.
16
17
18
Selecting the File Output Destination
10.
Use jog shuttle+SELECT to select File List. Then, select the file output
destination according to steps 14 to 17 in section 13.8. Proceed to step 11.
App
Index
IM 701240-01E
9-13
9.5 Recording Numeric Values
Displayed only when Output
Device is set to File
Note
Up to 10000 lines are output to the file. When 10000 lines are exceeded, writing stops. However,
the waveform acquisition continues.
Setting the Trigger Mode
11.
Carry out the procedure in “Setting the Trigger Mode” on page 9-3.
Setting the Acquisition Mode
12.
Carry out the procedure in “Setting the Acquisition Mode” on page 9-4.
Starting the Numeric Value Recording
13.
Press START/STOP. Waveform acquisition starts, and the numeric value
recording starts.
Stopping the Numeric Value Recording
14.
Press START/STOP when numeric value recording is in progress. Waveform
acquisition and numeric value recording stop.
Explanation
Output Device
To record numeric values on the built-in printer, select Chart. To save numeric values to
a file on a specified storage medium, select File.
Interval
Select 1 s, 2 s, 5 s, 10 s, 15 s, 20 s, 30 s, 1 min, 2 min, 5 min, 10 min, 15 min, 20 min, 30
min, or 60 min.
Direction
If the output destination is set to Chart, set the print direction to Normal (the newest data
is at the top of the paper) or Rotation (the oldest data is at the top of the paper).
Output File (File Setup)
If the output destination is set to File, set the output file (auto naming, file name, and file
output destination). These settings are the same as those of normal files. For details, see
section 13.8.
9-14
IM 701240-01E
9.5 Recording Numeric Values
1
Trigger Mode
You can select Auto or Log in numeric value recording. Each trigger mode operation is
the same as with the T-Y waveform recording. For details, see page 2-37 and section
9.2.
3
Acquisition Mode
The acquisition mode is the same as with the T-Y waveform recording. For details, see
page 2-28 and section 9.2.
Print Example of the Numeric Value Recording
Interval: 1 s
Direction: Normal
2
4
5
Paper feed direction
6
Date
Record time
Channel number
Unit
Numeric value
7
8
9
Recording in Recorder Mode
10
11
12
13
14
15
16
17
18
Note
•
•
IM 701240-01E
App
If the output destination is set to File, the waveform acquisition does not start when the power
is turned ON even if the waveform acquisition start mode at power ON (see section 7.1) is
turned ON.
The print timing may deviate from the specified output interval.
9-15
Index
9.6
Recording X-Y Waveforms
<For a description of this function, refer to page 2-40.>
Procedure
Before carrying out the procedure below, select X-Y Recorder mode according to the
procedures in section 9.1.
1.
2.
Press MENU.
Press the RECORD COND soft key.
Setting the Sample Rate
3.
4.
Press the Sample Rate soft key.
Turn the jog shuttle to select the sample rate.
Setting the Interpolation Method
5.
6.
Press the Interpolation soft key. The interpolation selection menu appears.
Press the soft key corresponding to the desired interpolation method.
Setting the Auto Print Function
7.
Press the Auto Print soft key to select ON or OFF. If you select ON, the X-Y
waveform recording on the built-in printer starts automatically when the
waveform acquisition stops.
Sample
rate
Record
time
Selecting the X-Y Waveform to Be Displayed (Recorded)
8.
9.
Press the Print Setup soft key. The print setup dialog box opens.
Use jog shuttle+SELECT to select XY1 to XY4, turn the display ON/OFF of
each X-Y waveform, and set the X trace and Y trace channels.
Setting the Graticule
Setting the Grid
10.
Use jog shuttle+SELECT to select the type.
Setting Dark/Light
11.
Use jog shuttle+SELECT to select dark or light.
Setting the Grid Width of the X- and Y-Axes
12.
9-16
Use jog shuttle+SELECT to select the width.
IM 701240-01E
9.6 Recording X-Y Waveforms
1
Setting Whether to Print the Scale
13.
Use jog shuttle+SELECT to turn the scale ON or OFF.
2
Setting Whether to Display the Pointer
14.
Use jog shuttle+SELECT to turn the pointer ON or OFF.
If you select ON, a pointer indicating the most recent recording position appears
on the screen. It is not printed on the printer.
3
4
Selecting the Print Font Size
15.
Use jog shuttle+SELECT to select the print font size.
5
Setting a Comment
16.
Use jog shuttle+SELECT to select Comment. Then, enter the comment you
want to print using up to 20 characters according to the procedure in section 4.2.
6
7
8
9
Recording in Recorder Mode
10
11
Starting the X-Y Waveform Recording
17.
Press START/STOP. The waveform acquisitions starts, and the screen shows
the X-Y waveform.
13
Stopping the X-Y Waveform Recording
18.
12
Press START/STOP while the waveform acquisition is in progress. The
waveform acquisition stops. If auto print is turned ON in step 7, the X-Y
waveform recording starts when the data acquisition stops.
14
15
Note
If auto print turned OFF, the X-Y waveform is not automatically printed. You can use the reprint
function to print the X-Y waveform (see section 9.7).
16
17
Explanation
Sample Rate
Select the sample rate from the following:
5 S/s, 10 S/s, 20 S/s, 50 S/s, 100 S/s, 200 S/s, 500 S/s, 1 kS/s, 2 kS/s, or 5 kS/s
18
Interpolation
App
Set the interpolation method to OFF or Line. For details on the interpolation method, see
section 8.2.
IM 701240-01E
9-17
Index
9.6 Recording X-Y Waveforms
Auto Print
Select whether to automatically perform the X-Y waveform recording (printing) on the
built-in printer when the waveform acquisition is stopped.
Selecting the X-Y Waveform to Be Displayed (Recorded)
• Select the X-Y waveform to be recorded (displayed) from XY1 to XY4.
• Assign channels to the X- and Y-axes for each item between XY1 and XY4. For the
channels that can be assigned, see the explanation in section 8.6. You cannot select
Math1 to Math8 in the table in section 8.6.
Graticule
Grid (Type)
The grid type is the same as with the T-Y waveform recording. For details, see page
9-8.
Dark/Light
Set the graticule dark/light setting to Light or Dark.
Setting the Grid Width of the X- and Y-Axes
Select how to set the grid of the X- and Y-axes. For details on the format of the grid
lines that are printed, see page 9-9.
1Div:
Grid that divides the recording area into 10 areas
10mm: mm graticule type
Scale
Select whether to print the scale.
Pointer
Select whether to display the pointer that indicates the most recent recording position on
the screen.
The pointer is only displayed on the screen and not printed on the printer.
Print Font
Select the print font size to small or large. The setting applies to all printed characters.
Comment
A comment string of up to 20 characters can be printed at the lower right section. This
setting is linked with the PRINT menu > Comment setting.
Starting/Stopping the X-Y Waveform Recording
When you press START/STOP, the waveform acquisitions starts, and the screen shows
the X-Y waveform. Pressing START/STOP again stops the waveform acquisition.
If auto print is turned ON, the X-Y waveform recording on the built-in printer starts when
the data acquisition stops. The waveform that is acquired between start and stop is
recorded.
The reprint function (see section 9.7) can be used to execute the X-Y waveform
recording on the built-in printer when auto print is turned OFF.
The most recent 1 MW of data that are acquired during the X-Y waveform recording are
saved to the internal memory of the SL1400. The data can be used in the automated
measurement of waveform parameters* (see section 11.5) and cursor measurements
(excluding the marker cursor. See section 11.4). The data can also be saved to a
storage medium.
*
9-18
Area computation on the X-Y waveform is performed only on XY1.
IM 701240-01E
9.6 Recording X-Y Waveforms
1
Print Example of the X-Y Waveform Recording
Graticule Type:
Width:
Time
2
10 mm
Sample rate
3
Y-axis scale value
4
5
6
7
8
9
Recording in Recorder Mode
10
11
12
13
14
15
Y-axis scale value
X-axis scale value
16
X-axis scale value
17
18
App
Index
IM 701240-01E
9-19
9.7
Reprinting on the Built-in Printer
<For a description of this function, refer to page 2-40.>
Procedure
Reprinting the Waveform Recorded in Chart Recorder Mode (T-Y Recording)
Before carrying out the procedure below, record the T-Y waveform in Chart Recorder
mode according to the procedures in sections 9.1 to 9.4. This section explains the
procedure from the point when the RECORD COND menu is displayed.
1.
Press the Reprint Setup soft key.
Setting the Print Destination
2.
3.
Press the Print to soft key. The print destination selection menu appears.
Press the Printer soft key.
Selecting the Print Length
4.
5.
Press the Length soft key. The print length selection menu appears.
Press the Continue or A4 Print soft key.
Selecting the Section to Be Reprinted
6.
7.
8.
9.
10.
11.
Press the Window Mag/Window Pos soft key to select Window Mag.
Use the jog shuttle to set the zoom rate. You can reduce the zoom rate to
redisplay the waveform that had been cleared from the screen.
Press the Window Mag/Window Pos soft key to select Window Pos.
Use the jog shuttle to set the zoom position. You can move the zoom position
to redisplay the waveform that had been cleared from the screen.
If you select Continue in step 5, press the Start Point/End Point soft key.
Use the jog shuttle to set the start and end points of the section to be reprinted.
Setting the Print Magnification (Only If Continue Is Selected in Step 5)
12.
13.
Press the Print Mag soft key.
Use the jog shuttle to set the magnification of the section to be reprinted that
you selected in steps 6 to 11. The top row of the menu shows the magnification;
the bottom row shows the number of pages when the waveform is recorded
using the magnification indicated in the top row.
Start Point/End Point, Print Mag, and Preview are displayed only when Length is set to Continue.
9-20
IM 701240-01E
9.7 Reprinting on the Built-in Printer
Displaying the Preview (Only If Continue Is Selected in Step 5)
14.
15.
16.
Press the Preview soft key.
Turn the jog shuttle to select the page you want to preview.
Press the Quit soft key to close the preview display.
Executing the Reprint Operation
17.
Press the Print Exec soft key. Reprint is executed using the conditions set in
steps 6 to 13.
1
2
3
4
5
6
7
8
Reprinting the Waveform Recorded in X-Y Recorder Mode
1.
Press the Reprint Setup soft key.
Setting the Print Destination
2.
3.
Press the Print to soft key. The print destination selection menu appears.
Press the Printer soft key.
Executing the Reprint Operation
4.
Press the Print Exec soft key to execute the reprint operation.
9
Recording in Recorder Mode
Before carrying out the procedure below, record the X-Y waveform in X-Y Recorder
mode according to the procedures in sections 9.1 to 9.6. This section explains the
procedure from the point when the RECORD COND menu is displayed.
10
11
12
13
14
15
16
17
Explanation
The waveform data of the T-Y waveform recorded in Chart Recorder mode or the
measured data of the X-Y waveform recorded in X-Y Recorder mode is stored in the
internal memory.
Reprinting the Waveform Recorded in Chart Recorder Mode (T-Y Waveform
Recording)
Print to
IM 701240-01E
To reprint the waveform recorded in Chart Recorder mode (T-Y waveform recording), set
the print destination to Printer (built-in printer).
9-21
18
App
Index
9.7 Reprinting on the Built-in Printer
Length
Continue:
A4 Print:
Prints the range specified by Window Mag/Window Pos and Start Point/End
Point using the magnification specified by Print Mag.
Prints the range specified by Window Mag/Window Pos to A4 size. The
magnification changes automatically so that the display range fits on an A4
size paper.
Selecting the Section to Be Reprinted
Zoom Rate/Zoom Position (Window Mag/Window Pos)
When selecting the section to be reprinted, Window Mag is used to reduce the zoom
rate in order to redisplay the waveform that has been cleared from the screen. You
can also move Window Pos to redisplay the waveform that had been cleared from the
screen.
Start Point/End Point
If Length is set to Continue, display the section to be reprinted on screen, and then
use Start Point and End Point to set the start and end points.
Print Mag
Set Print Mag only when Length is set to Continue. Set the waveform magnification for reprinting.
The top row of the menu shows the magnification; the bottom row shows the number of pages
when the waveform is recorded using the magnification indicated in the top row.
Start Point End Point
Window
Mag
Section you wish
to reprint
Reduce the zoom rate to
display the section you want
to reprint on the screen
Set the Start Point and
End Point
Set the magnification
of the section you
want to reprint with
Output Mag
Reprinting
Waveform cleared
from the screen
Window
Pos
Move Window Pos to the left
to display the section you
want to reprint on the screen
Start Point
End Point
When Length is set to Continue
The magnification of the waveform displayed on
the screen is automatically adjusted to fit on an
A4 size paper, and the waveform is printed.
When Length is set to A4 Print
Preview
Displays a preview of the section that you want to reprint. Press the Quit soft key to close
the preview display.
Executing the Reprint Operation (Print Exec)
Reprint is executed using the specified conditions.
Reprinting the Waveform Recorded in X-Y Recorder Mode (X-Y Waveform Recording)
Executing the Reprint Operation (Print Exec)
The waveform data recorded to the internal memory immediately before in X-Y Recorder
mode is reprinted as a waveform.
9-22
IM 701240-01E
9.7 Reprinting on the Built-in Printer
1
Reprint Example of the T-Y Waveform Recording
Format:
Graticule Type:
Width:
Triad
2
10 mm
Gauge
Time
T/div
3
4
Scale value
5
Measurement
range
6
Arrow indicating
the ground
position
7
Scale value
8
Channel label
Annotation (channel information)
9
Recording in Recorder Mode
10
11
12
13
14
15
16
17
18
App
Time
IM 701240-01E
Time
9-23
Index
9.8
Creating a PDF File of the Reprint Image
<For a description of this function, refer to page 2-40.>
Procedure
Before carrying out the procedure below, record the T-Y waveform in Chart Recorder
mode according to the procedures in sections 9.1 to 9.4 or record the X-Y waveform in
X-Y Recorder mode according to the procedures in section 9.6. This section explains the
procedure from the point when the RECORD COND menu is displayed.
1.
Press the Reprint Setup soft key.
Setting the Print Destination
2.
3.
Press the Print to soft key. The print destination selection menu appears.
Press the PDF soft key.
For Chart Recorder mode, proceed to step 4.
For X-Y Recorder mode, proceed to step 12.
Selecting the Section to Be Output to the PDF File (Only for Chart
Recorder Mode)
4.
5.
6.
7.
8.
9.
Press the Window Mag/Window Pos soft key to select Window Mag.
Use jog shuttle+SELECT to set the zoom rate. You can reduce the zoom rate
to redisplay the waveform that had been cleared from the screen.
Press the Window Mag/Window Pos soft key to select Window Pos.
Use jog shuttle+SELECT to set the zoom position. You can move the zoom
position to redisplay the waveform that had been cleared from the screen.
Press the Start Point/End Point soft key.
Use jog shuttle+SELECT to set the start and end points of the section to be
output to the PDF file.
Setting the Print Magnification (Only for Chart Recorder Mode)
10.
11.
Chart Recorder mode
9-24
Press the Print Mag soft key.
Use the jog shuttle to set the magnification of the section that you selected in
steps 4 to 9 to be output to the PDF file. The top row of the menu shows the
magnification; the bottom row shows the number of pages when the waveform is
recorded using the magnification indicated in the top row.
X-Y Recorder mode
IM 701240-01E
9.8 Creating a PDF File of the Reprint Image
1
Setting the PDF File
12.
Press the PDF Setup soft key. The PDF setup dialog box appears.
2
Setting the Paper Size
13.
Use jog shuttle+SELECT to select the paper size.
3
Setting the Orientation (If You Select A3, A4, or A5 in Step 13)
14.
Use jog shuttle+SELECT to select the orientation.
Setting the Number of Divisions per Page (If You Select A3, A4, or A5 in
Step 13 (Only for Chart Recorder Mode))
15.
Use jog shuttle+SELECT to select Div/Page and set the number of divisions
per page.
Setting the Document Information
16.
Use jog shuttle+SELECT to select Title, Author, Sub Title, or KeyWord. Then,
enter the title, author, or sub title using up to 30 characters or the keyword using
up to 90 characters of the PDF file according to the procedures in section 4.2.
4
5
6
7
Selecting the Color
17.
Use jog shuttle+SELECT to turn the color ON or OFF.
8
Enabling/Disabling Compression
18.
Use jog shuttle+SELECT to turn the compression ON or OFF.
9
19.
Use jog shuttle+SELECT to select the auto naming method of the file name.
Setting the PDF File Name
20.
Use jog shuttle+SELECT to select File Name. Then, enter the file name using
up to 16 characters according to the procedure in section 4.2.
Selecting the PDF File Output Destination
21.
11
13
Press the Print Exec soft key. A PDF file is created using the conditions set in
steps 4 to 21.
Chart Recorder mode
10
12
Use jog shuttle+SELECT to select File List. Then, select the file output
destination according to steps 14 to 17 in section 13.8.
Executing the PDF File Generation
22.
Recording in Recorder Mode
Setting the Auto Naming Function
14
X-Y Recorder mode
15
16
17
18
App
Index
IM 701240-01E
9-25
9.8 Creating a PDF File of the Reprint Image
Explanation
Print to
When creating a PDF file of the waveform recorded in Chart Recorder mode (T-Y
recording) or X-Y Recorder mode (X-Y recording), set the print destination to PDF.
Selecting the Section to Be Output to the PDF File (Window Mag/Window
Pos and Start Point/End Point)
Can be specified only in Chart Recorder mode. These are the same as Window Mag/
Window Pos and Start Point/End Point when reprinting on the built-in printer. See page
9-22.
Print Mag
Can be specified only in Chart Recorder mode. This is the same as Print Mag when
reprinting on the built-in printer. See page 9-22.
Setting the PDF File
Paper Size
Select the paper size from built-in printer size, A3, A4, and A5. If the built-in printer
size is selected, a PDF file is created of an image similar to the printed output on the
built-in printer.
Orientation
If the paper size is set to A3, A4, or A5, set the PDF orientation to Landscape or
Portrait.
Div/Page
Can be specified only in Chart Recorder mode. If the paper size is set to A3, A4, or
A5, set the number of divisions per PDF page. The image data of the specified
number of divisions is saved. The selectable range of Div/Page varies depending on
the paper size, orientation, and gauge (see section 9-9) as follows:
Paper Size
Orientation
Selectable Range of Div/Page
Gauge: OFF
Gauge: ON
Built-in printer
-
20 (fixed)
20 (fixed)
A3
A3
Portrait
Landscape
1 to 25
1 to 40
1 to 20
1 to 35
A4
A4
Portrait
Landscape
1 to 20
1 to 25
1 to 15
1 to 20
A5
A5
Portrait
Landscape
1 to 10
1 to 20
1 to 10
1 to 15
Document Information (Title, Author, Sub Title, and Keyword
As necessary, enter the title, author, sub title, and keyword of the PDF file to be
created.
Color
The PDF file is created in color if ON is selected and monochrome if OFF is selected.
Compression
Select whether to compress the file. If you select ON, the file is compressed.
However, the generation of the PDF file takes longer than when you select OFF.
9-26
IM 701240-01E
9.8 Creating a PDF File of the Reprint Image
File Setup
1
Set the auto naming, file name, and file output destination of the PDF file. These
settings are the same as those of normal files. For details, see section 13.8.
2
Executing the PDF File Generation
The PDF file is created using the specified conditions. The extension to the PDF file is
.pdf.
3
4
5
6
7
8
9
Recording in Recorder Mode
10
11
12
13
14
15
16
17
18
App
Index
IM 701240-01E
9-27
9.8 Creating a PDF File of the Reprint Image
PDF File Example
Chart Recorder mode (Paper Size: A4)
Gauge
Date/Time T/div
File name
Page
Scale value of
the vertical axis
Measurement
range
Scale value of
the vertical axis
Annotation
(channel information)
Scale value of the time axis
Scale value of the time axis
X-Y Recorder mode (Paper Size: A5)
Date/Time Sample rate
Comment
File name
Scale value of
the Y axis
Scale value of
the Y axis
Scale value of the X axis
9-28
Scale value of the X axis
IM 701240-01E
Chapter 10 Waveform Computation
10.1 Adding, Subtracting, Multiplying, and Dividing
Waveforms
<For a description of this function, refer to page 2-41.>
1
2
Procedure
1.
2.
3.
3
Press MENU.
Press the MATH soft key.
Press the Mode soft key to select ON.
4
Setting the Computation Start and End Points
4.
5.
6.
Press the Start Point/End Point soft key to set the jog shuttle control to Start
Point.
Turn the jog shuttle to set the start point.
Likewise, set the End Point.
Setting the Computation
7.
8.
8
9
Use jog shuttle+SELECT to set Operation to S1+S2, S1–S2, S1*S2, or S1/S2.
10
Selecting the Channel on Which to Perform Computation
Use jog shuttle+SELECT to select Source1.
Likewise, select Source2.
11
Setting the Scaling
12.
Waveform Computation
10.
11.
6
7
Press the Setup soft key. The Math1 to Math8 setup dialog boxes appear.
Use jog shuttle+SELECT to select the desired Math waveform. The
corresponding Math waveform setup dialog box appears.
Setting the Computing Operation
9.
5
Use jog shuttle+SELECT to set Scale to Auto or Manual.
If you select Manual, proceed to step 13; if you select Auto, proceed to step 15.
12
13
14
15
16
17
18
App
Index
IM 701240-01E
10-1
10.1 Adding, Subtracting, Multiplying, and Dividing Waveforms
Setting the Upper and Lower Limits of Waveform Display (When Scale Is
Set to Manual)
13.
14.
Use jog shuttle+SELECT to set the upper limit.
Likewise, set the lower limit.
Note
If you select Auto, you cannot set Upper and Lower.
Setting the Unit
15.
Use jog shuttle+SELECT to set the Unit using up to four characters according
to the procedure given in section 4.2.
Setting the Label
16.
Use jog shuttle+SELECT to set the Label according to the procedure given in
section 4.2. For a description of the label display, see section 8.10.
Turning ON/OFF the Math Waveform Display
17.
Use jog shuttle+SELECT to turn the display ON or OFF.
As necessary, set Math2 to Math8 in a similar fashion.
18.
Press ESC twice.
Executing the Computation
19.
Press the Exec soft key.
ESC ESC
10-2
IM 701240-01E
10.1 Adding, Subtracting, Multiplying, and Dividing Waveforms
1
Explanation
Addition, subtraction, multiplication, and division can be performed between channels.
2
Computation Target Channels
CH1 to CH16, Math1 to Math7
3
Computation range: Start Point/End Point
By default, the measurement range is ±5 divisions of the display frame on the time axis.
You can limit this range.
The concept of the computation range is analogous to the concept of the selectable
range of cursor display position in cursor measurement.
For details, see “Selectable Range of Cursor Position” in section 11.4.
4
5
6
Scaling
Set the upper and lower limits of the math waveform display.
Auto:
The upper and lower limits are set according to the computed result.
Manual: The upper and lower limits can be set arbitrarily. The selectable range is
–9.9999E+30 to 9.9999E+30.
7
8
Unit
9
Unit can be set arbitrarily using up to four characters. The specified characters are
applied to the scale values.
10
When performing computation on a channel that has linear scaling set, the computation
is performed on the scaled value.
11
Notes on Computation
Computation is not executed when you change Start Point or End Point while the
computation is stopped. Be sure to press Exec to perform the computation again. If you
do not, the waveform will not be displayed correctly when the screen is redrawn.
Note
While computation is in progress,
Waveform Computation
Linear Scaling
12
13
14
is displayed at the upper left of the screen.
15
16
17
18
App
Index
IM 701240-01E
10-3
10.2 Performing Binary Computation
<For a description of this function, refer to page 2-41.>
Procedure
1.
2.
3.
Press MENU.
Press the MATH soft key.
Press the Mode soft key to select ON.
Setting the Computation Start and End Points
4.
5.
6.
Press the Start Point/End Point soft key to set the jog shuttle control to Start
Point.
Turn the jog shuttle to set the start point.
Likewise, set the End Point.
Setting the Computation
7.
8.
Press the Setup soft key. The Math1 to Math8 setup dialog boxes appear.
Use jog shuttle+SELECT to select the desired Math waveform. The
corresponding Math waveform setup dialog box appears.
Setting the Computing Operation
9.
Use jog shuttle+SELECT to set Operation to Bin(S1).
Selecting the Channel on Which to Perform Computation
10.
Use jog shuttle+SELECT to select Source.
Setting the Scaling
11.
10-4
Use jog shuttle+SELECT to set Scale to Auto or Manual.
If you select Manual, proceed to step 12; if you select Auto, proceed to step 14.
IM 701240-01E
10.2 Performing Binary Computation
Setting the Upper and Lower Limits of Waveform Display (When Scale Is
1
Set to Manual)
12.
13.
2
Use jog shuttle+SELECT to set Upper.
Likewise, set Lower.
3
Note
If you select Auto, you cannot set Upper and Lower.
4
Setting the Unit
14.
Use jog shuttle+SELECT to set the Unit using up to four characters according
to the procedure given in section 4.2.
Setting the Label
15.
Use jog shuttle+SELECT to set the Label according to the procedure given in
section 4.2. For a description of the label display, see section 8.10.
5
6
7
Turning ON/OFF the Math Waveform Display
16.
17.
Use jog shuttle+SELECT to set Display to ON or OFF.
Press ESC twice.
8
9
Setting the Threshold Level
18.
19.
10
Waveform Computation
20.
21.
Press the Threshold soft key.
Use jog shuttle+SELECT to set the Trace (channel on which to assign the
threshold level).
Use jog shuttle+SELECT to set Thr Upper.
Likewise, set Thr Lower.
11
As necessary, set Math2 to Math8 in a similar fashion.
12
Executing the Computation
22.
Press the Exec soft key.
13
14
15
ESC ESC
16
17
18
App
Index
IM 701240-01E
10-5
10.2 Performing Binary Computation
Explanation
This function converts CH1 to CH16 or Math1 to Math7 waveform to a digital signal (1s
and 0s) according to the specified threshold level.
Upper
Lower
1
0
Computation range: Start Point/End Point
By default, the measurement range is ±5 divisions of the display frame on the time axis.
You can limit this range.
The concept of the computation range is analogous to the concept of the selectable
range of cursor display position in cursor measurement.
For details, see “Selectable Range of Cursor Position” in section 11.4.
Scaling
Set the upper and lower limits of the math waveform display.
Auto:
The upper and lower limits are set according to the computed result.
Manual: The upper and lower limits can be set arbitrarily. The selectable range is
–9.9999E+30 to 9.9999E+30.
Unit
Unit can be set arbitrarily using up to four characters. The specified characters are
applied to the scale values.
Linear Scaling
When performing computation on a channel that has linear scaling set, the computation
is performed on the scaled value.
Notes on Computation
Computation is not executed when you change Start Point or End Point while the
computation is stopped. Be sure to press Exec to perform the computation again. If you
do not, the waveform will not be displayed correctly when the screen is redrawn.
Note
While binary computation is in progress,
10-6
is displayed at the upper left of the screen.
IM 701240-01E
1
10.3 Performing Power Spectrum Computation
(FFT)
<For a description of this function, refer to page 2-41.>
2
Procedure
1.
2.
3.
3
Press MENU.
Press the MATH soft key.
Press the Mode soft key to select ON.
4
Setting the Computation Start and End Points
4.
5.
6.
Press the Start Point/End Point soft key to set the jog shuttle control to Start
Point.
Turn the jog shuttle to set the start point.
Likewise, set the End Point.
Setting the Computation
7.
8.
8
9
Use jog shuttle+SELECT to set Operation to PS(S1).
10
Selecting the Channel on Which to Perform Computation
Use jog shuttle+SELECT to select Source.
Waveform Computation
10.
6
7
Press the Setup soft key. The Math1 to Math8 setup dialog boxes appear.
Use jog shuttle+SELECT to select the desired Math waveform. The
corresponding Math waveform setup dialog box appears.
Setting the Computing Operation
9.
5
11
Setting the Scaling
11.
Use jog shuttle+SELECT to set Scale to Auto or Manual.
If you select Manual, proceed to step 12; if you select Auto, proceed to step 14.
Setting the Upper and Lower Limits of Waveform Display (When Scale Is
Set to Manual)
12.
13.
12
13
Use jog shuttle+SELECT to set Upper.
Likewise, set Lower.
14
If you select Auto, you cannot set Upper and Lower.
15
Note
16
17
18
App
Index
IM 701240-01E
10-7
10.3 Performing Power Spectrum Computation (FFT)
Setting the Unit
14.
Use jog shuttle+SELECT to set the Unit using up to four characters according
to the procedure given in section 4.2.
Setting the Label
15.
Use jog shuttle+SELECT to set the Label according to the procedure given in
section 4.2. For a description of the Label display, see section 8.10.
Turning ON/OFF the Math Waveform Display
16.
17.
Use jog shuttle+SELECT to set Display to ON or OFF.
Press ESC twice.
Setting the Number of FFT Points
18.
19.
Press the FFT Points/FFT Window soft key to set the jog shuttle control to FFT
Points.
Turn the jog shuttle to select 1k, 2k, 5k, 10k, 20k, 50k, or 100k.
Selecting the Time Window
20.
21.
While the jog shuttle control is set to FFT Points, press the FFT Points/FFT
Window soft key again. The FFT Window selection menu appears.
Select the time window from Rect, Hanning, and FlatTop.
As necessary, set Math2 to Math8 in a similar fashion.
Executing the Computation
22.
Press the Exec soft key.
ESC ESC
10-8
IM 701240-01E
10.3 Performing Power Spectrum Computation (FFT)
1
Explanation
This function displays the power spectrum of CH1 to CH16 and Math1 to Math7
waveforms.
2
Computation range: Start Point/End Point
By default, the measurement range is ±5 divisions of the display frame on the time axis.
You can limit this range.
The concept of the computation range is analogous to the concept of the selectable
range of cursor display position in cursor measurement.
For details, see “Selectable Range of Cursor Position” in section 11.4.
3
4
5
Scaling
Set the upper and lower limits of the math waveform display.
Auto:
The upper and lower limits are set according to the computed result.
Manual: The upper and lower limits can be set arbitrarily. The selectable range is
–9.9999E+30 to 9.9999E+30.
6
7
Unit
8
Unit can be set arbitrarily using up to four characters. The specified characters are
applied to the scale values.
9
Number of FFT Points
10
Note
11
If you set the number of FFT points to 50k or greater, only Math1 and Math2 can be used. In this
case, Math3 to Math8 cannot be used even in computations other than FFT.
Example 1) Math1 = C1×C2, Math2 = PS-LOGMAG(M1), Math3 = C3×C4.
If the number of FFT points of Math1 to Math3 is 50 k, only Math1 and Math2 are
computed.
Example 2) Math1 = C1, Math2 = C2, Math3: The number of FFT points is 50k
→ Computes only Math1 and Math2.
Waveform Computation
Select from 1000(1k), 2000(2k), 5000(5k), 10000(10k), 20000(20k), 50000(50k), and
100000(100k). Using the number of FFT points from the specified Start point, FFT is
performed and the power spectrum is displayed.
12
13
14
Time Window
Select from the three types listed below. For details on the time window, see page 2-42.
Rect (Rectangular): Best suited for transient signals that attenuate completely within the
time window.
Hanning:
Best suited for continuous and non-periodic signals.
FlatTop:
Best suited for improve the accuracy of the level even if the
frequency resolution is to be compromised.
15
16
17
18
App
Index
IM 701240-01E
10-9
10.3 Performing Power Spectrum Computation (FFT)
Displaying the Overall Value (Only When Measure Is Set to ON)
If the channels (Math1 to Math8) on which power spectrum computation (PS) is selected
are in the middle of the automated measurement of waveform parameters (MEASURE:
ON) and Rms is ON, the screen shows “Rms = overall value.” For details on the
automated measurement of waveform parameters, see section 11.5.
The overall value is the total RMS value determined from the frequency spectrum
included in the signal. The overall value is determined by summing the power spectrum
of all frequencies and then taking the square root.
Overall Value =
2 × PS0 +Σ PSi
(Vrms)
k
The k value varies depending on the selected time window as follows:
Time Window Type
k
Rect (Rectangular)
Hanning
Flattop
1
1.5
3.19693
Linear Scaling
When performing computation on a channel that has linear scaling set, the computation
is performed on the scaled value.
Notes on Power Spectrum Display
• The power spectrum cannot be computed, if the displayed record length is less than
number of computed points.
• The number of computed points, time window, Start Point, and End Point are common
to all computation channels.
• You cannot expand the FFT waveforms horizontally that would cause the number of
points to be 50 or less.
Notes on Computation
• Computation is not executed when you change Start Point or End Point while the
computation is stopped. Be sure to press Exec to perform the computation again. If
you do not, the waveform will not be displayed correctly when the screen is redrawn.
• Normally, computation is performed on the sampled data stored in the acquisition
memory. However, for waveforms that have been acquired in envelope mode,
computation is performed on the maximum/minimum values per acquisition interval.
Note
While computation is in progress,
10-10
is indicated at the upper left of the screen.
IM 701240-01E
1
10.4 Shifting the Phase
<For a description of this function, refer to page 2-42.>
2
Procedure
1.
2.
3.
3
Press MENU.
Press the MATH soft key.
Press the Mode soft key to select ON.
4
Setting the Computation Start and End Points
4.
5.
6.
Press the Start Point/End Point soft key to set the jog shuttle control to Start
Point.
Turn the jog shuttle to set the start point.
Likewise, set the End Point.
Setting the Computation
7.
8.
8
9
Use jog shuttle+SELECT to set Operation to Shift(S1).
10
Selecting the Channel on Which to Shift the Phase
Use jog shuttle+SELECT to select Source.
Waveform Computation
10.
6
7
Press the Setup soft key. The Math1 to Math8 setup dialog boxes appear.
Use jog shuttle+SELECT to select the desired Math waveform. The
corresponding Math waveform setup dialog box appears.
Setting the Computing Operation
9.
5
11
Setting the Scaling
11.
Use jog shuttle+SELECT to set Scale to Auto or Manual.
If you select Manual, proceed to step 12; if you select Auto, proceed to step 14.
Setting the Upper and Lower Limits of Waveform Display (When Scale Is
Set to Manual)
12.
13.
Use jog shuttle+SELECT to set Upper.
Likewise, set Lower.
12
13
14
Note
15
If you select Auto, you cannot set Upper and Lower.
16
17
18
App
Index
IM 701240-01E
10-11
10.4 Shifting the Phase
Setting the Unit
14.
Use jog shuttle+SELECT to set the Unit using up to four characters according
to the procedure given in section 4.2.
Setting the Label
15.
Use jog shuttle+SELECT to set the Label according to the procedure given in
section 4.2. For a description of the Label display, see section 8.10, “Setting
Waveform Labels.”
Turning ON/OFF the Math Waveform Display
16.
17.
Use jog shuttle+SELECT to set Display to ON or OFF.
Press ESC twice.
Selecting the Time (or the Number of Data Points) for Shifting the Phase
18.
19.
Press the Phase Shift soft key. The phase dialog box opens.
Use jog shuttle+SELECT to set the time (or number of data points) for shifting
the phase of each waveform. If the time base is set to internal clock (Int), set the
time for shifting the phase. If the time base is set to external clock (Ext), set the
number of data points for shifting the phase.
If the time base is set to
internal clock
ESC ESC
If the time base is set to external clock, the setup
menu used to set the number of data points for
shifting the phase appears.
As necessary, set Math2 to Math8 in a similar fashion.
Executing the Computation
20.
10-12
Press the Exec soft key.
IM 701240-01E
10.4 Shifting the Phase
1
Explanation
The phase of CH1 to CH16 and Math1 to Math7 waveforms can be displayed with the
phase shifted. Computation can also be performed on phase-shifted waveforms.
Computation range: Start Point/End Point
By default, the measurement range is ±5 divisions of the display frame on the time axis.
You can limit this range.
The concept of the computation range is analogous to the concept of the selectable
range of cursor display position in cursor measurement.
For details, see “Selectable Range of Cursor Position” in section 11.4.
2
3
4
5
Scaling
Set the upper and lower limits of the math waveform display.
Auto:
The upper and lower limits are set according to the computed result.
Manual: The upper and lower limits can be set arbitrarily. The selectable range is
–9.9999E+30 to 9.9999E+30.
6
Unit
8
7
Unit can be set arbitrarily using up to four characters. The specified characters are
applied to the scale values.
9
Allowable Phase Shift Range
10
The phase can be shifted in the following range.
Waveform Computation
• When the time base is set to internal clock
11
Selectable range: Time value of –(record length/2) to (record length/2)
Resolution:
1/sample rate
12
• When the Time Base Is Set to External Clock
Selectable range: –(record length/2) to (record length/2)
Resolution:
1
13
When a Waveform That Results by Offsetting the CH1 Waveform by 5 ms
Is Set to Math1
14
• Phase Shift CH1:
5 ms
• Math1
Operation: Shift (S1)
Source1: CH1
15
16
17
18
App
5 ms
IM 701240-01E
Index
10-13
10.4 Shifting the Phase
Linear Scaling
When performing computation on a channel that has linear scaling set, the computation
is performed on the scaled value.
Notes on Computation
Computation is not executed when you change Start Point or End Point while the
computation is stopped. Be sure to press Exec to perform the computation again. If you
do not, the waveform will not be displayed correctly when the screen is redrawn.
Note
When the waveform is displayed with the phase shifted,
screen.
10-14
is displayed at the upper left of the
IM 701240-01E
Chapter 11 Waveform Analysis/Search
1
11.1 Displaying History Waveforms
<For a description of this function, refer to pages 2-30 and 2-43.>
Procedure
2
Displaying the Waveform Data of a Selected Record
1.
2.
3.
4.
Press HISTORY.
Press the Select Record soft key.
Turn the jog shuttle to set the record No. you want to recall. Set the record No.
in the range of Start Record to End Record.
Press the Display Mode soft key to select One.
3
4
5
Displaying All of the Selected Waveform Data
5.
6.
7.
8.
Press the Start Record/End Record soft key to set the jog shuttle control to
Start Record.
Turn the jog shuttle to set the first record No. to be accumulated.
Likewise, set the last record No. (End Record) to be accumulated.
Press the Display Mode soft key to select All.
The waveform data of record numbers specified in steps 5 to 7 are displayed
accumulated.
To abort the accumulated display, press the Display Mode soft key to select
One.
6
7
8
9
10
11
Waveform Analysis/Search
12
13
14
15
16
17
18
App
Index
IM 701240-01E
11-1
11.1 Displaying History Waveforms
Average Display of Selected Waveform Data
9.
10.
11.
12.
Press the Start Record/End Record soft key to set the jog shuttle control to
Start Record.
Turn the jog shuttle to set the first record No. to be averaged.
Likewise, set the last record No. (End Record) to be averaged.
Press the Display Mode soft key to select Ave.
The waveform data of record numbers specified in steps 9 and 10 are displayed
averaged.
To abort the average display, press the Display Mode soft key to select One.
Displaying a List of Time Stamps
13.
14.
Press the Show Map soft key. A list of acquired data numbers and the time at
acquisition end are displayed.
Turn the jog shuttle to select the history waveform you want to display and
press SELECT.
Clearing the History Memory
15.
Press the History Clear soft key. All the waveforms in the acquisition memory
are cleared.
Note
Waveform acquisition cannot be started when the HISTORY menu is displayed.
11-2
IM 701240-01E
11.1 Displaying History Waveforms
1
Explanation
The acquisition memory retains waveform data of the last specified number of triggers.
If a trigger is activated beyond the number of triggers that can be held, the oldest
waveform data is cleared.
2
Selected Record No.
3
The selectable range is 0 to –(the number of retained waveforms – 1). The default value
is 0. The most recent (current) waveform is 0, the waveform previous to that is –1, and
so on.
The number of triggers that can be held varies depending on the selected record length.
For details, see appendix 2.
If the trigger count is 1, only the displayed waveform is held in the acquisition memory;
waveform data in the past are not held.
4
5
6
Display Mode
• Display Waveform Data of a Single Record: One
Select the waveform to be displayed using Select Record in the range specified by
Start Record and End Record.
7
8
• Display All of the Selected Waveform Data: All
The waveform data specified by Start Record and End Record are displayed
accumulated. The waveform data selected by Select Record is displayed brightly.
9
10
Show Map (A List of History Maps)
11
You can list the number of the waveform data stored in the acquisition memory and the
time at acquisition end. One screen displays 75 data points of information. You can scroll
through the data by using the jog shuttle.
12
Clearing the Waveform Data
13
• Clears all the waveforms in the acquisition memory.
• Cleared waveforms cannot be recovered.
14
Notes When Setting the History Memory Function
• You cannot use the history memory function when realtime recording is in progress.
• You cannot use the history memory function, if the acquisition mode is Average.
• If you abort the waveform acquisition, the triggered waveform is displayed as a valid
waveform.
• History records are not lost when waveform acquisition is stopped and then restarted,
provided that acquisition conditions remain unchanged.
• If you change the acquisition settings, history memory is cleared when you restart
acquisition using the new settings.
For details on the waveform acquisition conditions, see section 7.1.
• Average display is not possible on the following waveforms.
• Waveforms of a record length greater than equal to 1 MW.
Waveform Analysis/Search
• Average Display of the Selected Waveform Data: Ave
The waveform data specified by Start Record and End Record are displayed
averaged.
15
16
17
18
App
Index
IM 701240-01E
11-3
11.1 Displaying History Waveforms
Notes When Recalling Data Using the History Memory Function
• You cannot use the history memory function while waveform acquisition is in
progress.
• You cannot restart the waveform acquisition when the HISTORY menu is displayed.
• Settings are restricted by the following condition: End Record ≤ Select Record ≤ Start
Record.
• If you load a waveform record from the external storage medium, the loaded
waveform becomes Record 0. In the case of multiple records (sequential store), the
records will be loaded sequentially, with the most recent record as 0.
• Computation and automated measurement of waveform parameters are performed on
the record No. specified by Select Record. Analysis of old data is possible as long as
the history memory content remains unchanged after acquisition is restarted.
However, for average display, computation is not performed again when you specify a
different record.
• The time displayed in Show Map is the waveform trigger time. The information varies
depending on the trigger mode as follows:
Trigger Mode
Condition
Time Displayed in Show Map
Auto/Auto Level
Single
Log
Roll mode
Roll mode, trigger not activated
Stop time
Stop time
Start time
• When displaying all waveforms, if the selected number of records is large, it may take
an extended period for the display to complete. In this case,
is indicated at the
upper left corner of the screen. To abort the operation, set Display Mode to One.
• Turning OFF the power clears the waveform data (history waveform) in the acquisition
memory. However, if the acquisition memory backup is enabled, the data is backed
up.
For details on the acquisition memory backup function, see section 7.7.
11-4
IM 701240-01E
1
11.2 Searching History Memory Data Using Zones
(History Search Function)
<For a description of this function, refer to page 2-43.>
2
Procedure
1.
2.
3.
Press HISTORY.
Press the Search Mode soft key. The search mode menu appears.
Press the Zone soft key.
3
4
Setting the Search Zone
4.
5.
6.
Press the Search Setup soft key. The search setup menu appears.
Press the Select Zone soft key. The search condition selection menu appears.
Press any of the Zone1 to Zone4 soft keys to select the zone to which to set the
search condition.
5
6
Setting the Search Condition
7.
Press the Condition soft key to select OFF, IN, or OUT.
If you select IN or OUT, a search window appears in the area where the Source
channel is displayed.
7
8
Setting the Source Channel
8.
9.
Press the Source soft key. The source channel selection menu appears.
Press the soft key corresponding to the desired channel to select the source
channel.
9
10
11
Waveform Analysis/Search
12
13
14
15
16
17
18
App
Index
IM 701240-01E
11-5
11.2 Searching History Memory Data Using Zones (History Search Function)
Setting the Search Window
10.
11.
12.
13.
14.
15.
Press the Upper/Lower soft key to set the jog shuttle control to Upper.
Turn the jog shuttle to set the top of the search range. Pressing RESET resets
the value to default.
Press the Upper/Lower soft key to set the jog shuttle control to Lower.
Turn the jog shuttle to set the bottom of the search range. Pressing RESET
resets the value to default.
By controlling both Upper and Lower using the jog shuttle, you can move the
search window up and down without changing the vertical width.
Likewise, use the Left/Right soft key to set the horizontal range of the search
window.
Repeat steps 5 to 13 to set Zone1 to Zone4.
Setting the Search Logic
16.
Press the Logic soft key to select AND or OR.
Executing the Search
17.
Pressing the Search Exec soft key to execute the search.
While search is in execution,
is displayed at the upper left corner of the
screen.
Displaying the Waveform That Are Found
18.
19.
20.
Press the ESC to return to the HISTORY menu.
Press the Show Map soft key. A list of detected data numbers and the time at
acquisition end are displayed.
Turn the jog shuttle to select the data you want to display and press SELECT.
The waveform is displayed.
Resetting the Search Results
21.
11-6
Turn OFF the Search Mode in the HISTORY menu or turn OFF Zone1 to Zone4
and execute the search to reset the search results.
IM 701240-01E
11.2 Searching History Memory Data Using Zones (History Search Function)
1
Explanation
You can search for a waveform that matches the specified conditions from the past
waveforms in the acquisition memory and display it.
2
Select Zone
3
Four types of search zones can be registered in Zone1 to Zone4. You can set the
channel that is to be searched, the search condition, and the search range for each
search zone.
4
Condition
IN:
OUT:
OFF:
5
Searches for waveforms that pass through the specified search window.
Searches for waveforms that do not pass through the specified window.
Does not search for waveforms.
6
Source
Search is carried out on the channel that is specified as the Source. The channels that
can be specified are CH1 to CH16. Waveforms of other channels are also displayed.
7
Vertical Range of Search Window (Upper/Lower)
8
The selectable range is ±5 divisions. The resolution is 0.01 divisions.
Upper must always be greater than or equal to Lower.
9
Horizontal Range of Search Window (Left/Right)
10
The selectable range is ±5 divisions. The resolution is (10 division/record length).
Right must always be greater than or equal to Left.
11
AND: Searches for waveforms that meet all search conditions from Zone1 to Zone4.
OR: Searches for waveforms that meet any one of the search conditions from Zone1
to Zone4.
Waveform Analysis/Search
Logic
12
13
Search Range
The search range is between the Start Record and the End Record.
14
Search Order
The search is carried out from the most recent waveform to the oldest waveform.
15
Show Map (A List of Time Stamps)
16
Only the waveforms that are found are listed in Show Map. If the Search Mode is turned
OFF, all waveforms from Start Record to End Record are displayed.
17
18
App
Index
IM 701240-01E
11-7
11.3 Searching History Memory Data Using
Parameters (History Search Function)
<For a description of this function, refer to page 2-43.>
Procedure
1.
2.
3.
Press HISTORY.
Press the Search Mode soft key. The search mode menu appears.
Press the Parameter soft key.
Setting the Search Zone
4.
5.
6.
Press the Search Setup soft key. The search setup menu appears.
Press the Select Param soft key. The search condition selection menu appears.
Press any of the Param1 to Param4 soft keys to select the parameter to which
to set the search condition.
Setting the Search Condition
7.
Press the Condition soft key to select OFF, IN, or OUT.
Setting the Source Channel
8.
9.
10.
11-8
Press the Item Setup soft key. The parameter selection menu appears.
Use jog shuttle+SELECT to select the trace channel.
Use jog shuttle+SELECT to select the parameter.
IM 701240-01E
11.3 Searching History Memory Data Using Parameters (History Search Function)
1
Setting the Range for Judging the Measured Values of Waveform Parameters
11.
12.
13.
14.
15.
Press the Upper/Lower soft key to set the jog shuttle control to Upper.
Turn the jog shuttle to set the top of the search range. Pressing RESET resets
the value to default.
Press the Upper/Lower soft key to set the jog shuttle control to Lower.
Turn the jog shuttle to set the bottom of the search range. Pressing RESET
resets the value to default.
Repeat steps 5 to 14 to set Param1 to Param4.
2
3
4
Setting the Search Logic
16.
5
Press the Logic soft key to select AND or OR.
Setting the Search Range of the Measured Values of Waveform Parameters
17.
18.
19.
20.
6
Press the Time Range1/Time Range2 soft key to set the jog shuttle control to
Time Range1.
Turn the jog shuttle to set the left edge of the measuring range. Pressing
RESET resets the value to default.
Press the Time Range1/Time Range2 soft key to set the jog shuttle control to
Time Range2.
Turn the jog shuttle to set the right edge of the measuring range. Pressing
RESET resets the value to default.
Executing the Search
21.
11
Press the ESC to return to the HISTORY menu.
Press the Show Map soft key. A list of acquired data numbers and the time at
acquisition end are displayed.
Turn the jog shuttle to select the data you want to display and press SELECT.
12
13
14
Resetting the Search Results
25.
9
Waveform Analysis/Search
24.
8
10
Pressing the Search Exec soft key to execute the search.
While search is in execution,
is displayed at the upper left corner of the
screen.
Displaying the Waveform That Are Found
22.
23.
7
Turn OFF the Search Mode in the HISTORY menu or turn OFF Param1 to
Param4 and execute the search to reset the search results.
15
16
17
18
App
Index
IM 701240-01E
11-9
11.3 Searching History Memory Data Using Parameters (History Search Function)
Explanation
You can search for a waveform that matches the specified conditions from the past
waveforms in the acquisition memory and display it.
Search Parameter (Select Param)
Four types of search parameters can be registered in Parameter1 to Parameter4. You
can set the channel that is to be searched, the search condition, and the search range
for each search parameter.
Condition
IN:
OUT:
OFF:
Searches for waveforms entering the specified range of the specified parameter.
Searches for waveforms extending the specified range of the specified
parameter.
Does not search for waveforms.
Waveform Parameter (Item Setup)
Assign search parameters to each trace channel. Choose one of the automated
waveform measurement parameter.
Range for Judging the Measured Values of Waveform Parameters (Upper/Lower)
The selectable range is –9.9999E+30 to 9.9999E+30.
Logic
AND: Searches for waveforms that meet all search conditions from Param1 to Param4.
OR: Searches for waveforms that meet any one of the search conditions from Param1
to Param4.
Search Range of the Measured Values of Waveform Parameters (Time Range1/
Time Range2)
The selectable range is ±5 divisions. The resolution is 10 divisions/record length.
Time Range2 must be greater than or equal to Time Range2.
Search Range
The search range is between the Start Rec and the End Rec.
Search Order
The search is carried out from the most recent waveform to the oldest waveform.
Show Map (A List of Time Stamps)
Only the waveforms that are found are listed in Show Map. If the Search Mode is turned
OFF, all waveforms from Start Record to End Record are displayed.
11-10
IM 701240-01E
1
11.4 Measuring Waveforms Using Cursors
<For a description of this function, refer to page 2-44.>
2
Procedure
3
For H (Horizontal) Cursors (When Not Displaying the X-Y Waveform)
1.
Press CURSOR.
4
Selecting the Cursor Type
2.
3.
Press the Type soft key. The cursor type selection menu appears.
Press the Horizontal soft key.
5
Selecting the Waveform to Be Measured
4.
5.
6
Press the Trace soft key. The trace selection menu appears.
Use jog shuttle+SELECT to select the waveform to be measured.
7
Moving the Cursor
6.
7.
8.
Press the Cursor1/Cursor2 soft key to set the jog shuttle control to Cursor1.
Turn the jog shuttle to move Cursor1.
Likewise, move Cursor2. If the jog shuttle control is set to both Cursor1 and
Cursor2, both cursors are moved.
8
9
10
11
Waveform Analysis/Search
12
13
14
15
16
17
18
App
Index
IM 701240-01E
11-11
11.4 Measuring Waveforms Using Cursors
For V (Vertical) Cursors (When Not Displaying the X-Y Waveform)
1.
Press CURSOR.
Selecting the Cursor Type
2.
3.
Press the Type soft key. The cursor type selection menu appears.
Press the Vertical soft key.
Selecting the Waveform to Be Measured
4.
5.
Press the Trace soft key. The trace selection menu appears.
Use jog shuttle+SELECT to select the waveform to be measured.
If you set the waveform to be measured to All, LogicA, LogicB, or LogicA &
LogicB, proceed to step 6. If not, proceed to step 9.
Setting the Logic (When Trace Is Set to All, LogicA, LogicB, or LogicA & LogicB)
6.
Press the Logic Setup soft key. The logic setup menu appears.
Selecting the Notation of Cursor Measurement Values
7.
Use jog shuttle+SELECT to set Format to Binary or Hexa.
Note
The notation selected in step 7 applies to the notation of the numeric monitor display that is
shown on the right side of the screen. For the procedure of displaying the numeric monitor,
see section 8.13.
Selecting the Read Direction of Bit Data
8.
Use jog shuttle+SELECT to set Order to A1->A8 or B1->B8.
Moving the Cursor
9.
10.
11.
Press the Cursor1/Cursor2 soft key to set the jog shuttle control to Cursor1.
Turn the jog shuttle to move Cursor1.
Likewise, move Cursor2. If the jog shuttle control is set to both Cursor1 and
Cursor2, both cursors are moved.
Logic Setup appears
only when Trace is set
to the following:
All, LogicA, LogicB, or
LogicA & LogicB
11-12
IM 701240-01E
11.4 Measuring Waveforms Using Cursors
1
For Marker Cursors (When Not Displaying the X-Y Waveform)
1.
Press CURSOR.
2
Selecting the Cursor Type
2.
3.
Press the Type soft key. The cursor type selection menu appears.
Press the Marker soft key.
3
Selecting the Marker
4.
4
Press the Select soft key to select the desired marker from M1 to M4.
5
Selecting the Waveform to Be Measured
5.
6.
Press the Trace soft key. The trace selection menu appears.
Use jog shuttle+SELECT to select the waveform to be measured.
6
Moving the Cursor
7.
7
Press the Position soft key and turn the jog shuttle to move the cursor
As the cursor is moved, the displayed value of Position changes.
8
9
10
11
Waveform Analysis/Search
12
13
14
15
16
17
18
App
Index
IM 701240-01E
11-13
11.4 Measuring Waveforms Using Cursors
For Angle (Degree) Cursors (When Not Displaying the X-Y Waveform)
1.
Press CURSOR.
Selecting the Cursor Type
2.
3.
Press the Type soft key. The cursor type selection menu appears.
Press the Degree soft key.
Selecting the Waveform to Be Measured
4.
5.
Press the Trace soft key. The trace selection menu appears.
Use jog shuttle+SELECT to select the waveform to be measured.
Moving the Cursor
6.
7.
8.
Press the Cursor1/Cursor2 soft key to set the jog shuttle control to Cursor1.
Turn the jog shuttle to move Cursor1.
Likewise, move Cursor2. If the jog shuttle control is set to both Cursor1 and
Cursor2, both cursors are moved.
Moving the Reference Cursor
9.
10.
11.
Press the Ref1/Ref2 soft key to set the jog shuttle control to Ref1.
Turn the jog shuttle to move Ref1.
Likewise, move Ref2. If the jog shuttle control is set to both Ref1 and Ref2, both
cursors are moved.
Setting the Reference Angle
12.
13.
11-14
Press the Ref Value soft key.
Turn the jog shuttle to set the reference angle in the range of 1 to 720.
IM 701240-01E
11.4 Measuring Waveforms Using Cursors
1
For H&V Cursors (When Not Displaying the X-Y Waveform)
1.
Press CURSOR.
2
Selecting the Cursor Type
2.
3.
Press the Type soft key. The cursor type selection menu appears.
Press the H&V soft key.
3
Selecting the Waveform to Be Measured
4.
5.
4
Press the Trace soft key.
Use jog shuttle+SELECT to select the waveform to be measured.
5
Moving the Cursor
6.
7.
8.
9.
Press the Cursor1
/Cursor2
soft key to set the jog shuttle control to
Cursor1.
Turn the jog shuttle to move Cursor1.
Likewise, move Cursor2. If the jog shuttle control is set to both Cursor1 and
Cursor2, both cursors are moved.
6
Move Cursor1
8
and Cursor2
by carrying out steps similar to steps 6 to 8.
7
9
10
11
Waveform Analysis/Search
12
13
14
15
16
17
18
App
Index
IM 701240-01E
11-15
11.4 Measuring Waveforms Using Cursors
Cursor Jump (When the Cursor is Vertical, Marker, or Angle and When Not Displaying
the X-Y Waveform)
1.
Follow steps 1-3 on the previous pages to set the Type to Vertical, Marker, or
Degree.
Setting Jumps
2.
3.
Press the Cursor Jump soft key. A menu for selecting the cursor to be jumped
and the jump destination appears.
Press the soft key corresponding to the type of jump to select the desired cursor
and the destination.
Executing the Jump
4.
Press the Jump Exec soft key. The cursor moves to the jump destination
screen.
Vertical
cursor
11-16
Marker
cursor
Angle
cursor
IM 701240-01E
11.4 Measuring Waveforms Using Cursors
1
For Horizontal (H) Cursors (When Displaying the X-Y Waveform)
1.
Press CURSOR.
2
Selecting the Cursor Type
2.
3.
Press the Type soft key. The cursor type selection menu appears.
Press the Horizontal soft key.
3
Selecting the Waveform to Be Measured
4.
5.
4
Press the Trace soft key.
If X Axis of the DISPLAY menu is set to Single, use jog shuttle+SELECT to
select the trace. If X Axis is set to Quad, press the soft key corresponding to the
X-Y waveform (XY1 to XY4) to select the waveform to be measured.
6
Moving the Cursor
6.
7.
8.
5
Press the H Cursor1/H Cursor2 soft key to set the jog shuttle control to
Cursor1.
Turn the jog shuttle to move Cursor1.
Likewise, move Cursor2. If the jog shuttle control is set to both H Cursor1 and H
Cursor2, both cursors are moved.
7
8
9
10
11
Waveform Analysis/Search
12
13
14
15
16
17
18
App
Index
IM 701240-01E
11-17
11.4 Measuring Waveforms Using Cursors
For Vertical (V) Cursors (When Displaying the X-Y Waveform)
1.
Press CURSOR.
Selecting the Cursor Type
2.
3.
Press the Type soft key. The cursor type selection menu appears.
Press the Vertical soft key.
Selecting the Waveform to Be Measured
4.
5.
Press the Trace soft key.
If X Axis of the DISPLAY menu is set to Single, the channel specified by X trace
of the DISPLAY menu is displayed. Since this setting is for viewing purpose
only, you cannot change it.
If X Axis is set to Quad, press the soft key corresponding to the X-Y waveform
(XY1 to XY4) to select the waveform to be measured.
Moving the Cursor
6.
7.
8.
11-18
Press the V Cursor1/V Cursor2 soft key to set the jog shuttle control to V
Cursor1.
Turn the jog shuttle to move V Cursor1.
Likewise, move V Cursor2. If the jog shuttle control is set to both V Cursor1 and
V Cursor2, both cursors are moved.
IM 701240-01E
11.4 Measuring Waveforms Using Cursors
1
For H&V Cursors (When Displaying the X-Y Waveform)
1.
Press CURSOR.
2
Selecting the Cursor Type
2.
3.
Press the Type soft key. The cursor type selection menu appears.
Press the H&V soft key.
3
Selecting the Waveform to Be Measured
4.
5.
4
Press the Trace soft key.
If X Axis of the DISPLAY menu is set to Single, use jog shuttle+SELECT to
select the trace. If X Axis is set to Quad, press the soft key corresponding to the
X-Y waveform (XY1 to XY4) to select the waveform to be measured.
6
Moving the Cursor
6.
7.
8.
9.
Press the Cursor1
/Cursor2
soft key to set the jog shuttle control to
Cursor1.
Turn the jog shuttle to move Cursor1.
Likewise, move Cursor2. If the jog shuttle control is set to both H Cursor1 and H
Cursor2, both cursors are moved.
Move Cursor1
5
and Cursor2
7
8
by carrying out steps similar to steps 6 to 8.
9
10
11
Waveform Analysis/Search
12
13
14
15
16
17
18
App
Index
IM 701240-01E
11-19
11.4 Measuring Waveforms Using Cursors
For Marker Cursors (When Displaying the X-Y Waveform)
1.
Press CURSOR.
Selecting the Cursor Type
2.
3.
Press the Type soft key. The cursor type selection menu appears.
Press the Marker soft key.
Selecting the Waveform to Be Measured
4.
5.
Press the Trace soft key.
If X Axis of the DISPLAY menu is set to Single, use jog shuttle+SELECT to
select the trace. If X Axis is set to Quad, press the soft key corresponding to the
X-Y waveform (XY1 to XY4) to select the waveform to be measured.
Moving the Cursor
6.
7.
Press the Position soft key.
Turn the jog shuttle to move Position.
As the cursor is moved, the displayed value of Position changes.
Note
The marker is displayed for the Y Trace (target Y-axis waveform) specified in the DISPLAY
menu.
Explanation
Limitations
Cursor measurements cannot be made on the following waveforms.
• Snapshot waveforms
• Accumulated waveforms other than the most recent waveform.
Cursor Types and Measurement Items: Type (When Not Displaying the X-Y Waveform)
• H (Horizontal) Cursor
Measures the Y-axis value at the cursor position.
11-20
Y1
The Y-axis value at Cursor1
Y2
The Y-axis value at Cursor2
∆Y
The difference between the Y-axis values at Cursor1 and Cursor2
IM 701240-01E
11.4 Measuring Waveforms Using Cursors
1
• V (Vertical) Cursor
Measures the X-axis value at the cursor position.
2
X1
The X-axis value at Cursor1
X2
The X-axis value at Cursor2
∆X
The difference between the X-axis values at Cursor1 and Cursor2
1/∆X
The inverse or the difference between the X-axis values at Cursor1 and Cursor2
Y1
The Y-axis value at Cursor1
Y2
The Y-axis value at Cursor2
∆Y
The difference between the Y-axis values at Cursor1 and Cursor2
4
• Marker Cursors
Move the cursor on the waveform data and measure the value of each point on the
waveform. M1 (Marker 1) to M4 (Marker 4) can be set on different waveforms.
Y1 to Y4
The Y-axis values of M1 to M4
∆Y2
The difference between the Y-axis values of M1 and M2
∆Y3
The difference between the Y-axis values of M1 and M3
∆Y4
The difference between the Y-axis values of M1 and M4
X1 to X4
The X-axis values of M1 to M4
∆X2
The difference between the X-axis values of M1 and M2
∆X3
The difference between the X-axis values of M1 and M3
∆X4
The difference between the X-axis values of M1 and M4
3
5
6
7
8
9
• Angle Cursor (Degree)
Set the measurement zero point (position of reference cursor Ref1) and the end point
(position of the reference cursor Ref2) on the X-axis within the screen and assign an
angle corresponding to the width of Ref1 and Ref2. Using this angle as a reference,
this function measures the angle of the two angle cursors (Cursor1 and Cursor2).
The angle of Cursor1 from Ref1
X2
The angle of Cursor2 from Ref1
∆X
The angle difference between Cursor1 and Cursor2
Y1
The Y-axis value at Cursor1
Y2
The Y-axis value at Cursor2
∆Y
The difference between the Y-axis values at Cursor1 and Cursor2
Range of reference width
1 to 720°
11
Waveform Analysis/Search
X1
10
12
13
14
• H&V Cursor
Measures the Y-axis and X-axis values at the cursor position.
15
Y1
The Y-axis value at horizontal Cursor1
Y2
The Y-axis value at horizontal Cursor2
∆Y
The difference between the Y-axis values at horizontal Cursor1 and horizontal
Cursor2
X1
The X-axis value at vertical Cursor1
X2
The X-axis value at vertical Cursor2
∆X
The difference between the X-axis values at vertical Cursor1 and vertical Cursor2
16
17
18
Cursor Types and Measurement Items: Type (When Displaying the X-Y Waveform)
• H (Horizontal) Cursor
Measures the Y-axis value at the cursor position.
IM 701240-01E
Y1
The Y-axis value at H Cursor1
Y2
The Y-axis value at H Cursor2
∆Y
The difference between the Y-axis values at H Cursor1 and H Cursor2
App
Index
11-21
11.4 Measuring Waveforms Using Cursors
• V (Vertical) Cursor
Measures the X-axis value at the cursor position.
X1
The X-axis value at V Cursor1
X2
The X-axis value at V Cursor2
∆X
The difference between the X-axis values at V Cursor1 and V Cursor2
• H&V Cursor
Measures the Y-axis and X-axis value at the cursor position.
Y1
The Y-axis value at H Cursor1
Y2
The Y-axis value at H Cursor2
∆Y
The difference between the Y-axis values at H Cursor1 and H Cursor2
X1
The X-axis value at V Cursor1
X2
The X-axis value at V Cursor2
∆X
The difference between the X-axis values at V Cursor1 and V Cursor2
• Marker Cursors
Move the cursor on the waveform data and measure the value of each point on the
waveform.
T
Display the time difference from the trigger point at the cursor
X
The X-axis value at Cursor
Y
The Y-axis value at Cursor
Movement Range of the Cursors (When Not Displaying the X-Y Waveform)
• H Cursor
Can be set in the range of ±5 divisions. The resolution is 0.01 division.
• V Cursor, Marker Cursor, and Angle Cursor
Can be set in the range of ±5 divisions. The resolution is 10 divisions/record length.
Movement Range of the Cursors (When Displaying the X-Y Waveform)
• H Cursor, V Cursor, and H&V Cursor
Can be set in the range of ±5 divisions. The resolution is 0.01 division.
• Marker Cursors
Can be set in the range of ±5 divisions. The resolution is 10 divisions/record length.
Display Format of Logic Waveforms (When Not Displaying the X-Y Waveform)
You can set the following items when measuring logic waveforms using V cursors.
• Selecting the Notation of Cursor Measurement Values: Format
Select the notation system used to display cursor measurement values.
Binary: Displays values in binary notation.
Hexa: Displays values in hexadecimal notation.
• Read Direction of Bit Data: Order
Select the direction of reading the bit data of the logic input.
A1->A8 B1->B8: Bit 1 to bit 8 of LogicA, bit 1 to bit 8 of LogicB
B8->B1 A8->A1: Bit 8 to bit 1 of LogicB, bit 8 to bit 1 of LogicA
11-22
IM 701240-01E
11.4 Measuring Waveforms Using Cursors
1
• Combining of the Bit Data
The data of LogicA and LogicB can be combined and handled as 16-bit data.
• Handling of the OFF Bit
• In binary notation, a dash is displayed at the bit.
• In hexadecimal notation, value is displayed as though the bit does not exist.
2
3
Measurement Example of Logic Waveforms
The values of measurement parameters Y1 and Y2 when the logic waveform is
measured using vertical cursors are as follows.
• When LogicA or LogicB is measured by itself and OFF bits do not exist
Cursor 1
Cursor 2
0
1
2
3
4
4
5
• When the order is A1->A8 B1->B8
Binary Y1: 01001010
Y2: 10110010
Hexa
Y1: 4A
Y2: B2
• When the order is B8->B1 A8->A1
Binary Y1: 01010010
Y2: 01001101
Hexa
Y1: 52
Y2: 4D
5
6
7
• When LogicA or LogicB is measured by itself and OFF bits exist
Cursor 1
Cursor 2
0
1
3
4
• When the order is A1->A8 B1->B8
Binary Y1: 01-01-10
Y2: 10-10-10
Hexa
Y1: 16
Y2: 2A
• When LogicA & LogicB (combined data of LogicA and LogicB) is measured and
OFF bits exist
Cursor 1
A1
A3
A4
A6
B2
LogicB B3
11
12
13
15
• When the order is A1->A8 B1->B8
Binary Y1: 01-01-101-11-01
Y2: 10-10-100-00-01Hexa Y1: 2DD
Y2: 541
A7
B0
10
14
Cursor 2
A0
LogicA
8
Waveform Analysis/Search
7
7
9
• When the order is B8->B1 A8->A1
Binary Y1: 01-10-10
Y2: 01-01-0
Hexa
Y1: 1A
Y2: 15
6
6
• When the order is B8->B1 A8->A1
Binary Y1: -10-11-101-10-10
Y2: -10-00-001-01-01
Hexa Y1: 5DA
Y2: 415
16
17
18
App
B5
B6
Index
IM 701240-01E
11-23
11.4 Measuring Waveforms Using Cursors
Cursor Jump (When Not Displaying the X-Y Waveform)
For V cursors, marker cursors, and angle cursors, you can move M1 to M4, Cursor1, and
Cursor2 to the center of the zoom window. The cursors can be jumped in the following
manner.
• Marker Cursors
to Z1
Make the selected marker jump to the Z1 window.
to Z2
Make the selected marker jump to the Z2 window.
• V Cursor and Angle Cursor
C1 to Z1
Make Cursor1 jump to the Z1 window
C1 to Z2
Make Cursor1 jump to the Z2 window
C2 to Z1
Make Cursor2 jump to the Z1 window
C2 to Z2
Make Cursor2 jump to the Z2 window
Notes When Making Cursor Measurements
• The time axis values are measured from the trigger position.
• The measured value will display “***,” if the measurement is not possible.
• The pulse/rotate setting (see section 5.20) is applied to the X-axis (horizontal)
measurement values in cursor measurements.
Selectable Range of Cursor Position
In cursor measurements, measurement is performed on the data stored in the acquisition
memory not on the displayed data. Since 1001 points along the time axis are used to
displayed the waveform, the number of acquired data points is equal to “record length ×
1.001.” If the record length is set to 10 kW, the number of acquired data points is 10010.
Therefore, 10 points of measured data will exist at the same position on the screen. The
movement range of the cursor position is normally within ±5 divisions around the center
position of the waveform display frame. In this case, if the cursor display position is set to
+5 div, only 1 point out of 10 points can be measured even if there are 10 points of
measured data at the same time axis position. In such case, the cursor position can be
set in the range of –5 divisions to +5.009 divisions (if the record length is set to 10 kW).
In other words, the data at the right end of the waveform display frame can be measured
by setting the cursor position in the range of 5.000 to 5.009 divisions. Because the
number of points at the same time axis position increases as the record length gets
larger, the range varies depending on the record length (5.000 to 5.0099 divisions for
100 kW).
–5 div
Cursor movement range on the screen
5 div
0
10 points of measured
data exist
Cursor positions for
10 points of measured data
0.001 div = 1 point of
measured data
5.000 div 5.009 div
–5.000 div –4.991 div
0.000 div 0.009 div
Selectable range of cursor position
Record length = 10 kW (10010 points)
11-24
IM 701240-01E
1
11.5 Automated Measurement of Waveform
Parameters
<For a description of this function, refer to page 2-45.>
2
Procedure
1.
2.
3
Press MEASURE.
Press the Mode soft key , and press the ON soft key.
4
Selecting the Measurement Parameter
3.
Press the Item Setup soft key. The measurement parameter setup dialog box
appears.
• Selecting the Waveform to Be Measured
4.
Press the Trace soft key. The trace selection menu appears.
5.
Use jog shuttle+SELECT to select waveform to be measured from CH1 to CH6
or Math1 to Math8.
• Selecting the Measurement Parameter
6.
Use jog shuttle+SELECT to turn ON/OFF each item on the measurement
parameter dialog box.
You can turn OFF all parameters at once by pressing the All Clear.
You can copy the current parameter settings to all traces by pressing the Copy
to All Trace soft key.
7.
Repeat steps 4 to 6 as many times as necessary.
5
6
7
8
9
10
11
Waveform Analysis/Search
12
13
14
15
16
17
18
App
Index
IM 701240-01E
11-25
11.5 Automated Measurement of Waveform Parameters
Setting the Delay
8.
Press the Delay Setup soft key. The Delay Setup dialog box appears.
• Selecting the Waveform to Be Measured
9.
Press the Trace soft key. The trace selection menu appears.
10. Use jog shuttle+SELECT to select waveform to be measured.
• Setting the Delay
11. Use jog shuttle+SELECT to set Mode of the Delay Setup dialog box to Time,
Degree, or OFF.
12. Use jog shuttle+SELECT to set Polarity under Measure to (rising edge) or
(falling edge).
13. Use jog shuttle+SELECT to set Edge Count under Measure.
14. Use jog shuttle+SELECT to select whether the trace or the trigger is to be the
reference. If you select Trace, proceed to step 15.
15. Use jog shuttle+SELECT to set Trace under Reference.
16. Use jog shuttle+SELECT to set Polarity under Reference to (rising edge) or
(falling edge).
17. Use jog shuttle+SELECT to set Edge Count under Reference.
11-26
IM 701240-01E
11.5 Automated Measurement of Waveform Parameters
1
Setting the 1 Cycle Mode
18.
Press the 1Cycle Mode soft key to select ON or OFF.
2
Setting the Measurement Range
19.
20.
21.
Press the Time Range1/Time Range2 soft key to set the jog shuttle control to
Time Range1.
Turn the jog shuttle to set the measurement start point.
Likewise, set Time Range2 (measurement end point).
3
4
Note
Up to 10 MW from the measurement start point (Time Range1) are measured.
5
Selecting the Target Waveform for Distal, Mesial, and Proximal Points
22.
23.
24.
Press the Next 1/2 soft key
Press the Trace soft key. The trace selection menu appears.
Press the soft key corresponding to the desired waveform to select the target
waveform.
7
8
Setting the Distal, Mesial, and Proximal Unit
25.
6
Press the Dist/Prox Mode soft key to set the unit for distal, mesial, and proximal
points to % or Unit.
9
Setting Distal, Mesial, and Proximal
26.
27.
10
Press the Distal, Mesial, or Proximal soft key.
Turn the jog shuttle to set the distal, mesial, or proximal point.
11
Selecting the High and Low Setting
Waveform Analysis/Search
28.
Press the High/Low Mode soft key to select Auto or MAX-MIN.
12
13
14
15
16
17
18
App
Index
IM 701240-01E
11-27
11.5 Automated Measurement of Waveform Parameters
Explanation
Limitations
Automated measurement of waveform parameters cannot be performed on the following
waveforms.
• Snapshot waveforms
• Accumulated waveforms other than the most recent waveform.
Measurement Parameters (Item Setup)
You can select among the 28 types of measurement parameters shown below and delay
between channels. Up to 48000 combinations of parameters of all traces (CH1 to CH16
and Math1 to Math8) can be saved.
• Voltage-axis Parameters
P-P : Peak to Peak Value (MAX - MIN) [V]
Max : Maximum Voltage [V]
Min : Minimum Voltage [V]
Rms1 : Root Mean Square Value
(1/ n )(Σ(xi)2)1/2 [V]
Avg : Average Voltage (1/n)Σxi [V]
Sdev: Standard Deviation
(SDv)2
(1/n(Σxi2 –(Σxi)2/n))1/2 [V]
–Ovr shoot : Undershoot Value
(LOW - MIN)/(HIGH - LOW) x 100 [%]
(–Ovr)1
+Ovr shoot : Overshoot Value
(+Ovr)1
High
Low
Amp
Mid
(MAX - HIGH)/(HIGH - LOW) x 100[%]
: High Level Voltage [V]
: Low Level Voltage [V]
: Amplitude (High-Low) [V]
: (MAX+MIN)/2
1. If Rms is ON on the channels (Math1 to Math8) on which power spectrum computation (PS) is selected,
the screen shows “Rms = overall value.” For details on the power spectrum computation and overall
value, see section 10.3.
2. ( ) shows the corresponding name at the measurement item setting screen.
Max
High
+Oshot
P-P
-Oshot
Low
Min
• Time-axis Parameters
Rise
Fall
Freq
Period
: Rise Time [s]
: Fall Time [s]
: Frequency [Hz],1/PERIOD
: Period [s]
(Prod)1
Avg Freq : Mean Frequency in
(FR-A)1
Measuring Range[Hz]
Avg Period: Mean Period in
(PR-A)1
Measuring Range[s]
+ Width
Period
- Width
+Width : Width (s) Greater than the Mesial Value
(+Wd)1
–Width : Width (s) Smaller than the Mesial Value
(–Wd)1
Duty
: Duty Ratio + Width/Period x 100[%]
1. ( ) shows the corresponding name at the measurement
item setting screen.
High (100%)
Distal Line (90%)
Mesial Line (50%)
Proximal Line (10%)
Low(0%)
Rise
Pulse
(PlsN)
Fall
: Pulse Count
When Pulse=3
Set the measurement range
(T-Range) to match the pulse
width of the signal being measured.
Distal Line (90%)
Mesial Line (50%)
Proximal Line (10%)
Measurement
Range
11-28
IM 701240-01E
11.5 Automated Measurement of Waveform Parameters
Automated measurement of various waveform parameters are performed on the data
stored to the acquisition memory. Up to 48000 data points among the parameters that
are automatically measured can also be saved to a file. For details, see section 13.11.
Burst1, Burst2: Burst Width [S] Set the measurement range (T-Range) to match
the burst width of the signal being measured.
(Bst1, Bst2)
1
2
3
Distal Line (90%)
Mesial Line (50%)
4
Proximal Line (10%)
T1
Burst2
Burst1
Measurement
Range
5
T2
• Other Measurement Parameters
Int1TY: The area under the positive amplitude
Int2TY: The area under the positive amplitude – the area under the negative
amplitude
Int1XY: The summation of the triangular area of the X-Y waveform
Int2XY: The summation of the trapezoidal area of the X-Y waveform
6
7
8
For details regarding the area calculations, see Appendix 4.
Setting the Delay
9
The time difference between the rising or falling edges of trace waveforms or trigger
points is called the delay between channels.
Measurement Range
1 count
Mesial Line
Setting Example of Reference
Waveform
• Edge Polarity
• Edge Count
: (Rising)
: N1(1 to 9)
12
Delay between Channels
1 count
N2 count
Setting Example of Measurement
Waveform
Measurement
Waveform
• Edge Polarity
• Edge Count
11
Waveform Analysis/Search
Reference
Waveform
N1 count
10
: (Falling)
: N2(1 to 9)
13
14
• If Mode is set to Time or Degree, the delay is measured. The default setting is OFF.
Time:
Display the delay between channels as a time
Degree: Display the delay between channels as an angle
Degree = Delay (s)/Period (s) × 360 (deg). The period is that of a reference
waveform.
• Select (rising edge) or (falling) for the slope of the edge to be detected using
Edge Polarity. The default setting is rising.
• Set the number of edges to detect before actually considering it a detection point in
Edge Count. The range is an integer from 1 to 9. The default value is 1.
• The voltage level at the detection point is the mesial point.
• The parameter name when the measured value is displayed is (Dly).
16
17
18
App
Note
If the Mode is set to Degree and the reference waveform is Trig, the measured value shows
“***.”
IM 701240-01E
15
11-29
Index
11.5 Automated Measurement of Waveform Parameters
1 Cycle Mode
This mode is used to compute items related to the voltage axis or the area over one
cycle after determining the cycle. This mode is suited to items such as Rms and Avg that
produce errors depending on the measurement range.
This mode does not affect the items related to the time axis or the area of the X-Y
waveforms.
Setting the Measurement Range (Time Range1/Time Range2)
By default, the ±5 divisions of the time axis display frame is the measurement range.
However, this range can be shortened. The measurement range is specified using two
vertical cursors. The measurement start point is the position where the fine dotted line is
located, and the measurement end point is the position where the coarse dotted line is
located. Up to 10 MW from the measurement start point (Time Range1) are measured.
The concept of the measurement range is analogous to the concept of the selectable
range of cursor display position in cursor measurement.
For details, see section 11.4, “Selectable Range of Cursor Position.”
Setting the Distal, Mesial, and Proximal Unit (Dist/Prox Mode)
Select the method of assigning the three levels that are used as references in
measurements such as the rise and fall times.
• %
The distal, mesial, and proximal values are set in terms of percentages when High of
any trace (CH1 to CH16, Math1 to Math8) and Low are taken to be 100.0% and 0.0%,
respectively.
• Unit
Set the distal, mesial, and proximal values of any trace (CH1 to CH16, Math1 to
Math8) to arbitrary voltage or temperature values.
Setting Distal, Mesial, and Proximal
Unit:
Dist/Prox Mode
Proximal range: 0.0 to 99.8 (resolution: 0.1%) or voltage or temperature corresponding
to ±10 divisions (resolution: varies depending on the module).
Mesial range:
0.0 to 99.9 (resolution: 0.1%) or voltage or temperature corresponding
to ±10 divisions (resolution: varies depending on the module).
Distal range:
0.0 to 100.0 (resolution: 0.1%) or voltage or temperature
corresponding to ±10 divisions (resolution: varies depending on the
module).
11-30
IM 701240-01E
11.5 Automated Measurement of Waveform Parameters
1
Selecting the High and Low Setting (High/Low Mode)
High indicates the 100% level in measurements such as the rise or fall time. And, Low
indicates the 0% level. Select the assignment method of High and Low from the following
two methods.
• Auto
Sets the higher amplitude level to High and lower level to Low within the
measurement range based on the voltage level frequency of the waveform by taking
the effects of ringing, spikes, etc. into consideration. This method is best-suited when
measuring rectangular waveforms and pulse waveforms.
• MAX-MIN
Sets the maximum value to High and lowest value to Low in the measurement range.
This method is best-suited when measuring sine waveforms, ramp waveforms, etc. It
is not suited for measurement of waveforms with ringing and spikes.
2
3
4
5
6
Notes When Performing Automated Measurement of Waveform Parameters
7
8
9
10
11
Waveform Analysis/Search
• The measurement value displays “***” if the measurement is not possible (such as
when the measurement range is greater than or equal to 10 MW).
• For waveforms of small amplitude, correct measurements may not be possible.
• If there are two or more cycles of a waveform in the measurement range, the
measurement is made on the first waveform.
• Automated measurement is not possible on logic waveforms.
• If automated measurement is made on waveforms that are measured using the
realtime recording function, the execution of the automated measurement takes a
long period due to the hard disk access.
• Depending on the conditions such as the memory length, the number of measured
items, and the input waveform, the execution of the automated measurement may
take an extended period. While automated measurement is in progress,
is
indicated at the upper left corner of the screen.
• To abort the automated measurement, set Mode to OFF. The process is aborted at
that point.
• If X Axis is set to Quad in the DISPLAY menu, Int1XY and Int2XY cannot be
measured.
• For FFT waveforms, only Max and Min can be measured.
12
13
14
15
16
17
18
App
Index
IM 701240-01E
11-31
11.6 Performing Statistical Processing
<For a description of this function, refer to page 2-45.>
Procedure
Setting Normal Statistical Processing
1.
2.
3.
4.
5.
6.
7.
Press MEASURE.
Press the Mode soft key to select Statistics.
Press the Item Setup soft key. The measurement parameter dialog box and the
measurement channel menu appear.
Press the Trace soft key and use jog shuttle+SELECT to select the
measurement channel.
Turn the jog shuttle to move the cursor to the parameter you want to turn ON.
Press SELECT to turn on the parameter selected in step 5.
You can turn OFF all parameters at once by pressing the All Clear. You can
copy the current parameter settings to all traces by selecting “Copy to All
Trace.”
Repeat steps 4 to 6 as many times as necessary. Press ESC.
The setting of other parameters is the same as the automated measurement of
waveform parameters (see step 8 and following steps in section 11.5).
11-32
IM 701240-01E
11.6 Performing Statistical Processing
1
Setting Cyclic Statistical Processing
1.
2.
3.
4.
5.
6.
7.
8.
9.
Press MEASURE.
Press the Mode soft key to select Cycle Statistics.
Press the Item Setup soft key. The measurement parameter dialog box and the
measurement channel menu appear.
Press the Trace soft key and use jog shuttle+SELECT to select the
measurement channel.
Turn the jog shuttle to move the cursor to the parameter you want to turn ON.
Press SELECT to turn on the parameter selected in step 5.
You can turn OFF all parameters at once by pressing the All Clear. You can
copy the current parameter settings to all traces by selecting “Copy to All
Trace.”
Repeat steps 4 to 6 as many times as necessary. Press ESC.
Press the Cycle Trace soft key. The cycle trace menu appears.
Press the soft key corresponding to the channel to be used to determine the
cycle. If Own is specified, the cycle is determined on each waveform for
statistical processing.
The setting of other parameters is the same as the automated measurement of
waveform parameters (see step 19 and following steps in section 11.5).
3
4
5
6
7
8
9
Executing Statistical Processing
10.
2
Press the Measure Exec soft key. Statistical processing is executed. Press the
same key again to abort.
Proceed to step 11.
10
11
Waveform Analysis/Search
12
13
14
15
16
17
18
App
Index
IM 701240-01E
11-33
11.6 Performing Statistical Processing
Setting Statistical Processing of History Data
1.
2.
3.
4.
5.
6.
7.
Press MEASURE.
Press the Mode soft key to select History Statistics.
Press the Item Setup soft key. The measurement parameter dialog box and the
measurement channel menu appear.
Press the Trace soft key and use jog shuttle+SELECT to select the
measurement channel.
Turn the jog shuttle to move the cursor to the parameter you want to turn ON.
Press SELECT to turn on the parameter selected in step 5.
You can turn OFF all parameters at once by pressing the All Clear. You can
copy the current parameter settings to all traces by selecting “Copy to All
Trace.”
Repeat steps 4 to 6 as many times as necessary. Press ESC.
The setting of other parameters is the same as the automated measurement of
waveform parameters (see step 8 and following steps in section 11.5).
Executing Statistical Processing
8.
11-34
Press the Measure Exec soft key. Statistical processing is executed. Press the
same key again to abort.
Proceed to step 11.
IM 701240-01E
11.6 Performing Statistical Processing
1
Displaying the Results of Statistical Processing
11.
Press the Show Result soft key to display a list of the results of statistical
processing. Press the arrow key to scroll the list horizontally. Turn the jog shuttle
to scroll the list vertically.
Press the Max/Min Item1 to Max/Min Item6 soft keys to move the cursor to the
maximum and minimum values of each waveform parameter. The displayed
parameters from the left end correspond to Item1, Item2, Item3, Item4, Item5,
and Item6.
You can press the Sort soft key to sort the list in ascending (FWD) or
descending (REV) order.
2
3
4
5
6
7
8
9
10
Explanation
For example, if you selected P-P of CH1 as an automated measurement parameter, the
maximum, minimum, average, standard deviation, and the number of measured values
used in the statistical processing are displayed at the bottom section of the screen.
The result of statistical processing that can be displayed is three parameters of automated
measurement. If you selected four or more parameters for automated measurement, the first
three parameters in the automated measurement parameter selection menu (P-P, Amp, Max,
Min, *, Init1XY, and Init2XY) of Item Setup are displayed in order from the smallest channel.
Example 1: When CH1: P-P, Amp; CH2: Min; and CH3: Max, Min are selected
CH1: P-P, CH2: Min, and CH3: Max are displayed.
Example 2: If CH1: Max, Min and CH2: P-P and Amp are selected
CH1: Max, Mix, and CH2: P-P are displayed.
The results of statistical processing that are not displayed can be loaded in the following manner.
• Load the results into your PC using the communication function.
• Save the results of statistical processing as measured values of automated
measurement parameters (see section 13.11) and load the values into your PC.
• Scroll the list of statistical processing results using the arrow keys.
Statistical processing includes three types: normal statistical processing, cyclic statistical
processing, and statistical processing of history data.
IM 701240-01E
11-35
11
Waveform Analysis/Search
Statistical processing is performed on the same measurement parameters as those of
the automated measurement of waveform parameters. The following five statistics are
determined on the three measured values of automated measurement parameters.
• Max: Maximum value
• Min:
Minimum value
• Avg: Average value
• Sdv: Standard deviation
• Cnt:
Number of measured values used in the statistical processing
12
13
14
15
16
17
18
App
Index
11.6 Performing Statistical Processing
Normal Statistical Processing (Statistics)
Statistical processing is performed on all acquired waveforms while acquiring
waveforms. If you stop the waveform acquisition and start it again, statistical processing
continues from the statistical processing result obtained up to the previous stop.
Statistical processing is performed on the selected parameters for automated
measurement that are not displayed. Therefore, if you disable the statistical processing
of a displayed automated measurement parameter while waveform acquisition is in
progress, the statistical processing results of the next selected automated measurement
parameter in line to be displayed are displayed. The number of measured values used in
the statistical processing (Cnt) is the number of waveforms that have been acquired up
to that point.
If you add statistical processing on a new automated measurement parameter while
waveform acquisition is in progress or when it is stopped, the number of measured
values used in the statistical processing (Cnt) is the number of waveforms that have
been acquired since the parameter was added.
Cyclic Statistical Processing
The cycle of the displayed waveform is determined in order from the oldest data, the
selected parameters for automated measurement are measured on the data within the
cycle, and statistical processing is performed. The cycle is determined in the same
fashion as the Period for the waveform parameter. You can select whether to apply the
cycle of the specified waveform to all waveforms or determine the cycle for each
waveform.
• CH, Math: Performs automated measurement of waveform parameters on all target
waveforms per cycle of the specified channel, and performs statistical
processing.
• Own:
Determines the cycle for each target waveform, performs automated
measurement of waveform parameters for each cycle, and performs
statistical processing. However, if signals of different cycles are applied
to multiple channels, automated measurement of waveform parameters
and statistical processing are performed for the number of cycles of the
channel whose cycle is the slowest on all other channels.
When Own is selected as the waveform used to determine the cycle
CH1
Applicable cycles
CH2
Applicable cycles
CH3
In the left figure, the number of
cycles of the channel whose
cycle is the slowest (CH3) is 4.
Therefore, statistical
processing is performed on the
4 oldest cycles of data for CH1
and CH2, also. The rest of the
data is not used in statistical
processing.
Applicable cycles
Statistical processing is performed from the oldest data of the displayed waveform in
blocks of cycles.
It can not be used with the 1 cycle mode at the same time.
In addition, the following waveform parameters are not measured:
• For waveforms on which the cycle is measured: Avg Freq (average frequency), Avg
Period (average period), PlsN (pulse count), Int1XY (area), Int2XY (area), and Delay.
• For other waveforms: Int1XY (area), Int2XY (area), and Delay.
11-36
IM 701240-01E
11.6 Performing Statistical Processing
1
Statistical Processing of History Data
Performs automated measurement of waveform parameters on the waveform that is
acquired using the history memory function and performs statistical processing.
Statistical processing is performed from the oldest waveform. The range on which the
statistics are measured is the waveform that is displayed on Show Map. It can be used
with Delay and 1 cycle mode.
Target Waveforms
2
3
4
CH1 to CH16, and Math1 to Math8
However, Math1 to Math8 are not applicable for statistical processing of history data.
5
Automated Measurement Parameters for Statistical Processing
The parameters on which statistical processing is performed are the parameters of
automated measurement of waveform parameters in section 11.5. The result of
statistical processing that can be displayed is only three parameters of automated
measurement.
6
Measurement Range for Statistical Processing
8
7
The measurement range is the same as that specified for automated measurement of
waveform parameters (see section 11.5).
9
Show Results
10
11
Waveform Analysis/Search
If you perform cyclic statistical processing or statistical processing of history data, a list of
measured results can be displayed for the selected automated measurement
parameters. The waveforms are numbered from the oldest cycle data or history data,
and the corresponding results of automated measurement are displayed. The maximum
and minimum values of each waveform parameter are displayed using ↑ (maximum) and
↓ (minimum). If there are multiple points that are of the same value, the maximum and
minimum values are marked on the oldest data. The number of data points that can be
listed is 48000. If this value is exceeded, the most recent 48000 points of automated
measurement parameters of history waveforms or data are displayed. In this case, the
maximum and minimum values may exist outside the displayed list. In such case, ↑
(maximum) and ↓ (minimum) that are outside the range are not displayed.
In statistical processing of history data, you can select a waveform using the jog shuttle
and press SELECT to display the selected historical waveform.
In cyclic statistical processing, you can select a number using the jog shuttle and press
SELECT to zoom in on the waveform (1 cycle) of the selected number. Statistical
processing is performed only on the data that can be listed.
12
13
14
15
16
Notes When Performing Statistical Processing
• While statistical processing is in progress,
is indicated at the upper left corner of
the screen. All soft keys except the Measure Abort soft key are disabled.
• Statistical processing is not possible in the following cases.
• Realtime recorded waveforms
• FFT waveforms
• The number of data points in the measurement range (see section 11.5) is greater
than or equal to 10 Mpoints.
• Depending on the conditions such as the record length, the number of parameters on
which statistical processing is performed, and the input waveform, the execution or
termination (aborting) may take an extended time.
IM 701240-01E
11-37
17
18
App
Index
Chapter 12 Printing the Screen Image
1
12.1 Printing on the Built-in Printer
<For a description of this function, refer to page 2-49.>
Procedure
1.
2.
Press MENU.
Press the PRINT soft key.
2
3
Selecting the Printer
3.
4.
4
Press the Print to soft key. The printer selection menu appears. (Net Print
appears only when the Ethernet interface option is installed.)
Press the Printer soft key.
5
Setting the Output Format
5.
6.
6
Press the Format soft key. The output format selection menu appears.
Press the Normal, Fine, Zoom Print, or A4 Print soft key.
7
Printing in Normal Output Format (When Normal Is Selected in Step 6)
Setting a Comment
7.
8.
8
Press the Comment soft key.
Enter the comment string according to the procedure given in section 4.2.
Proceed to step 30 on page 12-5.
9
10
11
12
Printing the Screen Image
13
14
15
16
17
18
App
Index
IM 701240-01E
12-1
12.1 Printing on the Built-in Printer
Fine Print (When Fine Is Selected in Step 6)
Setting the Magnified Print
7.
Press the Print Mag soft key, and use the jog shuttle to set the magnification
along the time axis for the printing. The top section of the menu shows the
record time corresponding to 10 divisions. The bottom section shows the
number of pages when printing using the record time shown in the top section.
Setting the Print Range
8.
9.
10.
Press the Time Range1/Time Range2 soft key to set the jog shuttle control to
Time Range1.
Use jog shuttle+SELECT to set the print start point.
Likewise, set Time Range2 (print end point).
Proceed to step 11 on page 12-3.
Zoom Print (When Zoom Print Is Selected in Step 6)
Setting Zoom Box Z2
7.
Press the Z2 Mag/Z2 Position soft key to set the jog shuttle control to Time Z2
Mag.
Turn the jog shuttle to set the record time of the Z2 zoom box.
Likewise, set the zoom position of the Z2 zoom box with Z2 Position.
8.
9.
Setting the Print Magnification
10.
Press the Print Mag soft key, and use the jog shuttle to set the magnification
along the time axis for the printing. The top section of the menu shows the
record time corresponding to 10 divisions. The bottom section shows the
number of pages when printing using the record time shown in the top section.
Note
•
•
12-2
In zoom print, the range of zoom box Z2 (10 divisions) is printed.
The Z2 Mag/Z2 Position setting is linked with the ZOOM menu (see section 8.5) setting.
IM 701240-01E
12.1 Printing on the Built-in Printer
1
A4 Print (When A4 Print Is Selected in Step 6)
Proceed to step 11.
2
3
4
5
6
Specifying the Print Settings
7
Setting the Print Format
11. Press the Print Setup soft key.
12. Use jog shuttle+SELECT to select the format from 1 Zone to 16 Zone.
8
Note
The print format setting is linked with the DISPLAY menu > Format setting.
9
Setting the Extra Area
The settings specified in steps 13 to 27 are applied to the recording format settings in
Recorder Mode (see section 9.3).
13. Use jog shuttle+SELECT to turn the extra area ON or OFF.
10
11
12
Printing the Screen Image
13
14
15
16
17
18
App
Index
IM 701240-01E
12-3
12.1 Printing on the Built-in Printer
Setting the Flexible Zone
(Can be set when you select 1 Zone in step 12 on page 12-3)
14. Use jog shuttle+SELECT to select Setup in Flexible Zone.
15. Use jog shuttle+SELECT to set Mode to OFF or ON.
16. Use jog shuttle+SELECT to set Upper/Lower of the waveform to be recorded.
Setting the Graticule
• Setting the Grid
17. Use jog shuttle+SELECT to set the type to
, OFF, or
.
• Setting Dark/Light
18. Use jog shuttle+SELECT to set dark/light to light or dark.
• Setting the Width of the Vertical Scale
19. Use jog shuttle+SELECT to set the width to 1div or 10mm.
Proceed to step 19.
Note
The grid setting is linked with the DISPLAY menu > Graticule setting. However, if OFF is
selected, the DISPLAY menu is set to
.
Setting Details
Setting the Print Interval of Scale Values
20. Use jog shuttle+SELECT to set the scale to OFF, 200mm, 400mm, or 800mm.
Setting the Print Interval of Channel Labels
21. Use jog shuttle+SELECT to set Ch Label to OFF, 200mm, 400mm, or 800mm.
Setting Whether to Print the Time
23. Use jog shuttle+SELECT to set the time to OFF, 200mm, 400mm, or 800mm.
Setting the Gauge Print
23. Use jog shuttle+SELECT to set the gauge to OFF, ON, or Fine.
12-4
IM 701240-01E
12.1 Printing on the Built-in Printer
Setting the Annotation
24. Use jog shuttle+SELECT to set the print interval of annotations in the right
column of Annotation to OFF, 200mm, 400mm, or 800mm.
25. Use jog shuttle+SELECT to set the type of annotation to be printed in the right
column of Type to Ch Information, Ch Message, or Ch Data.
If Ch Message is selected, proceed to step 26.
If Ch Information or Ch Data is selected, proceed to step 27.
26. Use jog shuttle+SELECT to select Setup. Then, enter the message you wish to
print for the channel using up to 80 characters according to the procedure in
section 4.2.
Setting a Comment
27. Use jog shuttle+SELECT to select Comment. Then, enter the comment text
you wish to print using up to 20 characters according to the procedure in section
4.2.
1
2
3
4
5
6
7
8
9
10
11
Previewing the Print Image
28.
Fine Print
Zoom Print
Printing the Screen Image
29.
12
Press the Preview soft key. The print image is displayed on the screen.
Turn the jog shuttle to change the displayed page.
Press the Quit soft key. The original display appears.
13
A4 Print
14
15
16
17
18
Executing the Printing
30.
Press PRINT. The screen image data is printed on the built-in printer.
To abort printing, press PRINT while printing is in progress.
While printing is in progress,
is indicated at the upper left of the screen.
App
Index
IM 701240-01E
12-5
12.1 Printing on the Built-in Printer
Explanation
Output Format: Format
Select from four types: Normal, Fine, Zoom Print, and A4 Print.
Normal
Prints using normal size.
Fine
The print range on the waveform displayed on the screen (Time Range1 and Time
Range2) is specified, and the print range is printed magnified.
Time Range1 Time Range2
Record time: 100 ms
PRINT menu
• Mag: 20 ms
Normal
waveform
The 5 divisions (50 ms) specified by Time Range1/
Time Range2 are magnified to 20 ms per page.
→ Printed on 3 pages as shown below.
Print
example
Page 1
Page 2
Page 3
Zoom Print
The range of zoom box Z2 of the zoom function (see section 8.5) is magnified and
printed.
Zoom box Z2
Main
(Normal
waveform)
Record time: 100 ms
ZOOM menu
• Z2 Mag: 50 ms
• Z2 Position: –0.5 div
Z2
(Zoom
waveform)
PRINT menu
• Mag: 20 ms
Waveform in Z2 is magnified to
20 ms/page. → Printed on 3 pages as shown below.
Print
example
Page 1
Page 2
Page 3
A4 Print
Prints the waveform displayed on the screen to an A4 size paper.
Print example
Normal
waveform
The waveform displayed on
the screen is automatically
adjusted to fit on an A4 size
paper and printed.
12-6
A4 size
IM 701240-01E
12.1 Printing on the Built-in Printer
1
Printing Using Normal Output Format
Comment
2
A comment string of up to 20 characters can be printed at the top section of the print
area.
3
Fine Print, Zoom Print, and A4 Print
Print Magnification (Print Mag)
Set the print magnification only during fine print and zoom print. The selectable range
varies depending on the record time setting and record length.
4
Print Range (Time Range1/Time Range2)
5
Set the print range only during fine print. Set the print range in the range of –5 divisions
to 5 divisions.
6
Zoom Box Z2 (Z2 Mag/Z2 Position)
7
Set zoom box Z2 only during zoom printing. The zoom box Z2 setting is linked to the
ZOOM menu setting. For details such as the selectable range, see section 8.5.
8
Print Setup
Format
Select the number of zones of the print area when printing on the built-in printer.
1 Zone
4 Zone
2 Zone
8 Zone
3 Zone
16 Zone
9
10
The format setting is linked with the DISPLAY menu > Format setting.
11
Extra Area
The extra area can be set only when the format is set to 1 Zone, 2 Zone, 3 Zone, or 4
Zone.
12
• When the Format is 2 Zone, 3 Zone, or 4 Zone
If extra area is turned ON, the area below each of the divided waveform recording
area is used to print the waveform information (extra area). If extra area is turned
OFF, the extra area between each waveform recording area disappears. The
magnification of the vertical axis of each waveform recording area is adjusted
automatically according to the paper size and printed. The default setting is ON.
Printing the Screen Image
• When the Format Is 1 Zone
If extra area is turned ON, the top 16 cm of the print area (20 cm) is used to print
waveforms, and the remaining 4 cm is used to print waveform information (extra
area). Annotations (see page 12-9) and logic waveforms are printed in the extra
area. The default setting is OFF.
13
14
15
16
17
18
App
Index
IM 701240-01E
12-7
12.1 Printing on the Built-in Printer
Flexible Zone
The flexible zone can be set only when the format is 1 Zone and the extra area is
OFF.
The position in the print area (20 cm) where each waveform is to be recorded is set
with Upper and Lower (%). The Upper value can be set in the range of 2% to 100%.
The Lower value can be set in the range of 0% to 98%. Each value can be set in 1%
steps. The minimum width is 2%.
[Example]
• When Flexible Zone on CH1 is set to Upper = 20% and Lower = 0%
The CH1 waveform is printed in the area from the bottom to 4 cm of the print area.
• When Flexible Zone on CH2 is set to Upper = 80% and Lower = 20%
The CH2 waveform is printed in the area from 4 cm to 16 cm from the bottom of the
print area.
Graticule
• Type
Select the graticule type from , OFF, or .
The grid setting is linked with the DISPLAY menu > Graticule setting. However, if
OFF is selected, the DISPLAY menu is set to .
• Dark/Light
Set the graticule Dark/Light setting to Light or Dark.
• Width of the Vertical Graticule: Width
Select how to set the vertical graticule width. For details on the format of the
graticule lines that are printed, see section 9.3.
1Div:
Graticule obtained by dividing the print zone into 10 areas
10mm:
mm graticule type
Details
• Print Interval of Scale Values: Scale
Select the interval for the scale printed at the top and bottom edges of the print area
from OFF, 200 mm, 400 mm, or 800 mm. If OFF is selected, the scale is not printed.
• Print Interval of Channel Labels: CH Label
Select the interval for printing waveform channel labels from OFF, 200 mm, 400
mm, or 800 mm. The channel label is printed near each waveform. If OFF is
selected, the channel labels are not printed.
• Time Print: Time
Select the interval for printing the time from OFF, 200 mm, 400 mm, or 800 mm.
The time is printed at the top section of the print area. If OFF is selected, the times
are not printed.
• Gauge Print
Select whether to not print (OFF), print (ON), or print in detail (Fine) on the left side
of the print area. If ON is selected a gauge that equally divides the waveform
display area into two is displayed. If Fine is selected, a gauge that equally divides
the waveform display area into 10 is displayed. The gauge, scale values, an arrow
indicating the ground position, and V/div (Value/div)* are printed.
* Depending on the setting, V/div (Value/div) may not be printed.
12-8
IM 701240-01E
12.1 Printing on the Built-in Printer
• Annotation
Channel information, channel messages, or measured values are printed. Use
Annotation to select the print interval from OFF, 200 mm, 400 mm, and 800 mm.
Use Type to select the type of annotation to be printed from Ch Information, Ch
Message, and Ch Data.
Ch Information
Prints settings such as V/div, filter, and module.
Ch Message
Prints the character string (up to 80 characters) that is assigned to each channel.
Ch Data
Prints the measured values at a given interval using numeric values.
The position where annotations are printed varies depending on the display
(recording) format and extra area settings as follows:
1
2
3
4
5
6
• When Format is 1 Zone, 2 Zone, 3 Zone, or 4 Zone, and Extra Area is ON
The annotations are printed in the extra area. The annotations do not overlap
the waveform print area.
• When Format is 1 Zone, 2 Zone, 3 Zone, or 4 Zone, and Extra Area is OFF
The annotations are printed at the bottom section of the waveform print area.
• When Format is 8 Zone or 16 Zone
The annotations are printed between the divided waveform print areas (between
the grids).
Note
If all of the conditions below are met, only up to 67 characters of CH Message are printed.
Format: 1 Zone/2 Zone/3 Zone/4 Zone, Extra Area: OFF, Scale: Other than OFF
7
8
9
10
11
• Comment
A comment string of up to 20 characters can be printed at the top section of the print
area.
Printing the Screen Image
Preview
12
13
A preview of the print image data can be displayed in the specified output format.
14
Notes on Fine Print, Zoom Print, and A4 Print
• Fine print, zoom print, and A4 print cannot be carried out while waveform acquisition
is in progress.
• Only Main waveforms are applicable for fine print and A4 print.
• If waveforms are being displayed using the history memory function, only the
waveforms specified by Selected Record No. are applicable for fine print, zoom print,
and A4 print.
• Fine print, zoom print, and A4 print cannot be carried out when X-Y waveforms are
being displayed.
• Fine print, zoom print, and A4 print cannot be carried out on the snapshot and
accumulated waveforms.
• If the number of printed pages exceeds 100, fine print cannot be carried out. (The
number of printed pages is determined by the Print Mag and Time Range settings.)
15
16
17
18
App
Index
IM 701240-01E
12-9
12.1 Printing on the Built-in Printer
Examples of Fine Print and Zoom Print
Trigger time T/div
12-10
Comment
IM 701240-01E
1
12.2 Printing on a USB Printer
<For a description of this function, refer to page 2-49.>
Procedure
1.
Connect the SL1400 and a USB printer using a USB cable. For details, see the
explanation on page 12-13.
Selecting the Printer
2.
3.
4.
5.
2
3
4
Press MENU.
Press the PRINT soft key.
Press the Print to soft key. The printer selection menu appears. (Net Print
appears only when the Ethernet interface option is installed.)
Press the USB soft key.
5
6
Confirming the Printer That Is Connected
6.
Press the Select soft key. The USB Device List appears. Check the printer that
is connected.
Note
You can also check the printer that is connected by pressing the MENU key > Next 1/2 >
System Config > USB List soft keys.
7
8
9
10
11
12
Printing the Screen Image
13
14
15
16
17
18
App
Index
IM 701240-01E
12-11
12.2 Printing on a USB Printer
Setting the Output Format
7.
8.
Press the Format soft key. The output format selection menu appears.
Select the soft key corresponding to the output format from ESC-P to BJ.
Setting the Color
9.
Press the Color soft key to select ON or OFF.
Setting a Comment
10.
11.
Press the Comment soft key.
Enter the comment string according to the procedure given in section 4.2.
Setting the Print Size (When Format Is ESC-PR)
(ESC-PR is a format for the Seiko Epson printers.)
12. Press the Size soft key to select Normal or Small.
• Normal: A4 size printer
• Small: Postcard size printer
Setting the Print Resolution (When Format Is BJ)
13.
14.
Press the Resolution soft key. The print resolution setup menu appears.
Press any of the soft keys corresponding to 180 dpi, 300 dpi, 360 dpi, and 600
dpi.
Executing the Print Operation
15.
Press PRINT. The screen image data is printed on the USB printer.
To abort printing, press PRINT while printing is in progress.
While printing is in progress,
is indicated at the upper left corner of the
screen.
ESC-PR
12-12
BJ
Other
IM 701240-01E
12.2 Printing on a USB Printer
1
Explanation
You can print the screen image to a USB printer via the USB PERIPHERAL interface.
USB PERIPHERAL Connector
2
To connect a USB printer to the SL1400, connect a USB cable to the USB PERIPHERAL
connector. There are two USB PERIPHERAL connectors (ports).
3
Port 1
4
USB PERIPHERAL
1
2
3
4
Port 2
5
6
Pin No.
Signal Name
1
2
3
4
VBUS:
D–:
D+:
GND:
7
+5 V
–Data
+Data
Ground
8
Printers That Can Be Used
9
USB printers conforming to USB Printer Class Ver. 1.1 that support the following print
formats can be used.
Note
•
•
Connect only the printers that are allowed.
For details on USB printers that have been tested for compatibility, contact your nearest
YOKOGAWA dealer.
11
12
Connection Procedure
Printing the Screen Image
When connecting a USB printer, directly connect the keyboard to the SL1400 using a
USB cable as shown below. You can connect the USB cable regardless of the power
ON/OFF state of the SL1400 (supports hot-plug). Connect the type A connector of the
USB cable to the SL1400; connect the type B connector to the printer. When the power
switch is ON, the printer is detected and enabled approximately 6 s after it is connected.
USB connection
10
13
14
15
SL1400
16
USB printer
Note
•
•
•
•
•
Connect the printer directly without going through a hub.
Do not connect USB devices other than USB keyboard, USB mouse, USB printer, and
USB storage device that can be used to the USB PERIPHERAL connector.
Do not connect multiple printers to the USB PERIPHERAL connector.
Never turn OFF the printer or remove the USB cable while the printer is printing.
Do not connect or disconnect the USB cable after the power is turned ON until key
operation is ready (approximately 20 to 30 s).
17
18
App
Index
IM 701240-01E
12-13
12.2 Printing on a USB Printer
Output Format
You can select the output format that is sent to the USB printer from the following five
types.
• ESC-P
• ESC-P2
• ESC-PR (a format for Seiko Epson printers)
• LIPS3
• PCL5
• BJ (can be used on models that support the BJC-35V native commands)
Print Size When Printing in ESC-PR Format (Size)
Select the print size when printing to a Seiko Epson printer that supports the USB.
• Normal: A4 size printer
• Small: Postcard size printer
Output Resolution When Printing Using the BJ Format
When printing the screen image to a USB BJ printer, select the output resolution from
180 dpi, 300 dpi, 360 dpi, and 600 dpi.
Comment
A comment string of up to 0 characters can be printed at the bottom right section. The
comment setting is linked with the PRINT menu > Comment setting.
Color
Select from the following:
ON: Print the data using colors similar to the screen. (No background color and grid
printed in black)
OFF: Prints the image using the same colors as the image printed using the built-in
printer.
Notes When Printing on the USB Printer
• Images may not print properly on some printers. Use USB printers that have been
tested for compatibility.
• You can also print to a USB printer that is connected to your PC. To do so, save the
screen image data to a PC card (see section 13.12). Then, load and print the data on
the PC.
Note
The SL1400 does not detect “out of paper” and printer errors on the USB printer. If an error
occurs, press PRINT again to stop the printing.
12-14
IM 701240-01E
1
12.3 Printing on a Network Printer (Option)
<For a description of this function, refer to page 2-49.>
Procedure
2
Configuring the Network
1.
Configure the TCP/IP and network printer according to the procedures given in
section 16.2 and 16.4.
4
Selecting the Printer
2.
3.
4.
5.
Press MENU.
Press the PRINT soft key.
Press the Print to soft key. The printer selection menu appears. (Net Print
appears only when the Ethernet interface option is installed.)
Press the Net Print soft key.
5
6
7
Selecting the Output Format
6.
7.
3
Press the Format soft key.
Select the soft key corresponding to the output format from ESC-P to PostScript.
8
Setting the Color (When Format Is ESC-P, ESC-P2, PCL5, or BJ)
8.
9
Press the Color soft key to select ON or OFF.
Setting a Comment
9.
10.
10
Press the Comment soft key.
Enter the comment according to the procedure given in section 4.2.
11
Setting the Print Resolution (When Format Is BJ)
11.
12.
12
Printing the Screen Image
Press the Resolution soft key. The print resolution setup menu appears.
Press any of the soft keys corresponding to 180 dpi, 300 dpi, 360 dpi, and 600
dpi.
13
14
15
16
17
18
App
Index
IM 701240-01E
12-15
12.3 Printing on a Network Printer (Option)
Executing the Print Operation
13.
Press PRINT. The screen image data is printed on the network printer. To abort
printing, press PRINT while printing is in progress.
While printing is in progress,
is indicated at the upper left corner of the
screen.
Explanation
Like the built-in printer, you can print the screen image data on a network printer1 via the
Ethernet network.
1. Printing is possible on a printer or printer server supporting the TCP/IP protocol.
Selecting the Output Format
The following six printer formats are supported.
• ESC-P
• ESC-P2
• LIPS3
• PCL5
• BJ
• PostScript
Output Resolution When Printing Using the BJ Format
When printing the screen image data to a BJ printer, select the output resolution from
180 dpi, 300 dpi, 360 dpi, and 600 dpi.
Comment
A comment string of up to 20 characters can be printed at the bottom right section.
Color
Select from the following:
ON: Print the data using colors similar to the screen. (No background color and grid
printed in black)
OFF: Prints the image using the same colors as the image printed using the built-in
printer.
Note
Printing is possible on printers that support the TCP/IP protocol.
12-16
IM 701240-01E
Chapter 13
Saving and Loading Data
13.1 Storing and Recalling the Setup Data
1
2
CAUTION
3
Do not remove the storage medium (disk) or turn OFF the power when the
access indicator or the PC card or internal hard disk (option) icon is blinking.
Doing so can damage the storage medium or destroy the data on the medium.
4
5
Procedure
1.
2.
Press MENU.
Press the Setting Data Store/Recall soft key. The store/recall menu appears.
Storing the Setup Data
3.
4.
7
Turn the jog shuttle to select the memory number (No.) of the storage
destination.
As necessary, press the Comment soft key and enter the comment according to
the procedure given in section 4.2.
8
9
Executing the Storage Operation
5.
6
Press the Store Exec soft key to execute the storage operation.
10
11
12
13
Saving and Loading Data
14
15
16
17
18
App
Index
IM 701240-01E
13-1
13.1 Storing and Recalling the Setup Data
Recalling the Data
3.
Turn the jog shuttle to select the memory number (No.) of the storage
destination.
Note
Select a memory number in which setup data was stored by the procedure described in
“Storing the Setup Data” on the previous page. An error will occur if you select a memory
number in which no setup data is stored and execute the recall operation.
Executing the Recall Operation
4.
Press the Recall Exec soft key to execute the recall operation.
Explanation
Data That Is Stored
The setup data of each key existing at the time of the storage operation can be saved.
However, setup data such as the date/time, communications, and SCSI ID numbers is
not saved.
Number of Memories
Three sets of setup data can be stored in memories numbered 1 to 3.
If the setup data is already stored at the selected number, the previous data is
overwritten.
Comment
A comment of up to 160 characters can be added and saved. Comments are optional. All
characters (including spaces) can be used.
Data That Is Recalled
Select a memory number 1 to 3 in which setup data is stored. You can only recall data
from a memory in which setup data is stored.
Note
•
•
13-2
If you execute the recall operation, the settings cannot be set back to those that existed
before the recall operation.
The stored setup data is not cleared even if you initialize the settings. The stored setup
data is cleared if you turn ON the power switch while holding down the RESET key.
IM 701240-01E
13.2 PC Cards
1
2
A PC card interface (selected at the time of purchase) can be installed as a built-in
storage device.
PC Cards That Can Be Used
3
The SL1400 supports flash ATA cards (PC card TYPE II) and compact flash (using the
PC card TYPE II adapter). In addition, some of the Flash ATA HDD cards can be used.
For details, contact your nearest YOKOGAWA dealer.
4
Note
5
To use the PC card on the PC, use a PC that supports the PC card. Depending on the PC
that you are using, the PC cards indicated above may not operate properly. Check it
beforehand.
6
Inserting the PC Card
With the label side of the PC card facing toward you, insert the PC card into the drive.
The PC card drive is located on the left side panel of the SL1400.
7
8
Ejecting the PC Card
Check that the PC card is not being accessed, and press the PC card ejection button to
the right of the drive.
9
10
11
12
13
Saving and Loading Data
14
15
Front side
Eject button
16
CAUTION
17
• The SL1400 may malfunction if the PC card is frequently inserted and ejected
(inserted and ejected within a 1-s time period).
• Removing the PC card while it is being accessed may destroy the data on the
PC card.
18
App
General Handling Precautions of PC Cards
For the general handling precautions of the PC card, read the instruction manual that
came with the PC card.
IM 701240-01E
13-3
Index
13.3 Internal Hard Disk (Option)
CAUTION
• When using the SL1400 in a vibrating environment, turn OFF the motor rotation
of the internal hard disk.
• Do not place more than 512 files in the root directory of the internal hard disk. If
the number of files exceeds 512, all file access operations slows down. In
addition, the operation of realtime recording cannot be guaranteed.
• If an external SCSI device is connected, do not change the HDD Motor setting.
Procedure
1.
2.
3.
4.
Press MENU.
Press the Next 1/2 soft key.
Press the Others soft key.
Press the HDD Motor soft key to select ON or OFF.
Explanation
You can turn ON/OFF the motor rotation of the internal hard disk on the SL1400.
If you turn OFF the internal hard disk motor, the internal hard disk cannot be accessed.
To save various data to the internal hard disk, turn the HDD Motor ON.
Turning OFF the HDD Motor protects the internal hard disk from vibrations.
Note
Even if the motor rotation is turned OFF, the motor rotation is turned ON for approximately 1
minute after the power is turned ON.
13-4
IM 701240-01E
13.4 Connecting a USB Storage Device (MO Disk
Drive, Hard Disk, or Flash Memory) to the USB
PERIPHERAL Interface
USB PERIPHERAL Interface Specifications
Item
Specifications
Connector type
Electrical and mechanical specifications
Data rate
Power Supply
Number of ports
USB type A connector (receptacle)
Conforms to USB Rev.1.1
12 Mbps maximum
5 V, 500 mA* (per port)
2
*
4
5
6
Port 1
USB PERIPHERAL
Port 2
Pin No.
Signal Name
1
2
3
4
+5 V
–Data
+Data
Ground
VBUS:
D–:
D+:
GND:
7
8
9
10
11
Connecting the USB Storage Device
12
13
Saving and Loading Data
When connecting a USB storage device, directly connect the printer to the SL1400 using
a USB cable as shown below. You can connect the USB cable regardless of whether the
power switch on the SL1400 is ON or OFF (supports hot-plugging). When the power
switch is ON, the USB storage device is detected and enabled approximately six
seconds after it is connected.
USB PERIPHERAL
2
3
Devices whose maximum current consumption exceeds 100 mA cannot be connected
simultaneously to the two ports.
1
2
3
4
1
14
15
SL1400
16
USB storage
Compatible USB Storage Devices
The SL1400 can use HD drives, MO drives, and flash memories that support USB (USB
Mass Storage Class).
17
18
Note
•
•
IM 701240-01E
Do not connect USB devices other than a USB keyboard, USB mouse, USB printer, or
USB storage device to the USB PERIPHERAL connector.
The SL1400 has two USB PERIPHERAL ports. However, USB devices whose maximum
consumption current exceeds 100 mA cannot be connected simultaneously to the two
ports.
13-5
App
Index
13.4 Connecting a USB Storage Device (MO Disk Drive, Hard Disk, or Flash Memory) to the USB
PERIPHERAL Interface
CAUTION
• Do not remove the USB storage device or turn OFF the power when the USB
storage device is being accessed. If you do, the data on the USB storage device
may be destroyed.
• An access icon is displayed at the upper left corner of the screen while the USB
storage device is being accessed.
General Handling Precautions of USB Storage Devices
For the general handling precautions of the USB storage device, read the instruction
manual that came with the device.
13-6
IM 701240-01E
13.5 Connecting a SCSI Device
1
SCSI Specifications
2
Item
Specifications
Interface standard
Connector type
Connector pin assignment
SCSI (Small Computer System Interface), ANSI X3.131-1986
Half pitch 50 pins (pin type)
Unbalanced (single-ended), see table below.
3
4
25 23 24
321
Pin No.
5
50 49 48
28 27 26
6
Pin No.
Signal Name
Pin No.
Signal Name
1 to 12
13
14 to 25
26
27
28
29
30
31
32
33
34
35 to 37
GND
NC
GND
-DB0
-DB1
-DB2
-DB3
-DB4
-DB5
-DB6
-DB7
-DBP
GND
38
39, 40
41
42
43
44
45
46
47
48
49
50
TERMPWR
GND
-ATN
GND
-BSY
-ACK
-RST
-MSG
-SEL
-C/D
-REQ
-I/O
7
8
9
10
11
Items Necessary for Connection
Cable
Use a commercially sold cable that is 3 m or less in length that has a characteristic
impedance between 90 and 132 Ω.
12
Connection Procedure
1.
13
2.
Saving and Loading Data
Connect the SCSI cable to the SCSI connector on the left side panel of the
SL1400.
Turn ON the SCSI device and the SL1400 (in that order).
To format the disk, follow the procedure described in the section 13.6.
14
15
Connectable SCSI Devices
SCSI devices that can be connected to the SL1400 are MO disk drives and Zip drives.
For details on which devices can be connected, contact your nearest YOKOGAWA
dealer.
For general handling precautions for the connected SCSI device, see the instruction
manual that is provided with the device.
16
17
Note
•
•
•
If the SL1400 fails to detect the external SCSI device that is connected, initialize the SCSI
ID by press the MENU key > Next 1/2 > Self Test > Test Item to SCSI > Initialize SCSI.
The SL1400 has a built-in SCSI terminator. When using multiple SCSI devices, connect
the SL1400 to the end of the chain. The terminator is always ON when the power is ON.
Do not connect an external SCSI device with the same ID as that specified by pressing the
MENU key > Next 1/2 > Self Test > Test Item (SCSI) > Internal ID.
18
App
Index
IM 701240-01E
13-7
13.6 Formatting the Storage Medium
CAUTION
• Never remove the storage medium (disk) or turn OFF the power while the
access indicator or the PC card or hard disk icon is blinking. Such acts can
damage the storage medium or destroy the data on the medium.
• If the SL1400 cannot recognize a formatted medium, format the disk again on
the SL1400. Note that all the data on the disk are cleared when the disk is
formatted. Make sure to back up important data beforehand.
Procedure
1.
2.
Press FILE.
Press the Utility soft key. The Utility setup menu and the File List window
appear.
Selecting the Storage Medium to Be Formatted
3.
4.
5.
13-8
Press the Function soft key. The file function selection menu is displayed.
Press the Format soft key. A media list is displayed in the File List window. (Net
Drive cannot be formatted.)
Turn the jog shuttle to select the storage medium to be formatted.
If no external SCSI devices (option) or USB storage devices are detected, the
internal hard disk option is not installed and only the PC card is inserted in the
drive, only [PC card] is displayed.
IM 701240-01E
13.6 Formatting the Storage Medium
Selecting the PC Card, or USB Storage Device Format
6.
1
Press the Format soft key. The format selection menu appears.
No setting is necessary in formatting the PC card, or USB storage device.
Proceed to step 11.
2
3
Selecting the Number of Partitions of the SCSI Device
6.
7.
8.
Press the Format soft key. The format selection menu appears.
Press the Partition soft key.
Turn the jog shuttle to set the number of partitions.
Proceed to step 9.
4
5
Note
The number of partitions is 1 for removable disks (such as SCSI and Zip disks).
6
Selecting the Number of Partitions of the Internal Hard Disk (Option)
• Selecting the Number of Partitions
6.
Press the Format soft key. The format selection menu appears.
7.
Press the Partition soft key.
8.
Turn the jog shuttle to set the number of partitions to 2 or 3.
7
8
• Setting the Realtime Recording Area
9.
Press the RealTime Recording Area soft key.
10. Turn the jog shuttle to set the realtime recording area in the range of 30 to 70%
of the entire capacity of the internal hard disk. Proceed to step 11.
9
10
Note
Do not place files other than those created by realtime recording in the Real Time area of the
internal hard disk. Otherwise, the realtime recording may not operate properly.
PC card/
USB storage
SCSI device
Internal
hard disk
11
12
13
Saving and Loading Data
14
15
16
17
18
App
Index
IM 701240-01E
13-9
13.6 Formatting the Storage Medium
Executing/Aborting the Format Operation
11.
12.
13.
Press the Exec soft key. An Alert dialog box appears.
Turn the jog shuttle to select OK or cancel.
Select OK and press SELECT to execute the format operation.
Select Cancel and press SELECT to cancel the format operation.
While the medium is being formatted, an icon corresponding the medium (
PC card,
external SCSI device,
internal HD, or
USB storage device)
being formatted is displayed at the upper left corner of the screen.
Select Cancel and press SELECT to cancel the format operation.
Viewing the Media Information
Select the storage medium according to steps 1 to 5.
Press the Media Info soft key. The information about the storage medium that was
selected in step 5 is displayed.
13-10
IM 701240-01E
13.6 Formatting the Storage Medium
1
Explanation
Formatting a PC Card or USB Storage Device
Flash ATA cards are formatted to IBM-compatible format.
2GB or more:
FAT32
Less than 2GB: FAT16
2
3
Formatting an External SCSI Device
The formats of the disk that are connected via the SCSI (option) are as follows:
• MO
Semi-IBM format. Handled as a removable disk.
• Zip
FDISK 1 partition. Handled as a fixed disk.
4
5
6
Formatting the Internal Hard Disk (Option)
• Selecting the Number of Partitions
You can set the number of partitions to 2 or 3.
• Setting the Realtime Recording Area
You can set the realtime recording area to 30%, 40%, 50%, 60%, or 70% of the entire
capacity of the internal hard disk. The default value is 50%.
7
8
9
Selecting the Number of Partitions
You can set partitions on the internal hard disk (option) and some of the external SCSI
devices. However, partitions cannot be specified on removable disks. You can select the
number of partitions from 1 to 3 (2 or 3 on the internal hard disk).
10
Media Info
11
12
13
Saving and Loading Data
Lists the information about the selected medium. The following information is displayed.
• Media Name: Name of the medium.
• Media Size: Total size.
• Used Space: Size of the used area.
• Vacant Space: Size of the free area.
• Partition Size: Number of partitions.
14
Note
•
•
•
•
•
•
If you format a medium that has data stored on it, all the data are cleared when the
medium is formatted.
It takes a few seconds to format a PC card.
It takes approximately 30 s to 1 minute to format the internal hard disk (option).
Do not format a disk while the SL1400 and a PC is connected via a SCSI cable.
If an error message is displayed after the format operation, the target medium may be
damaged.
This function cannot be used when using the FTP server function, the FTP client function,
network printer function, or the Web server function.
15
16
17
18
App
Index
IM 701240-01E
13-11
13.7 Changing the SCSI ID Number
Procedure
1.
2.
3.
4.
5.
Press MENU.
Press the Next 1/2 soft key.
Press the Self Test soft key.
Press the Test Item soft key.
Use jog shuttle+SELECT to select SCSI.
Changing the ID Number of the SL1400
6.
7.
Press the Own ID soft key.
Turn the jog shuttle to select a value in the range of 0 to 7.
Changing the ID Number of the Internal Hard Disk
8.
9.
Press the Internal ID soft key.
Turn the jog shuttle to select a value in the range of 0 to 7.
Executing the ID Number Change
10.
Press the Initialize SCSI soft key. The SCSI ID is changed to the selected ID
number. The SCSI icon ( ) at the upper left corner of the screen blinks while
the change is in progress. When the change is complete, the icon disappears.
Note
•
•
13-12
If you do not execute Initialize SCSI after changing Own ID or Internal ID, the new ID is
not activated until the SL1400 is powered up the next time.
To save the data after executing Initialize SCSI, select the destination medium and
directory.
IM 701240-01E
13.7 Changing the SCSI ID Number
1
Explanation
The SCSI ID number is used to distinguish between the various devices connected to
the SCSI chain. Make sure not to use duplicate ID numbers on any of the connected
devices.
Selectable Range of Own ID Number
Own ID (the ID number of the SL1400) can be set in the range of 0 to 7. The default
value is 6.
2
3
4
Selectable Range of Internal ID Number
Internal ID (ID number of the internal hard disk (option) can be set in the range of 0 to 7.
The default value is 4.
5
Notes When Setting the ID Number
6
• If you change the ID number, make sure to press the Initialize SCSI soft key.
• Do not set the same SCSI ID number for the external SCSI device and the internal
hard disk of the SL1400.
• The SCSI ID numbers of external SCSI devices are automatically detected when the
SL1400 is turned ON.
• If you change the ID number of the external SCSI device, make sure to execute
Initialize SCSI to detect the new SCSI ID.
• Own ID and Internal ID cannot be set to the same value.
7
8
9
10
11
12
13
Saving and Loading Data
14
15
16
17
18
App
Index
IM 701240-01E
13-13
13.8 Saving and Loading Waveform Data
CAUTION
Do not remove the storage medium (disk) or turn OFF the power when the
access indicator or the PC card or internal hard disk (option) icon is blinking.
Doing so can damage the storage medium or destroy the data on the medium.
Procedure
Saving the Waveform Data
1.
2.
3.
Press FILE.
Press the File Item soft key. The File Item setup menu appears.
Press the Waveform soft key.
Selecting the Data Type
4.
5.
Press the Data Type soft key. The data type selection menu appears.
Press the Binary, ASCII, or Float soft key to select the data type.
Note
•
•
•
Binary files can be saved and loaded. ASCII and Float files can only be saved.
Select Real Time when loading or converting the waveform that has been realtime
recorded. For details, see section 13.15.
The data type is linked to the data type specified when Save to File is selected for the
action-on-trigger action (see section 6.18).
Selecting the Waveform to Be Saved
6.
7.
8.
13-14
Press the Save soft key. The save setup menu appears.
Press the Trace soft key. The waveform selection menu appears.
Press the soft key corresponding to the desired channel to select the waveform.
IM 701240-01E
13.8 Saving and Loading Waveform Data
Selecting the Range of the Waveform to Be Saved
9.
10.
11.
1
Press the Range soft key. A menu used to select the range of the waveform to
be saved appears.
Press the Main, Z1, or Z2 soft key to select the range of the waveform to be
saved.
Press the History soft key to save all the data in the history memory (All), save
only the selected waveform (One), or save the average data in the history
memory (Ave).
If you select All after performing a search on the history memory data, only the
searched waveforms are saved.
Decimating the Data and Saving (When Data Type Is Set to ASCII)
4
6
Press the Save Interval soft key.
Turn the jog shuttle to set the save interval from OFF, Per5 to Per5000.
Compressing the Data and Saving (When Data Type Is Set to Binary)
12.
3
5
Compressing or Decimating the Data and Saving the Data
12.
2
Press the P-P Comp soft key to select ON (compress and save) or OFF (do not
compress and save).
If P-P Comp is turned ON when saving waveform data, only the maximum and
minimum values of the multiple data points existing at the same time position
are saved. Consequently, the file size is reduced. However, the SL1400 cannot
load the saved data.
7
8
9
10
Note
If P-P Comp is set to ON, you cannot set the save range using Range.
For Data
Type: ASCII
For Data
Type: Binary
11
12
13
Saving and Loading Data
14
15
16
17
18
App
Index
IM 701240-01E
13-15
13.8 Saving and Loading Waveform Data
Selecting Save Destination Medium
13.
14.
15.
Press the File List soft key. The File List window appears.
Turn the jog shuttle to select the save destination medium (indicated by [ ]).
Press SELECT to confirm the new medium.
Select the Save Destination Directory
(Perform this operation when directories are present on the medium.)
16. Turn the jog shuttle to select the save destination directory (indicated by < >).
17. Press SELECT to confirm the directory. The selected medium/directory is
displayed in “Path=......” located at the upper left of the File List window.
Select <..> to move to the parent directory.
Note
If History is set to All, MATH channels are not saved. If you want to save the data of the
MATH channels, set History to One.
13-16
IM 701240-01E
13.8 Saving and Loading Waveform Data
Setting the Name of the File to Be Saved and Comment
18.
19.
20.
21.
22.
23.
24.
1
Press the File Name soft key. The file name setup menu appears.
Turn the jog shuttle to set Auto Naming.
Press SELECT to select OFF, Numbering, or Date.
Turn the jog shuttle to select File Name.
Enter the file name using up to 16 characters according to the procedure given
in section 4.2.
Turn the jog shuttle to select Comment.
Enter the comment using up to 160 characters according to the procedure given
in section 4.2.
3
4
5
Executing the Save Operation
25.
2
Press the Save Exec soft key. The data is saved to the directory indicated by
Path=...... At the same time, the Save Exec soft key changes to the Abort soft
key.
While the data is being saved, an icon corresponding the save destination
medium (
PC card,
external SCSI device,
internal HD, or
USB
storage device) is displayed at the upper left of the screen.
6
7
8
Aborting the Save Operation
26.
Press the Abort soft key to abort the save operation. At the same time, the
Abort soft key changes to the Save Exec soft key.
10
Specifying the File to Be Displayed in the File List Dialog Box
27.
28.
On the screen showing the File List dialog box, press the Filter soft key to select
*.extension or *.*.
Turn the jog shuttle to select the files in the File List dialog box.
11
12
Displaying Properties
29.
9
Press the Property soft key. Information about the selected file is displayed.
13
Saving and Loading Data
14
15
16
17
18
App
Index
IM 701240-01E
13-17
13.8 Saving and Loading Waveform Data
Loading the Waveform Data
1.
2.
3.
Press FILE.
Press the File Item soft key. The File Item setup menu appears.
Press the Waveform soft key.
Selecting the Data Type
4.
5.
Press the Data Type soft key. The data type selection menu appears.
Press the Binary soft key.
Selecting the Load Source Medium/Directory
6.
7.
Press the Load soft key. The load setup menu and File List window appear.
Select the load source directory according to steps 13 to 17 in “Saving the
Waveform Data.”
Selecting the File to Be Loaded
8.
Turn the jog shuttle to select the file.
Executing the Load Operation
9.
10.
Press the Load Exec soft key. A dialog box appears showing the module
information of the selected waveform data and the current module information of
the SL1400.
Press the Load Exec soft key again. The selected file is read from the directory
indicated in Path=...... At the same time, the Load Exec soft key changes to the
Abort soft key.
Note
•
•
Waveform data on modules whose information differs from the current module information
of the SL1400 cannot be loaded.
Realtime recorded waveform data (.WDF extension)) can also be loaded.
Aborting the Load Operation
11.
13-18
Press the Abort soft key to abort the load operation. At the same time, the Abort
soft key changes to the Load Exec soft key.
IM 701240-01E
13.8 Saving and Loading Waveform Data
Specifying the Files to Be Displayed in the File List Dialog Box and
1
Displaying Properties
12.
Carry out steps 27 to 29 in “Saving the Waveform Data.”
2
Note
When a file saved by specifying Z1 (or Z2) is loaded, the data of the record length of Z1 (or
Z2) is displayed right justified.
3
4
Explanation
Selecting the Data Type
5
The following three data types are available.
Binary
• The sampled data in the acquisition memory is saved in binary format.
• The data that is saved (excluding the data has been P-P compressed and saved)
can be loaded and used to display waveforms and compute numeric data.
If the saved data is loaded, the accumulate setting is always turned OFF.
• A header file that is used when analyzing the waveform on a PC is automatically
created. The header file cannot be opened on the SL1400. For details on the
header file format, see appendix 5.
• The extension is .WVF. The extension of the header file name is .HDR.
• When saving waveform data in binary format, a header file is automatically created
with the .HDR extension. When the SL1400 is used to copy, delete, change
filenames, or change file attribute of waveform data files (files with .WVF
extension), the header files are automatically updated to reflect the changes. Do
not delete only the header file or only the waveform data file, as this may cause a
system malfunction.
6
7
8
9
10
11
ASCII
• The sampled data in the acquisition memory is saved in ASCII format in the unit
converted by the specified range. The data can be used to analyze the waveform
on a PC.
• The file cannot be loaded into the SL1400.
• The extension is .CSV.
• If the file size exceeds 2 GB depending on the combination of the record length
and the number of channels, the files cannot be created.
12
Float
15
Saving and Loading Data
• The sampled data in the acquisition memory is saved in 32-bit floating format
(IEEE) in the unit converted by the specified range. The data can be used to
analyze the waveform on a PC.
• The data is in Little Endian (Intel format).
• The file cannot be loaded into the SL1400.
• The extension is .FLD.
• If the file size exceeds 2 GB depending on the combination of the record length
and the number of channels, the files cannot be created.
13
14
16
17
18
App
Index
IM 701240-01E
13-19
13.8 Saving and Loading Waveform Data
Data Size
The following table shows the data size when the record length is set to 100 kW,
waveform data of CH1 to CH4 are saved, all Math channels are turned OFF, and using
history waveform 1 condition.
Data Type
Extension
Data Size (Bytes)
Binary
.WVF
ASCII
Float
.HDR
.CSV
.FLD
Approx. 800 K ((100 kW + 32) × 4 channels × the number of
history waveforms × 2)
Approx. 2 K (approx. 3 K when Math1 and Math2 are ON)
4 to 5 MW
Approx. 1.6 M ((100 kW + 32) × 4) ¥ the number of history
waveforms × 4)
Waveform to Be Saved (Trace)
• You can save all the waveforms or the specified waveforms from CH1 to CH16, Math
waveforms, and logic waveforms.
• The setup data including vertical axis, horizontal axis, and trigger of the waveform to
be saved are also saved.
• For waveforms that are loaded using the history memory function, you can select
whether to save all of the history data, save the average of the history data, or save
just the current displayed waveform on the screen. If History is set to All, MATH
channels are not saved. If you want to save the data of the MATH channels, set
History to One. You can also save only the results obtained by searching the history
memory data. For a description of searching the history memory data, see section
11.2 and 11.3.
• For a description of snapshot waveforms, see section 13.10.
Selecting the Range of the Waveform to Be Saved
Select the range (region) of the waveform from the choices below. Only the data that has
been saved by selecting Binary in the aforementioned section “Selecting the Data Type”
can be loaded in the SL1400.
• Main
The range of the normal (Main) waveform. It is the range defined by the displayed
record length (range displayed on the screen).
• Z1
The range of zoom waveform Z1.
• Z2
The range of zoom waveform Z2.
Compressing the Data and Saving: P-P Comp (When Data Type Is Set to Binary)
You can select whether to P-P compress the waveform data before saving.
Power spectrum computation data cannot be saved using P-P compression.
Decimating the Data and Saving (When Data Type Is Set to ASCII)
When saving to ASCII format, data is decimated and converted to ASCII format before
the data is saved.
Save interval: OFF (no decimation), Per 5, Per 10, Per 20, Per 50, Per 100, Per 200,
Per 500, Per 1000, Per 2000, or Per 5000
For example, if you select Per 5, the data is decimated as follows:
“First data point” “+5” “+10” “+15” ...
13-20
IM 701240-01E
13.8 Saving and Loading Waveform Data
Selecting the Storage Medium and Directory
1
Storage media on which saving and loading are possible are displayed on the File List
window.
• Display Examples of Storage Media
[PC Card]:
[HD]:
[SCSI5]:
[SCSI5-1]:
[NetWork]:
[USB]:
*
PC card
Hard disk
SCSI device with the ID number set to 5*
Partition 1 of a SCSI device whose ID number is 5*
Network drive (when the Ethernet interface option is installed)
USB storage device
2
3
4
When a SCSI device whose ID number is 5 is connected
5
Setting the File Name
You can specify the file name using up to 16 characters. The characters that can be
used are 0-9, A-Z, %, _, (, and ).
Auto Naming
Select from the following three types.
• OFF:
The name specified by File Name is assigned.
• Numbering: Files are automatically named with four digit numbers from 0000 to
4999. You can specify a common name (up to 4 characters, specified
through File Name) that is placed before the number.
• Date:
Files are automatically named using eight characters (base 36
consisting of 0 to 9 and A to Z) based on the date and time. (The file
name specified by File Name is void.)
Year
Month
Day
Hour
6
7
8
9
10
11
12
Time in unit of 100 ms
0 ms=0000, 100 ms=0001, ... , 59 min 50 s 900 ms=0RRZ
13
Saving and Loading Data
0 hour=0, ... , 9 hour=9, 10 hour=A, ... , 23 hour=N
1 day=1, ... , 10 day=A, ... , 31 day=V
1 month=1, ... , 10 month=A, 11 month=B, 12 month=C
2000 year=0, ... , 2010 year=A, ... , 2035 year=Z
14
Note
15
Up to 16 characters can be entered for the common name. Characters exceeding 16
characters are void.
16
Setting a Comment
A comment of up to 160 characters can be added and saved. Comments are optional.
All characters (including spaces) can be used.
Specifying the File to Be Displayed in the File List Dialog Box
You can specify the type of files to be displayed.
• *.WVF/*.CSV/*.FLD: Displays only the files that have the same file format as the file
being saved.
• *.*:
Displays all the files in the storage medium/directory.
17
18
App
Index
IM 701240-01E
13-21
13.8 Saving and Loading Waveform Data
Property
Displays the following information about the selected file: filename.extension, the file
size, the date/time the file was saved, the attribute, the comment, the module
configuration when the file was saved, the conditions for saving, etc.
Note
•
•
•
•
•
•
•
•
•
•
An error occurs if a key other than the Abort key is pressed while saving or loading a file.
Saving and Loading is not possible while the data acquisition is in progress.
If waveform data is loaded, the accumulate setting is always turned OFF.
If you change the extension of the saved data such as on a PC, the file can no longer be
loaded.
Up to 36 characters can be displayed in Path.
File names are not case-sensitive. Comments are case-sensitive. In addition, the following
names cannot be used due to limitations of MS-DOS.
AUX, CON, PRN, NUL, CLOCK, COM1 to COM9, and LPT1 to LPT9
The waveform data loaded from a file overwrites the data in the acquisition memory. Once
the memory is overwritten, the old data cannot be recovered. It is recommended that the
current waveform data be saved before loading data from a file.
If the total number of files and directories exceed 5000 in a single directory, the file list is
no longer displayed.
This function cannot be used when using the FTP server function, network printer function
or the Web server function.
Waveform (.wvf) and header (.hdr) files are saved as file pairs. If you specify “*.*” for the
files to be displayed (Filter) on the File List and manipulate individual files (Delete,
Rename, or Copy), the file can no longer be loaded.
Files that do not have an archive attribute are not displayed in the File List dialog box.
Data Format When Storing Multiple Records
When multiple records are stored (history memory, for example), the following data
format is used.
ASCII Format: CR+LF is inserted between records.
<Header>
Measured data 1-1 of CH1, Measured data 1-1 of CH2, Measured data 1-1 of CH3, ... , [ CR+LF]
Measured data 1-2 of CH1, Measured data 1-2 of CH2, Measured data 1-2 of CH3, ... , [ CR+LF]
Measured data 1-m of CH1, Measured data 1-m of CH2, Measured data 1-m of CH3, ... , [ CR+LF]
[ CR+LF]
Measured data 2-1 of CH1, Measured data 2-1 of CH2, Measured data 2-1 of CH3, ... , [ CR+LF]
Measured data 2-2 of CH1, Measured data 2-2 of CH2, Measured data 2-2 of CH3, ... , [ CR+LF]
Record 1
Record 2
Measured data 2-n of CH1, Measured data 2-n of CH2, Measured data 2-n of CH3, [ CR+LF]
[ CR+LF]
Float Format: Stored in blocks of channels.
Measured data of record 1 of CH1
Measured data of record 2 of CH1
Measured data of record N of CH1
Measured data of record 1 of CH2
Measured data of record 2 of CH2
Measured data of record N of CH2
13-22
IM 701240-01E
13.9 Saving/Loading the Setup Data
1
2
CAUTION
3
Never remove the storage medium (disk) or turn OFF the power while the
access indicator or the PC card or internal hard disk (option) icon is blinking.
Such acts can damage the storage medium or destroy the data on the medium.
4
5
Procedure
6
Saving the Setup Data
1.
2.
3.
Press FILE.
Press the File Item soft key. The File Item setup menu appears.
Press the Setup soft key.
7
Selecting Save Destination Medium
4.
5.
6.
7.
8
Press the Save soft key. The save setup menu appears.
Press the File List soft key. The File List window appears.
Turn the jog shuttle to select the save destination medium (indicated by
brackets).
Press SELECT to confirm the storage medium.
9
10
Selecting the Destination Directory
(Perform this operation when directories are present on the medium.)
8.
Turn the jog shuttle to select the save destination directory (indicated by < >).
9.
Press SELECT to confirm the directory. The selected medium/directory is
displayed in “Path=......” located above and to the left of the File List window.
Select <..> to move to the parent directory.
11
12
13
Saving and Loading Data
14
15
16
17
18
App
Index
IM 701240-01E
13-23
13.9 Saving/Loading the Setup Data
Setting the File Name and Comment
10.
11.
12.
13.
14.
15.
16.
Press the File Name soft key. The file name setup menu appears.
Turn the jog shuttle to select Auto Naming.
Press SELECT to select OFF, Numbering, or Date.
Turn the jog shuttle to select File Name.
Enter the file name using up to 16 characters according to the procedure given
in section 4.2.
Turn the jog shuttle to select Comment.
Enter the comment using up to 160 characters according to the procedure given
in section 4.2.
Note
You can set up to 16 characters for the file name, but only 15 characters are displayed on the
setup menu.
Executing the Save Operation
17.
Press the Save Exec soft key. The data is saved to the directory indicated by
Path=...... At the same time, the Save Exec soft key changes to an Abort soft
key.
While the data is being saved, an icon corresponding the save destination
medium (
PC card,
external SCSI device,
internal HD, or
USB
storage device) is displayed at the upper left corner of the screen.
Aborting the Save Operation
18.
Press the Abort soft key. The save operation is aborted. At the same time, the
Abort soft key changes to a Save Exec soft key.
Specifying the File to Be Displayed on the File List window
19.
20.
On the screen showing the File List window, press the Filter soft key to select
*.SET or *.*.
Turn the jog shuttle to select the files in the File List window.
Displaying Properties
21.
13-24
Press the Property soft key. Information about the selected file is displayed.
IM 701240-01E
13.9 Saving/Loading the Setup Data
Loading the Setup Data
1.
2.
3.
1
Press FILE.
Press the File Item soft key. The File Item setup menu appears.
Press the Setup soft key.
2
Selecting the Load Source Medium/Directory
4.
5.
3
Press the Load soft key. The load setup menu and File List window appear.
Select the load source directory according to steps 4 to 9 in “Saving the Setup
Data.”
Selecting the File to Be Loaded
6.
4
5
Turn the jog shuttle to select the file.
6
Executing the Load Operation
7.
Press the Load Exec soft key. A dialog box appears showing the module
information of the selected setup data and the current module information of the
SL1400.
Press the Load Exec soft key again. The selected file is read from the directory
indicated in Path=...... At the same time, the Load Exec soft key changes to an
Abort soft key.
8.
7
8
9
Note
If the module information of the setup data and the current module information of the SL1400
differ, the setup data cannot be loaded.
10
Aborting the Load Operation
9.
Press the Abort soft key. The load operation is aborted. At the same time, the
Abort soft key changes to a Load Exec soft key.
Specifying the Files to Be Displayed in the File List Window and Displaying Properties
10.
11
12
Carry out steps 19 to 21 in “Saving the Setup Data.”
13
Saving and Loading Data
14
15
16
17
18
App
Index
IM 701240-01E
13-25
13.9 Saving/Loading the Setup Data
Explanation
Setup Parameters That Are Saved
The setup parameter of each key existing at the time of the save operation can be
saved. However, setup parameters such as the date and time, communications, and
SCSI ID numbers are not saved.
Data Size
Approx. 64 KB
Selecting the Storage Medium and Directory: File List
Media on which saving and loading are possible are displayed on the File List window.
• Display Examples of Storage Media
[PC Card]:
PC card
[HD]:
Internal hard disk
[SCSI5]:
SCSI device with the ID number set to 51
[SCSI5-1]:
Partition 1 of a SCSI device whose ID number is 51
[NetWork]:
Network drive (when the Ethernet interface option is installed)
[USB]:
USB storage device
1. When a SCSI device whose ID number is 5 is connected
Setting the File Name
You can specify the file name using up to 16 characters. The characters that can be
used are 0-9, A-Z, %, _, (, and ).
• Auto Naming
Select from the following three types.
• OFF:
The name specified by File Name is attached.
• Numbering: Files are automatically named with four digit numbers from 0000 to
4999. You can specify a common name (up to four characters,
specified by File Name) that is placed before the number.
• Date:
Files are automatically named using 8 characters (base 36 consisting
of 0 to 9 and A to Z) based on the date and time. (The file name
specified by File Name is void.)
Year
Month
Day
Hour
Time in unit of 100 ms
0 ms=0000, 100 ms=0001, ... , 59 min 59 s 900 ms=0RRZ
0 hour=0, ... , 9 hour=9, 10 hour=A, ... , 23 hour=N
1 day=1, ... , 10 day=A, ... , 31 day=V
1 month=1, ... , 10 month=A, 11 month=B, 12 month=C
2000 year=0, ... , 2010 year=A, ... , 2035 year=Z
Note
Up to 16 characters can be entered for the common name. Characters exceeding 16
characters are void.
• Setting a Comment
A comment of up to 160 characters can be added and saved. Comments are
optional. All characters (including spaces) can be used.
13-26
IM 701240-01E
13.9 Saving/Loading the Setup Data
Notes When Saving Setup Data
1
• You cannot save setup data while waveform acquisition is in progress. Press START/
STOP to stop the acquisition first.
• The number of directories and files that is displayed in the file list is up to 5000. If the
number of directories and files in a directory exceeds 5000, the file list displays 5000
directories and files, but the ones that are displayed cannot determined.
Extension of Setup Data
2
3
4
A .set extension is automatically attached to the file name.
5
Specifying the File to Be Displayed on the File List Window: Filter
Specify the type of files to be displayed.
• *.SET: Displays only setup data files.
• *.*:
Displays all the files in the medium/directory.
6
Property
7
Displays the following information about the selected file: filename.extension, the file
size, the date the file was saved, the attribute, the comment, and the module
configuration when the file was saved, etc.
8
Note
•
•
•
•
•
•
•
•
9
10
11
12
13
Saving and Loading Data
•
An error occurs, if a key other than the Abort key is pressed while saving or loading a file.
Saving and Loading is not possible while data acquisition is in progress.
If you change the extension of the file such as on a PC, the file can no longer be loaded.
Up to 36 characters can be displayed in “Path.”
File names are not case-sensitive. Comments are case-sensitive. In addition, the
following five file names cannot be used due to limitations of MS-DOS.
AUX, CON, PRN, NUL, CLOCK, COM1 to COM9, and LPT1 to LPT9
If the setup parameters that are saved to a file are loaded, the key settings are changed to
the loaded information and cannot be undone. It is recommended that you first save the
current setup parameters and then load the setup parameters from a file.
Setup parameters such as the date and time, communications, SCSI ID numbers, menu
language, message language, and USB keyboard language are not saved. Therefore,
loading setup parameters from a file will not change the these settings.
This function cannot be used when using the FTP server function, network printer function
or the Web server function.
Files that do not have an archive attribute are not displayed in the File List window. Do not
remove the archive attribute of the files saved by the SL1400 using your PC.
14
15
16
17
18
App
Index
IM 701240-01E
13-27
13.10 Saving/Loading Snapshot Waveforms
CAUTION
Never remove the storage medium (disk) or turn OFF the power while the
access indicator or the PC card or internal hard disk (option) icon is blinking.
Such acts can damage the storage medium or destroy the data on the medium.
Procedure
Saving Snapshot Waveforms
1.
2.
3.
Press FILE.
Press the File Item soft key. The File Item setup menu appears.
Press the Snap soft key.
Selecting Save Destination Medium
4.
5.
6.
7.
Press the Save soft key. The save setup menu appears.
Press the File List soft key. The File List window appears.
Turn the jog shuttle to select the save destination medium (indicated by
brackets).
Press SELECT to confirm the storage medium.
Selecting the Destination Directory
(Perform this operation when directories are present on the medium.)
8.
Turn the jog shuttle to select the save destination directory (indicated by < >).
9.
Press SELECT to confirm the directory. The selected medium/directory is
displayed in “Path=......” located above and to the left of the File List window.
Select <..> to move to the parent directory.
13-28
IM 701240-01E
13.10 Saving/Loading Snapshot Waveforms
Setting the File Name and Comment
10.
11.
12.
13.
14.
15.
16.
1
Press the File Name soft key. The file name setup menu appears.
Turn the jog shuttle to select Auto Naming.
Press SELECT to select OFF, Numbering, or Date.
Turn the jog shuttle to select File Name.
Enter the file name using up to 16 characters according to the procedure given
in section 4.2.
Turn the jog shuttle to select Comment.
Enter the comment using up to 160 characters according to the procedure given
in section 4.2.
2
3
4
5
Note
You can set up to 16 characters for the file name, but only 15 characters are displayed on the
setup menu.
6
Executing the Save Operation
17.
Press the Save Exec soft key. The data is saved to the directory indicated by
Path=...... At the same time, the Save Exec soft key changes to an Abort soft
key.
7
8
Aborting the Save Operation
18.
Press the Abort soft key. The save operation is aborted. At the same time, the
Abort soft key changes to a Save Exec soft key.
While the data is being saved, an icon corresponding the save destination
medium (
PC card,
external SCSI device,
internal HD, or
USB
storage device) is displayed at the upper left corner of the screen.
9
10
11
Specifying the File to Be Displayed on the File List Window
19.
20.
On the screen showing the File List window, press the Filter soft key to select
*.SNP or *.*.
Turn the jog shuttle to select the files in the File List window.
12
13
21.
Press the Property soft key. Information about the selected file is displayed.
Saving and Loading Data
Displaying Properties
14
15
16
17
18
App
Index
IM 701240-01E
13-29
13.10 Saving/Loading Snapshot Waveforms
Loading Snapshot Waveforms
1.
2.
3.
Press FILE.
Press the File Item soft key. The File Item setup menu appears.
Press the Snap soft key.
Selecting the Load Source Medium/Directory
4.
5.
Press the Load soft key. The load setup menu and File List window appear.
Select the load source directory according to steps 4 to 9 in “Saving Snapshot
Waveforms.”
Selecting the File to Be Loaded
6.
Turn the jog shuttle to select the file.
Executing the Load Operation
7.
Press the Load Exec soft key. The selected file is read from the directory
indicated in Path=...... At the same time, the Load Exec soft key changes to an
Abort soft key.
Aborting the Load Operation
8.
Press the Abort soft key. The load operation is aborted. At the same time, the
Abort soft key changes to a Load Exec soft key.
Specifying the Files to Be Displayed in the File List Window and Displaying Properties
9.
13-30
Carry out steps 19 to 21 in “Saving Snapshot Waveforms.”
IM 701240-01E
13.10 Saving/Loading Snapshot Waveforms
1
Explanation
You can take snap shots of the waveform and save the image to the file. You can also
load the snapshot waveform.
2
Data Size
Approx. 60 KB
3
Data Extension
4
The extension is .SNP.
The selection of the medium and directory, file name, auto naming function, comments,
specification of the files to be displayed in the File List window, and properties are the
same as those for saving/loading normal waveform data.
For details, see section 13.8.
5
6
Clearing the Waveform
7
The loaded snapshot waveform is cleared when CLEAR TRACE or initialization is
performed.
8
Note
•
•
An error occurs, if a key other than the Abort key is pressed while saving or loading a file.
This function cannot be used when using the FTP server function, network printer function,
or the Web server function.
9
10
11
12
13
Saving and Loading Data
14
15
16
17
18
App
Index
IM 701240-01E
13-31
13.11 Saving the Results of the Automated
Measurement of Waveform Parameters
CAUTION
Never remove the storage medium (disk) or turn OFF the power while the
access indicator or the PC card, internal hard disk (option), or USB storage
device icon is blinking. Such acts can damage the storage medium or destroy
the data on the medium.
Procedure
1.
2.
3.
Press FILE.
Press the File Item soft key. The File Item setup menu appears.
Press the Measure soft key.
Selecting Save Destination Medium
4.
5.
6.
7.
Press the Save soft key. The save setup menu appears.
Press the File List soft key. The File List window appears.
Turn the jog shuttle to select the save destination medium (indicated by
brackets).
Press SELECT to confirm the storage medium.
Selecting the Destination Directory
(Perform this operation when directories are present on the medium.)
8.
Turn the jog shuttle to select the save destination directory (indicated by < >).
9.
Press SELECT to confirm the directory. The selected medium/directory is
displayed in “Path=......” located above and to the left of the File List window.
Select <..> to move to the parent directory.
13-32
IM 701240-01E
13.11 Saving the Results of the Automated Measurement of Waveform Parameters
Setting the File Name and Comment
10.
11.
12.
13.
14.
15.
16.
1
Press the File Name soft key. The file name setup menu appears.
Turn the jog shuttle to select Auto Naming.
Press SELECT to select OFF, Numbering, or Date.
Turn the jog shuttle to select File Name.
Enter the file name using up to 16 characters according to the procedure given
in section 4.2.
Turn the jog shuttle to select Comment.
Enter the comment using up to 160 characters according to the procedure given
in section 4.2.
3
4
5
Executing the Save Operation
17.
2
Press the Save Exec soft key. The data is saved to the directory indicated by
Path=...... At the same time, the Save Exec soft key changes to an Abort soft
key.
While the data is being saved, an icon corresponding the save destination
medium (
PC card,
external SCSI device,
internal HD, or
USB
storage device) is displayed at the upper left corner of the screen.
6
7
8
Aborting the Save Operation
18.
Press the Abort soft key. The save operation is aborted. At the same time, the
Abort soft key changes to a Save Exec soft key.
10
Specifying the File to Be Displayed on the File List Window
19.
20.
On the screen showing the File List window, press the Filter soft key to select
*.CSV or *.*.
Turn the jog shuttle to select the files in the File List window.
11
12
Displaying Properties
21.
9
Press the Property soft key. Information about the selected file is displayed.
13
Saving and Loading Data
14
15
16
17
18
App
Index
IM 701240-01E
13-33
13.11 Saving the Results of the Automated Measurement of Waveform Parameters
Explanation
The results of the automated measurement of waveform parameters can be saved in
CSV format (.CSV extension) to a PC card, an external SCSI device, the internal hard
disk (option), or the USB storage device.
A CSV file is a comma-separated format file. The CSV file is one of the common file
formats used to exchange data between spreadsheet and database applications.
The data that are saved are the measured results of the parameters that are specified in
the automated measurement of waveform parameters.
Notes When Saving the Results of the Automated Measurement of Waveform
Parameters
The restrictions are as follows.
• Up to (48000/the number of items that are turned ON) data points before the point at
which the save operation is executed are saved. However, the data points that are
saved are limited to those that are acquired after fixing the record time, record length,
and Measure settings.
Output Example
“CH1 P-P”,
“CH1 Max”,
“CH1 Min”,
“CH2 P-P”
“V”,
“V”,
“V”,
“V”,
0.500E+00, 0.500E+00,
0.000E+00,
0.02E-06
Oldest data
0.375E+00, 0.375E+00,
0.000E+00,
0.02E-06
0.313E+00, 0.188E+00,
-0.125E+00,
0.02E-06
•
•
•
•
↓
•
•
•
•
•
•
•
•
•
•
•
•
Most recent data
For a description of the automated measurement of waveform parameters, see
section 11.5.
Data Size
The data size can be derived from the following equation.
Data size = the number of items × 15 × the number of history waveforms (bytes)
Data Extension
The extension is .CSV.
The selection of the medium and directory, file name, comments, auto naming function,
specification of the files to be displayed in the File List window, and properties are the
same as those for saving/loading normal waveform data.
For details, see section 13.8.
Note
•
•
•
13-34
An error occurs, if a key other than the Abort key is pressed while saving a file.
This function cannot be used when using the FTP server function, network printer function,
or the Web server function.
If you change the measurement conditions after performing automated measurement of
waveform parameters, the measured results are cleared. At this point, the measured
results after the change are displayed on the screen, but they cannot be saved to a file.
IM 701240-01E
13.12 Saving Screen Image Data
1
<For a description of this function, refer to page 2-50.>
2
Procedure
1.
2.
Press MENU.
Press IMAGE soft key.
3
4
Selecting the Output Format
3.
4.
Press the Format soft key.
Press the soft key corresponding to the desired output format from PNG, JPEG,
BMP, and Post Script.
6
Setting the Color (When Format Is PNG, JPEG, or BMP)
5.
5
Press the Color soft key to select ON, ON(Revers), ON(Gray), or OFF.
7
Setting the Compression Format (When Format Is BMP and Color Is Not OFF)
6.
Press the Compression soft key to select ON or OFF.
8
Setting a Comment
7.
8.
Press the Comment soft key.
Enter the comment using up to 20 characters according to the procedure given
in section 4.2.
9
10
Selecting Save Destination Medium
9.
10.
Press the File List soft key. The save destination File List window appears.
Turn the jog shuttle to select the save destination storage medium.
Note
11.
Press SELECT. The contents of the selected storage medium or directory are
displayed.
12
13
Saving and Loading Data
Storage media such as the built-in PC card, internal HD (option), external SCSI device, and
USB storage device are displayed in brackets.
• PC card [PC Card]
• Internal hard disk [HD]
• External SCSI device [SCSI]
• USB storage device [USB]
Directories are displayed using < >.
11
14
15
16
17
18
App
Index
IM 701240-01E
13-35
13.12 Saving Screen Image Data
Selecting the Destination Directory
(Perform this operation when directories are present on the medium.)
12. Turn the jog shuttle to select the save destination directory (indicated by < >).
13. Press SELECT to confirm the new directory. The selected medium/directory is
displayed in “Path=......” located above and to the left of the File List window.
Select <..> to move to the parent directory.
Setting the Name of the File to Be Saved
14.
15.
16.
17.
18.
Press the File Name soft key. The file name setup menu appears.
Turn the jog shuttle to select Auto Naming.
Press SELECT to select OFF, Numbering, or Date.
Turn the jog shuttle to select File Name.
Enter the file name using up to 16 characters according to the procedure given
in section 4.2.
Note
•
•
If Auto Naming is set to Numbering, the first four characters are valid. If Auto Naming is
set to Date, the file name is invalid.
You can set up to 16 characters for the file name, but only 15 characters are displayed on
the setup menu.
Executing the Save Operation
19.
Press IMAGE SAVE. The screen image data is saved to the storage medium.
Pressing IMAGE SAVE again aborts the save operation.
While the data is being saved, an icon corresponding the save destination
medium (
PC card,
external SCSI device,
internal HD, or
USB
storage device) is displayed at the upper left corner of the screen.
Note
Thumbnails of the saved screen image data can be displayed. For details, see section 13.13.
13-36
IM 701240-01E
13.12 Saving Screen Image Data
1
Explanation
The screen image data can be stored to a specified storage medium.
You can select the storage medium from the PC card, external SCSI device, internal
hard disk (option), and network drive (when the Ethernet interface option is installed). For
details on saving data to the network drive, see section 15.3.
2
3
Setting the Output Format
Data in the following formats can be saved to a specified storage medium. The extension
that is automatically attached and the data size (reference value) are indicated below.
4
1
Output Data Format
Extension
Data Size
PNG
JPEG
BMP
Post Script
*.PNG
*.JPG
*.BMP
*.PS
Approx. 6 kbytes (Approx. 14 kbytes)2
Approx. 400k bytes (Approx. 400 kbytes)2
Approx. 60 kbytes (Approx. 480 kbytes)2
Approx. 123 kbytes
5
6
1. When color is OFF
2. The data size inside the parentheses is for the case when color is ON
7
Setting the Color (When Format Is BMP)
Select ON, ON(Revers), ON(Gray), or OFF.
ON:
Output using 256 colors.
ON(Revers): Do not output the background of the screen in color.
ON(GRAY): Output the data using a tint of 16 gray levels.
OFF:
Output in black and white.
8
9
10
Setting the Compression Format (When Format Is BMP and Color Is Not OFF)
When the output format is set to BMP, the data can be output by compressing using
RLE. However, data compression is not possible if the color is OFF.
11
Setting a Comment
A comment of up to 20 characters can be added to the lower section of the screen and
saved. Comments are optional. All characters (including spaces) can be used.
12
13
Setting the Save Destination: File List
Saving and Loading Data
The available storage medium is displayed in the File List window.
• Display Examples of Storage Media
[PC Card]: PC card
[HD]:
Hard disk
[SCSI5]:
SCSI device with the ID number set to 51
[SCSI5-1]: Partition 1 of a SCSI device whose ID number is 51
[NetWork]: Network drive (when the Ethernet interface option is installed)
[USB]:
USB storage device
14
15
16
1. When a SCSI device whose ID number is 5 is connected
17
PC Card, Internal Hard Disk, External SCSI Device, and USB Storage Device
PC card, internal hard disk, external SCSI device, and USB storage device are described
in sections 13.2 to 13.5. For the formatting procedure, see section 13.6.
18
App
Index
IM 701240-01E
13-37
13.12 Saving Screen Image Data
Setting the File Name
You can specify the file name using up to 16 characters. (However, the setup menu
displays only up to 15 characters.) The characters that can be used are 0-9, A-Z, %, _,
(, and ).
• Auto Naming
Select from the following three types.
• OFF:
The name specified by File Name is attached.
• Numbering: Files are automatically named with four digit numbers from 0000 to
4999. You can specify a common name (up to four characters,
specified by File Name) that is placed before the number.
• Date:
Files are automatically named using 8 characters (base 36 consisting
of 0 to 9 and A to Z) based on the date and time. (The file name
specified by File Name is void.)
Year
Month
Day
Hour
Time in unit of 100 ms
0 ms=0000, 100 ms=0001, ... , 59 min 59 s 900 ms=0RRZ
0 hour=0, ... , 9 hour=9, 10 hour=A, ... , 23 hour=N
1 day=1, ... , 10 day=A, ... , 31 day=V
1 month=1, ... , 10 month=A, 11 month=B, 12 month=C
2000 year=0, ... , 2010 year=A, ... , 2035 year=Z
Note
Up to 16 characters can be entered for the common name. Characters exceeding 16
characters are void.
Notes When Saving Screen Image Data
• The maximum number of files that can be saved when auto naming is enabled is
5000.
• If the total number of files and directories exceed 5000 in a single directory, the file list
is no longer displayed.
13-38
IM 701240-01E
13.13 Displaying Thumbnails of the Saved Screen
Image Data
1
<For a description of this function, refer to page 2-50.>
2
Procedure
3
Thumbnail Display from the IMAGE Menu
1.
2.
3.
4.
Press MENU.
Press IMAGE soft key.
Press the Format soft key. The save format selection menu appears.
Press the soft key corresponding to the save format of the screen image data of
which you want to display the thumbnails from PNG to PostScript.
• Displaying the Thumbnails of the Specified Screen Image Data
5.
Press the File List soft key. The File List window appears.
6.
Turn the jog shuttle to select the screen image data file in the File List window.
7.
Press SELECT. The thumbnail of the selected screen image data file is
displayed at the lower right section of the File List window.
To clear the thumbnail, turn the jog shuttle.
Note
•
•
If the selected screen image data file does not have data (file) for thumbnail display, an
error message screen appears.
You can press ESC to clear the thumbnail, but in this case, the File List window is also
cleared. To clear only the thumbnail display, turn the jog shuttle.
4
5
6
7
8
9
10
11
12
13
Saving and Loading Data
14
15
16
17
18
App
Index
IM 701240-01E
13-39
13.13 Displaying Thumbnails of the Saved Screen Image Data
• Listing the Thumbnails of the Specified Format
5.
Press the File List soft key. The File List window appears.
6.
Turn the jog shuttle to select the directory that you want to display the
thumbnails.
7.
Press the Thumbnail soft key. The thumbnails of the screen image data of the
format specified in step 4 are displayed (9 thumbnails (3 × 3) in the waveform
display area).
8.
If there are more than 9 thumbnails, you can scroll the screen using the jog
shuttle. To scroll the files upward, turn the jog shuttle counter-clockwise. To
scroll the files downward, turn the jog shuttle clockwise. The files scroll three
files at a time.
9.
To clear the list of thumbnails, press ESC.
13-40
IM 701240-01E
13.13 Displaying Thumbnails of the Saved Screen Image Data
Thumbnail Display from the FILE Menu
1.
2.
3.
4.
5.
6.
7.
1
Press FILE.
Press the File Item soft key.
Press the Image soft key.
Press the Format soft key.
Select the format you want to display thumbnails from PNG to PostScript.
Press the Utility soft key. The File List window appears.
Turn the jog shuttle to select the screen image data file (file with .png, .jpg,
.bmp, and .ps extensions) on the File List window.
Press SELECT. The thumbnail of the selected screen image data file is
displayed at the lower right section of the File List window.
To clear the thumbnail, turn the jog shuttle.
8.
Note
•
•
If the selected screen image data file does not have data (file) for thumbnail display, an
error message screen appears.
You can press ESC to clear the thumbnail, but in this case, the File List window is also
cleared. To clear only the thumbnail display, turn the jog shuttle.
2
3
4
5
6
7
8
9
10
11
12
13
Saving and Loading Data
14
15
16
17
18
App
Index
IM 701240-01E
13-41
13.13 Displaying Thumbnails of the Saved Screen Image Data
Explanation
Thumbnails of the screen image data that are saved on a storage medium can be
displayed.
Thumbnail Display from the IMAGE Menu
• Thumbnail Screen
Thumbnails are displayed for the screen image data files (files with .png, .jpg, .bmp,
and .ps extensions) in the directory selected by File List of the IMAGE menu.
The data used to display thumbnails are separate from the screen image data and are
created simultaneously when the screen image data is created. The extension of
thumbnail data varies depending on the output format of the original screen image
data as follows:
• PNG file: .NTD
• JPEG file: .JTD
• BMP file: .BTD
• PS file:
.PTD
The data size is approximately 2 to 6 KB for all formats.
• Thumbnail Items
The following two items are displayed.
• Thumbnail of the waveform area
• File name
• Thumbnail Display Format
The number of files displayed on the thumbnail screen (the number of thumbnails
displayed in the waveform area) is 9. The display order is the same as the order for
displaying files in the File List window. In addition, the files are displayed from left to
right and top to bottom.
• Scrolling the Thumbnail Screen
If the number of thumbnails exceeds the maximum number of thumbnails that can be
displayed (9), the thumbnail screen can be scrolled one row (three thumbnails) at a
time. To scroll the files upward, turn the jog shuttle counter-clockwise. To scroll the
files downward, turn the jog shuttle clockwise.
• Thumbnails on the File List
When you select a screen image data file on the File List, the thumbnail of the screen
image data is displayed at the lower right section of the File List. The file name is not
displayed on the thumbnail screen on the File List.
Thumbnail Display from the FILE Menu
When you select a screen image data file on the File List, the thumbnail of the screen
image data is displayed at the lower right section of the File List. The file name is not
displayed on the thumbnail screen on the File List.
Note
The screen image data and thumbnail data are saved in file pairs. For example, if you set the
output format to BMP, the following two types of files are saved.
• 0000.BMP (screen image data)
• 0000.BTD (thumbnail data)
If you specify “*.*” for the files to be displayed (Filter) on the File List and manipulate
individual files (Delete, Rename, or Copy), the thumbnail display function can no longer be
used.
13-42
IM 701240-01E
13.14 Creating PDF Files of the Printed Image
1
2
Procedure
1.
2.
Press MENU.
Press the PRINT soft key.
3
4
Selecting the Print Destination
3.
4.
Press the Print to soft key. The print destination selection menu appears. (Net
Print appears only when the Ethernet interface option is installed.)
Press the PDF soft key.
When displaying T-Y waveforms, proceed to step 5.
When displaying X-Y waveforms, proceed to step 9.
Selecting the Section to Be Output to the PDF File (Only When Displaying the T-Y
Waveform)
5.
6.
Press the Time Range1/Time Range2 soft key.
Use jog shuttle+SELECT to set the output start point and output end point of
the section to be output to the PDF file.
Press the Print Mag soft key.
Use the jog shuttle to set the magnification along the time axis when creating
the PDF file. The top section of the menu shows the record time corresponding
to 10 divisions when creating the PDF file; the bottom section shows the number
of pages when the PDF file is created using the record time indicated in the top
section.
When Displaying
the T-Y Waveform
6
7
8
9
Setting the Print Magnification (Only When Displaying the T-Y Waveform)
7.
8.
5
When Displaying
the X-Y Waveform
10
11
12
13
Saving and Loading Data
14
15
16
17
18
App
Index
IM 701240-01E
13-43
13.14 Creating PDF Files of the Printed Image
Specifying the Print Settings
9.
Press the Print Setup soft key. The print setup dialog box opens.
When displaying T-Y waveforms, proceed to step 10.
When displaying X-Y waveforms, proceed to steps 15 to 18 and then 24.
Setting the Print Format
10. Use jog shuttle+SELECT to select the format from 1 Zone to 16 Zone.
Note
The print format setting is linked with the DISPLAY menu > Format setting.
Setting the Extra Area (Only When Displaying the T-Y Waveform)
11. Use jog shuttle+SELECT to turn the extra area ON or OFF.
Setting the Flexible Zone (Only When Displaying the T-Y Waveform)
12. Use jog shuttle+SELECT to select Setup in Flexible Zone.
13. Use jog shuttle+SELECT to set the mode to OFF or ON.
14. Use jog shuttle+SELECT to set the upper and lower limits of the waveform to
be recorded.
Setting the Graticule
• Setting the Grid
15. Use jog shuttle+SELECT to set the type to
, OFF, or
.
• Setting Dark/Light
16. Use jog shuttle+SELECT to set dark/light to light or dark.
• Setting the Width of the Vertical Scale
17. Use jog shuttle+SELECT to set the width to 1div or 10mm.
Note
The grid setting is linked with the DISPLAY menu > Graticule setting. However, if OFF is
selected, the DISPLAY menu is set to
.
When Displaying the T-Y Waveform
13-44
When Displaying the X-Y Waveform
IM 701240-01E
13.14 Creating PDF Files of the Printed Image
Setting Details
• Setting the Scale Value (Only When Displaying the X-Y Waveform)
18. Use jog shuttle+SELECT to turn the scale OFF or ON.
1
• Setting Whether to Print the Time (Only When Displaying the T-Y Waveform)
19. Use jog shuttle+SELECT to set the time to OFF, 200mm, 400mm, or 800mm.
• Setting Whether to Print the Gauge (Only When Displaying the T-Y Waveform)
20. Use jog shuttle+SELECT to set the gauge to OFF or ON.
• Setting the Annotation (Only When Displaying the T-Y Waveform)
21. Use jog shuttle+SELECT to set the print interval of annotations in the right
column of Annotation to OFF, 200mm, 400mm, or 800mm.
22. Use jog shuttle+SELECT to set the type of annotation to be printed in the right
column of Type to Ch Information, Ch Message, or Ch Data.
If Ch Message is selected, proceed to step 23.
If Ch Information or Ch Data is selected, proceed to step 24.
23. Use jog shuttle+SELECT to select Setup. Then, enter the message you want to
print for the channel using up to 80 characters according to the procedure in
section 4.2.
• Setting Comments
24. Use jog shuttle+SELECT to select Comment. Then, enter the comment text
you want to print using up to 20 characters according to the procedure in section
4.2.
2
3
4
5
6
7
8
9
10
Note
•
•
The comment setting is linked with the PRINT menu > Comment setting.
When creating a PDF file of the print image while displaying T-Y waveforms, Scale and Ch
Label settings are void.
When Displaying the T-Y Waveform
When Displaying the X-Y Waveform
11
12
13
Saving and Loading Data
14
15
16
17
18
App
Index
IM 701240-01E
13-45
13.14 Creating PDF Files of the Printed Image
Setting the PDF File
25.
Press the PDF Setup soft key to display the PDF setup dialog box.
Setting the Paper Size
26. Use jog shuttle+SELECT to set the paper size to Built-in Printer, A3, A4, or A5.
Setting the Orientation (If A3, A4, or A5 was selected in step 25 (Only When
Displaying the T-Y Waveform))
27. Use jog shuttle+SELECT to set the orientation to Landscape or Portrait.
Setting the Number of Divisions per Page (If A3, A4, or A5 was selected in step 26)
28. Use jog shuttle+SELECT to set div/page.
Setting Document Information
29. Use jog shuttle+SELECT to select Title, Author, Sub Title, or KeyWord. Enter
the title, author, sub title of the PDF file using up to 30 characters and the
keyword using up to 90 characters according to the procedure given in section
4.2.
Setting the Color
30. Use jog shuttle+SELECT to turn the color OFF or ON.
Enabling/Disabling Compression
31. Use jog shuttle+SELECT to turn the compression ON or OFF.
Setting Auto Naming
32. Use jog shuttle+SELECT to select the auto naming mode from OFF,
Numbering, and Date.
Setting the PDF File Name
33. Use jog shuttle+SELECT to select File Name. Then, enter the file name using
up to 16 characters according to the procedure in section 4.2.
Selecting the Save Destination of the PDF File
34. Use jog shuttle+SELECT to select File List. Then, select the file save
destination according to steps 14 to 17 in section 13.8.
When Displaying the T-Y Waveform
13-46
When Displaying the X-Y Waveform
IM 701240-01E
13.14 Creating PDF Files of the Printed Image
1
Executing the PDF File Generation
35.
Press PRINT. A PDF file is created using the conditions set in steps 5 to 34.
Pressing PRINT again aborts the save operation. While the data is being saved,
an icon corresponding the save destination medium (
PC card,
external
internal HD, or
USB storage device) is displayed at the
SCSI device,
upper left of the screen.
2
3
4
Explanation
Print to
When creating a PDF file of the print image (image similar to the printed output of fine
print), set the print destination to PDF.
5
Selecting the Section to Be Output to the PDF File (Time Range1/Time Range2)
6
Can be specified only when displaying T-Y waveforms. Set the output start point and
output end point of the section to be output to the PDF file.
7
Magnified Print (Print Mag)
Can be specified only when displaying T-Y waveforms. Set the magnification along the
time axis for creating the PDF file. The top section of the menu shows the record time
corresponding to 10 divisions when creating the PDF file; the bottom section shows the
number of pages when the PDF file is created using the record time indicated in the top
section.
8
9
10
Print Setup
Format, Extra Area, Flexible Zone, and Graticule (Scale)
The items other than graticule can be specified only when displaying T-Y waveforms.
The format, extra area, flexible zone, and graticule (scale) settings are the same as
the settings when performing fine print or zoom print on the built-in printer. For details,
see page 12-7.
• Annotation
Can be specified only when displaying T-Y waveforms. The annotation setting is
the same as the setting when performing fine print or zoom print on the built-in
printer. For details, see page 12-9. When creating a PDF file, annotations are not
printed if the print interval is set to OFF. However, if the print interval is set to value
other than OFF, annotations are printed on each page of the PDF file.
• Scale
Can be specified only when displaying X-Y waveforms. Select whether to print the
scale.
• Comment
The comment setting is the same as the setting when performing fine print or zoom
print on the built-in printer. For details, see page 12-9.
IM 701240-01E
13-47
12
13
Saving and Loading Data
Details
• Time Print/Gauge Print
Can be specified only when displaying T-Y waveforms. The time print and gauge
print settings are the same as the settings when performing fine print or zoom print
on the built-in printer. For details, see page 12-8.
The scale value and channel label are not printed when creating a PDF file.
11
14
15
16
17
18
App
Index
13.14 Creating PDF Files of the Printed Image
Setting the PDF File
Paper Size
Select the paper size from built-in printer size, A3, A4, and A5. If the built-in printer
size is selected, a PDF file is created of an image similar to the printed output on the
built-in printer (A4 size).
Orientation
If the paper size is set to A3, A4, or A5, set the orientation of the PDF file to
Landscape or Portrait.
Number of Divisions per Page: Div/Page
Can be specified only when displaying T-Y waveforms. If the paper size is set to A3,
A4, or A5, set the number of divisions to be printed per page in the PDF file. The
specified number of divisions is printed per page in the PDF file. The selectable range
varies depending on the paper size, orientation, and gauge (see the previous page)
as follows:
Paper Size
Orientation
Selectable Range of Div/Page
Gauge: OFF
Gauge: ON
Built-In Printer
–
20 (fixed)
20 (fixed)
A3
A3
Portrait
Landscape
1 to 25
1 to 40
1 to 20
1 to 35
A4
A4
Portrait
Landscape
1 to 20
1 to 25
1 to 15
1 to 20
A5
A5
Portrait
Landscape
1 to 10
1 to 20
1 to 10
1 to 15
Document Information (Title, Author, Sub Title, and KeyWord)
As necessary, enter the title, author, sub title, and keyword of the PDF file to be
created.
Color
The PDF file is created in color if ON is selected and monochrome if OFF is selected.
Compression
Select whether to compress the file. If ON is selected, the file is compressed.
However, the generation of the PDF file takes longer than when OFF is selected.
File Setup
Set the auto naming, file name, and file output destination of the PDF file. These
settings are the same as those of normal files. For details, see section 13.8.
Executing the PDF File Generation
The PDF file is created using the specified conditions. The extension to the PDF file is
.pdf.
Note
•
•
13-48
A PDF file of a print image can be created even when all waveform display (Display Mode:
All) is selected in the history memory function.
A PDF file whose size exceeds 2GB cannot be created. Adjust the number of channels,
pages, and history memory pages, so that only the required sections are saved to the PDF
file.
IM 701240-01E
13.14 Creating PDF Files of the Printed Image
PDF File Example
1
When Displaying the T-Y Waveform (Paper Size: A4)
Gauge
Date/Time T/div
File name
2
Page
3
Scale value of the
vertical scale
4
Measurement
range
5
Scale value of the
vertical scale
6
Annotation
(Ch information)
7
8
9
10
11
12
13
Saving and Loading Data
14
Scale value of the time axis
Scale value of the time axis
When Displaying the X-Y Waveform (Paper Size: A5)
Date/Time Sample rate
15
File name
16
17
18
Scale value
of the Y axis
App
Index
Scale value of the X axis
IM 701240-01E
Scale value of the X axis
13-49
13.15 Loading/Converting Realtime Recorded
Waveforms
<For a description of this function, refer to page 2-31.>
Procedure
Loading the Realtime Recorded Waveform Data
1.
2.
3.
Press FILE.
Press the File Item soft key. The File Item setup menu appears.
Press the Waveform soft key.
Selecting the Data Type
4.
5.
Press the Data Type soft key. The data type selection menu appears.
Press the Real Time soft key.
Selecting the Load Source Medium/Directory
6.
7.
Press the Load soft key. The load setup menu and File List window appear.
Select the load source directory according to steps 14 to 17 in “Saving the
Waveform Data” in section 13.8.
Note
The files that have been realtime recorded are saved in the [RealTime] drive. WDF data that
is copied from the [RealTime] drive to another drive can also be loaded.
Selecting the File to Be Loaded
8.
13-50
Turn the jog shuttle to select the file.
IM 701240-01E
13.15 Loading/Converting Realtime Recorded Waveforms
Executing the Load Operation
9.
10.
1
Press the Load Exec soft key. A dialog box appears showing the module
information of the selected realtime recorded waveform data and the current
module information of the SL1400.
Press the Load Exec soft key again. The selected file is read from the directory
indicated in Path=...... At the same time, the Load Exec soft key changes to an
Abort soft key.
Note
If the module information of the realtime recorded waveform data and the current module
information of the SL1400 differ, the realtime recorded waveform data cannot be loaded.
2
3
4
5
Aborting the Load Operation
11.
Press the Abort soft key. The load operation is aborted. At the same time, the
Abort soft key changes to a Load Exec soft key.
Specifying the Files to Be Displayed in the File List Window and Displaying Properties
12.
6
7
Carry out steps 27 to 29 in “Saving the Waveform Data” in section 13.8.
8
Note
Files with .WDF extension in the RealTime area and User area of the internal hard disk
(option) can be loaded.
9
10
11
12
13
Saving and Loading Data
14
Converting the Realtime Recorded Waveform Data to Binary, ASCII, or Float Format
and Saving
1.
2.
Load the realtime recorded waveform data according to the procedure described
in “Loading the Realtime Recorded Waveform Data.”
Convert the realtime recorded waveform data to Binary, ASCII, or Float format
and save the data according to the procedure described in “Saving the
Waveform Data” in section 13.8.
15
16
17
18
Note
Files containing realtime recorded waveform data that has been converted into Binary cannot
be loaded into the SL1400.
App
Index
IM 701240-01E
13-51
13.15 Loading/Converting Realtime Recorded Waveforms
Explanation
Selecting the Data Type
Real Time
• Data saved using realtime recording.
• The data that is realtime recorded can be loaded to display the waveform and
compute numeric data.
• The extension is .WDF.
Data Size
The maximum data size is as follows: The unit of the record length is word.
(Record length × 2 × (the number of channels + 1) × (1.05 to 1.15)) bytes
[RealTime] Drive
• The WDF data that is created by the realtime recording is saved to the [RealTime]
drive.
• The [RealTime] drive appears only when Data Type is set to Real Time. If you want to
manage the files on the [RealTime] drive, set Data Type to Real Time.
• You can set the size of the RealTime drive in the range of 30% to 70% of the entire
capacity of the internal hard disk. This setting is entered when the internal hard disk is
formatted. For details, see section 13.6.
13-52
IM 701240-01E
13.16 Changing the File Attributes and Deleting Files
1
2
CAUTION
Never remove the storage medium (disk) or turn OFF the power while the
access indicator or the PC card or internal hard disk (option) icon is blinking.
Such acts can damage the storage medium or destroy the data on the medium.
3
4
5
Procedure
1.
2.
Press FILE.
Press the Utility soft key. The Utility setup menu and the File List window
appear.
6
7
Selecting Media and Directories
3.
Select the medium and directory according to steps 6 to 9 in section 13.9.
8
Changing the File Attributes
4.
5.
6.
7.
Press the Function soft key. The file function selection menu is displayed.
Press the Delete soft key.
Turn the jog shuttle to select the file.
Press the Attr soft key. The attribute of the selected file changes.
9
10
11
12
13
Saving and Loading Data
14
15
16
17
18
App
Index
IM 701240-01E
13-53
13.16 Changing the File Attributes and Deleting Files
Selecting the File to Be Deleted One at a Time
8.
9.
Turn the jog shuttle to select the file.
Press the Set/Reset soft key. An asterisk (*) is displayed to the left of the
selected file to indicate that it will be deleted. Pressing the Set/Reset soft key
again removes the asterisk (*) to the left of the selected file. The file will not be
deleted.
Proceed to step 13.
Selecting the Files to Be Deleted at Once
10.
11.
12.
Turn the jog shuttle to select the file, directory, or medium.
Press the All Set soft key. Asterisks (*) are displayed to the left of every file in
the directory containing the selected file or directory to indicate that they will be
deleted. At the same time, the All Set soft key changes to an All Reset soft key.
Press the All Reset soft key. Asterisks (*) are removed from the left of every file
in the directory containing the selected file or directory to indicate that they will
not be deleted. At the same time, the All Reset soft key changes to an All Set
soft key.
Executing the Delete Operation
13.
Press the Delete Exec soft key. All files with asterisk marks are deleted.
Specifying the Files to Be Displayed in the File List Window and Displaying Properties
14.
Carry out steps 19 to 21 in section 13.9.
Explanation
Selecting the Storage Medium and Directory (File List)
Media on which saving and loading are possible are displayed on the File List window.
• Display Example of Storage Media
[PC Card]:
PC card
[HD]:
Hard disk
[SCSI5]:
SCSI device with the ID number set to 51
[SCSI5-1]:
Partition 1 of a SCSI device whose ID number is 51
[NetWork]:
Network drive (when the Ethernet interface option is installed)
[USB]:
USB storage device
1. When a SCSI device whose ID number is 5 is connected
13-54
IM 701240-01E
13.16 Changing the File Attributes and Deleting Files
Selecting the File Attribute: Attr (excluding Net Drive)
1
Select the file attribute of each file from the following list of choices.
• R/W
Read and write possible.
• R
Read only. Cannot write to the file or delete the file.
2
3
Selecting the Files to Be Deleted
You can delete all files that have an asterisk to the left of the file name. There are two
methods in selecting the files to be deleted.
• Selecting the Files One at a Time: Set/Reset
Place an asterisk to the left of the file names one at a time, using the Set/Reset soft
key.
• Selecting All the Files at Once: All Set
Places an asterisk to the left of all the file names selected collectively using the All Set
soft key.
Selecting a file or directory and pressing the All Set soft key places an asterisk on
every file in the directory containing the selected file or directory.
4
5
6
7
8
Specifying the File to Be Displayed on the File List Window: Filter
Specify the type of files to be displayed.
• *.Extension
Displays only the data file that was selected in the File Item setup menu and the data
type menu.
• *.*
Displays all the files in the medium.
9
10
11
Property
Displays the following information about the selected file: filename.extension, the file
size, the date the file was saved, the attribute, etc.
12
13
Note
•
•
•
•
•
Files cannot be deleted while the data acquisition is in progress.
Data that is deleted cannot be recovered. Make sure you erase the correct files.
You can not delete directories if there are files in them.
If an error occurs while deleting multiple files, the files after the error occurrence are not
deleted.
You cannot change a directory attribute.
This function cannot be used when using the FTP server function, network printer function,
or the Web server function.
The screen image data and thumbnail data are saved in pairs of files. If you specify “*.*”
for the files to be displayed (Filter) on the File List and manipulate individual files (Delete,
Rename, or Copy), the thumbnail display function can no longer be used.
If the realtime recorded waveform is being displayed, the file cannot be deleted.
If you want to delete the files on the [RealTime] drive, set Data Type to Real Time.
Saving and Loading Data
•
•
•
•
14
15
16
17
18
App
Index
IM 701240-01E
13-55
13.17 Copying Files
CAUTION
Never remove the storage medium (disk) or turn OFF the power while the
access indicator or the PC card, internal hard disk (option), or USB storage
device icon is blinking. Such acts can damage the storage medium or destroy
the data on the medium.
Procedure
1.
2.
3.
4.
Press FILE.
Press the Utility soft key. The Utility setup menu and the File List window
appear.
Press the Function soft key. The file function selection menu is displayed.
Press the Copy soft key.
Selecting Media and Directories
5.
Select the medium and directory according to steps 6 to 9 in section 13.9,
“Saving/Loading the Setup Data.”
Selecting the Copy Source Files One at a Time
6.
7.
13-56
Turn the jog shuttle to select the file.
Press the Set/Reset soft key. An asterisk (*) to the left of the selected file to
indicate that it will be copied. Pressing the Set/Reset soft key again removes
the asterisk (*) to the left of the selected file. The file will not be copied.
Proceed to step 11.
IM 701240-01E
13.17 Copying Files
Selecting the Copy Source Files at Once
8.
9.
1
Turn the jog shuttle to select the file, directory, or medium.
Press the All set soft key. Asterisks (*) are displayed to the left of every file in
the directory containing the selected file or directory to indicate that they will be
copied. At the same time, the All Set soft key changes to an All Reset soft key.
2
3
Resetting the Selected Copy Source Files at Once
10.
Press the All Reset soft key. Asterisks (*) are removed from the left of every file
in the directory containing the selected file or directory to indicate that they will
not be copied. At the same time, the All Reset soft key changes to an All Set
soft key.
Selecting the Copy Destination
11.
Press the Dest Dir soft key. The copy execution menu and the copy destination
File List window appears.
4
5
6
7
Selecting Copy Destination Medium and Directory
12.
Select the copy destination medium and directory according to steps 6 to 9 in
section 13.9.
9
Executing the Copy Operation
13.
Press the Copy Exec soft key. All the copy source files with asterisk marks are
copied.
Specifying the File to Be Displayed in the File List Window and Viewing File Properties
14.
8
Carry out steps 19 to 21 in section 13.9.
10
11
12
13
Saving and Loading Data
14
15
16
17
18
App
Index
IM 701240-01E
13-57
13.17 Copying Files
Explanation
Selecting the Copy Source Files
You can copy all files that have an asterisk to the left of the file name. There are two
methods in selecting the files to be copied.
• Selecting the Files One at a Time: Set/Reset
Place an asterisk to the left of the file names one at a time, using the Set/Reset soft
key.
• Selecting All the Files at Once: All Set
Places an asterisk to the left of all the file names selected collectively using the All Set
soft key.
If you select a file and press the All Set soft key, asterisk marks are placed on all the
files in the directory containing the selected file.
Specifying the File to Be Displayed on the File List Window: Filter
Specify the type of files to be displayed.
• *.Extension
Displays only the data file that was selected in the File Item setup menu and the data
type menu.
• *.*
Displays all the files in the medium.
Property
Displays the following information about the selected file: filename.extension, the file
size, the date the file was saved, the attribute, the comment, etc.
Note
•
•
•
•
•
•
•
•
•
13-58
Files cannot be copied while the data acquisition is in progress.
If an error occurs while copying multiple files, the files after the error occurrence are not
copied.
You cannot change a directory attribute.
You cannot copy files if files with the same file name exist at the copy destination, .
You cannot copy the same files to another directory after copying the files. Select the files
to be copied again and copy them.
The date/time information of the copied file retains the date/time information of the copy
source file. However, if the copy destination is a network drive, the date/time is set to the
date/time when the file is copied.
This function cannot be used when using the FTP server function, network printer function,
or the Web server function.
The screen image data and thumbnail data are saved in pairs of files. If you specify “*.*”
for the files to be displayed (Filter) on the File List and manipulate individual files (Delete,
Rename, or Copy), the thumbnail display function can no longer be used.
Copying to the [RealTime] drive is not possible. (Copying from the [RealTime] drive to
other drives is possible.)
IM 701240-01E
13.18 Changing the Directory/File Name of the
Storage Medium and Creating Directories
1
2
CAUTION
Never remove the storage medium (disk) or turn OFF the power while the
access indicator or the PC card, internal hard disk (option), USB storage device
icon is blinking. Such acts can damage the storage medium or destroy the data
on the medium.
3
4
5
Procedure
6
Changing the Directory/File Name of the Storage Medium
1.
2.
3.
4.
Press FILE.
Press the Utility soft key. The Utility setup menu and the File List window
appear.
Press the Function soft key. The file function selection menu is displayed.
Press the Rename soft key.
7
8
Selecting Media and Directories
5.
9
Select the medium and directory according to steps 6 to 9 in section 13.9.
10
Changing the File Attributes
6.
Change the file attribute according to steps 6 and 7 in section 13.16.
11
Changing the Directory/File Name of the Storage Medium (Excluding Net Drive)
7.
8.
9.
Specifying the Files to Be Displayed in the File List Window and Displaying Properties
10.
Carry out steps 19 to 21 in section 13.9.
12
13
Saving and Loading Data
Turn the jog shuttle to select a directory name or file name.
Press the File Name soft key. A keyboard appears. The name of directory/file is
displayed in the entry box of the keyboard.
Enter the directory name or file name according to the procedure given in
section 4.2.
14
15
16
17
18
App
Index
IM 701240-01E
13-59
13.18 Changing the Directory/File Name of the Storage Medium and Creating Directories
Creating a Directory
1.
2.
3.
4.
Press FILE.
Press the Utility soft key. The Utility setup menu and the File List window
appear.
Press the Function soft key. The file function selection menu is displayed.
Press the Make Dir soft key.
Selecting Media and Directories
5.
Select the medium and directory according to steps 6 to 9 in section 13.9.
Creating Directories
6.
7.
8.
Turn the jog shuttle to select a medium or directory.
Press the Dir Name soft key. A keyboard appears.
Enter the directory name or file name according to the procedure given in
section 4.2.
Specifying the Files to Be Displayed in the File List Window and Displaying Properties
9.
Carry out steps 19 to 21 in section 13.9.
Explanation
Selecting the Storage Medium and Directory: File List
Media on which saving and loading are possible are displayed on the File List window.
• Display Examples of Storage Media
[PC Card]:
PC card
[HD]:
Hard disk
[SCSI5]:
SCSI device with the ID number set to 51
[SCSI5-1]:
Partition 1 of a CSI device whose ID number is 51
[NetWork]:
Network drive when the Ethernet interface option is installed)
[USB]:
USB storage device
1. When a SCSI device whose ID number is 5 is connected
13-60
IM 701240-01E
13.18 Changing the Directory/File Name of the Storage Medium and Creating Directories
Selecting the File Attribute: Attr (Excluding Net Drive)
1
Select the file attribute of each file from the following list of choices.
• R/W
Read and write possible.
• R
Read only. Cannot write to the file or delete the file.
2
3
Changing the Directory/File Name of the Storage Medium: Rename
4
Number of characters and types that can be used
Item
Number of Characters
Characters That Can Be Used
Directory name
File name
1 to 16 characters
1 to 16 characters
0 to 9, A to Z, %, _, (, ), 0 to 9, A to Z, %, _, (, ), -
*
5
However, a directory name that starts with “ND” (ND000 for example) is not allowed.
6
Creating a Directory: Make Dir
You can create a new directory in the medium. See above for the assignment of the
directory name when creating a new directory.
8
Specifying the File to Be Displayed on the File List Window: Filter
Specify the type of files to be displayed.
• *.Extension
Displays only the data file that was selected in the File Item setup menu and the data
type menu.
• *.*
Displays all the files in the medium.
Displays the following information about the selected file: filename.extension, the file
size, the date the file was saved, the attribute, the comment, etc.
Note
•
•
•
•
10
You cannot rename a directory/file or create a new directory while the data acquisition is in
progress (START/STOP indicator is ON).
You cannot change a directory attribute.
If a file with the same name already exists in the same directory, the file cannot be
renamed.
If a directory with the same name already exists in the same directory, the directory cannot
be created.
This function cannot be used when using the FTP server function, network printer function,
or the Web server function.
The screen image data and thumbnail data are saved in pairs of files. If you specify “*.*”
for the files to be displayed (Filter) on the File List and manipulate individual files (Delete,
Rename, or Copy), the thumbnail display function can no longer be used.
Directories cannot be created on the [RealTime] drive.
12
13
Saving and Loading Data
•
•
9
11
Property
•
7
14
15
16
17
18
App
Index
IM 701240-01E
13-61
13.19 Connecting a PC to the SL1400 via SCSI
You can connect a PC to the SCSI of the SL1400 and access the internal hard disk
(option) from the PC.
Supported PC OSs
Windows 2000 and Windows XP (updating of the files on the SL1400 cannot be detected
due to the limitation on the OS.)
Items Necessary for Connection
Cable (SCSI cable: half pitch 50 pins, pin type)
Use a commercially sold cable that is 3 m or less in length that has a characteristic
impedance between 90 and 132 Ω.
Connection Procedure
Changing the ID Number of the SL1400
Before connecting the SL1400 to a PC, you may need to change the SCSI ID of the
SL1400 so that it does not conflict with the PC’s ID. For the procedure in changing the
ID, see section 13.7.
Changing the ID Number of the Internal Hard Disk Drive
Set the ID number of the internal hard disk drive so that it does not overlap with the IDs
of other SCSI devices. For the procedure in changing the ID, see section 13.7.
CAUTION
• Make sure to follow the procedures exactly as written in “Connecting the
instrument to the PC” described below. Otherwise, drives of other SCSI devices
connected to the PC may get damaged.
• Never change the contents on the SL1400 disk from the PC (read only). Writing
to the disk may destroy files.
• Never perform the following operations. The internal hard disk of the SL1400 will
become inaccessible.
• Delete files on the internal hard disk of the SL1400 from the PC.
• Add files to the internal hard disk of the SL1400 from the PC.
• While connected to the PC, the File List window of the SL1400 may not be
displayed properly.
• If the connected PC enters sleep, standby, or rest mode, the SL1400 will not be
able to access its internal hard disk. Before connecting the PC to the SL1400,
disable such modes on the PC.
13-62
IM 701240-01E
13.19 Connecting a PC to the SL1400 via SCSI
Connecting the SL1400 and the PC
1.
2.
3.
4.
5.
1
Turn OFF the SL1400 and the PC.
Connect the SL1400 and the PC with the SCSI cable.
Turn ON the SL1400 first.
After the SL1400 boots up completely, check that the connected SCSI device
operates on the SL1400.
Turn ON the PC.
2
3
4
5
6
SL1400
7
Precautions to Be Taken When Connecting
• Drive
When formatting the internal hard disk on the SL1400, the hard disk can be
partitioned into two or three drives. For example, your PC will identify the two
partitions on the SL1400 internal hard disk as drives F and G on the PC. The drive
with the smaller drive letter (drive F: in the above example) is the area dedicated to
the realtime recording. Other drives are used to store setup data, waveform data,
screen image data, etc.
The drive for realtime recording is used as a working area for the realtime
recording within the SL1400. Never delete files, copy and paste files, and add
new files on this drive from the PC. Otherwise, the realtime recording may not
operate properly.
Other drives are used to save other types of data such as waveforms that can be
recalled later. The waveforms that can be used on the PC are saved on this drive.
9
10
11
12
13
Saving and Loading Data
Newly Created File During Connection
If a file is created with the SL1400 while it is connected to the PC, the new file is not
recognized by the PC.
8
14
15
16
17
18
App
Index
IM 701240-01E
13-63
13.19 Connecting a PC to the SL1400 via SCSI
• Drive Letter
If the PC to which the SL1400 is connected has multiple hard disks or if the hard disk
is partitioned, connecting the SL1400 will cause the internal hard disk of the SL1400
to be assigned drive letters after the hard disks on the PC.
For details, see the instruction manual for the PC or the drive.
The drive letter for the SL1400 cannot be changed.
Example
• The PC uses one hard disk as a single drive
Before connection
C: (HDD)
After connection
C: (HDD)
D: (SL1400)
• The PC uses one hard disk as two drives
Before connection
C: (HDD)
D: (HDD)
After connection
C: (HDD)
D: (HDD)
E: (SL1400)
Actually, this may vary depending on how the hard disk is partitioned and the type of
interface (IDE, SCSI, etc) and drive.
Note
•
•
•
13-64
The internal hard disk of the SL1400 has a built-in terminator. When the SL1400 is
connected to a PC, it is recommended that the SL1400 be connected to the end of the
SCSI chain.
Note that the driver letter assignments are different from the DL708, DL708E, and DL716.
Do not access the internal hard disk of the SL1400 from the PC when the internal hard
disk is being accessed from the SL1400. Likewise, do not access the internal hard disk
from the SL1400 when the internal hard disk is being accessed from the PC.
IM 701240-01E
Chapter 14
External Trigger I/O, External Clock Input, and Video Signal Output
1
14.1 External Trigger Input (TRIG IN)
2
CAUTION
3
Only input signals that meet the specifications below. Otherwise, undesirable
signal such as excessive voltage may damage the SL1400.
4
External Trigger Input Terminal
5
TRIG IN
This terminal is used when an external signal is used as a trigger source (see section
6.6).
6
7
Specifications
Connector type:
Input Level:
Minimum pulse width:
Logic:
Trigger delay time:
Externally synchronized operation:
RCA jack
TTL (0 to 5 V)
500 ns
Rising edge or falling edge
Within (200 ns + 1 sample period)
Possible (by connecting TRIG IN and TRIG OUT on
two SL1400s)
External Trigger Input Circuit Diagram and Timing Chart
9
10
11
+5 V
Minimum pulse
width
LCX14 or
equivalent
4.7 kΩ
8
TRIG IN
(when set to
100 Ω
12
)
100 pF
Trigger delay time
13
Internal trigger
14
External Trigger I/O, External Clock Input, and
Video Signal Output
Note
By using the trigger output function, the operation of two SL1400s can be synchronized.
No.1
16
SL1400
SL1400
TRIG
OUT
15
No.2
TRIG
IN
17
18
App
Index
IM 701240-01E
14-1
14.2 Trigger Output (TRIG OUT)
External Trigger Output Terminal
TRIG OUT/
EXT CLK IN
A TTL level signal is output when a trigger is activated. The signal level is normally high
and goes low when a trigger is activated.
Specifications
Connector type:
Output level:
Logic:
Output delay time:
Output hold time:
RCA jack
CMOS level (0 to 5 V)
Falls when the trigger is activated, rises after completing acquisition
Within (1 µs + 1 sample period)
200 ns or more
Trigger Output Circuit Diagram and Timing Chart
+5 V
4.7 kΩ
LCX14 or equivalent
100 Ω
EXT CLK IN
100 pF
HC245 or equivalent
EXT TRIG OUT
Trigger occurrence (time of trigger position)
Internal trigger
Output delay time
Trigger Output
Output hold time
Low Level/High Level Hold Time
Trigger occurrence
Trigger occurrence
H
Trigger Output
L
Post time
Waveform
acquisition
14-2
Pre- Trigger
trigger
Post-trigger
PreTrigger
trigger
Post-trigger
IM 701240-01E
1
14.3 External Clock Input (EXT CLK IN)
2
CAUTION
3
Only input signals that meet the specifications below. Otherwise, undesirable
signal such as excessive voltage may damage the SL1400.
4
External Clock Input Terminal
5
TRIG OUT/
EXT CLK IN
6
Use this terminal if you want to operate the SL1400 using an external clock signal.
This terminal is shared with the trigger output terminal (TRIG OUT).
7
Specifications
Connector type:
Input Level:
Valid edge:
Minimum pulse width:
External clock frequency range:
RCA jack
TTL (0 to 5 V)
Rising edge
400 ns or more for high and low
1 MHz maximum.
8
9
10
External Clock Input Circuit Diagram
+5 V
4.7 kΩ
100 Ω
11
LCX14 or equivalent
EXT CLK IN
12
100 pF
13
HC245 or equivalent
EXT TRIG OUT
14
External Trigger I/O, External Clock Input, and
Video Signal Output
15
16
17
18
App
Index
IM 701240-01E
14-3
14.4 Video Signal Output (VIDEO OUT (SVGA))
CAUTION
• Connect the cable after turning OFF the SL1400 and the monitor.
• Do not short the VIDEO OUT terminal or apply external voltage to it. This may
cause damage to the SL1400.
Video Signal Output Terminal
VIDEO OUT (SVGA)
The SL1400 display can be output to a monitor through the video signal output.
Connectable monitors are multi-sync monitors capable of displaying SVGA.
Specifications
Connector type:
15-pin D-SUB
Output type:
Analog RGB output
Output resolution: SVGA output 800 × 600 dots/60 Hz Vsync
5
1
10
6
15
11
D-Sub 15-pin receptacle
14-4
Pin No.
Signal Name
Specifications
1
2
3
4
5
6
7
8
9
10
11
12
13
14
15
Red
Green
Blue
–
–
GND
GND
GND
–
GND
–
–
Horizontal sync signal
Vertical sync signal
–
0.7 VP-P
0.7 VP-P
0.7 VP-P
Approx. 36.4 kHz, TTL positive logic
Approx. 60 Hz, TTL positive logic
IM 701240-01E
14.4 Video Signal Output (VIDEO OUT (SVGA))
1
Connecting to the Monitor
1.
2.
3.
4.
5.
6.
7.
Turn OFF the SL1400 and the monitor.
Connect the SL1400 and the monitor using an analog RGB cable.
Turn ON the SL1400 and the monitor.
Press the MENU soft key.
Press the Next 1/2 soft key.
Press the Others soft key.
Press the Video Out soft key to select ON. The screen of the SL1400 is
displayed on the monitor.
Select OFF to stop the display on the monitor.
2
3
4
5
6
7
8
9
10
11
12
13
14
External Trigger I/O, External Clock Input, and
Video Signal Output
15
16
17
18
App
Index
IM 701240-01E
14-5
14.5 External Start/Stop Input
The SL1400 start/stop can be controlled externally.
External Start/Stop Input Terminal
Specifications
Modular jack (RJ-11). Use the optional accessory 366973 (sold separately) for the cable.
START/
STOP
Pin No. Signal Name
1
NC (no connection)
2
START IN
3
NC (no connection)
4
NC (no connection)
GND
5
NC (no connection)
6
6
1
Connector on
the SL1400
Start on the low edge
Stop on the high edge
Input level: TTL (0 to 5 V)
External Start/Stop Input Circuit Diagram
+5 V
4.7 kΩ
2
(Pin No.)
LCX14
120 Ω
STOP
High
Low
100 pF
START
• Switch input is possible
+5 V
4.7 kΩ
2
LCX14
120 Ω
100 pF
5
Start at ON
Stop at OFF
Note
Low and High edges are used to detect start/stop.
14-6
IM 701240-01E
Chapter 15
Ethernet Interface (Option)
1
15.1 Connecting the SL1400 to the Network
2
Ethernet Interface Specifications
A 100BASE-TX port is provided on the left side panel of the SL1400.
3
Item
Specifications
Number of communication ports
Electrical and mechanical specifications
Transmission system
Transmission rate
Communication protocol
Supported services
1
Conforms to IEEE802.3
Ethernet (100BASE-TX/10BASE-T)
100 Mbps max.
TCP/IP
FTP server, FTP client (network drive), LPR client
(network printer), SMTP client (mail transmission),
DHCP, DNS, and Web server
RJ-45 connector
Connector type
4
5
6
7
8
ETHERNET 100BASE-TX port
LINK
9
100BASE-TX
ACT
LINK LED
Illuminates when the link between the
port on the SL1400 and the
connected device is established and
communication is mutually possible.
10
ACT LED
Blinks when packet transmission is
being carried out normally.
11
RJ-45 modular jack
12
Items Necessary for Connection
13
Cable
Be sure to use one the following cables for connection.
• UTP (Unshielded Twisted-Pair) cable (category 5 or better)
• STP (Shielded Twisted-Pair) cable (category 5 or better)
14
15
Ethernet Interface (Option)
16
17
18
App
Index
IM 701240-01E
15-1
15.1 Connecting the SL1400 to the Network
Connection Procedure
When Connecting to a Network PC or Workstation
1.
2.
Turn OFF the SL1400.
Connect one end of the UTP (or STP) cable to the ETHERNET 100BASE-TX
terminal on the left side panel.
Connect the other end of the UTP (or STP) cable to a hub or router.
Turn ON the SL1400.
3.
4.
Hub or router that supports 100BASE-TX
PC
or
Workstation
SL1400
UTP cable or STP cable (straight cable)
When Making a One-to-One Connection to the PC or Workstation
1.
2.
Turn OFF the SL1400 and the PC or workstation.
Connect one end of the UTP (or STP) cable to the ETHERNET 100BASE-TX
terminal on the left side panel.
Connect the other end of the UTP (or STP) cable to a hub or router.
Likewise, connect the PC or workstation to a hub or router.
Turn ON the SL1400.
3.
4.
5.
Hub or router that supports 100BASE-TX
PC
or
Workstation
SL1400
UTP cable or STP cable (straight cable)
Note
•
•
•
15-2
When connecting the PC or workstation one-to-one, a NIC (a 10BASE-T/100BASE-TX
autoswitching card) is required for the PC or workstation.
When using a UTP cable or STP cable (straight cable), be sure to use only a category 5
cable.
Avoid connecting the PC or workstation directly to the SL1400 without going through the
hub or router. Operations are not guaranteed for communications using direct connection.
IM 701240-01E
1
15.2 Setting up the TCP/IP
2
Procedure
1.
2.
3.
4.
Press MENU.
Press the Next 1/2 soft key.
Press the Network soft key.
Press the TCP/IP Setup soft key. The TCP/IP setup menu appears.
3
4
Turning DHCP ON/OFF
5.
5
Use jog shuttle+SELECT to set DHCP to ON or OFF.
If you DHCP to OFF, proceed to step 5.
If the DHCP is set to ON, you do not have to set the IP address, subnet mask,
and default gateway.
• To set up the DNS, proceed to step 12.
• If you do not want to set up the DNS, check the network cable connection
and restart the SL1400. The IP address, subnet mask, and default gateway
are automatically configured.
Setting the IP Address
Set the IP address if you turned DHCP OFF.
6.
Use jog shuttle+SELECT to set the IP Address. Enter using values in the range
of 0 to 255.
Setting the Subnet Mask
Set the subnet mask if you turned DHCP OFF.
7.
Use jog shuttle+SELECT to set the Net Mask. Enter using values in the range
of 0 to 255.
Setting the Default Gateway
Set the default gateway if you turned DHCP OFF.
8.
Use jog shuttle+SELECT to set the Gate Way. Enter using values in the range
of 0 to 255.
6
7
8
9
10
11
12
13
14
15
Ethernet Interface (Option)
16
17
18
Automatically configured
when DHCP is turned ON.
App
Index
IM 701240-01E
15-3
15.2 Setting up the TCP/IP
Setting the DNS
9.
Use jog shuttle+SELECT to set DNS to ON, OFF, or AUTO. (AUTO can be
specified when DHCP is ON.)
When DNS is set to AUTO, the domain name and DNS server name are
automatically configured by power-cycling the SL1400.
If DNS is set to ON, the domain name, DNS server name, and domain suffix are
displayed.
If DNS is set to OFF, check the network cable connection and power cycle the
SL1400.
Setting the Domain Name
10.
11.
Use jog shuttle+SELECT to select Domain Name.
Enter the domain name according to the procedure given in section 4.2.
Setting the DNS Server
12.
13.
Use jog shuttle+SELECT to select DNS Server1 (primary DNS server) and set
the primary DNS server address in the range of 0 to 255.
Likewise, set the secondary DNS server address in DNS Server2.
Setting the Domain Suffix
14.
15.
Use jog shuttle+SELECT to select Domain Suffix1 and set the primary domain
suffix.
Likewise, set the secondary domain suffix in Domain Suffix2.
Turning ON/OFF the Power
16.
15-4
To apply the new settings, the SL1400 must be power cycled.
After all the settings are complete, turn the power to the SL1400 OFF, then back
ON again.
IM 701240-01E
15.2 Setting up the TCP/IP
1
Explanation
The following TCP/IP settings must be entered to use the Ethernet communications
functions on the SL1400.
• IP address
• Subnet mask
• Default gateway
2
3
IP Address (Internet Protocol Address)
Set the IP address to assign to the SL1400. The default setting is “0.0.0.0.”
The IP address is an ID that is assigned to each PC on an IP network such as the
internet or an intranet. The address is a 32-bit value expressed using four octets (each 0
to 255), each separated by a period as in [192.168.111.24].
Obtain an IP address from your network administrator. The setting is automatically
configured in environments using DHCP.
4
5
6
7
Subnet Mask (Net Mask)
Set the mask value used when determining the subnet network address from the IP
address. The default setting is “255.255.255.0.”
Huge TCP/IP networks such as the Internet are often divided up into smaller networks
called sub networks. The subnet mask is a 32 bit value that specifies the number of bits
of the IP address used to identify the network address. The portion other than the
network address is the host address that identifies individual PCs on the network.
Consult your network administrator for the subnet mask value. You may not need to set
the value. The setting is automatically configured in environments using DHCP.
Default Gateway
Set the IP address of the gateway (default gateway) used to communicate with other
networks. The default setting is “0.0.0.0.”
The default gateway has control functions that handle protocol exchanges when
communicating with multiple networks, so that data transmission is carried out smoothly..
Consult your network administrator for the default gateway value. You may not need to
set the value. The setting is automatically configured in environments using DHCP.
DHCP (Dynamic Host Configuration Protocol)
8
9
10
11
12
13
14
To use DHCP, the network must have a DHCP server. Consult your network
administrator to see if DHCP can be used.
When DHCP is turned ON, different settings may be assigned each time the power is
turned ON. When using the FTP server function (see section 15.6), be sure to check the
IP address and other settings of the SL1400 using a PC or workstation each time you
turn ON the SL1400.
15
Ethernet Interface (Option)
DHCP is a protocol that allocates setup information that are needed temporarily to the
PCs connecting to the network. When DHCP is turned ON, the following settings are
automatically assigned.
• IP address
• Subnet mask
• Default gateway
• DNS
16
17
18
App
Index
IM 701240-01E
15-5
15.2 Setting up the TCP/IP
DNS (Domain Name System)
DNS is a system used to associate names used on the Internet called host names and
domain names to IP addresses. (Given AAA.BBBBB.com, AAA is the host name and
BBBBB.com is the domain name.) Instead of using the IP address, which is a sequence
of numbers, host name and domain name can be used to access the network.
On the SL1400, you can specify the host by name instead of by IP address when using
the FTP client function (see section 15.3) or network printer function (see sections 15.4
and 12.3).
Set the domain name, the DNS server address (“0.0.0.0” by default), and the domain
suffix. In networks that support DHCP, these settings can be configured automatically.
For details, consult your network administrator.
DNS Server: DNS Server1/DNS Server2
Up to two DNS server addresses can be specified (primary and secondary). If the
primary DNS server is down, the secondary DNS server is automatically looked up for
the mapping of the host name/domain name and IP address.
Domain Suffix: Domain Suffix1/Domain Suffix2
When the IP address corresponding to the server name with the aforementioned
domain name is not found, the system may be set up to search using a different
domain name. Enter this alternate domain name as the domain suffix. Up to two
domain suffixes can be specified, Domain Suffix1 (primary), and Domain Suffix2
(secondary).
Note
•
•
If you changed settings related to the Ethernet network, the SL1400 must be power
cycled.
If the SL1400 is turned ON with the DHCP function enabled without an Ethernet cable
connected, communications and file functions may not operate properly. In this case, turn
DHCP OFF and power cycle the SL1400.
Configuring the TCP/IP Settings of the PC
Communication parameters such as the IP address must also be specified on the PC.
Communication parameters are specified for each Ethernet NIC that is installed in the PC.
Here, the settings of the NIC required to connect your PC to the SL1400 are explained.
To automatically obtain the IP address and other parameters from a DHCP server, select
Obtain an IP address automatically under the IP Address tab of the TCP/IP Properties
dialog box.
For example, if you are connecting the PC to the SL1400 in a one-to-one relationship via
the Ethernet interface, specify the parameters as indicated in the next table.
For parameter details, consult your system or network administrator.
Parameter
Value
Note
IP address
Subnet mask
Example: 192.168.211.28
Example: 255.255.255.0
IP address for the PC
Set the same value as the subnet mask
specified for the SL1400.
Gateway
DNS
WINS
0.0.0.0 (default value)
Disable
Disable
The following procedure describes the steps for Windows 2000. For other versions of
Windows, carry out equivalent steps.
1. On the taskbar, click Start, point to Settings, and click Control Panel. Control Panel
opens.
2. Double-click the Network and Dial-up Connections icon.
3. Right-click Local Area Connection and select Properties.
4. Select Internet Protocol (TCP/IP) and click Properties to open the TCP/IP Properties
dialog box.
15-6
IM 701240-01E
15.2 Setting up the TCP/IP
1
2
3
4
5. Set the parameters such as the IP address according to the table on the previous page
and click OK.
5
6
7
8
9
10
11
12
13
14
15
Ethernet Interface (Option)
16
17
18
App
Index
IM 701240-01E
15-7
15.3 Saving/Loading Data to a Network Drive (FTP
Client Function)
<For a description of this function, refer to page 2-47.>
Procedure
1.
2.
3.
4.
Press MENU.
Press the Next 1/2 soft key.
Press the Network soft key.
Press the Net Drive Setup soft key. The Net Drive setup menu appears.
Setting the FTP Server
5.
6.
Use jog shuttle+SELECT to select FTP Server.
Enter the IP address of the FTP server according to the procedure given in
section 4.2. When using DNS (section 15.2), you can specify the address by
name.
Setting the Login Name and Password
7.
8.
9.
10.
Use jog shuttle+SELECT to select Login Name.
Enter the login name using up to 15 characters according to the procedure given
in section 4.2.
Use jog shuttle+SELECT to select Password.
Enter the password corresponding to the login name using up to 15 characters
according to the procedure given in section 4.2.
Setting the Timeout Time
11.
Use jog shuttle+SELECT to set Time Out. The selectable range is 0 to 3600 (s).
Note
If Login Name is set to anonymous, you do not have to enter the password.
Connecting/Disconnecting to a Network Drive
12.
15-8
Use jog shuttle+SELECT to select Connect. Connection is made to the network
drive. When the connection is established,
is displayed at the upper right
corner of the screen.
Use the jog shuttle to move the cursor to Disconnect, then press SELECT to
close the connection. The
displayed at the upper right corner of the screen
disappears.
IM 701240-01E
15.3 Saving/Loading Data to a Network Drive (FTP Client Function)
1
Saving/Loading the Screen Image, Waveform, and Setup Data
Saving/Loading the screen image data
13. Press MENU.
14. Press the IMAGE soft key.
15. Press the File List soft key. The File List window appears.
16. Use the jog shuttle to select [Network] in the File List window.
2
3
4
5
6
7
8
17.
The succeeding procedure is the same as the procedure described in section
13.12 and 13.13.
Saving/Loading Waveform Data and Setup Data
13. Press FILE.
14. Press the File Item soft key.
15. Select Setup or Waveform.
16. Press the Utility soft key. The File List window appears.
17. Use the jog shuttle to select [Network] in the File List window.
9
10
11
12
13
14
15
Ethernet Interface (Option)
16
18.
The succeeding procedure is the same as the procedure described in section
13.8 and 13.9.
17
18
App
Index
IM 701240-01E
15-9
15.3 Saving/Loading Data to a Network Drive (FTP Client Function)
Note
•
•
•
•
•
•
•
•
•
•
•
•
•
An FTP server software must be running on the PC or workstation to which the SL1400 is
to be connected. In addition, the following points need attention regarding the server
program settings.
Set the list output (string returned by the dir command) to UNIX format.
Set the home directory and its subdirectories to allow writing.
The client cannot move above the home directory.
The newest file is not necessarily displayed at the top of the file list.
Files and directories that are longer than 17 characters cannot be accessed.
Depending on the server, “<..>” that indicates a higher directory may not be displayed.
The time information in the file list will not be displayed correctly for the following cases.
• On Windows NT when the time stamp is displayed using am and pm.
• Servers that return characters other than ASCII characters in the list
The following operations are not possible.
• Turning file protect ON and OFF on saved files.
• Formatting a network drive.
• Copying between network drives.
• Renaming a file on the network.
This function cannot be used when using the FTP server function or the Web server
function.
To use this function, you must configure TCP/IP according to the procedure given in
section 15.2.
To apply new settings that are made while connected to a network drive, drop the
connection using Disconnect and reconnect.
If you are disconnected by the server when using the FTP client, you will be automatically
reconnected if you perform a file operation. This also hold true, if the network drive is
selected for Save to File when using an action trigger.
Explanation
You can save the screen image data, waveform data, and setup data to network drives
via the Ethernet network in the same fashion as with the PC card interface.
If you want to make the SL1400 the FTP server and access the SL1400 from an FTP
client on the network, see section 15.6.
FTP Server
Enter the IP address of the FTP server (the PC or workstation running the FTP server)
on the network to which waveform and setup data will be saved. On networks supporting
DNS, you can specify the host and domain by name instead of the IP address.
Login Name
Enter the login name using up to 15 characters. The default setting is “anonymous.”
The characters that can be used are all the ASCII characters on the keyboard.
Password
Enter the password corresponding to the login name using up to 15 characters.
The characters that can be used are all the ASCII characters on the keyboard.
Time Out
When an FTP server is accessed from the SL1400 and data is not transmitted for a
certain period of time (timeout time), the SL1400 decides that the transmission to the
FTP server is not possible and closes the connection. You can set the timeout value in
the range of 0 to 3600 s. The default setting is 15 s.
15-10
IM 701240-01E
1
15.4 Setting up the Network Printer (LPR Client
Function)
2
<For a description of this function, refer to page 2-47.>
Procedure
1.
2.
3.
4.
3
Press MENU.
Press the Next 1/2 soft key.
Press the Network soft key.
Press the Net Print Setup soft key. The Net Print setup menu appears.
4
5
Setting the LPR Server
5.
6.
Use jog shuttle+SELECT to select LPR Server.
Enter the IP address of the printer server according to the procedure given in
section 4.2. If you are using DNS, you can specify the printer server by name.
7
Setting the Printer Name
7.
8.
6
Use jog shuttle+SELECT to select LPR Name.
Enter the printer name according to the procedure given in section 4.2.
8
Printing the Screen Image Data
9.
Print the screen image data according to the procedure given in section 12.3.
9
Note
•
•
•
To use this function, configure the TCP/IP settings beforehand according to section 15.2.
Output is possible to printers or printer servers that support the TCP/IP protocol.
This function cannot be used when using the FTP server function or the Web server
function, or when performing file operations.
10
11
12
13
14
15
Ethernet Interface (Option)
16
17
18
App
Index
IM 701240-01E
15-11
15.4 Setting up the Network Printer (LPR Client Function)
Explanation
As with the built-in printer, you can print the screen image on a network printer via the
Ethernet network.
Net Print Setup
LPR Server
Specify the IP address of the network printer server. On networks supporting DNS,
you can specify the host and domain by name instead of the IP address.
Printer Name: LPR Name
Specify the name of the printer on which screen image data will be printed.
Output Format
The following six printer formats are supported.
• ESC-P
• ESC-P2
• LIPS3
• PCL5
• BJ
• PostScript
15-12
IM 701240-01E
1
15.5 Sending Periodic Mail or Action Mail (SMTP
Client Function)
2
<For a description of this function, refer to page 2-48.>
Procedure
3
Sending Periodic E-mail Messages
1.
2.
3.
4.
Press MENU.
Press the Next 1/2 soft key.
Press the Network soft key.
Press the Mail Setup soft key. The Mail setup menu appears.
4
5
Setting the Mail Server
5.
6.
Use jog shuttle+SELECT to select Mail Server.
Enter the IP address of the mail server according to the procedure given in
section 4.2. If you are using DNS, you can specify the mail server by name.
7
Setting the Recipient Mail Address
7.
8.
Use jog shuttle+SELECT to select Mail Address.
Enter the recipient mail address using up to 40 characters according to the
procedure given in section 4.2.
8
Setting a Comment
9.
10.
6
Use jog shuttle+SELECT to select Comment.
As necessary, enter the comment using up to 30 characters according to the
procedure given in section 4.2.
9
10
Setting the Time When the Mail Is to Be Sent
11.
12.
Use jog shuttle+SELECT to select the hour, minute, or second of MailBaseTime
Enter the time when mail is to be sent according to the procedure given in section 4.2.
12
Setting the Attached Image File
13.
11
Use jog shuttle+SELECT to select ON (attach image file) or OFF (do not attach
image file).
13
Setting the Interval for Sending Mail
14.
15.
Use jog shuttle+SELECT to select Interval.
Select the interval for sending mail in the range of 1 h to 24 h according to the
procedure given in section 4.2.
15
Sending a Test Mail
Turn the jog shuttle to move the cursor to Mail Test.
To send a test mail to the specified recipient, press SELECT.
is indicated at the upper left corner
While mail transmission is in progress,
of the screen.
Ethernet Interface (Option)
16.
14
16
17
18
App
Index
IM 701240-01E
15-13
15.5 Sending Periodic Mail or Action Mail (SMTP Client Function)
Note
•
•
•
•
The sender (From) address of the e-mail messages sent by the SL1400 is the same as
the specified recipient address.
If the transmitted contents indicate error logs, the most recent error is at the top of the
error log.
To use this function, configure the TCP/IP settings beforehand according to section 15.2.
If you set Interval to OFF, periodic mail is not sent.
Sending Action E-mail Messages
1.
Set items according to steps 1 to 10 in “Sending Periodic E-mail Messages” on
the previous page.
You do not have to set MailBaseTime and Interval for action mail. If you want to
use only action mail, set Interval to OFF.
Setting the Action
2.
3.
4.
5.
6.
7.
8.
9.
Press MENU.
Press the TRIGGER soft key.
Press the ACTION soft key.
Press the Mode soft key and then the On Trigger soft key.
Press the Action soft key. The action setup menu appears.
Use jog shuttle+SELECT to set Send Mail to ON.
Use jog shuttle+SELECT to set Mail Count (the number of mail messages).
Press START/STOP to start the waveform acquisition. A mail is sent to the
specified address each time a trigger occurs.
While mail transmission is in progress,
is indicated at the upper left corner
of the screen.
Note
•
•
•
•
15-14
The mail recipient is the address specified by pressing the Menu key > Next 1/2 > Network
> Mail Setup > Mail Address.
The sender (From) address of the e-mail messages sent by the SL1400 is the same as
the specified recipient address.
Periodic mail and action mail can be used together. To use only action mail, set Interval to
OFF.
To use this function, configure the TCP/IP settings beforehand according to section 15.2.
IM 701240-01E
15.5 Sending Periodic Mail or Action Mail (SMTP Client Function)
1
Explanation
Mail Server
Specify the IP address of the network mail server. On networks supporting DNS, you can
specify the host and domain by name instead of the IP address.
2
3
Mail Address
Enter the recipient address using up to 40 characters.
4
Comment
The comment is written on the first line of the transmitted mail. Enter it as necessary.
Enter comment using up to 30 characters.
5
6
Transmission Time (MailBaseTime)
The time when mail transmission is to start can be set in units of hour, minute, and
second, in the following range.
0:0:0 to 23:59:59
7
Attaching Image Data (Attached Image File, Version 4.01 or Later)
8
The screen image data at the time of mail transmission can be attached to the mail. The
data format of the screen image data is the format specified in section 13.12.
The file name differs between periodic mail and action mail.
File name of periodic mail: DL_image.png
File name of action mail:
DL_nnnn.png (where nnnn is an automatically assigned
number in the range of 0001 to 1000)
9
10
11
Transmission Interval
The following mail transmission intervals are available.
OFF, 1 H, 2 H, 3 H, 4 H, 6 H, 8 H, 12 H, and 24 H
However, if you select OFF, periodic mails cannot be transmitted.
12
13
Sending a Test Mail: Mail Test
A test mail is sent to the address specified by Mail Address.
14
15
Ethernet Interface (Option)
16
17
18
App
Index
IM 701240-01E
15-15
15.5 Sending Periodic Mail or Action Mail (SMTP Client Function)
Periodic Mail
The SL1400 status can be sent periodically to a specified mail address on the network.
SL1400 Information That Is Transmitted
• Acquisition Condition
Start/Stop, trigger condition, and acquisition counter
• Error Log Information
Error number and corrective action in English (up to 16 errors)
• Results of Waveform Parameter Measurement
Only when automated measurement of waveform parameters (see section 11.5) is
executed.
The maximum number of measurement results of waveform parameters that are
sent is the same as the maximum number (24) of measurement results displayed
on the SL1400.
Sample Periodic Mail
[Comment] aaaaaa
[ACQ Status]
Stopped
162
ErrNo 602 No SCSI device or no media inserted.
Check the SCSI device connection and
the SCSI ID, and make sure that the storage
medium is inserted (if applicable).
Action Mail
Information such as the trigger time can be sent to a specified mail address on the
network as an action of action-on-trigger.
SL1400 Information That Is Transmitted
• Acquisition Condition
Start/Stop, acquisition counter
• Trigger Time
• Results of Waveform Parameter Measurement
Only when automated measurement of waveform parameters (see section 11.5) is
executed.
Sample Action Mail
[Comment] aaaaaa
[ACQ Status]
Stopped
[Trigger Date and Time]
Max (C1)
SDv (C2)
Freq(C3)
+Wd (C4)
15-16
1
2002/06/17
17:28:59.38
4.16667V
697.941mV
500.0000kHz
1.00us>
IM 701240-01E
1
15.6 Accessing the SL1400 from a PC or
Workstation (FTP Server Function)
2
<For a description of this function, refer to page 2-48.>
Procedure
This section describes the FTP server function when a general FTP client software (such
as WS_FTP or FFFTP) is used. To use FTP through the Web browser, see section 15.7.
1.
2.
3.
4.
4
Press MENU.
Press the Next 1/2 soft key.
Press the Network soft key.
Press the User Account soft key. The User Account setup menu appears.
5
6
Setting the User Name
5.
6.
3
Use jog shuttle+SELECT to select User Name.
Enter the user name according to the procedure given in section 4.2. Specify
anonymous if you want to allow access to all users. To restrict access, enter the
user name using up to 15 characters.
7
8
Setting the Password
7.
8.
Use jog shuttle+SELECT to select Password.
Enter the password using up to 15 characters according to the procedure given
in section 4.2.
If you select the ENT key on the soft keyboard or press the ENT soft key, the
entered password (appears as *****) is cleared from the soft keyboard screen.
Enter the password again for confirmation. The password (appears as *****) is
confirmed and displayed in the Password column of the User Account setup
menu. If the password entered the second time is different from the first, the
entered password is cleared from the soft keyboard screen.
If the user name is set to anonymous, you do not have to enter the password.
10
11
12
13
Setting the Timeout Time
9.
9
Use jog shuttle+SELECT to set Time Out.
The connection to the network is automatically closed if there is no access to the
SL1400 for the specified time.
14
15
Ethernet Interface (Option)
16
17
18
600 s is recommended
when using the FTP
server function through
a dedicated FTP client.
App
Index
IM 701240-01E
15-17
15.6 Accessing the SL1400 from a PC or Workstation (FTP Server Function)
Executing the FTP Client Software
10.
Execute an FTP client software on the PC or workstation. Perform file
operations using the user name specified in steps 5 and 6.
Displaying the Connection Log List
11.
Press the Connect Log List soft key. The data and time, user name, and IP
address of the 25 recent accesses are displayed.
Note
•
•
•
•
•
•
•
15-18
The log list is cleared when the power is turned OFF.
The SL1400 supports up to two clients, but file operations cannot be performed
simultaneously.
When the SL1400 is being accessed from a PC or workstation (logged in),
is
displayed in the lower right part of the screen.
This function cannot be used when using the FTP client function, network printer function,
or the Web server function, or when performing file operations.
To use this function, configure the TCP/IP settings beforehand according to section 15.2.
To apply new settings, the SL1400 must be power cycled.
The files that can be uploaded to the SL1400 are those with the following extensions.
.WVF, .HDR, and .SET
However, do not upload files to the realtime recording area.
IM 701240-01E
15.6 Accessing the SL1400 from a PC or Workstation (FTP Server Function)
1
Explanation
You can access the SL1400’s PC card drive, internal hard disk (option), SCSI device, or
USB storage device from a PC or workstation via the Ethernet network.
To access the SL1400, an FTP client software is needed on the PC or workstation.
For a description of the FTP using the Web browser (Web server function), see section
15.7.
User Name
Enter the user name using up to 15 characters. The default setting is “anonymous.” The
characters that can be used are all the ASCII characters on the keyboard.
2
3
4
5
Password
Enter the password using up to 15 characters. The characters that can be used are all
the ASCII characters on the keyboard.
6
Time Out
7
The connection to the network is automatically closed if there is no access to the SL1400
for the specified time. The default value is 5 s. Set the timeout to a long value when
using an FTP client (such as FFFTP).
Note
•
•
It is recommended that the timeout be set to 600 s when using the FTP server function
through an FTP client.
When using the FTP server function on a Web browser (see section 15.7), it is
recommended that the timeout be set to 5 s (default value).
Connect Log List
The data and time, user name, IP address, access result of the 25 recent accesses from
the PC or workstation to the SL1400 are displayed.
8
9
10
11
12
13
14
15
Ethernet Interface (Option)
16
17
18
App
Index
IM 701240-01E
15-19
15.7 Using the Web Server Function
<For a description of this function, refer to page 2-48.>
You can use the Web server function on the SL1400 to display the screen image of the
SL1400 on the Web browser window on your PC and perform file operations on the
SL1400 using the keys displayed on the Web browser window.
This section contains the following information.
Item
Reference Page
Overview of the Web Server Function
This page
Operating Environment
• PC Environment
• SL1400 Environment
15-21
15-22
Preparations for Using the Web Server Function
• Preparations on the SL1400
• Preparations on the PC
15-23
15-24
Using the Web Server Function
• Using the FTP Server Function
• Capturing Data
• Displaying the Measurement Trend of Waveform Values
• Using the Control Script
• Displaying the Log
• Displaying the Instrument Information
• Viewing the Link
15-28
15-29
15-34
15-38
15-40
15-42
15-43
Overview of the Web Server Function
• FTP Server Function (On the Web Browser)
View the list of files stored on the storage media of the SL1400 (internal hard disk or
built-in storage medium) and transfer files to the PC.
• Data Capture
The following operations can be carried out.
• Change the display format of the SL1400 and display data that is acquired in the
history memory.
• Display the screen image of the SL1400.
• Save the waveform data and setup data to the PC.
• Load the setup data stored on the PC into the SL1400.
• Measurement Trend of the Waveform Parameter Values
Using the Excel function, display the trend of the selected waveform parameter
values. The statistics of the measured values can also be computed.
• Control Script
Control the SL1400 using communication commands (see the Communication
Interface User’s Manual IM701240-17E
.
• Log
Displays the past log of errors that occurred on the SL1400, and action-on-trigger. Up
to the 30 most recent incidents are logged.
• Instrument Information
Display the model of the SL1400, the module configuration, the presence/absence of
options, the ROM version (firmware version), etc.
• Link
View the Web page for the SL1400.
15-20
IM 701240-01E
15.7 Using the Web Server Function
1
System Requirements
PC Environment
2
PC
PC running Microsoft Windows 2000 Professional or Microsoft Windows XP
Professional.
3
OS
Microsoft Windows 2000 Professional or Microsoft Windows XP Professional.
4
Internal Memory
64 MB or more recommended.
5
Communication Port
Ethernet communication port that supports 10BASE-T or 100BASE-TX. Use this
communication port to connect the PC to the network.
6
Display
Display supported by the OS indicated above with a resolution of 1024 × 768 dots or
higher.
7
Mouse or Pointing Device
Mouse or pointing device supported by the OS indicated above.
8
Files Required for the Web Browser
Of the Web server functions, the following files are required when using the data
capture, measurement trend, or command script function. For the installation
procedure on the PC, see “Installing Files Required for the Web Browser” (page 1525).
Msvbvm60.dll
cmdlgjp.dll
comdlg32.ocx
9
Web Browser
Spreadsheet Software1
Windows 2000 Professional
Windows XP Professional
Internet Explorer 5.0/5.5/6.0
Internet Explorer 6.0
Microsoft Excel 97
Microsoft Excel 2002
11
12
Combinations of OS and Application Software That Have Been Tested
OS
10
13
1. The spreadsheet software is required when displaying the trend of waveform parameters of
the Web server function.
14
15
Ethernet Interface (Option)
16
17
18
App
Index
IM 701240-01E
15-21
15.7 Using the Web Server Function
SL1400 Environment
Connection to the Network
Connect the SL1400 to the network using the Ethernet. For the connection procedure,
see section 15.1.
TCP/IP
Configure the network environment and IP address for communication using the
Ethernet interface. For the procedure, see section 15.2.
Communication Interface
Set the communication interface to Network. For the procedure, see “Setting the
Communication Interface to the Network” (page 15-23).
User Account
Set the user account used to access the SL1400 from the PC. For the procedure, see
section 15.6.
Time Difference from the Greenwich Mean Time
When using the Web server function, set the time difference from the GMT. Normally,
the time difference is also set on the PC. Setting the time difference correctly allows
the SL1400 and the PC to detect the local time correctly. Consequently, the PC will be
able to detect whether a file is new when transferring or saving the file. For the
procedure, see section 15.8.
Note
•
•
Use Internet Explorer version 5.0 or later for the Web browser.
The Web server function contains software programs that have not been authenticated.
Therefore, the following dialog box may appear. In such case, click Yes and install the
software.
•
You cannot open multiple Internet Explorer windows on the same PC and use the same
function of the Web server function simultaneously.
When using the storage function of the FTP server function (on the Web browser), data
capture function, or the log display on the same PC, other Web server functions cannot be
used.
When using the storage function of the FTP server function (on the Web browser), data
capture function, or the log display on a PC, other PCs cannot use the Web server
function.
The Web server functions use the Ethernet interface for communication. If the Ethernet
interface is configured for controlling the SL1400 using a communication command (see
the Communication Interface User’s Manual IM701240-17E ), the Ethernet interface cannot
be used simultaneously.
The Web server function cannot be used while the SL1400 is printing, operating files (file
operation from the front panel key or file transfer using the FTP server function), realtime
recording, or while the Windows network drive is being used.
When the SL1400 is registered as a network drive (see section 15.3), the Web server
function cannot be used.
•
•
•
•
•
15-22
IM 701240-01E
15.7 Using the Web Server Function
1
Preparations for Using the Web Server Function
Connecting the PC and the SL1400 to the Network
2
Connect the PC and the SL1400 to the network. For the connection procedure, see
section 15.1.
3
Preparations on the SL1400
Setting the Communication Interface to Network
Turn ON the power to the SL1400. After the SL1400 boots up normally, carry out the
following procedure.
1.
Press MENU.
2.
Press Next 1/2 soft key.
3.
Press the Remote Cntl soft key. The Remote Cntl menu appears.
4.
Press the Device soft key. The Device menu appears.
5.
Press the Network soft key. The Ethernet interface is selected for the
communication means.
4
5
6
7
8
9
10
11
Setting up the TCP/IP
6.
Set the TCP/IP on the PC and the SL1400. For the procedure on the SL1400,
see section 15.2.
12
13
Setting the User Account Used to Access the SL1400
7.
Set the user account used to access the SL1400 from the PC. For the
procedure, see steps 1 to 9 in section 15.6.
14
Note
The User Account in the menu that appears after step 5 is the user account that is used to
control the SL1400 through communication commands via the Ethernet network. It is not the
user account for using the Web server function.
Rebooting
9.
To activate the TCP/IP, user account, and time difference settings, turn OFF the
power switch. After a few seconds, turn ON the power switch and boot the
SL1400.
Ethernet Interface (Option)
Setting the Time Difference from GMT (Greenwich Mean Time)
8.
Set the time difference between the location where the SL1400 is located and
the GMT. For the procedure, see section 15.8.
15
16
17
18
App
Index
IM 701240-01E
15-23
15.7 Using the Web Server Function
Preparations on the PC
1.
Power up the PC and log on.
If the PC is running Windows 2000 or Windows XP, log on as an administrator. If you do
not log on as an administrator, you may not be able to install files that are required for
using the Web server function (described later).
Logging into the Web Server (SL1400)
2.
Start Internet Explorer.
3.
Enter the IP address of the SL1400 (for example, 192.168.0.101) or the host
name of the SL1400 (for example, SL1400) if a DNS server is available on the
network.
Enter the IP address
http://192.168.0.101/
Enter the host name
http://SL1400/
4.
5.
Press the ENTER key on the PC keyboard. A network password entry dialog
box opens.
Enter the user name and password.
•
•
6.
Enter the user account (see section 15.6) used to access the SL1400. In the example
below, “DLUSER” and “*****” are entered for the user name and password,
respectively.
If the user name of the user account is set to “anonymous” (default setting), the
password is not required.
Click OK. If the login to the SL1400 Web server is successful, the Web server
window appears.
If the user name of the user name is set
to “anonymous,” the password is not
required.
Web Server Window
15-24
IM 701240-01E
15.7 Using the Web Server Function
Installing Files Required for the Web Server
• Using the SL1400 and the PC While Connected to the Internet
When you use the Web server function for the first time, the files required for the Web
browser are installed automatically from the Microsoft Web site.
*
7.
If the three files (Msvbvm60.dll, cmdlgjp.dll, and comdlg32.ocx) are already installed
in the PC when using the Web server function for the first time, step 7 is no required.
When the data capture, measurement trend, or command script function of the
Web server function is used for the first time, three files, Msvbvm60.dll,
cmdlgjp.dll, and comdlg32.ocx, are automatically downloaded from the
Microsoft Web site and installed in the PC. At this point, a dialog box for
confirming the installation appears. Click Yes.
(You may need to restart the PC during the installation.)
After the installation completes successfully, proceed to step 9 on the next page.
1
2
3
4
5
6
7
8
9
10
11
or
12
13
14
15
Ethernet Interface (Option)
16
17
18
App
Index
IM 701240-01E
15-25
15.7 Using the Web Server Function
• Using the SL1400 without Connecting to the Internet
If the three files, Msvbvm60.dll, cmdlgjp.dll, and comdlg32.ocx, are not
installed in the PC when using the Web server function for the first time, install the
files beforehand according to the following procedure.
7.
Download the following file from the YOKOGAWA Web site
(http://www.yokogawa.com/tm/Bu/DLsoft/web.htm).
YOKOGAWA T&M Web Runtime: ytmwrun.exe
Data size: Approx. 2.2 MB
8.
Double-click ytmwrun.exe that you have downloaded. The installation of the
aforementioned three files starts. Follow the instructions to install the files.
Checking the Web Browser (Internet Explorer) Security Settings
Check the security settings on the Internet Explorer. The settings indicated in the
table on the next page are defaults. If the settings on your browser do not match, set
them back to the settings in the table on the next page. Otherwise, the Web server
function cannot be used.
The following explanation is for Internet Explorer 5.5. For other versions, carry out
equivalent steps accordingly.
9.
Choose Internet Options from the Tools menu. The Internet Options dialog
box opens.
10. Click the Security tab.
11. Select a Web content zone.
The Web service zone varies depending on the network environment and browser
settings. Check with your network administrator to select the zone.
15-26
IM 701240-01E
15.7 Using the Web Server Function
12.
1
Click Custom Level. The Security Settings dialog box opens.
2
3
4
5
6
7
13.
Set the security settings as shown in the following table.
Item
Run ActiveX controls and plug-ins
Enable
Script ActiveX controls marked safe for scripting
Enable
Download signed ActiveX controls
Prompt
14.
8
Security Level
9
10
Click OK.
11
12
13
14
15
Ethernet Interface (Option)
16
17
18
App
Index
IM 701240-01E
15-27
15.7 Using the Web Server Function
Using the Web Server Function
Using the FTP Server Function (On the Web Browser)
Before using this function, check that the communication interface of the SL1400 is set to
Network (see page 15-23).
Click the FTP icon on the Web server window. A window for viewing the storage media
of the SL1400 (storage media view window) appears.
The storage media view window may not appear. In this case, click the Refresh button on the
Web browser. A login dialog box opens. Log in. The storage media view window appears.
Web Server Window
Storage Media View Window
Built-in storage media
PC Card
USB storage device
Internal hard disk
• Real Time: Area used by realtime recording
• HD0, HD1:
Storage area for waveform and setup data
(the number of displayed items varies
depending on the number of partitions)
• You can open folders on each storage medium and view the file list.
• You can select files displayed on the window and transfer files to the PC.
CAUTION
• Never change the contents on the SL1400 disk from the PC (read only). Writing
to the disk may destroy files.
• Never perform the following operations. The internal hard disk of the SL1400 will
become inaccessible.
• Delete files on the internal hard disk of the SL1400 from the PC.
• Add files to the internal hard disk of the SL1400 from the PC.
15-28
IM 701240-01E
15.7 Using the Web Server Function
1
Note
•
•
•
•
•
Up to two PCs can log into the file transfer function simultaneously.
You cannot operate the files simultaneously from two PCs.
When the SL1400 is printing, operating files (file operation from the front panel key or file
transfer using the FTP server function), or realtime recording, the Web server function
cannot be used.
To use the FTP server on a Web browser, a network user account on the SL1400 must be
configured. For the procedure of setting user accounts, see steps 1 to 9 in section 15.6.
An authentication login dialog box may appear on the Web browser, when the FTP icon on
the Web server window is clicked. In such case, enter the user name and password that
were entered in section 15.6.
2
3
4
5
Capturing Data
Before using this function, check that the communication interface of the SL1400 is set to
Network (see page 15-23).
Click the Data Capture icon on the Web server window. The Data Capture window
showing the screen image of the SL1400 and the control panel that allows data saving
and loading appears
6
7
Web Server Window
8
9
10
11
12
Data Capture Window
13
14
15
Ethernet Interface (Option)
16
17
18
SL1400 screen image
Control panel
App
Index
IM 701240-01E
15-29
15.7 Using the Web Server Function
Displaying and Saving the Screen Image (Image Control)
The screen image of the SL1400 can be displayed on the PC screen and saved.
• Updating the Screen Image (Monitor & Capture)
Play
Click Play to illuminate the update indicator in green and start the updating of the
screen image at the specified display update interval (see below).
Stop
Click Stop to turn off the update indicator and stop the updating of the screen image.
Update
The screen image is updated when you click Update.
Interval
Set the display update interval to 10 s, 30 s, or 60 s.
Update indicator
• Selecting the Display Color of the Screen Image (Color)
Select the display color from ON, OFF, Reverse, and Gray. For a description of the
displayed information for each setting, see the explanation in section 13.12.
Note
The time it takes to display the screen image on the PC varies depending on the color setting.
In decreasing order, the color settings are ON, Reverse, Gray, and OFF.
• Saving the Screen Image in the PC
Right-click on the screen image that is displayed. A shortcut menu appears as
shown in the following figure. Choose Save Picture As to save the current screen
image.
15-30
IM 701240-01E
15.7 Using the Web Server Function
Saving Data in the PC and Loading Setup Data from the PC into the SL1400
(Data Control)
• Saving Data in the PC (Capture)
Data Type
Select the type of data to be saved from Waveform Binary, Waveform ASCII,
Waveform Float, Setup, and Measure. For details on the settings, see the
explanations in section 13.8, 13.9, and 13.11.
1
2
3
4
5
6
Capture Exec
Using the dialog box that appears when you click Capture Exec, set the save
destination and file name and save the data.
7
8
9
Abort
To abort the save operation while data is being saved, click Cancel on the dialog
box. Then, click Abort on the Control Panel.
10
11
12
13
You must enter a password to abort.
For details, see “Input Password” in
the next section.
15
Ethernet Interface (Option)
• Loading the Setup Data from the PC into the SL1400 (Load)
Input Password
Enter the password (see page 15-24) that you used to log into the Web server
(SL1400). If the user name of the user account is set to “anonymous” (default
setting), the password is not required.
Setup Load
Click Setup Load to display the Open dialog box. Select the setup data file you
want to load and click OK to execute the load operation.
14
16
17
18
App
Index
IM 701240-01E
15-31
15.7 Using the Web Server Function
Note
•
•
•
•
Depending on the operation condition of the SL1400 (such as when measurement is in
progress), data save and setup data load operations may not be possible.
When data is being saved or the setup data is being loaded, other Web server functions
cannot be used.
When loading the setup data or when aborting the save operation, a temporary file
(zzzftpzzztmpzzz.bat) is created in the start directory of the Internet Explorer. After the
operation is complete, the temporary file will be deleted.
If you execute the data save operation when there is no waveform data or waveform
parameter, an error is displayed on the SL1400 screen, and a 0-byte file is saved.
Controlling the SL1400 (Instrument Control)
You can use the PC to set the display format and the data save conditions of the
SL1400. The settings entered here apply to the display format and save conditions
used to save the data on the previous page
• Starting/Stopping the Waveform Acquisition (Acquisition)
Start
Click Start to start the waveform acquisition.
Stop
Click Stop to stop the waveform acquisition.
• Turning ON/OFF the Waveform Display and Setting the Vertical Position
(Channel)
Selecting the Target Waveform
From the channel box, select the channel for turning ON/OFF the display and
setting the vertical position from the following:
Chan1 to Chan16 (channels 1 to 16)
Display ON/OFF
To display the waveform of the selected channel (turn it ON), select the Display check
box. Clear the check box to not display the waveform of the selected channel (OFF).
Vertical Position
You can set the vertical position of the waveform of the selected channel. For a
description of the selectable range of the vertical position, see section 5.4.
• Setting the Display Format (Display)
Display Format
Select the number of divided windows when displaying waveforms from the
following:
1 Zone, 2 Zone, 3 Zone, 4 Zone, 8 Zone, and 16 Zone
For the meanings of the selections, see the explanation in section 8.1.
Turning ON/OFF the Display of the Waveform Labels and Scale Values
(Label)
• Display Waveform Label (TraceLabel)
To display the labels of the displayed waveforms, select the TraceLabel check
box. Clear the check box to not display the labels.
• Turning ON/OFF the Display of the Upper and Lower Limits of the Displayed
Waveforms (ScaleValue)
To display the upper and lower limits of the displayed waveforms, select the
ScaleValue check box. Clear the check box to not display the upper and lower
limits.
15-32
IM 701240-01E
15.7 Using the Web Server Function
• Selecting the Waveforms to Be Saved (File)
Selecting the Target Waveforms (Trace)
From the Trace box, select the waveforms to be saved from the following:
All (all waveforms), 1 to 16 (channels 1 to 16), Math 1 to Math 8 (computed
waveforms), and PodA to PodB (logic waveforms).
Selecting the Save Area (Range)
Select the area in which the target waveform to be saved is displayed from the
following:
Main, Z1, and Z2
For the meanings of the selections, see the explanation in section 13.8.
• Setting the History Data Display
Selecting by History Data Number (History No.)
You can specify the history number of the data to be displayed.
Selecting the Most Recent or Oldest Data
You can specify the most recent or the oldest data in the history data to be
displayed.
Selecting One or All
• One
Click One to display a single history data point that is selected by the data
number or selected by most recent or oldest.
• All
Click All to display all the history data.
1
2
3
4
5
6
7
8
9
10
• Updating the Setup Condition (Panel Update)
Click Panel Update to update the control panel settings on the Data Capture
window (PC) to match the most recent setup condition on the SL1400.
11
• Automatically Updating the Screen Image (Confirmation)
Select the Confirmation check box to automatically update the screen image using
the same conditions as Color-OFF when you change the settings of the above
items that would cause the screen image to change. Clear the check box to not
update automatically.
12
13
14
15
Ethernet Interface (Option)
Note
•
•
•
16
You cannot set the history data display when the SL1400 is making measurements.
Setting the history data display when there is no history data results in error.
The timeout time on the PC when controlling the SL1400 is 30 s. Depending on the
SL1400 condition, a timeout may occur preventing you from controlling the SL1400.
17
18
App
Index
IM 701240-01E
15-33
15.7 Using the Web Server Function
Displaying the Measurement Trend of the Waveform Parameter Values
Before using this function, check that the communication interface of the SL1400 is set to
Network (see page 15-23).
Click the Measurement Trend icon on the Web server window. The Measurement Trend
window in which the trend display of the waveform parameter values can be set appears.
Web Server Window
Measurement Trend Window
Control panel
Note
•
•
•
•
•
15-34
This function retrieves the selected waveform parameter values at the selected retrieve
interval from the SL1400 into the PC and displays the trend. To display the retrieved
measurement values and trend, Microsoft Excel 97 or later must be installed on the PC.
Set the record time setting of the SL1400 to 1 s or less (shorter). This function cannot be
used on record time settings that exceed 1 s.
If the measured value of a waveform parameter is not a normal number (Not A Number),
the cell displaying the measured value on Microsoft Excel is set to blank.
The retrieve interval specified using this function and the measurement interval of the
waveform parameters on the SL1400 are not synchronized.
If the waveform parameter measurement is not complete within the specified retrieve
interval, Not A Number is transmitted to the PC because there is no measured value. In
this case, the cell displaying the measured value on Microsoft Excel is set to blank.
IM 701240-01E
15.7 Using the Web Server Function
Setting the Trend Display Conditions
• Selecting the Waveform Parameter to Be Displayed (Graph 1 and Graph 2)
You can display two trend graphs. For each graph, you can specify the trend target
waveform and the waveform parameter. When the waveform parameter is
“Marker,” you can set the Marker Position.
Selecting the Target Waveform (Trace)
From the Trace box, select the target waveform for the trend display from the
following:
Chan1 to Chan16 (channels 1 to 16), Math1 to Math8 (computed waveforms)
Selecting the Waveform Parameter
From the Parameter box, select the target waveform parameter of the trend display
(same expression as the communication command) from the following: For the
meanings of the waveform parameters and the marker cursor, see the explanation
in section 11.5 or 11.4.
Parameter
SL1400 Menu
Parameter
SL1400 Menu
None
Not selected
MINIMUM
Min
AMPLITUDE
Amp
NOVERSHOOT
-OShot
AVERAGE
Avg
NWIDTH
-Width
AVGFREQ
AvgFreq
PERIOD
Period
AVGPERIOD
AvgPriod
PNUMBER
Pulse
BWIDTH1
Burst1
POVERSHOOT
+OShot
BWIDTH2
Burst2
PTOPEAK
P-P
DELAY
Delay
–
(For a detail setting, use Delay Setup on the SL1400)
–
DUTYCYCLE
Duty
PWIDTH
+Width
FALL
Fall
RISE
Rise
FREQUENCY
Freq
RMS
Rms
HIGH
High
SDEVIATION
Sdev
LOW
Low
TY1INTEG
Int1TY
MAXIMUM
Max
TY2INTEG
Int2TY
Marker(M1<2>)
M1<2>
(marker cursor for cursor measurements)
XY1INTEG
Int1XY
MIDDLE
XY2INTEG
Int2XY
Mid
2
3
4
5
6
7
8
9
10
11
12
13
Setting the Marker Position
You can set the marker position if “Marker(M1)” or “Marker(M2)” is selected as the
waveform parameter.
15-35
14
15
Ethernet Interface (Option)
• Setting the Conditions for Retrieving the Measured Values of Waveform
Parameters (Common)
Number of Displayed Measured Values (Data Number)
Select the number of measured values (measured values retrieved from the
SL1400 into the PC) to be displayed in the cells of Excel from the following: If the
number of measured values exceeds the selected number, the values are cleared
from the oldest values to display the most recent measured values.
10, 20, 50, 100, 200, and 500
Retrieve Interval
Select the retrieve interval from the following. However, of the selected waveform
parameters, select the interval to match the longest parameter cycle measured on
the SL1400.
2 s, 5 s, 10 s, 30 s, and 60 s
IM 701240-01E
1
16
17
18
App
Index
15.7 Using the Web Server Function
Measurement Range
You can set the range on the time axis for measuring the waveform parameter.
Range1 and Range2 are the start and end points, respectively.
Selectable range: ±5 div
Resolution: Varies depending on the record length.
However, the measurement start point cannot be set to the same point as the
measurement end point or to a value to the right of the measurement end point.
Turning ON/OFF the Statistics Display
• The statistics (Max, Min, and Average) of the waveform parameters retrieved
into the PC can be displayed.
• To display the statistics, select the Statistics check box. Clear the check box to
not display the statistics.
• The number of measurement values displayed in the cell of Excel is up to the
number specified in “Number of Displayed Measured Values (Data Number)” on
the previous page. The statistics are determined on all the measured data since
the trend display was started, not on only the displayed measured values.
Updating the Setup Condition
Click Update to update the Marker Position and Range that are set on the control
Panel of the measurement trend window to match the most recent setup conditions
of the SL1400.
Starting/Stopping the Trend Display of the Measured Values of the Waveform
Parameters
• Start
Click Start/Stop. The indicator illuminates in yellow, and retrieval of the measured
values of waveform parameters starts at the specified retrieve interval. At the same
time, Microsoft Excel starts, and the measured values and trend graphs are
displayed/drawn. If the statistical display is turned ON, the statistics are also
displayed. The retrieval of the measured value of waveform parameter continues
until the operation is stopped.
• Stop
• Click Start/Stop while the trend display is in progress. The indicator turns OFF,
and the display and drawing of the measured values and trend graph stop.
• If you attempt to save the data to a file or close Excel while the trend display is
in progress, a runtime error occurs. In this case, select No on the runtime error
dialog box and close the dialog box. Then, click Start/Stop on the measurement
trend window to stop the trend display. After stopping the trend display, save the
file or close Excel.
Indicator
15-36
IM 701240-01E
15.7 Using the Web Server Function
1
Display Example of Measured Values, Trend Graphs, and Statistics
2
Trend graph (Graph1)
3
4
Newest measured value
Statistics
Trend graph (Graph2)
5
6
7
List of measured values
Newest measured value
Statistics
8
9
10
11
12
13
14
15
Ethernet Interface (Option)
16
17
18
App
Index
IM 701240-01E
15-37
15.7 Using the Web Server Function
Using the Control Script
Before using this function, check that the communication interface of the SL1400 is set to
Network (see page 15-23).
Click the Control Script icon on the Web server window. The Control Script window
used to send communication commands (see the Communication Interface User’s
Manual ) to the SL1400 and display the responses from the SL1400 appears.
Web Server Window
Control Script Window
Transmission command entry area
Response display area
Indicator
15-38
IM 701240-01E
15.7 Using the Web Server Function
1
Sending Commands (*Command IEEE 488.2)
• Entering the Transmission Commands
Enter the commands in the transmission command entry area.
Maximum number of input characters: Up to 50,000 (50 KB).
• Sending Commands
Click Send to send the commands in the transmission command entry area
collectively in the order displayed in the area.
• Clearing the Entered Commands (Clear Command Area)
Click Clear Command Area to clear all the commands in the transmission
command entry area.
2
3
4
Displaying the Responses from the SL1400 (*Response)
The responses from the SL1400 against the commands (queries) sent to the SL1400
using the control script function can be received and displayed.
• Clearing the Responses (Clear Response Area)
Click Clear Response Area to clear all the responses received from the SL1400
that are displayed in the response display area.
Sending Commands Periodically and Displaying Responses
The commands in the transmission command entry area can be sent periodically. If
commands (queries) that request responses from the SL1400 are sent, the responses
from the SL1400 are displayed in the response display area.
• Setting the Transmission Interval
Select the command transmission interval from the following:
2 s, 5 s, 10 s, 30 s, and 60 s
• Starting Periodic Transmission (Start)
Click Start/Stop. The indicator illuminates in yellow, and the command
transmission and response display start at the specified transmission interval.
• Stopping Periodic Transmission (Stop)
Click Start/Stop while the periodic transmission is in progress. The indicator turns
OFF, and the command transmission and response reception/display stop.
However, if the last command before stopping the periodic transmission was a
query command, the response to that command is displayed in the response
display area.
Note
•
6
7
8
9
10
11
12
13
14
15
Ethernet Interface (Option)
•
•
If a wrong command is sent, the error message is not automatically displayed in the
Control Script window. The error code and message are displayed by entering the
“:status:error?” command in the transmission command entry area and sending the
command. You can also confirm the error on the screen image displayed using the data
capture function and also on the SL1400 screen.
Binary data cannot be received or displayed.
The transmission timeout is 30 s. Transmission and reception exceeding 30 s results in a
timeout error. If all the commands specified in the transmission command entry area is
sent, and the responses to the commands are not received within 30 s, a timeout error
occurs.
5
16
17
18
App
Index
IM 701240-01E
15-39
15.7 Using the Web Server Function
Displaying the Log
Before using this function, check that the communication interface of the SL1400 is set to
Network (see page 15-23).
Click the Log icon on the Web server window. The Log window that can display the past
log of errors that occurred on the SL1400, and action-on-trigger appears. Up to the 30
most recent incidents are logged. Logs older than the past 30 are not displayed.
Web Server Window
Log Window
Displaying the Log
• Selecting the Log Type (Select Kind of Log)
From the list box, select the item for displaying the log from the following:
• Error (log of errors that occurred on the SL1400)
• Action Trigger (log of action-on-triggers)
For the setup procedure for the action-on-trigger, see section 6.18.
• Updating the Log (Update)
Click Update to display the selected log. If the selected type of log is the same as
that of the log being displayed, the log is updated.
15-40
IM 701240-01E
15.7 Using the Web Server Function
Log Display Example
The following figure shows an example displaying the log of the action-on-trigger.
1
2
Displays “Executing...” when action-on-trigger is in execution.
3
4
5
6
If screen image data or waveform data files is being saved in
the action-on-trigger, the files can be saved on the PC from
the Log display window.
The log displays the save destination drive as follows.
CA0:
SC4:
SC4-1:
ND0:
US - :
7
8
PC card
SCSI device with the ID number set to 4*
Partition 1 of a SCSI device whose ID number is 4*
Network drive (when the Ethernet interface option is installed)
USB storage device
9
Partition number (or LUN (logical unit number))
Address number
10
* ID number 4 is the default value for the SL1400 internal hard disk (option).
Note
•
•
When the SL1400 is printing, operating files (file operation from the front panel key or file
transfer using the FTP server function), or realtime recording, files cannot be saved on the
PC. In addition, other Web server functions cannot be used while saving files.
Files on the network drive (NetWork) cannot be saved to the PC.
11
12
13
14
15
Ethernet Interface (Option)
16
17
18
App
Index
IM 701240-01E
15-41
15.7 Using the Web Server Function
Displaying the Instrument Information
Before using this function, check that the communication interface of the SL1400 is set to
Network (see page 15-23).
Click the Information icon on the Web server window. The Information window that
displays the SL1400 model (Model), the maximum record length available (Record
Length), the module configuration (Module), the storage media type (Media), the
presence of options (Option), ROM version (firmware version, Soft Version), and other
information appears.
Web Server Window
Information Window
15-42
IM 701240-01E
15.7 Using the Web Server Function
1
Viewing the Link
Before using this function, check that the communication interface of the SL1400 is set to
Network (see page 15-23).
Click the Link icon on the Web server window. You can view the Web page for the
SL1400.
2
3
Web Server Window
4
5
6
7
8
Web Page Display
If the language of the SL1400 is set to English, the English Web page is displayed; if the
message language is set to Japanese, the Japanese Web page is displayed; if the
message language is set to Chinese, the Chinese Web page is displayed. For the setup
procedure for the language, see section 16.1.
9
10
11
Note
To use the link function, the PC must be connected to the Internet.
12
13
14
15
Ethernet Interface (Option)
16
17
18
App
Index
IM 701240-01E
15-43
15.8 Setting the Time Difference from GMT
(Greenwich Mean Time)/SNTP
Procedure
1.
2.
3.
4.
Press MENU.
Press the Next 1/2 soft key.
Press the Network soft key.
Press the Others soft key. The Others setup menu appears.
Setting the Time Difference from GMT
5.
Use jog shuttle+SELECT to set the Time Hour of Time Difference From GMT in
the range of –12 to 13.
Likewise, set the Minute of Time Difference From GMT in the range of 0 to 59.
6.
Note
Minute can be specified only if Time Hour is set in the range of –11 to 12. (Minute cannot be
specified if Time Hour is set to –12 or 13.)
Setting the SNTP (Simple Network Time Protocol)
7.
8.
9.
10.
11.
15-44
Use jog shuttle+SELECT to set the Exec at Power On to ON or OFF.
Use jog shuttle+SELECT to select SNTP Server.
Enter the IP address of the SNTP server according to the procedure given in
section 4.2.
Use jog shuttle+SELECT to select Time Out.
Enter the time out time in the range from 1-60 according to the procedure given
in section 4.2.
IM 701240-01E
15.8 Setting the Time Difference from GMT (Greenwich Mean Time)/SNTP
1
Explanation
Set the time difference from GMT (Greenwich Mean Time). Make sure to set this value if
you are using the Web server function.
Setting the Time Difference from GMT (Greenwich Mean Time)
Set the time difference in the range of –12 hour 00 minute to 13 hour 00 minute.
For example, Japan standard time is ahead of GMT by 9 hours. In this case, set Time
Hour to 9 and Minute to 00.
2
3
4
Checking the Standard Time
Check the standard time for the region where the SL1400 is to be used using one of the
following methods.
• Check the date and time settings on your PC.
• Check the site at the following
URL:http://www.worldtimeserver.com/
5
6
7
Note
The SL1400 does not support daylight savings time. To set the daylight savings time, adjust
the time difference from GMT.
Setting the SNTP
When turning ON the power to the instrument, the instrument’s time is synchronized with
that of the SNTP server connected to the network.
8
9
10
Note
•
•
•
If a time difference from world standard time (Greenwich Mean Time) is specified, the time
obtained from the SNTP server is adjusted accordingly, and that time is used.
When setting the date and time on the instrument, you can synchronize the time with the
SNTP server. For details, see section 3.6.
When not synchronizing the time with the SNTP server, do not enter the SNTP server’s IP
address.
11
12
13
14
15
Ethernet Interface (Option)
16
17
18
App
Index
IM 701240-01E
15-45
15.9 Checking the Presence of the Ethernet
Interface and the MAC Address
Procedure
1.
2.
3.
4.
5.
Press MENU.
Press Next 1/2 soft key.
Press the System Config soft key.
Press the Overview soft key. The overview screen appears.
When Ether:Yes appears for the Option item in the overview screen, this
indicates that the Ethernet interface is installed.
The number indicated to the right is the MAC address.
The MAC number is intentionally blurred in the example below.
Note
•
•
Ether: Yes is displayed only if the Ethernet interface option is installed.
If XXXXXX_XXX_XXX is displayed for the MAC address, contact your nearest
YOKOGAWA dealer.
Explanation
You can check the presence of the Ethernet interface and the MAC address.
MAC address is a unique address that is pre-assigned to the SL1400.
The Presence of the Ethernet Interface
The presence of the Ethernet interface is displayed under “Ether” on the overview
screen.
• Ether:Yes: The Ethernet interface is installed.
• Ether:No:
The Ethernet interface is not installed.
MAC Address
MAC address is a unique address that is pre-assigned to the SL1400. It is necessary for
transmitting data between nodes.
15-46
IM 701240-01E
15.10 Setting the FTP Passive Mode and LPR/SMTP
Timeout
1
2
Procedure
1.
2.
3.
4.
Press MENU.
Press Next 1/2 soft key.
Press the Network soft key.
Press the Others soft key. The Others setup menu appears.
3
4
Selecting the FTP Passive Mode
5.
5
Use jog shuttle+SELECT to set FTP Passive to ON or OFF.
6
Setting the LPR Timeout Time
5.
Use jog shuttle+SELECT to set LPR Time Out.
7
Setting the SMTP Timeout Time
5.
Use jog shuttle+SELECT to set SMTP Time Out.
8
9
10
11
12
Explanation
Special settings related to the FTP client, LPR, and SMTP are entered. Normally, these
parameters do not need to be specified.
14
Turning ON/OFF FTP Passive Mode
15
Ethernet Interface (Option)
Turn this function ON when using the SL1400 behind a firewall that requires the passive
mode. The default setting is OFF. (A firewall is furnished on a system that has security
features. It prevents intrusion from the outside into the network system.)
16
Setting the LPR Time Out
The SL1400 closes the connection to the printer if there is no response from the printer
for a certain period of time (timeout time) when it accesses the printer. You can set the
timeout value in the range of 0 to 3600 s. The default setting is 15 s.
17
18
Setting the SMTP Time Out
When a mail server is accessed from the SL1400 and connection cannot be established
after a certain period of time (timeout time), the SL1400 decides that the connection to
the mail server is not possible and closes the connection. You can set the timeout value
in the range of 0 to 3600 s. The default setting is 15 s.
IM 701240-01E
13
15-47
App
Index
15.11 Using the Instrument as a Windows Network
Drive
Procedure
Setting the SL1400
Follow the procedures in section 15.2 and section 15.6 to enter TCP/IP and user account
settings, then connect to the network.
Setting the PC
1.
2.
Open Entire Network Places.
Choose Map Network Drive under Tools on the menu bar. The Map Network
Drive dialog box appears.
3.
4.
Select the drive to assign in the drive selection area.
Enter the instrument’s IP address in the folder input area using the format,
http://instrument's IP address/dav/.
Click Finish. The enter user name and password input dialog box appears.
Enter the user name and password specified under user account (see section
15.6.
Click OK. The instrument is registered as a network drive.
To cancel the registration as a network drive, select Disconnect Network Drive
under Tools on the menu bar. The disconnect network drive dialog box opens.
Select the network drive you want to disconnect, and click OK.
5.
6.
7.
8.
9.
15-48
IM 701240-01E
15.11 Using the Instrument as a Windows Network Drive
1
Explanation
The external storage medium and the internal hard disk (including the realtime drive) on
the SL1400 can be used as a network drive on a PC running Windows XP.
2
Network Drive
3
When the SL1400 is registered as a network drive, the files on the SL1400 drive can be
view using a software application running on a PC.
4
Note
•
•
•
•
•
•
•
•
The SL1400 can be mapped as a network drive only on Windows XP.
When manipulating files using the network drive function, do not perform other network
functions such as the FTP client/server function or Web server function. If you do, the
SL1400 or the PC may become unstable.
Do not change the contents of the SL1400 drive (including the contents of the drives
connected via the SCSI) from the PC. Reading the contents of the drive is allowed.
Never perform the following operations.
• Delete files on the SL1400 drive from the PC.
• Add files on the SL1400 drive from the PC.
• Change the directory structure of the SL1400 drive from the PC.
If you attempt to move a large file from the PC to the SL1400, the file may be lost due to
the limitations of Windows.
You cannot manipulate the files simultaneously from multiple PCs.
You cannot view a directory containing 1000 or more files.
You cannot use the WebDAV function simultaneously with the Web server function.
Available Characters
6
7
8
9
10
11
12
13
14
15
Ethernet Interface (Option)
This function uses the Windows WebDAV client function and the instrument’s WebDAV
server function . The characters that can be used with the WebDAV server function on
this instrument are as follows.
0 to 9
A to Z, a to z
%, (, ) , _
Therefore, please make note of the following.
• Files and folders whose names contain characters other than the ones indicated
above cannot be saved on the SL1400’s drive. Also, these files cannot be copied or
moved.
• Files in the instrument’ drive containing characters other than those listed above are
not displayed in the file list using WebDAV.
Also, these files and folders are not taken into account in the calculation of used disk
space. Therefore, the actual amount of used disk space is different from the
calculated amount of space.
5
16
File Information
If you copy files or folders from the instrument’s drive to a Windows local disk, the
creation date and time of the file or folder changes to that of the date and time copied.
Likewise if you copy files or folders from a Windows local disk to the instrument’s drive,
the creation and modified dates and times of the file or folder changes to that of the date
and time when copied.
17
18
App
Index
IM 701240-01E
15-49
Chapter 16
Other Operations
16.1 Changing the Message/Menu Language and
Turning the Click Sound ON/OFF
1
2
Procedure
1.
2.
3.
Press MENU.
Press the Next 1/2 soft key.
Press the System Config soft key.
3
4
Setting the Message Language
4.
Press the Language soft key and press the soft key corresponding to the
language you want to display.
5
Setting the Click Sound
5.
6
Press the Click Sound soft key to select ON or OFF.
7
8
9
10
11
Explanation
Message Language
12
A message appears when an error occurs or when prompting for confirmation on an
operation. You can select the message language from ENG (English), JPN (Japan),
CHN (Chinese), KOR (Korean), GER (German), ITL (Italian), FRN (French), and SPN
(Spanish). The messages codes are common in all languages. For details on the
message codes, see section 17.2.
13
14
Menu Language
• If the message language is set to ENG, JPN, CHN, or KOR, the menu is displayed
in the respective language.
• If the message language is set to a language other than ENG, JPN, CHN, or KOR,
the menu is displayed in English.
15
USB Keyboard Language
17
Other Operations
The language of the USB keyboard used to enter file names and comments (see
section 4.2) varies depending on the message language setting as follows:
Message Language
18
Supported USB Keyboard Language
Language other than JPN (Japanese)
English
JPN (Japanese)
Japanese
App
Turning ON/OFF the Click Sound
Index
You can enable or disable the click sound that is generated when you turn the jog
shuttle. The default setting is ON.
IM 701240-01E
16
16-1
16.2 Switching the Screen Display Font Size
Procedure
1.
2.
3.
4.
Press MENU.
Press Next 1/2 soft key.
Press the System Config soft key.
Press the Scale Font soft key to select Small or Large.
If Large is selected, the waveform labels displayed at the upper left of the
waveform display area, the scale values of the vertical axis, and the trace labels
(waveform labels) are shown using a large font.
The font size in the area enclosed by
changes.
When Scale Font is set to Small
Waveform label
Scale values of the vertical axis
Scale values of the
vertical axis
Trace Label
(Waveform label)
When Scale Font is set to Large
Waveform label
Scale values of the vertical axis
Scale values of the
vertical axis
Trace Label
(Waveform label)
Explanation
The screen display font size can be set to small or large. The default setting is Large.
The font size changes for the waveform labels displayed at the upper left of the
waveform display area, the scale values of the vertical axis, and the trace labels
(waveform labels). If Large is selected and there are numerous waveforms displayed on
the screen, the scale values of the vertical axis may overlap.
16-2
IM 701240-01E
16.3 Setting the Screen Color and Brightness
1
2
Procedure
1.
2.
3.
4.
Press MENU.
Press Next 1/2 soft key.
Press the System Config soft key.
Press the Graphic Color soft key. The Graphic setup menu appears.
3
4
Setting the Color
5.
6.
Use jog shuttle+SELECT to select the item you want to change the color. The
color selection menu appears.
Use jog shuttle+SELECT to select the color.
5
6
Note
The items that you can change the color are listed below. The selectable colors are limited
depending on the item.
• CH1 to CH16
• Math waveforms
• Logic A, Logic B
• Background
• Menu Base Color (menu screen)
8
9
Setting the Brightness
7.
8.
7
Use jog shuttle+SELECT to select the item you want to change the brightness.
Turn the jog shuttle to set the brightness in the range of 1 to 15.
Note
10
11
The items that you can change the brightness are as follows:
• Wave (waveforms)
• Menu
• Back Ground
• Snap/Zone (snapshot waveforms/zones)
• Grid
• Cursor
• Marker
12
13
14
15
16
Other Operations
17
18
App
Index
IM 701240-01E
16-3
16.4 Setting the Screen Color and Brightness
Explanation
Screen Color
You can set arbitrary colors for the following items.
The selectable colors vary depending on the item. See the color selection menu of each
item.
CH1 to CH16:
Waveform color
Math1 to Math8:
Waveform color
Logic A, Logic B:
Waveform color
Back Ground:
Background color of the waveform display area
Menu Base Color:
Menu
Brightness: Intensity
You can set the brightness for the following items from 1 to 15 steps.
Wave (waveform)
Menu
Back Ground:
Background
Snap/Zone (snapshot waveforms/zones)
Grid
Cursor
Marker
16-4
IM 701240-01E
16.4 Turning OFF the Backlight and Setting the
Brightness of the Backlight
1
2
Procedure
1.
2.
3.
4.
5.
Press MENU.
Press the Next 1/2 soft key.
Press the Others soft key.
Press the Next 1/2 soft key.
Press the LCD soft key.
3
4
5
Setting Backlight Auto Off
6.
7.
8.
Press the Auto OFF soft key to select ON or OFF.
If you set Auto OFF to ON, proceed to step 7.
Press the Auto OFF Time soft key.
Turn the jog shuttle to set the time when the backlight will automatically turn
OFF.
Setting the Backlight Brightness
9.
10.
6
7
8
Press the Brightness soft key.
Turn the jog shuttle to set the backlight brightness.
9
Turning ON/OFF the Backlight
11.
Press the LCD OFF Exec soft key. The backlight turns OFF.
Press any key to return to the measurement screen.
10
11
12
13
14
15
Explanation
16
Turning ON/OFF the Backlight (LCD OFF Exec)
17
Setting the Backlight Auto OFF (Auto OFF, Auto OFF Time)
The backlight automatically turns OFF, if there is no key operation for the specified time.
Setting the Backlight Brightness
You can change the brightness of the backlight. Set the brightness in the range of 0
(darkest) to 7 (brightest).
The lifetime of the backlight can be prolonged by dimming the backlight or turning OFF
the backlight when it is not necessary.
IM 701240-01E
Other Operations
Turns ON/OFF the LCD backlight. If a key is pressed when the backlight is OFF, the
screen returns to the measurement screen.
16-5
18
App
Index
16.5 Locking the Keys
Procedure
Locking the Keys
Press PROTECT. The LED above the key illuminates, and the keys are locked.
Releasing the Lock
To release the lock, press PROTECT again.
Explanation
This function locks the operation keys so that the current SL1400 condition is not
changed accidentally. When keys are locked, all keys other than the PROTECT key
cannot be used.
Note
When keys are locked, operations using the USB mouse and USB keyboard are also
disabled.
16-6
IM 701240-01E
Chapter 17
Troubleshooting, Maintenance, and Inspection
1
17.1 Troubleshooting
2
Troubleshooting
• If a message is displayed on the screen, read the next section.
• If servicing is necessary, or if the instrument is not operating correctly after performing
the corrective actions, contact your nearest YOKOGAWA dealer.
Problem
Probable Cause
Corrective Action
Reference
Section
The power cannot be
turned ON.
Using a power supply outside the
ratings.
Use a correct power supply.
3.4
The backlight is turned OFF.
Press any key.
16.4
The screen colors are not
appropriate.
Power cycle the SL1400 while
holding down the RESET key.
16.3
The display is odd.
The system is abnormal.
Power-cycle the SL1400.
3.4
Keys do not work.
The SL1400 is in the remote mode.
Press SHIFT + CLEAR TRACE enable
local mode.
–
Other causes.
Perform a key test.
If the test fails, servicing is required.
17.3
Protected.
Nothing is displayed.
16.5
Set the trigger conditions correctly.
Chapter 6
Measured values are
not correct.
Insufficient warm-up.
Warm up the SL1400 for 30 minutes
after turning on the power.
–
Not calibrated.
Perform a calibration.
4.6
The probe’s phase has not been
corrected.
Correct the phase properly.
3.8
The probe attenuation is not correct. Set an appropriate value.
5.6
An offset voltage is added.
Set the offset voltage to 0 V.
5.10
Other causes.
Perform a calibration. In addition,
select Test Item: Carib.Inf. for the self
test item and execute the self test.
If the measured value is still odd,
servicing is required.
4.6
17.3
The printer head is damaged or
worn out.
Servicing required.
–
Cannot save to the
specified medium.
The medium is not formatted.
Format the medium.
13.6
The medium is write-protected.
Release the medium’s write-protect.
–
Cannot change settings
or control the operation
of the SL1400 via the
communication interface.
The address of the SL1400
used by the program is different
from the specified address.
The interface is not used in a way
that conforms to the electrical or
mechanical specifications.
5
6
7
8
9
10
11
12
13
Cannot output to built-in
printer.
No more free space on the medium. Delete unneeded files or use a new
medium.
4
Troubleshooting, Maintenance, and Inspection
Press the PROTECT key.
Trigger does not activate. The trigger settings are not
appropriate.
3
14
15
13.16
Match the address used in the program Communication
to the address of the SL1400.
Interface User’s
Manual on the
CD-ROM
Use it in a way that conforms to the
specifications.
16
17
18
App
Index
IM 701240-01E
17-1
17.2 Messages and Corrective Actions
Error Messages
A message may appear on the screen during operation. This section describes the
meanings of the messages and their corrective actions. The messages can be displayed
either in English or Japanese (see section 16.1). If the corrective action requires
servicing, contact your nearest YOKOGAWA dealer for repairs.
In addition to the error messages below, there are communication error messages.
These messages are described in the Communication Interface User’s Manual on the
CD-ROM.
Status Messages
Code
Message and Corrective Action
Section
51
File access is aborted.
Chapter 13
55
Image printing was aborted.
Chapter 12
57
Write to the EEPROM complete. Wrote module-specific information to the module.
–
58
Calibrating the temperature module.
–
59
Temperature module calibration complete.
–
60
The instrument is set to remote mode by the communication control.
Press the CLEAR TRACE key to change to local mode.
–
62
Terminating...
–
63
Turned on pressing the RESET key. Will initialize.
4.4
64
A strain module is installed. Carry out automatic balancing before use.
–
65
The setting of the excitation voltage or the gauge factor was changed.
Carry out automatic balancing before use.
–
66
Automatic balancing is running...
–
67
Automatic balancing is complete.
–
68
Test: SUCCESS
–
69
Calibration is running...
4.6
70
Calibration is complete.
4.6
71
Completed action-on-trigger.
6.18
73
Release the Preview mode.
12.1
82
Aborted the statistical measurement.
–
84
Averaging is in progress.
11.1
85
Averaging has been completed.
11.1
86
Input module configuration was changed. Relevant settings have been initialized.
–
87
Parameter block has been set. Restart to update the instrument configuration information.
–
88
There is no dry cell. Insert batteries or turn the backup switch OFF.
7.7
89
All operation was aborted due to a power disruption. The data before the disruption is
stored. No data was acquired during the disruption.
7.7
90
When history is set to “All,” data of math channels is not saved. To store the data of math channels,
set history to “One.”
* Data of channels other than math is saved.
11.1
92
This model does not have the HDD option installed.
–
93
Realtime recording is being prepared.
7.5
94
Media information is being read.
13.6
95
Failed to retrieve the data. Execute again.
Chapter 11
279
This command cannot be used in the current mode.
Chapter 9
17-2
IM 701240-01E
17.2 Messages and Corrective Actions
1
Errors in Execution (700 to 799)
2
Code
Message and Corrective Action
Section
701
Fine copy is not possible when waveform acquisition is in progress. Press the START/STOP
key to stop the waveform acquisition first.
7.1, 12.1
703
Undo is not possible since data that existed immediately before initialization and auto setup
is not available.
4.4, 4.5
704
Can not be executed while running. Press START/STOP key to stop acquisition.
7.1
707
Can not Start while data out. Wait until output is completed.
7.1
708
Can not data out while running. Press START/STOP key to stop acquisition.
7.1
710
File not found. Check the file.
Chapter 13
711
Cannot manipulate files while image printing is in progress. Wait until image printing is complete.
Chapter 13
712
Can not compress this hardcopy image. Turn off compression switch.
13.12
713
Calibration failure. Disconnect the input and execute again. If it fails again, servicing is necessary.
4.6
714
Temperature module calibration failed. Calibration value is invalid. Check the input signal.
4.6
716
Realtime recording to the internal hard disk is valid when the sampling rate is slower than the
values shown below.
1~2 CH : 100kS/s, 3CH : 50kS/s,
4~5CH : 20kS/s, 6~11CH : 10kS/s,
12~18CH : 5kS/s
7.5
717
Too many channels to realtime record at the current record time.
Decrease the number of channels by turning them OFF.
7.5
718
Too many channels to realtime record at the current record length.
Turn OFF channels to reduce the number of channels or shorten the record length.
–
721
Can not operate while data out. Wait until output is completed.
7.5
723
Cannot load the realtime record.
7.5,13.15
724
Balancing failed.
Failed CH: *
* indicates the channel number of the channel for which automatic balancing failed.
–
725
Cannot be executed. Acquisition not active.
7.1
727
Insufficient output data. Increase Mag or widen the Time Range interval.
12.1
728
Image is being printed. Abort or wait until printing is complete.
–
732
Cannot be executed while computation is in progress.
Chapter 10
733
Failed to measure statistics. Waveform data may be missing. If Cycle Statistics is specified, the
instrument may be configured in a way that fails to detect the cycle.
11.6
735
Executing file Load, Save, or Format. Abort or wait until it is complete.
–
736
Image is being printed or saved. Abort the operation or wait until the execution of the
command is complete.
–
737
A setup of an action trigger can’t be carried out under the state of on.
6.18
739
Cannot be executed when realtime record or print setting is ON.
7.5
740
A time base can’t be carried out under the state of the outside clock.
5.20
742
Because there are too many channels, it can’t start in the length of the present record.
5.2,
Appendix 1
743
The indication mode of the history can’t be carried out except for “Average”.
11.1
744
Average practice can’t be done because the record length of the history exceeds the record
length that it can be carried out.
11.1
745
Set the trigger mode to Auto or Log for realtime hard disk recording. If the number of actions
is set to Continuous, the only valid trigger mode is Log.
6.1, 7.5
748
Cannot start at the current record length.
Shorten the record length or meet the following condition.
• Set the trigger mode to Auto and increase the record time to longer than 1 s to enable roll mode.
• Set the trigger mode to Single or Log.
5.2, 6.1
749
Averaging mode is not possible when the trigger mode is Single, SingleN, or Log.
Change the trigger mode.
6.1
3
4
5
6
7
8
9
10
Troubleshooting, Maintenance, and Inspection
11
12
13
14
15
16
17
18
App
Index
IM 701240-01E
17-3
17.2 Messages and Corrective Actions
Code
Message and Corrective Action
Section
753
Cannot start when the HISTORY menu is being displayed.
Press the ESC key to clear the menu before starting.
11.2
755
Time base cannot be set to external clock when set to envelope or box average.
5.20, 7.2
756
Cannot set accumulate during roll mode display. Turn Off accumulate.
5.2, 8.4
757
Cannot be executed when the acquisition mode is set to average. Change the mode.
7.2
758
Cannot copy if 50 pages is exceeded. Change the multiplier or range.
12.1
759
Realtime recording to the internal hard disk is valid when the record length is longer than 501 k.
5.2, 7.5
760
Cannot set the current drive on a realtime partition using communication commands.
7.5
761
Cannot be executed on realtime recorded waveforms.
7.5
764
File recorded in realtime is currently being analyzed. Files being analyzed cannot be deleted.
7.5, 13.16
765
File recorded in realtime is currently being analyzed.
The name of files being analyzed cannot be changed.
7.5, 13.18
766
File recorded in realtime is currently being analyzed.
Partitions containing files that are being analyzed cannot be formatted.
7.5, 13.6
767
128 and more file can’t be formed in the real-time area.
7.5
768
The file which failed in the real-time record can’t be read.
–
769
Cannot start Single(N) when accumulate is On. Change the accumulate to Off.
6.1, 8.4
773
The measuring range is up to 10 MWords from measure start (TimeRange1).
11.5
774
Synchronizing signal not detected.
6.17
775
Set acquisition mode to Normal when using a wave window trigger.
6.17
776
The wave window trigger cannot be used if the sampling rate is faster than 500 kS/s or slower
than 10 kS/s. If the record length is shorter than 25 k, set the record time longer than 100 ms.
6.17
777
Range over. Change to an appropriate range then retry shunt calibration.
5.15
778
Statistical processing cannot be performed on waveforms recorded in real time.
11.6
779
Cannot detect a effective input signal at a Sync. channel.
6.17
780
Firmware was not overwritten in the following slots, since the version of the firmware in the module
and that of the replacement firmware were the same. Check the versions on the overview screen.
SLOT: XX
–
781
Cannot start while the following setup menus are displayed. Press the ESC key to clear
the menu, and then start.
(ALL CH, ZOOM, MEASURE, CURSOR, and PrintSetup)
–
782
Firmware was not overwritten, since the version of the firmware in the printer and that
of the replacement firmware were the same.
17.4
783
Checksum error in the printer control program.
Recycle the power. If the error occurs again, maintenance service is required.
3.4
784
Failed to transmit the printer control program.
Recycle the power. If the error occurs again, maintenance service is required.
3.4
785
Failed to write the printer control program.
Recycle the power. If the error occurs again, maintenance service is required.
3.4
787
Cannot be carried out during recording.
Press the START/STOP key to stop the waveform acquisition first.
7.1
788
Cannot start while the alert dialog box is open.
Press the ESC key to clear the dialog box, and then start.
–
789
Cannot copy if 100 pages is exceeded.
Change the multiplier or range.
9.7, 12.1
790
Fine Print or Zoom Print is not possible when X-Y display is present.
8.6, 12.1
791
Up to 30 items can be registered.
4.2
792
Not entered in “Yomi” or “Goku.”
4.2
793
Cannot specify characters other than “Hiragana” for “Yomi.”
4.2
794
Kanji registration error. Below are the possible causes.
• More than 17 items are registered with the same “Yomi.”
• Exceeded the dictionary registration capacity.
4.2
17-4
IM 701240-01E
17.2 Messages and Corrective Actions
1
Errors in Setting (800 to 899)
2
Code
Message and Corrective Action
Section
800
Illegal date-time. Set the correct date and time.
3.6
801
Illegal file name. The file name contains characters which are not allowed or the file name is not
a valid MS-DOS file name. Enter another file name.
Chapter 13
803
Turn off accumulate mode to enter history menu. It is not possible to activate the history menu
by pressing the HISTORY key during accumulation.
8.4
804
Cannot change this parameter while running. Press the START/STOP key to stop acquisition.
7.1
808
Can not be specified at the current record time setting.
5.2,
Appendix 1
809
Cannot change edge for status other than X.
Set the state of the channel corresponding to condition A to ‘X’.
Chapter 6
811
Cannot change display points in roll mode.
5.2
813
Set Items in measure menu. Set appropriate measurement items.
11.5
814
Duplicated Name. Change the label string.
8.10
816
Cannot turn off with the current record length. Please Change record length.
5.2
817
Cannot change. Please change X Trace in the X-Y menu.
8.6
819
Cannot change when Channel Display is OFF or Math settings are invalid.
Set the channel display ON or make appropriate Math settings.
5.1,
Chapter 10
821
Cannot change when External Clock is active.
5.20
823
Cannot change while running. Set the acquisition mode to Normal.
7.1, 7.2
824
Cannot change with the current acq mode.
7.2
829
Cannot change when Logic Mode is OFF or all bits of Logic Display are OFF.
5.18
834
Duplicate SCSI ID. Set different ID numbers.
13.7
835
Cannot change settings while realtime printing or realtime recording.
Stop printing or recording.
7.5
836
Cannot change settings during Action On Trigger. Stop the Action On Trigger.
6.18
837
Cannot set the channels which do not have modules installed.
–
838
Cannot set the channels which do not have the strain module installed.
–
839
Cannot Set or Execute.
–
840
If the trigger mode is set to Single, Single (N), or LOG, the acquisition mode cannot be set to
Average.
6.1, 7.2
843
If the acquisition mode is Average, the trigger mode cannot be set to Single, Single (N), or Log.
6.1, 7.2
844
It can’t be set at the time of the roll mode.
5.2
845
The trigger mode cannot be set to Single(N) during the roll mode.
5.2, 6.1
850
The acquisition mode cannot be set in the current record length.
5.2,
Appendix 1
851
Computation cannot be carried out at the current record length.
5.2, 10.3
855
Cannot be configured or executed during the history search operation.
11.2, 11.3
856
The record cannot be selected.
11.1 to 11.3
857
History record does not exist.
11.1 to 11.3
858
Cannot be configured or executed while computation is in progress.
Aborted when history display mode is set to One.
11.1 to 11.3
859
It can’t be set up or be carried out in the Preview mode.
Choose Quit, and cancel the Preview mode.
12.1
860
Cannot be configured or executed while updating the history all display.
Aborted when history display mode is set to One.
11.1 to 11.3
861
This format cannot output with color.
12.2, 12.3
868
Processing statistics.
To perform other operations, abort the statistical processing.
11.6
869
The channel which couldn’t be set up was specified.
Chapter 11,
13.8
870
Cannot be set when the acquisition mode is set to average.
7.2
872
Cannot be set during realtime recording.
7.5
4
5
6
7
8
9
10
Troubleshooting, Maintenance, and Inspection
IM 701240-01E
3
11
12
13
14
15
16
17
18
App
17-5
Index
17.2 Messages and Corrective Actions
Code
Message and Corrective Action
Section
873
It is an unacceptable parameter to set up to the present module.
Chapter 5
875
Cannot be set to a range of 200 sec to 30 day during roll display.
–
876
Because a record length is too long, it can’t be set up by the present number of indication channels.
5.2,
Appendix 1
877
Cannot be set because there are too many display channels at the current record length.
Shorten the record length.
5.2
878
Zooming is not available when the number of displayed points of the FFT waveform is less
than 50 in the Zoom window.
10.3
880
Cannot change this setting during realtime recording.
7.5
881
The time base cannot be set to external clock when the acquisition mode is set to envelope
or box average.
7.2, 5.20
882
Spaces are not allowed for trace labels.
8.10
883
Cannot set accumulate during roll mode display.
5.2, 8.4
884
Cannot change the History parameter when accumulate is ON. Turn OFF accumulate first.
8.4
885
P-P compression cannot be used to save when a record length is 1 K.
13.8
887
A sampling speed was too fast, and it could be folded, and a real-time queue was needed.
Slow down a sampling speed.
7.5
888
A sampling speed was too fast, and it could be folded, and a real-time buffer was needed.
Slow down a sampling speed.
7.5
889
Cannot set On this module.
6.17
890
Settings can not be entered for channels on which no strain module is mounted.
–
891
Cannot be changed when Variable is turned ON.
–
895
Cannot be set when the trace is set to a frequency module.
–
System Operation Errors (900 to 999)
Code
Message and Corrective Action
Section
901
Failed to backup setup data. Will initialize. Backup battery may be low.
7.7
902
System RAM failure. Maintenance service is required.
–
903
System ROM failure. Maintenance service is required.
–
906
Fan stopped. Power off immediately. Maintenance service is required.
–
907
Backup battery is flat. Maintenance service is required to replace the back-up battery.
3.4
908
Internal temperature is too high. Power off immediately. Maintenance service is required.
3.4
909
Illegal SUM value. Maintenance service is required.
–
910
RAM read/write error. Maintenance service is required.
–
911
Memory bus error. Maintenance service is required.
–
912
Communication driver error.
–
914
Time out occurs in Communication.
–
915
EEPROM read error. EEPROM may be damaged. Maintenance service is required.
–
916
EEPROM write error. EEPROM may be damaged. Maintenance service is required.
–
917
No module installed. Install the module.
3.3
918
Turn ON the internal hard disk motor.
13.3
919
The current module installation condition and the setup data are inconsistent.
Will initialize.
–
922
Cannot back up the acquisition memory. Memory will be initialized.
The battery for acquisition memory backup may be flat.
7.7
928
Battery for waveform memory is flat.
Waveform memory was initialized.
7.7
929
MS bus error occurred.
–
930
Slot 1 EEPROM error.
–
931
Slot 2 EEPROM error.
–
17-6
IM 701240-01E
17.2 Messages and Corrective Actions
Code
Message and Corrective Action
Section
932
Slot 3 EEPROM error.
–
933
Slot 4 EEPROM error.
–
934
Slot 5 EEPROM error.
–
935
Slot 6 EEPROM error.
–
936
Slot 7 EEPROM error.
–
937
Slot 8 EEPROM error.
–
938
Key protect is enabled. To release the protection, press the PROTECT key.
16.5
940
The USB device’s power consumption exceeded the capacity of the USB hub.
18.8
1
2
3
4
5
File Operation Errors (1000 to 1199)
6
Message and Corrective Action
Section
1001
Invalid file name.
* Duplicate file name or incorrect SCSI ID.
Chapter 13
1002
Cannot detect the medium.
* Check the presence of the medium or the SCSI device connection.
Chapter 13
1003
Cannot detect the medium.
* Check the presence of the medium or the SCSI device connection.
Chapter 13
1004
Media failure.
Check the storage medium.
Chapter 13
1005
File not found.
Check the file name and the storage medium.
Chapter 13
1006
Invalid file name.
* Duplicate file name or incorrect SCSI ID.
Chapter 13
1007
Media failure.
Check the storage medium.
Chapter 13
1008
Invalid file name.
* Duplicate file name or incorrect SCSI ID.
Chapter 13
1009
Invalid file name.
* Duplicate file name or incorrect SCSI ID.
Chapter 13
1010
Invalid file name.
* Duplicate file name or incorrect SCSI ID.
Chapter 13
1011
The maximum number of files that can be stored in a single directory was exceeded. Save the
file to another directory or medium.
Chapter 13
1012
Media full. Delete unnecessary file(s) or use another disk.
Chapter 13
1013
Cannot delete a directory if there are files in the directory.
13.16
1014
File is protected.
13.16
1015
Physical format error. Reformat the medium.
If the same error occurs, the instrument is probably unable to execute a format on this medium.
13.6
8
9
10
11
12
13
14
15
1016
File system failure.
Chapter 13
1017
File system failure. Check using another disk.
If the same message still appears, maintenance service is required.
Chapter 13
1018
File system failure. Check using another disk.
If the same message still appears, maintenance service is required.
Chapter 13
1019
File system failure. Check using another disk.
If the same message still appears, maintenance service is required.
Chapter 13
1020
File system failure. Check using another disk.
If the same message still appears, maintenance service is required.
Chapter 13
1021
File is damaged. Check the file.
Chapter 13
1022
File system failure. Check using another disk.
If the same message still appears, maintenance service is required.
Chapter 13
1023
File system failure. Check using another disk.
If the same message still appears, maintenance service is required.
Chapter 13
IM 701240-01E
7
Troubleshooting, Maintenance, and Inspection
Code
17-7
16
17
18
App
Index
17.2 Messages and Corrective Actions
Code
Message and Corrective Action
Section
1024
File system failure. Check using another disk.
If the same message still appears, maintenance service is required.
Chapter 13
1025
File system failure. Check using another disk.
If the same message still appears, maintenance service is required.
Chapter 13
1026
File system failure. Check using another disk.
If the same message still appears, maintenance service is required.
Chapter 13
1027
File system failure. Check using another disk.
If the same message still appears, maintenance service is required.
Chapter 13
1028
File system failure. Check using another disk.
If the same message still appears, maintenance service is required.
Chapter 13
1029
File system failure. Check using another disk.
If the same message still appears, maintenance service is required.
Chapter 13
1030
File system failure. Check using another disk.
If the same message still appears, maintenance service is required.
Chapter 13
1031
File system failure. Check using another disk.
If the same message still appears, maintenance service is required.
Chapter 13
1032
File system failure. Check using another disk.
If the same message still appears, maintenance service is required.
Chapter 13
1033
File system failure. Check using another disk.
If the same message still appears, maintenance service is required.
Chapter 13
1034
File system failure. Check using another disk.
If the same message still appears, maintenance service is required.
Chapter 13
1035
File system failure. Check using another disk.
If the same message still appears, maintenance service is required.
Chapter 13
1036
File system failure. Check using another disk.
If the same message still appears, maintenance service is required.
Chapter 13
1037
File system failure. Check using another disk.
If the same message still appears, maintenance service is required.
Chapter 13
1038
File system failure. Check using another disk.
If the same message still appears, maintenance service is required.
Chapter 13
1039
File system failure. Check using another disk.
If the same message still appears, maintenance service is required.
Chapter 13
1040
File system failure. Check using another disk.
If the same message still appears, maintenance service is required.
Chapter 13
1041
File system failure. Check using another disk.
If the same message still appears, maintenance service is required.
Chapter 13
1042
No media exists in SCSI device.
Check that the storage medium is correctly inserted in the SCSI device.
13.5
1046
Media failure. Check the medium.
Chapter 13
1047
Media failure. Check the medium.
Chapter 13
1048
Media failure. Check the medium.
Chapter 13
1049
Media failure. Check the medium.
Chapter 13
1050
Media failure. Check the medium.
Chapter 13
1051
Media failure. Check the medium.
Chapter 13
1052
Media failure. Check the medium.
Chapter 13
1053
Media failure. Check the medium.
Chapter 13
1055
Turn the HDD motor ON.
13.3
1100
Invalid record number.
Chapter 13
1101
File system failure.
Chapter 13
1102
File system failure.
Chapter 13
1103
File system failure.
Chapter 13
1104
File system failure.
Chapter 13
1105
File system failure.
Chapter 13
17-8
IM 701240-01E
17.2 Messages and Corrective Actions
Code
Message and Corrective Action
Section
1106
File system failure.
Chapter 13
1107
File system failure.
Chapter 13
1108
File system failure.
Chapter 13
1109
Invalid media format.
Chapter 13
1110
Cannot load this file format. Files stored on other models (DL/AG series) cannot be loaded.
Chapter 13
1111
File is now being accessed. Execute after access is made.
Chapter 13
1112
Cannot be executed while running. Press the START/STOP key to stop acquisition.
7.1
1113
Cannot find ‘.HDR’ file. Check the file.
13.8
1114
The specified file cannot be loaded on this ROM version or this model.
Chapter 13
1115
No ch is displayed. Turn ON the display of the appropriate channel.
5.1
1116
Save data not found. Check for presence of data.
Chapter 13
1118
SCSI controller failure. Maintenance service is required.
–
1119
HDD overrun error.
Due to spare sectors, the recording could not be finished within assigned time. The operation
is aborted.
–
1
2
3
4
5
6
7
1120
HDD error. An error occurred in the HDD. The operation is aborted.
–
1121
Unknown file format. Check the file.
Chapter 13
1124
Data that have been P-P compressed and saved cannot be loaded.
13.8
1126
Cannot save in this format at the current record length. Specify a range and save a section of the data.13.8
* Cannot create a file of size 2 GB or larger.
1127
Cannot load because the medium is selected. Select a setup file (SET).
13.9
1128
Cannot load because a directory is selected. Select a setup file (SET).
13.9
1129
Cannot load because the medium is selected. Select a binary file (.WVF).
13.8
1130
Cannot load because a directory is selected. Select a binary file (.WVF).
13.8
1131
Cannot load files larger than 50 MB on a network drive.
Copy the file to the local drive before loading it.
2.8, 13.17,
15.3
1132
Cannot load a HistoryAll binary file on a network drive.
13.8
1133
Turn the HDD motor ON.
13.3
1134
If the realtime recorded file is converted to binary format, the converted file cannot be loaded.
13.15
1135
Cannot save the waveform by specifying Z1 (Z2) for the range to be saved, if the zoom rate is
set to x1.
Save the waveform by specifying Main for the range to be saved.
13.8
1137
Cannot make a directory or a file in the real-time area of the internal hard disk.
Change the current directory.
7.5, 13.15,
13.17
1138
Cannot save at the current PDF setting.
Change the settings.
* A file of size exceeding 2 GB cannot be created.
9.8, 13.14
1139
Cannot create PDF files on the network drive when the history waveform display format is set to All.
Create the file on the local drive, and then copy it to the network drive.
–
1140
Cannot save files with Japanese file names to the network drive.
4.2
1141
Cannot copy files with Japanese file names to the network drive.
4.2
1142
Cannot create a PDF file with a Japanese file name if the Japanese font is OFF.
9.8, 13.14
1143
The setup data is not saved.
13.1
8
9
10
Troubleshooting, Maintenance, and Inspection
11
12
13
14
15
16
17
18
App
Index
IM 701240-01E
17-9
17.2 Messages and Corrective Actions
Printer Errors (1200 to 1299)
Code
Message and Corrective Action
Section
1200
Move the release arm to the “HOLD” position.
3.5
1201
Paper empty. Load a roll chart.
3.5
1202
The printer head temperature is high. Printing will be aborted.
Printing will not be possible until the printer head temperature comes down.
–
1203
Printer over heat. Power off immediately. Maintenance service is required.
–
1204
Printer power supply error. Maintenance service is required.
–
1205
Printer time out. Maintenance service is required.
–
1206
USB printer error. Turn the power of the printer from OFF to ON.
12.2
1207
USB printer off-line.
12.2
1208
No paper.
12.2
1209
USB printer is in use.
12.2
1210
Cannot detect printer. Turn ON the printer. Check connectors.
12.2
1211
Printer is out of order. Maintenance service is required.
12.3
1212
Printer error. Turn the power of the printer from OFF to ON.
12.3
1213
Printer offline.
12.3
1214
Out of paper.
12.3
1215
Printer is in use.
12.3
1216
Cannot detect printer. Turn ON the printer. Check connectors.
12.3
1217
No applicable files for showing thumbnails.
13.13
1218
Print head temperature detection thermister is broken.
–
1219
Print head temperature detection thermister is shorted.
–
Network Errors (1300 to 1399)
Code
Message and Corrective Action
Section
1300
Cannot connect with ftp server.
Confirm the network settings and connection.
Chapter 15
1301
Has not connect with ftp server yet.
Confirm the network settings and connection.
Chapter 15
1302
This ftp function in not supported.
Chapter 15
1303
FTP Error: Pwd
Confirm the network settings and connection.
Chapter 15
1304
FTP Error: Cwd
Confirm the network settings and connection.
Chapter 15
1305
FTP Error: Rm
Confirm the network settings and connection.
Chapter 15
1306
FTP Error: List
Confirm the network settings and connection.
Chapter 15
1307
FTP Error: Mkdir
Confirm the network settings and connection.
Chapter 15
1308
FTP Error: Rmdir
Confirm the network settings and connection.
Chapter 15
1309
FTP Error: Get
Confirm the network settings and connection.
Chapter 15
1310
FTP Error: Put
Confirm the network settings and connection.
Chapter 15
1311
FTP Error: GetData
Confirm the network settings and connection.
Chapter 15
1312
FTP Error: PutData
Confirm the network settings, connection, and disk capacity.
Chapter 15
17-10
IM 701240-01E
17.2 Messages and Corrective Actions
1
Code
Message and Corrective Action
Section
1313
FTP Error: AppendData
Confirm the network settings, connection, and disk capacity.
Chapter 15
1314
FTP Error: Client Handle
Confirm the network settings and connection.
Chapter 15
1315
FTP Error: Others
Confirm the network settings and connection.
Chapter 15
1335
Cannot send data to a network printer.
Confirm the network settings and connection.
12.3, 15.4
1336
Cannot send a mail.
Confirm the network settings and connection.
15.5
1345
Test Error.
Chapter 15
1346
Test Success.
Chapter 15
1348
Failed to initialize network.
Confirm the network settings.
Chapter 15
1349
The password entered the first time is different from the password entered the second time.
Reenter the password for the second time.
15.6
1350
Failed to acquire time from SNTP server.
Confirm the network settings and connection.
15.8
1501
To apply the changes, power-cycle the SL1400.
Chapter 15
1502
Executed the firmware overwriting of the frequency module.
17.4
1503
Overwriting firmware of the frequency module...
17.4
1505
Executed the firmware overwriting of the built-in printer.
17.4
1506
Overwriting the printer firmware...
–
1600
This function can be used only when the recorder mode is Off.
Chapter 9
1601
Can be specified only when the recorder mode is Off.
Chapter 9
1602
Can be configured only when the recorder mode is Off.
Print from the Reprint menu.
Chapter 9
1603
This function cannot be used when the recorder mode is set to X-Y.
9.6
1604
Cannot be configured or executed when the recorder mode is Off.
Chapter 9
1605
Repeat trigger cannot be specified.
Repeat trigger is valid only during chart recorder mode when the print style is waveform and shot
recording is not OFF.
Chapter 9
12
1606
Cannot be changed during X-Y recording.
–
13
1607
Cannot use wave window trigger when the recorder mode is set to chart or X-Y.
6.17
1608
Can not be specified when the print style is Numeric.
9.5
1611
Cannot be specified because characters in the JIS level-2 kanji set are included.
Create the file on the local drive, and then copy it to the network drive.
4.2
1612
Can not be specified in the current mode.
–
2
3
4
5
6
7
8
9
10
Troubleshooting, Maintenance, and Inspection
11
14
15
Other Errors (9999)
16
Code
Message and Corrective Action
Section
9999
This error No. is not defined.
–
17
Note
18
If servicing is required, initialize the instrument once for confirmation.
App
Index
IM 701240-01E
17-11
17.3 Self Test
Procedure
Displaying the Self Test Menu
1.
2.
3.
4.
Press MENU.
Press the Next 1/2 soft key.
Press the Self Test soft key.
Press the Test Item soft key. The test item selection menu appears. Use jog
shuttle+SELECT to select the item to be tested.
•
•
•
•
Memory test:
Key test:
Printer test:
PC card interface, internal hard disk, and SCSI tests:
Proceed to step 5
Proceed to step 7
Proceed to step 12
Proceed to step 14.
Executing the Memory Test
5.
6.
In step 4, select Memory.
Press the Test Exec soft key to execute the memory test.
Executing the Key Test
7.
8.
9.
In step 4, select Key Board.
Press the Test Exec soft key to execute the key test.
Press all the keys or press ESC twice to end the key test.
• Testing the Soft Keys
10.
11.
Press the Soft Key soft key. A software keyboard appears.
Use jog shuttle+SELECT to check that all the characters on the keyboard can
be entered correctly.
Memory test
Key test
Note
“FREQ VerUp” and “PRINTRE VerUp” that are displayed with the Test Item soft key are used
when updating the frequency module firmware and the built-in printer firmware. For details on
updating the firmware, see the following Web page.
http://www.yokogawa.com/tm/SL1400/
17-12
IM 701240-01E
17.3 Self-Diagnostic Test (Self Test)
1
Executing the Printer Test
12.
13.
In step 4, select Printer.
Press the Test Exec soft key to execute the printer test.
2
3
Executing the PC Card Interface, Internal Hard Disk, and SCSI Tests
14.
15.
16.
17.
In step 4, select PC CARD, HDD, or SCSI.
Press the Test Type soft key.
Turn the jog shuttle to set the test type to #1.
Press the Test Exec soft key to execute the test selected in step 14.
4
5
Note
•
•
•
To execute the PC card interface tests, install the PC card beforehand.
Note the following points when performing a SCSI test.
• Connect the SCSI device.
• Only test unpartitioned SCSI devices.
• Set the SCSI ID to 1.
Test Item > Calib.Inf. is a menu for servicing (maintenance).
Printer test
PC card
drive test
Internal
HDD test
6
7
8
SCSI test
9
10
Troubleshooting, Maintenance, and Inspection
11
12
13
14
15
16
17
18
App
Index
IM 701240-01E
17-13
17.3 Self-Diagnostic Test (Self Test)
Explanation
Memory Test
Tests whether the RAM/ROM of the internal CPU board is operating correctly. If “Pass”
is displayed, it is operating correctly.
If there is an error, “Failed” is displayed.
Key Test (Key Board)
Tests whether the front panel keys are operating properly. If the name of the key being
pressed appears highlighted, the key is operating correctly. If there is an error, the name
of the key will not appear highlighted. Press the ESC key twice to quit the key test.
PC Card Interface Test
Tests whether or not the PC card interface is operating properly. If there is an error,
“Failed” is displayed after the test execution.
Internal Hard Disk Drive (Option) or SCSI Test (HDD, SCSI)
Tests whether the internal hard disk drive or SCSI is operating correctly. If there is an
error, “Failed” is displayed after the test execution.
Printer Test
Tests whether the built-in printer is operating properly. If the tint is printed correctly, the
operation is normal. If there is an error, the printing will not be correct.
If an Error Occurs during the Self Test
If an error still occurs after carrying out the following procedure, contact you nearest
YOKOGAWA dealer.
• Perform the self test several more times.
• Check whether the medium to be tested is inserted.
• Check whether the internal hard disk (option) motor is turned ON (section 13.3).
• Check whether the paper is properly set in the built-in printer. Check for paper jams
(section 3.5).
• Check whether the external SCSI device is connected properly (section 13.5).
17-14
IM 701240-01E
1
17.4 Checking the System Conditions (Overview)
2
Procedure
1.
2.
3.
3
Press MENU.
Press the System Config soft key.
Press the Overview soft key. The overview screen appears.
Press any key to clear the overview screen.
4
5
6
7
8
9
Explanation
*
11
12
13
14
The 701265 (TEMP/HPV) and the 701280 (FREQ) are equipped with a CPU and firmware
inside the modules. On the channels in which these modules are inserted, the version of the
firmware installed in the module is also displayed on the screen.
15
• 701265 (TEMP/HPV)
TEMP/HPV (model: 701265-X.XX)
X.XX:
Version of the firmware installed in the module.
It is 1.01 in the screen above.
16
17
• 701280 (FREQ)
FREQ (701280-X.XX/Y.YY)
X.XX:
Version of the firmware installed in the module.
It is 0.41 in the screen above.
Y.YY:
Version of the firmware in the SL1400 that can be installed into the 701280
(FREQ). It is 1.01 in the screen above.
18
When X.XX and Y.YY match, you do not have to upgrade the 701280 (FREQ). If they do not
match, check the upgrading procedure on the following Web page.
App
Index
http://www.yokogawa.com/tm/SL1400/
IM 701240-01E
10
Troubleshooting, Maintenance, and Inspection
The following information can be confirmed on the Overview screen.
• Model:
Model
• Record Length:
Record length
• Module(Slot):
Name of the Module in the slot
• Option:
Presence of options (Yes/No)
• Default Language:
Default language
• Soft Version:
Software version number
• USB Storage:
USB storage support (Yes: Supported, No: Not supported)
• Linkage Date:
Software version date
• Printer Rank/Version: Printer firmware version
• Product ID:
Unique number assigned to each instrument
(Required when expanding the instrument with options sold
separately.)
17-15
17.5 Recommended Replacement Parts
The three-year warranty applies only to the main unit of the instrument (starting from the
day of delivery) and does not cover any other items or expendable items (items which
wear out).
Contact your nearest YOKOGAWA dealer to have parts replaced.
Parts Name
Replacement Period
Built-in printer
Under normal usage, 1500 rolls of paper (part No.: 701966)
LCD backlight
Approx. 55000 hours under normal use
Parts Name
Warranty Period
Internal hard disk
One year after purchase (data is excluded).)
The following items are expendable items. It is recommended that the parts be replaced
according to the period indicated below. Contact your nearest YOKOGAWA dealer to
have parts replaced.
17-16
Parts Name
Recommended Replacement Period
Cooling fan
3 years
Backup battery (lithium battery)
5 years
IM 701240-01E
Chapter 18
Specifications
1
18.1 Input Section
2
Item
Specifications
Number of input channels 16 channels + 16-bit log (8 bits × 2)
Type
Plug-in input unit (two 26-pin connectors (Logic A/Logic B) for the logic input)
Number of slots
8 (2 channels per slot)
Maximum record length
2.5 MW/CH (16 analog channels + 16-bit logic),50 MW/channel max.
3
4
5
18.2 Trigger Section
6
Item
Specifications
Trigger mode
Auto, auto-level, normal, single, single(N), log, repeat (only in Chart Recorder mode)
Trigger level range
±10 divisions around 0
Trigger hysteresis
When measuring voltage:
When measuring temperature:
When measuring strain:
Can be set in 0.1% increments of the display record length.
Trigger delay range
0 to 10 s (resolution is 100 ns)
Hold off time range
0 to 10 s (resolution is 100 ns)
Manual trigger key
Dedicated manual trigger key is available
Trigger slope
Time trigger
Enhanced trigger
Trigger source
Trigger type
8
Select ±0.1 div, ±0.5 div, or ±1 div of the trigger level
Select ±0.5°C, ±1.0°C, and ±2.0°C.
Select ±2.5%, ±12.5%, or ±25% of the range
Trigger position
Simple trigger
Trigger source
7
9
10
CH1 to CH16, EXT (signal input from the TRIG IN terminal), LINE (commercial power supply signal
that is connected), Logic A, Logic B, and Time
CH1 to CH16:
Rising, falling, or rising/falling
EXT, Logic A, Logic B: Rising or falling
Date (year/month/day), time (hour/minute), time interval (1 minute to 24 hours)
CH1 to CH16, Logic A, and Logic B (AND and OR possible on each logic bit)
A->B(N):
Trigger occurs Nth time condition B becomes true after condition A becomes true.
Count:
1 to 255
Condition A:
Enter/Exit
Condition B:
Enter/Exit
A Delay B:
Trigger occurs the first time condition B becomes true after the specified delay
elapses after condition A becomes true.
Delay:
0 to 10 s (resolution is 100 ns)
Condition A:
Enter/Exit
Condition B:
Enter/Exit
11
12
13
14
15
Specifications
16
17
18
App
Index
IM 701240-01E
18-1
18.1 Input Section
Item
Specifications
Edge on A:
Trigger occurs on the OR condition of the edge while condition A is true.
Condition A:
True/False
OR:
Trigger occurs on the OR of trigger conditions that are specified on
multiple trigger sources. The OR condition can also be specified on each
logic bit.
B > Time:
Trigger occurs when time of satisfaction of (pulse width trigger) condition
B (time during which the condition is satisfied) is greater than or equal to a
specified time.
Specified time: 100 ns to 10 s (resolution is 100 ns)
B < Time:
Trigger occurs when time of satisfaction of (pulse width trigger) condition
B is less than or equal to a specified time.
Specified time: 100 ns to 10 s (resolution is 100 ns)
B Time Out:
Trigger occurs when the satisfaction of (timeout trigger) condition B
reaches a specified time.
Specified time: 100 ns to 10 s (resolution is 100 ns)
Period:
Periodic trigger. The following four types are available.
T > Time:
Trigger occurs when the period of condition T is greater than or equal to a
specified time.
Specified time: 100 ns to 10 s (resolution is 100 ns)
T < Time:
Trigger occurs when the period of condition T is less than or equal to a
specified time.
Specified time: 100 ns to 10 s (resolution is 100 ns)
T1 < T < T2:
Trigger occurs when the period of condition T is within a specified time
range.
Specified time: Time1: 100 ns to 10 s
Time2:
200 ns to 10 s (resolution is 100 ns)
T < T1, T2 < T:
Trigger occurs when the period of condition T is outside a specified time
range.
Specified time: Time1: 100 ns to 10 s
Time2: 200 ns to 10 s (resolution is 100 ns)
Window:
Trigger occurs when the trigger source enters or exits the range specified
by two points. Window OR of multiple channels is possible. Logic bits can
also be included in the edge OR condition.
Wave Window:
Trigger for monitoring the power supply. A realtime template is created by
comparing 1, 2, or 4 cycles of waveforms before the current waveform and
setting a tolerance (window width). The current waveform is compared
against this template. If the current waveform falls outside the template, a
trigger is activated.
• Conditions A and B are parallel pattern conditions that are set separately to High, Low, or “Don’t
Care” for each channel (CH1 to CH16), Logic A, and Logic B.
• OR conditions can be set to , , or Don’t Care” for CH1 to CH16, Logic A, and Logic B.
• Hold off time cannot be specified for period triggers.
18.3 Time Axis
Item
Specifications
Record time range
Can also be displayed in second, minute, hour, and day.
100 µs to 10 s(in 1-2-5 steps), 20 s, 30 s, 50 s, 1 min, 100 s, 200 s, 5 min, 10 min, 20 min, 30 min,
50 min, 1 hour, 100 min, 2 hour, 5 hour, 10 hour, 20 hour, 30 hour, 50 hour, 100 hour, 5 day, 10
day, 20 day, and 30 day
Time axis accuracy*
±(0.005%)
External clock input
Connector type:
Input level:
Valid edge:
Frequency range:
Minimum pulse width:
RCA jack
TTL level (0 to 5 V)
Rising edge
1 MHz or less
400 ns or more for high and low
* Under standard operating conditions (see section 18.11) after the warm-up
18-2
IM 701240-01E
1
18.4 Display
2
Item
Specifications
Display
10.4-inch color TFT LCD monitor
3
Effective display screen size 211.2 × 158.4 mm
Display resolution*
SVGA 800 × 600 dots
Display resolution of the
waveform display
650 × 512 (normal waveform display) or 750 × 512 (wide waveform display) selectable
Display format
Windows:
Maximum display update
rate
30 times/s when a single waveform is displayed
4
Zoom: MAIN, MAIN&Z1, MAIN&Z2, MAIN&Z1&Z2, Z1only, Z2only, and Z1&Z2
X-Y:
TY, XY, and TY&XY
5
* Liquid crystal display may include few defective pixels. (Within 5 ppm (6 points) of the total number of pixels (including RGB)
The LCD is a high technology device made up of more than 1.44 million pixels. There may be pixels that do not turn ON or
those that remain ON at all times. However, these cases are not considered malfunctions.
6
7
8
18.5 Function
9
Acquisition and Display
Item
Specifications
Acquisition mode
Normal:
Envelope:
Averaging:
Box average:
Record length
1 kW, 2.5 kW, 5 kW, 10 kW, 25 kW, 50 kW, 100 kW, 250 kW, 500 kW, 1 MW, 2.5 MW, 5 MW, 10
MW, 25 MW, and 50 MW
Zoom
Expand the displayed waveform along the time axis (up two locations using separate zoom rates)
Display format
1, 2, 3, 4, 8, or 16 analog waveform windows
10
Normal waveform acquisition
Maximum sample rate regardless of the record time, holds the peak value
Average count 2 to 65536 (2n steps)
Increase the A/D resolution up to 4 bits (16 bits max.)
Display interpolation
Display samples using dot display, sine interpolation, or linear interpolation.
Graticule
Select from three graticule types.
Auxiliary display ON/OFF
Turn ON/OFF scale values, waveform labels, extra window, and level indicator display.
X-Y display
Select the X axis and Y axis from CH1 to CH16, MATH1 to MATH8 (up to 4)
Accumulates waveforms on the display (persistence mode)
Snapshot
Retains the current displayed waveform on the screen. Snapshot waveforms can be saved and
loaded.
Clear trace
Clears the displayed waveform.
Realtime hard disk
recording
Maximum sample rate: 100 kS/s (for 1 CH) max.
Capacity:
Up to 1 GW per operation.
Action count:
Select Single or Continue.
If you select Continue, set the count in the range of 2 to 128.
Features:
Restore process not required. Saved to a format that can be loaded
directly.
12
13
14
15
Specifications
Accumulation
11
16
17
18
App
Index
IM 701240-01E
18-3
18.4 Display
Vertical and Horizontal Axes Settings
Item
Specifications
Channel ON/OFF
Independently turn ON/OFF CH1 to CH16, Logic A, and Logic B.
ALL CH menu
Set all channels while displaying waveforms. Operation using the USB keyboard and USB mouse is
possible.
Vertical axis expansion/
reduction
Expand or reduce the vertical axis for each channel.
Variable
Upper/Lower limit scaling when variable is ON.
Input filter
Set for each channel.
Vertical position setting
Waveforms can be moved vertically in the range of ±5 div from the center of the waveform display
frame.
Linear scaling
Set AX+B mode or P1-P2 mode independently for CH1 to CH16.
Roll mode
The roll mode is enabled when the trigger mode is set to auto, auto-level, single, or log, and the
record time is greater than or equal to 1 s.
Analysis
Item
Specifications
Auto scroll
Automatically scrolls the zoom position.
History search function
Search for and display waveforms from the history memory that satisfy specified conditions.
Zone search:
Set an area on the screen, then extract and display only those waveforms
that pass through the area or do not pass through the area.
Parameter search: Extract and display only the results of the automated measurement of
waveform parameters that meet the specified condition.
Cursor measurement
The following cursors are selectable.
Horizontal, Vertical, H&V, Degree (only for T-Y waveform display), and Marker
Automated measurement of waveform parameters
Capable of performing automated measurement of waveform parameters. Automated measurement
of waveform parameters within one period (P-P through Int2XY).
Up to 24 items can be displayed.
P-P, Amp, Max, Min, High, Low, Avg, Mid, Rms, Sdev, +OvrShoot, –OvrShoot, Rise, Fall, Freq,
Period, +Width, –Width, Duty, Pulse, Burst1, Burst2, AvgFreq, AvgPeriod, Int1TY, Int2TY, Int1XY,
Int2XY, and Delay (between channels)
Statistical processing
Applicable items:
Automated measured values of waveform parameters
described above.
Statistical items:
Max, Min, Avg, Sdv, and Cnt
Maximum number of cycles:
48000 cycles (when the number of parameters is 1)
Maximum total number of parameters: 48000 (total number of results)
Maximum measurement range:
10 MW
Normal statistical processing
Performs statistical processing on all acquired waveforms while acquiring waveforms.
Cyclic statistical processing
Performs statistical processing per cycle (cyclic statistical computation). Extracts a periodic
waveform (cycle) from the acquisition memory and automatically calculates waveform parameters
per cycle.
Statistical processing of history data
Performs automated measurement of waveform parameters on the waveform that is acquired using
the history memory function and performs statistical processing.
Statistical processing is performed from the oldest data.
Computation
Operators: +, –, ×, /, binary computation, phase shift, and power spectrum
Phase shift
Monitor waveforms by shifting the phase of CH1 to CH16. Computation is performed on the phaseshifted result.
* When the Ethernet interface option is installed
18-4
IM 701240-01E
18.4 Display
1
Recorder Mode
Item
Specifications
Realtime recording on
the built-in printer
T-Y waveform recording/numeric value recording: Output to the chart in realtime.
X-Y Waveform Recording:
Starts the data acquisition with START and
generates X-Y waveforms in realtime. Outputs XY waveforms to the chart with STOP.
Length of data saved to
memory while realtime
recording
T-Y waveform recording: Fixed to 2.5 MW. Automatically saves up to 1000 divisions of data
(depending on the chart speed).
X-Y waveform recording: Fixed to 1 MW.
Recording start trigger
Recording can be started using a trigger by setting the trigger mode.
Auto:
Trigger disabled. Continuous recording. Recording starts with measurement start.
Log:
Trigger disabled. Recording stops when the memory storage length of data is acquired.
When short recording is specified, recording stops when shot recording ends.
Single: Trigger enabled. Recording starts after a trigger detection.
When short recording is specified, recording stops when shot recording ends.
Repeat: Trigger enabled. Recording starts after a trigger detection.
Selectable only when shot recording is specified. Reenters trigger-wait state after short
recording.
Chart speed
(T-Y waveform recording)
20 mm/s, 10 mm/s, 5 mm/s, 2 mm/s, 1 mm/s100 mm/min, 50 mm/min, 25 mm/min, 20 mm/min,
10 mm/min, 5 mm/min, 2 mm/min, 1 mm/min, 100 mm/h, 50 mm/h, 25 mm/h, 20 mm/h, 10 mm/h
Output interval
1 s, 2 s, 5 s, 10 s, 15 s, 20 s, 30 s, 1 min, 2 min, 5 min, 10 min, 15 min, 20 min, 30 min, 60min
(Numeric value recording)
Sample rate during X-Y
waveform recording
5 kS/s, 2 kS/s, 1 kS/s, 500 S/s, 200 S/s, 100 S/s, 50 S/s, 20 S/s, 10 S/s, 5S/s
Recording format
T-Y waveform recording: 1 division recording 200 mm/zone or 160 mm/zone (flexible zone is
selectable for 1 division recording)
2 zone recording
80 mm/zone or 100 mm/zone
3 zone recording
60 mm/zone or 65 mm/zone
4 zone recording
40 mm/zone or 50 mm/zone
8 zone recording
20 mm/zone
16 zone recording
10 mm/zone
Numeric value recording: Print direction selectable from standard and 180° rotation.
X-Y waveform recording: Records up to 4 waveforms simultaneously. Assignment of X and Y
channels on the 4 waveforms is arbitrary.
3
4
5
6
7
8
9
10
11
12
Width: Selectable from 1 div and 10 mm.
Type:
Selectable from two types and OFF.
Density: Dark/Light selectable.
Recorded contents
Simultaneously prints, scale, channel label, graticule, timestamp, gauge, annotation, etc.
During T-Y waveform recording
Scale:
Prints the scale value for each channel. Select the print interval from OFF, 200,
400, and 800 mm.
Channel label: Prints channel labels near the waveforms. Select the print interval from OFF,
200, 400, and 800 mm.
Time print:
Prints the recording start time and timestamps. Select the print interval from OFF,
200, 400, and 800 mm.
Gauge:
Prints the scale value for each channel and the end of printing.
Annotation:
Select channel information, channel message, or Data to be printed.
Channel information: Prints information such as measurement range, and
filter.
Message:
Prints a preset message string.
Data:
Prints numeric measured values.
Select the print interval from OFF, 200, 400, and 800 mm.
During X-Y waveform recording
Prints the scale value.
Shot recording
Automatically stops when the specified length is recorded after the start of measurement or after the
trigger condition is met.
Shot recording length: Continuous, 20 cm, 50 cm, 1m, or 2 m
External start/stop
Prints on a low signal. Stops printing on a high signal.
Reprint function
An arbitrary section of the recorded data saved to the memory simultaneously with realtime print
can be reprinted in an arbitrary format.
Print image output
When performing reprint or fine print during T-Y waveform recording, the print image can be
converted and output to a PDF file.
18-5
13
14
15
Specifications
Grid
IM 701240-01E
2
16
17
18
App
Index
18.4 Display
Screen Image Data Output
Item
Specifications
Built-in printer
Prints a hard copy of the screen
External printer
Outputs the screen image to an external printer via the USB PERIPHERAL terminal or the Ethernet
network.*
Supports ESC-P, ESC-P2, LIPS3, PCL5, BJ commands, and PostScript (only via the Ethernet
network*)
PC card, SCSI,
Built-in HDD (option),
Network drive*
Output data format: PNG, JPEG, BMP, and PostScript
* When the Ethernet interface option is installed (to a printer server supporting TCP/IP).
Data Storage
Item
Specifications
History memory
Automatically holds up to 2000 pages of waveforms (depending on the memory length)
PC card, SCSI,
Built-in HDD (option),
Network drive*
Saves waveform data, setup data, and various data
* When the Ethernet interface option is installed.
Acquisition Memory Backup
Item
Specifications
Batteries
4 AAA alkaline dry cells (AA/R6) (JIS, IEC model: LR6)
4 nickel hydride rechargeable batteries
Backup time (reference value)
Reference value for A1070EB (LR6JE CPT alkaline battery by Toshiba) × 4 at an ambient
temperature of 23 °C
Approx. 150 hours
Backup function
Enable/Disable using the ON/OFF switch
Contents that are
backed up
Acquisition memory waveform data (history memory data)
Other Functions
Item
Specifications
Initialization
Resets settings to the factory default (excluding date/time setting, communication interface settings,
SCSI ID number setting, language setting, time difference from the GMT, and the ON/OFF setting of
the internal hard disk motor)
Auto setup
Automatically sets the voltage axis, time axis, trigger level, etc.
Action-on-trigger
Outputs screen image data, saves waveform data (binary, ASCII, or floating), activates buzzer
notification, or sends e-mail messages each time a trigger occurs.
Mail transmission function* Sends the SL1400 status periodically to a specified mail address via the Ethernet network. Also
sends information as an action of action-on-trigger.
Calibration
Auto calibration and manual calibration available
System settings
Set the screen color, date/time, menu/message language, and click sound ON/OFF
Probe compensation
signal output
Outputs a signal (rectangular signal of approx. 1 VP-P and approx. 1 kHz) from the probe
compensation output terminal on the front panel
Overview
Shows system specifications
Self-test
Memory test, key test, printer test, PC card drive test, internal HDD (optional) test, and SCSI test
Thumbnail
Shows thumbnails of the screen images
PROTECT key
Disables keys to prevent inadvertent errors in operation.
* When the Ethernet interface option is installed.
18-6
IM 701240-01E
1
18.6 Built-in printer
2
Item
Specifications
Print system
Thermal line dot system
Paper width
210 mm
Effective print width
204 mm (1632 dots)
Dot density
8 dots/mm
Feeding direction
resolution
For normal print: 8 dots/mm. For fine (long) print: 10 dots/mm
Function
Normal print, fine print, zoom print, A4 print, and realtime recording
Maximum paper feeding
speed
20 mm/s
3
4
5
6
7
18.7 Storage
8
Built-in Storage
• PC Card Interface
9
Item
Specifications
Number of drives
1
Maximum capacity
5 GB
Compatible cards*
Flash ATA memory card (PC card TYPE II), PC card type, CF card + adapter card, and HDD PC
card.
10
11
* For details on compatible cards, contact your nearest YOKOGAWA dealer.
12
• Internal Hard Disk (Option)
Item
Specifications
Number of drives
1
Size
2.5 inch
HDD capacity used
40 GB, FAT32, 2 partitions by factory default
File name
Supports long file names (ANK16 characters)
Function
Mount the internal HDD via the SCSI port
13
14
15
Item
Specifications
External Storage Interface
• SCSI
16
Specifications
Standard
SCSI (Small Computer System Interface).ANSIX3.131-1986
Connector
Half pitch 50 pins
17
Connector pin assignment Unbalanced (single-ended)
18
• USB Storage Device*
Item
App
Specifications
Compatible USB mass storage devices
USB (USB Mass Storage Class) hard disk drive, MO disk drive, and flash memory
Index
For specification details, see the next section, “USB PERIPHERAL Interface.”
IM 701240-01E
18-7
18.8 USB PERIPHERAL Interface
Item
Specifications
Connector type
USB type A connector (receptacle)
Electrical and mechanical specifications
Conforms to USB Rev.1.1
Data rate
12 Mbps maximum
Compatible keyboards1
104 keyboard or 89 keyboard (US) and 109 keyboard or 89 keyboard (Japanese) conforming to
USB HID Class Ver.1.1
Compatible printers1
ESC/P, ESC/P2, LIPS3, PCL5, and BJ (can be used on models that support the BJC-35V native
commands) that support USB (USB Printer Class Version 1.0)
Compatible mouse1
Mouse (with wheel) that supports USB HID Class Ver.1.1
Compatible USB mass
storage devices1
USB (USB Mass Storage Class) hard disk drive, MO disk drive, and flash memory
Power supply
5 V, 500 mA2 (per port)
Number of ports
2
1 For details on compatible USB devices, contact your nearest YOKOGAWA dealer.
2 Devices whose maximum current consumption exceeds 100 mA cannot be connected simultaneously to the two ports.
18.9 Auxiliary I/O Section
Logic Input
Item
Specifications
Number of inputs
8 bits × 2
Connector type
26-pin half-pitch connector × 2
Maximum sample rate
10 MS/s
Compatible probes Non-isolated (700986 (8 bits), 702911 (8 bits), 702912 (8 bits)), and
isolated (700987 (8 bits)).
External Trigger Input
Item
Specifications
Connector type
RCA jack
Input level
TTL (0 to 5 V) input
Minimum pulse width
500 ns
Logic
Rising edge or falling edge selectable
Trigger delay
Within 200 ns + 1 sample
Externally synchronized
operation
Possible (by connecting TRIG IN and TRIG OUT on two SL1400s)
Trigger Output (TRIG OUT)*
Item
Specifications
Connector type
RCA jack, shared with the external sampling clock
Output level
CMOS level (0 to 5 V) output
Logic
Falls when the trigger is activated, rises after completing acquisition.
Output delay
Within 1 µs + 1 sample
Output hold time
200 ns or longer
* This terminal is also used as an external clock input terminal.
18-8
IM 701240-01E
18.8 USB PERIPHERAL Interface
1
Video Signal Output (VIDEO OUT (SVGA))
Item
Specifications
Connector type
15-pin D-Sub receptacle
Output format
Analog RGB output
Output resolution
SVGA output 800 × 600 dots/60 Hz Vsync
2
3
External Start/Stop
Item
Specifications
Connector type
Modular jack (RJ-11)
Input
TTL (0 to 5 V) or switch input
Start on a low signal and stop on a high signal
Compatible cable
Four-wire modular cable for telephone lines (external start/stop cable (YOKOGAWA: 366973))
4
5
6
COMP Output (Rectangular Signal Output for Probe Compensation)
Item
7
Specifications
Output frequency
1 kHz ± 1%
Output amplitude
1 V ± 10%
8
Probe Power Output (Option)
Item
Specifications
Number of output
terminals
4
Output voltage
±12 V 2 outputs (up to a total of 800 mA)
Compatible probes*
Current probe (701930 (150 A)) up to 2 probes
Current probe (701931 (500 A)) 1 probe
Current probe (701933 (30 A)) up to 2 probes
* Up to four 700937 current probes can be used, but the 700937 is a discontinued product.
9
10
11
For details on the usage conditions of each probe, see “Relationship between the current being measured and probe’s current
consumption” on the following Web page.
http://www.yokogawa.com/tm/probe/
12
13
14
15
Specifications
16
17
18
App
Index
IM 701240-01E
18-9
18.10 Computer Interface
GP-IB1
Item
Specifications
Electrical and mechanical
specifications
Conforms to IEEE St’d 488-1978 (JIS C 1901-1987)
Functional specifications
SH1, AH1, T5, L4, SR1, RL1, PP0, DC1, DT0, and C0
Protocol
Conforms to IEEE St’d 488.2-1992
Code
ISO (ASCII) code
Mode
Addressable mode
Address
Specify a talker/listener address between 0 and 30
Clear remote mode
Remote mode can be cleared using the CLEAR TRACE key (except during local lockout).
Serial (RS-232)1
Item
Specifications
Connector type
9-pin D-Sub plug
Electrical characteristics
Conforms to the EIA-574 standard (for the 9-pin interface of the EIA-232 (RS-232) standard)
Connection
Point-to-point
Transmission mode
Full-duplex
Synchronization
Start-stop synchronization
Baud rate
Select from the following rates.
1200, 2400, 4800, 9600, 19200, 38400, and 57600
If unstable, use 19200 or less.
USB-PC Connection1
Item
Specifications
Connector type
USB type B connector (receptacle)
Electrical and mechanical
specifications
Conforms to USB Rev.1.1
Data rate
12 Mbps maximum
Number of ports
1
Supported service
Remote control2
PC system supported
PCs with standard USB ports running Windows 2000 or Windows XP.
Ethernet (Option)1
Item
Specifications
Number of communication 1
ports
Electrical and mechanical
specifications
Conforms to IEEE802.3
Transmission system
Ethernet (100BASE-TX/10BASE-T)
Data rate
100 Mbps maximum
Communication protocol
TCP/IP
Supported services
FTP server, FTP client (network drive), LPR client (network printer), SMTP client (mail
transmission), DHCP, DNS, Web server, and remote control2
Connector type
RJ-45 connector
1
2
18-10
For details on the specifications, see the Communication Interface User’s Manual on the CD-ROM.
The SL1400 can be controlled remotely from a host such as a PC. For details, see the Communication Interface User’s
Manual on the CD-ROM. A separate driver is needed to use this function. The driver can be downloaded from the following Web page.
http://www.yokogawa.com/tm/Bu/software.htm
IM 701240-01E
1
18.11 General Specifications
2
Item
Specifications
Standard operating
conditions
Ambient temperature: 23 ± 5°C
Ambient humidity:
55 ± 10% RH
Within 1% of the rated error of the power supply voltage and frequency
After a 30-minute warm-up and after calibration
3
4
Recommended calibration 1 year
period
Warm-up time
At least 30 minutes
Storage temperature
–20 to 60°C
Storage humidity
20 to 85% RH (no condensation)
Storage altitude
3000 m or less
Operating temperature
range
5 to 40°C
Operating humidity range
20 to 85% RH (when not using the printer), 35 to 85% RH (when using the printer)
Operating altitude
2000 m or less
Rated supply voltage
100 to 120 VAC or 200 to 240 VAC (automatic switching)
Rated power supply
frequency
50/60 Hz
5
6
7
8
Permitted supply voltage
90-132 VAC/180-264 VAC
Permitted power supply
frequency range
48 to 63 Hz
Maximum power
consumption
Approx. 200 VA max. (maximum power when the printer is OFF and 16 channels are running is 135
VA (reference value))
9
Withstand voltage
1500 VAC for 1 minute across the power supply and earth
Insulation resistance
10 MΩ or more at 500 VDC across the power supply and ground
External dimensions
355 mm (W) × 250 mm (H) × 180 mm(D) (excluding the handle and other projections)
Weight
Approx. 7.8 kg (only the SL1400 with all options (C8/C10/P4 options), without the chart paper)
Approx. 11.8 kg (SL1400 + eight High-Speed 10 MS/s, 12-Bit Isolation Modules)
Module: Approx. 300 g (High-Speed 10 MS/s, 12-Bit Isolation Module)
Instrument’s cooling
method
Forced air cooling. Exhaust on the left side panel and top.
Battery backup
Settings and clock are backed up with the internal lithium battery
Battery backup
Battery life
Approx. 5 years (at ambient temperature of 25°C)
Fuse
Inside the power supply unit (cannot be replaced from the outside of the instrument)
10
11
12
13
14
15
Specifications
16
17
18
App
Index
IM 701240-01E
18-11
18.11 General Specifications
Item
Specifications
Safety standard
Complying standard
EN61010-1
• Overvoltage Category (Installation Category) II1
• Measurement Category (Installation Category) II5
• Pollution degree 22
Already certified (701240/701250/701251/701255/701260/701261/
701262/701265/701270/701271/701275/701280/700986/700987/
701955/701956/701957/701958)
Emission
Complying standard
EN61326
Already certified (701240/701250/701251/701255/701260/701261/
701262/701265/701270/701271/701275/701280/700986/700987/701955/
701956/701957/701958)
• This product is a Class A (for industrial environment) product.
Operation of this product in a residential area may cause radio
interference in which case the user is required to correct the interference.
1. Power supply terminal noise
EN61326:ClassA
2. Electromagnetic radiation disturbance EN61326:ClassA
3. Power supply harmonics restriction
EN61000-3-2
4. Supply voltage fluctuation & flicker
EN61000-3-3
• Shared external trigger/external clock input terminal
Use the BNC-RCA adapter (YOKOGAWA: 366928) and a BNC cable3
and attach a ferrite core (TDK: ZCAT2035-0930A, YOKOGAWA:
A1190MN) on one end (SL1400 end).
• Trigger output terminal
Same as the external trigger input terminal above.
• Video signal output (VIDEO OUT (SVGA)) terminal
Use a 15-pin D-Sub VGA shielded cable3.
• GP-IB interface connector
Use shielded GP-IB cables3.
• Serial (RS-232) interface connector
Use a shielded RS-232 cable3 and attach a ferrite core (TDK: ZCAT20350930A, YOKOGAWA: A1190MN) on one end (SL1400 end).
• SCSI connector
Use a shielded SCSI cable3 and attach a ferrite core (TDK: ZCAT20350930A, YOKOGAWA: A1190MN) on one end (SL1400 end).
• USB peripheral connector
Use shielded USB cables.3
• USB interface connector
When connecting a USB keyboard or mouse using a shielded cable or
when connecting to a USB printer, use shielded USB cables.*3
• Ethernet connector
Use category 5 Ethernet cables4 or better cables.
• Probes connected to modules and wiring
Use twisted pair cables when connecting items other than probes to the
module. Attach a ferrite core (TDK: ZCAT2035-0930A, YOKOGAWA:
A1190MN) to the probes and cables that are connected to the modules.
Wrap the cable around the ferrite core once.
• Logic probe input
Attach a ferrite core (TDK: ZCAT2035-0930A, YOKOGAWA: A1190MN)
on one end (SL1400 end) of the cable to be connected to the logic probe
input terminal.
• Current probe (701930, 701931, and 701933)
When connecting a current probe to the input terminal and probe power
terminal of the module, attach a ferrite core (TDK: ZCAT2035-0930A,
YOKOGAWA: A1190MN) on one end (SL1400 end) of the two cables
together.
• Bridge head for the strain module
When using the 701270, use the 701955 or the 701956; when using the
701271, use the 701957 or the 701958.
Test item
Cable condition
18-12
IM 701240-01E
18.11 General Specifications
Item
Specifications
Immunity
Complying
standard
1
*1 The Overvoltage Category (Installation Category) is a value used to define the transient overvoltage condition and includes
the impulse withstand voltage regulation. I applies to electrical equipment that is powered by a circuit with overvoltage
control. II applies to electrical equipment that is powered by a fixed installation such as a distribution board.
*2 Pollution Degree applies to the degree of adhesion of a solid, liquid, or gas which deteriorates withstand voltage or surface
resistivity. Pollution Degree 2 applies to normal indoor atmospheres (with only non-conductive pollution).
*3 Use cables of length 3 m or less.
*4 Use cables of length 30 m or less.
*5 Measurement Category (CAT II) applies to electrical equipment that is powered through a fixed installation such as a wall
outlet wired to a distribution board and measurement performed on such wiring.
IM 701240-01E
18-13
2
3
4
5
6
7
8
9
10
11
12
13
14
15
Specifications
EN61326
Already certified (701240/701250/701251/701255/701260/701261/701262/701265/701270/
701271/701275/701280/700986/700987/701955/701956/701957/701958)
• Influence in the immunity environment (performance criterion A)
Noise
701250:
≤±3 mV (1:1 input, 50 mV range conversion)
increase 701251:
≤±3 mV (1:1 input, 10 mV range conversion)
701255:
≤±25 mV (1:1 input, 50 mV range conversion)
701260:
≤±30 mV (1:1 input, 200 mV range conversion)
701261/701262: ≤±3 mV
701265:
≤±0.05 mV
701270:
≤±100 µSTR
(when equivalent to ±100 mV, gauge factor = 2, and bridge voltage = 2 V)
701271:
≤±100µSTR
(when equivalent to ±100 mV, gauge factor = 2, and bridge voltage = 2 V)
701275:
≤±3 mV (1:1 input, 50 mV range conversion)
701280:
Within the specifications
Test conditions 701250:
10 MS/s, envelope mode, 500 mV range, no input filter,with the tip of the probe
(700929 (10:1)) shorted
701251:
1 MS/s, envelope mode, 100 mV range, no input filter,
with the tip of the probe (700929 (10:1)) shorted
701255:
10 MS/s, envelope mode, 500 mV range, no input filter,
with the tip of the probe (701940 (10:1)) shorted
701260:
100 kS/s, envelope mode, 200 mV range, no input filter,
with the tip of the probe (700929 (10:1)) shorted
701261/701262: 100 kS/s, envelope mode, 50 mV range, no input filter,
With the end of the 3-m twisted-pair cable shorted
701265:
100 kS/s, envelope mode, 1 mV range, no input filter,
With the end of the 3-m twisted-pair cable shorted
701270:
100 kS/s, envelope mode, 500 µSTR,
gauge factor: 2.0, no input filter,
701955 bridge voltage:
2V
701956 bridge voltage:
10 V
701271:
100 kS/s, envelope mode, 500 µSTR,
gauge factor: 2.0, no input filter,
701957 bridge voltage:
2V
701958 bridge voltage:
10 V
701275:
100 kS/s, envelope mode, 500 mV range, no input filter, with the tip of the probe
(700929 (10:1)) shorted
701280:
25 kS/s, envelope mode, Frequency, 1 Hz range, no input filter, User (±1 V, threshold
level: 0 V, hysteresis: ±1%), with the tip of the probe (700929 (10:1)) shorted
Test item
1. Electrostatic discharge
EN61000-4-2
Air discharge: ±8 kV, contact discharge: ±4 kV, criteria B
2. Radiated immunity
EN61000-4-3
80 MHz to 1 GHz, 1.4 GHz to 2 GHz, 10 V/m, criteria A
3. Conducted immunity
EN61000-4-6
3 V, criteria A
4. Electrical fast transient/burst
EN61000-4-4
Power line: ±2 kV, signal line: ±1 kV, criteria B
5. Power frequency magnetic field EN61000-4-8
30 A/m, 50 Hz, criteria A
6. Surge immunity
EN61000-4-5
Between lines: ±1 kV, common: ±2 kV, criteria B
7. Voltage dip and interruption
EN61000-4-11
0.5 cycle, both polarities, 100%, criteria A
Definitions of criteria • Criteria A Aforementioned “Influence in the immunity environment” is met during the test.
A and B
• Criteria B This apparatus continues to operate without hang-up or falling into uncontrollable
conditions during the test. No change of actual operating state or stored data is allowed.
16
17
18
App
Index
18.12 Module Specifications
High-Speed 10 MS/s, 12-Bit Isolation Module (701250) Specifications
Item
Specifications
Standard operating
conditions
Temperature: 23±5°C
Humidity:
55±10% RH
After a 30-minute warm-up and after calibration
Effective measurement
range
Twice the measurement range
Number of input channels
2
Input coupling
AC, DC, and GND
Maximum sample rate
10 MS/s
Input format
Isolated unbalanced
Frequency characteristics1 (–3 dB point when a sine wave with an amplitude equivalent to 60% of the range is applied) DC to 3
MHz
Voltage-axis sensitivity
range
10:1 ProbeFactor: 500 mV to 2 kV range (1-2-5 steps)
1:1 ProbeFactor: 50 mV to 200 V range (1-2-5 steps)
Maximum input voltage (at a frequency of 1 kHz or less)
600 V (DC+ACpeak)
Combined with the 700929 (10:1):2
Combined with the 701901+701954 (1:1):4
250 V (DC+ACpeak)
Direct input or cable not complying with the safety standard:6 250 V (DC+ACpeak)
Maximum allowable common mode voltage (at a frequency of 1 kHz or less)
Working voltage of safety standard
Combined with the 700929 (10:1)3 or combined with the 701901+701954 (1:1):5
400 Vrms (CAT I), 300 Vrms (CAT II)
Direct input or cable not complying with the safety standard:7
42 V (DC+ACpeak) (CAT I and CAT II, 30 Vrms)
Vertical (voltage) axis accuracy
DC accuracy1
50 mV to 200 V range: ±(0.5% of range)
Input connector
BNC connector (isolated type)
Input impedance
1 MΩ±1%, approx. 35 pF
Lower –3 dB point when
AC coupled
10 Hz or less (1 Hz or less when using the 700929)
Common mode rejection
ratio
80 dB (50/60 Hz) or more (typical8)
Residual noise level
(Input section shorted)
±400 µV or ±0.6% of the range, whichever is greater (typical8)
Withstand voltage
1500 Vrms for 1 minute (across each terminal and earth) (60 Hz)
Allowable transient surge
voltage (instantaneous)
±2100 Vpeak (across each input terminal and earth)
Insulation resistance
500 VDC, 10 MΩ or more (across each input terminal and earth)
A/D conversion resolution
12 bits (1500 LSB/range)
Temperature coefficient
Zero point: 50 mV to 200 V range: ±(0.05% of range)/°C (typical8)
Gain:
±(0.02% of range)/°C (typical8)
Bandwidth limit
Select from OFF, 500 kHz, 50 kHz, 5 kHz, and 500 Hz
Cutoff characteristics: –18 dB/OCT (typical8)
Probe attenuation setting
Voltage probe: 1:1, 10:1, 100:1, and 1000:1
Current probe: 10 A:1 V (for the 701933) and 100 A:1 V (for the 701930/701931)
18-14
IM 701240-01E
18.12 Module Specifications
Item
1
Specifications
Compatible probes/cables Voltage probe (10:1 safety probe): Recommended
700929 (10:1 safety probe) .20 to 45 pF: For measuring 600 Vpeak or less
Current probe (power can be supplied from the SL1400)
701930 (150 A), 701931 (500 A), and 701933 (30 A)
High voltage differential probe (connect the GND cable provided with the probe to the SL1400 case)
700924 (1000:1, 100:1/1400 Vpeak): For measuring 1400 Vpeak or less
Connection cable (for high voltage 1:1)
701901 (isolated type BNC-safety alligator clip adapter × 2: For measuring 250 Vpeak or less),
a separate alligator clip (701954) is required
Connection cable (for low voltage 1:1)
366926 (non-isolated type BNC-alligator clip × 2: For measuring low voltage less than or equal
to 42 Vpeak)
1 Value measured under standard operating conditions (section 18.11).
Combined with the 700929
Combined with the 701901+701954
700929
701901
2.
L
701954
4.
L
3.
3
4
5
6
H
H
2
7
5.
8
Direct input (cable not complying with the safety standard)
9
H
BNC
6.
L
7.
Withstand voltage: 1500 Vrms for 1 minute
Allowable transient surge voltage: ±2100 Vpeak
(between earth and input)
10
11
8 Typical value represents a typical or average value. It is not strictly warranted.
12
WARNING
13
14
15
Specifications
• Do not apply input voltage exceeding the maximum input voltage, withstand
voltage, or allowable surge voltage.
• To prevent electric shock, be sure to furnish protective earth grounding of the
SL1400.
• To prevent electric shock, be sure to fasten the module screws. Otherwise, the
electrical and mechanical protection functions will not be activated.
• Avoid continuous connection under an environment in which the allowable surge
voltage or higher voltage may occur.
• To prevent electric shock, be sure to connect the GND lead of the differential
probe (700924/700925) to the SL1400.
16
17
18
App
Index
IM 701240-01E
18-15
18.12 Module Specifications
High-Speed High-Resolution 1 MS/s, 16-Bit Isolation Module (701251) Specifications
Item
Specifications
Standard operating
conditions
Temperature: 23±5°C
Humidity:
55±10% RH
After a 30-minute warm-up and after calibration
Effective measurement
range
Twice the measurement range
Number of input channels
2
Input coupling
AC, DC, and GND
Maximum sample rate
1 MS/s
Input format
Isolated unbalanced
1
Frequency characteristics
(–3 dB point when a sine wave with an amplitude equivalent to 60% of the range is applied)
50 mV to 200 V range: DC to 300 kHz
20 mV to 10 mV range: DC to 200 kHz
Voltage-axis sensitivity
range
10:1 ProbeFactor: 100 mV to 2 kV range (1-2-5 steps)
1:1 ProbeFactor: 10 mV to 200 V range (1-2-5 steps)
Maximum input voltage (at a frequency of 1 kHz or less)
Combined with the 700929 (10:1):2
600 V (DC+ACpeak)
140 V (DC+ACpeak)
Combined with the 701901+701954 (1:1):4
Direct input or cable not complying with the safety standard:6 140 V (DC+ACpeak)
Maximum allowable common mode voltage (at a frequency of 1 kHz or less)
Working voltage of safety standard
Combined with the 700929 (10:1)3 or combined with the 701901+701954 (1:1):5
400 Vrms (CAT I), 300 Vrms (CAT II)
Direct input or cable not complying with the safety standard:7
42 V (DC+ACpeak) (CAT I and CAT II, 30 Vrms)
Vertical (voltage) axis accuracy
DC accuracy1
50 mV to 200 V range: ±(0.25% of range)
20 mV range:
±(0.3% of range)
10 mV range:
±(0.5% of range)
Input connector
BNC connector (isolated type)
Input impedance
1 MΩ±1%, approx. 35 pF
Lower frequency –3 dB point when AC coupled
1 Hz or less (0.1 Hz or less when using the 700929)
Common mode rejection
ratio
80 dB (50/60 Hz) or more (typical8)
Residual noise level
(Input section shorted)
±100 µV or ±0.1% of the range, whichever is greater (typical8)
Withstand voltage
1500 Vrms for 1 minute (across each terminal and earth) (60 Hz)
Allowable transient surge voltage (instantaneous)
±2100 Vpeak (across each input terminal and earth)
Insulation resistance
500 VDC, 10 MΩ or more (across each input terminal and earth)
A/D conversion resolution
16 bits (24000 LSB/range)
Temperature coefficient
Zero point:
Gain:
50 mV to 200 V range:
20 mV range:
10 mV range:
10 mV to 200 V range:
±(0.02% of range)/°C (typical8)
±(0.05% of range)/°C (typical8)
±(0.10% of range)/°C (typical8)
±(0.02% of range)/°C (typical8)
Bandwidth limit
Select from OFF, 40 kHz, 4 kHz, and 400 Hz
Cutoff characteristics: –12 dB/OCT (typical8)
Probe attenuation setting
Voltage probe: 1:1, 10:1, 100:1, and 1000:1
Current probe: 10 A:1 V (for the 701933), 100 A:1 V (for the 701930/701931)
18-16
IM 701240-01E
18.12 Module Specifications
Item
1
Specifications
Compatible probes/cables Voltage probe (10:1 safety probe): Recommended
700929 (10:1 safety probe) .20 to 45 pF: For measuring 600 Vpeak or less
Current probe (power can be supplied from the SL1400)
701930 (150 A), 701931 (500 A), and 701933 (30 A)
High voltage differential probe (connect the GND cable provided with the probe to the SL1400 case)
700924 (1000:1, 100:1/1400 Vpeak): For measuring 1400 Vpeak or less
Connection cable (for high voltage 1:1)
701901 (isolated type BNC-safety alligator clip adapter × 2: For measuring 250 Vpeak or less),
a separate alligator clip (701954) is required
Connection cable (for low voltage 1:1)
366926 (non-isolated type BNC-alligator clip × 2: For measuring low voltage less than or equal
to 42 Vpeak)
1 Value measured under standard operating conditions (section 18.11).
Combined with the 700929
Combined with the 701901+701954
H
H
700929
701901
2.
L
701954
4.
3
4
5
6
7
L
3.
2
5.
8
Direct input (cable not complying with the safety standard)
9
H
BNC
6.
L
7.
Withstand voltage: 1500 Vrms for 1 minute
Allowable transient surge voltage: ±2100 Vpeak
(between earth and input)
10
11
8 Typical value represents a typical or average value. It is not strictly warranted.
12
WARNING
13
14
15
Specifications
• Do not apply input voltage exceeding the maximum input voltage, withstand
voltage, or allowable surge voltage.
• To prevent electric shock, be sure to furnish protective earth grounding of the
SL1400.
• To prevent electric shock, be sure to fasten the module screws. Otherwise, the
electrical and mechanical protection functions will not be activated.
• Avoid continuous connection under an environment in which the allowable surge
voltage or higher voltage may occur.
• To prevent electric shock, be sure to connect the GND lead of the differential
probe (700924/700925) to the SL1400.
16
17
18
App
Index
IM 701240-01E
18-17
18.12 Module Specifications
High-Speed 10 MS/s, 12-Bit Non-Isolation Module (701255) Specifications
Item
Specifications
Standard operating
conditions
Temperature: 23±5°C
Humidity:
55±10% RH
After a 30-minute warm-up and after calibration
Effective measurement
range
Twice the measurement range
Number of input channels
2
Input coupling
AC, DC, and GND
Maximum sample rate
10 MS/s
Input format
Non-isolated, unbalanced
1
Frequency characteristics
(–3 dB point when a sine wave with an amplitude equivalent to 60% of the range is applied)
DC to 3 MHz
Voltage-axis sensitivity
range
When using 10:1 probe attenuation: 500 mV to 2 kV (1-2-5 steps)
1:1 ProbeFactor:
50 mV to 200 V range (1-2-5 steps)
Maximum input voltage (at a frequency of 1 kHz or less)
Combined with the 701940 (10:1):2
Direct input (1:1):3
600 V (DC+ACpeak)
250 V (DC+ACpeak)
Vertical (voltage) axis accuracy
50 mV to 200 V range: ±(0.5% of range)
DC accuracy1
Input connector
BNC connector (metallic type)
Input impedance
1 MΩ±1%, approx. 35 pF
Lower –3 dB point when
AC coupled
10 Hz or less (1 Hz or less when using the 701940)
Common mode rejection
ratio
80 dB (50/60 Hz) or more (typical4)
Residual noise level
(Input section shorted)
±400 µV or ±0.6% of the range, whichever is greater (typical4)
A/D conversion resolution
12 bits (1500 LSB/range)
Temperature coefficient
Zero point: 50 mV to 200 V range: ±(0.05% of range)/°C (typical4)
Gain:
±(0.02% of range)/°C (typical4)
Bandwidth limit
Select from OFF, 500 kHz, 50 kHz, 5 kHz, and 500 Hz
Cutoff characteristics: –18 dB/OCT (typical4)
Probe attenuation setting
Voltage probe: 1:1, 10:1, 100:1, and 1000:1
Current probe: 10 A:1 V (for the 701933) and 100 A:1 V (for the 701930/701931)
Compatible probes/cables Voltage probe (10:1 passive probe): Recommended
701940, 17 to 46 pF: For measuring 600 V (DC+ACpeak) or less
Current probe (power can be supplied from the SL1400)
701930 (150 A), 701931 (500 A), and 701933 (30 A)
High voltage differential probe (connect the GND cable provided with the probe to the SL1400 case)
700924 (1000:1, 100:1/1400 Vpeak): For measuring 1400 Vpeak or less
Connection cable (for low voltage 1:1)
366926 (non-isolated type BNC-alligator clip × 2: For measuring low voltage less than or equal
to 42 Vpeak)
1 Value measured under standard operating conditions (section 18.11).
Recommended:
Combined with the 10:1 passive probe
(701940)
H
2.
L
Direct input
(When a cable that does not comply with
the safety standard is connected)
701255
Input
terminal
GND
H
3.
L
GND
Earth
GND is connected to the case potential.
GND is connected to the case potential.
4 Typical value represents a typical or average value. It is not strictly warranted.
18-18
IM 701240-01E
18.12 Module Specifications
1
WARNING
• Do not apply input voltage exceeding the maximum input voltage, withstand
voltage, or allowable surge voltage.
• To prevent electric shock, be sure to furnish protective earth grounding of the
SL1400.
• To prevent electric shock, be sure to fasten the module screws.
• The module screws must be fastened for the module to function as a nonisolation module. In addition, all electrical and mechanical protection functions
are activated only when the screws are fastened.
• The maximum input voltage of the module is valid only when all the screws are
fastened, and the protection path of the metal BNC is secured.
2
3
4
5
6
7
8
9
10
11
12
13
14
15
Specifications
16
17
18
App
Index
IM 701240-01E
18-19
18.12 Module Specifications
High-Voltage 100 kS/s, 16-Bit Isolation Module (with RMS) (701260) Specifications
Item
Specifications
Standard operating
conditions
Temperature: 23±5°C
Humidity:
55±10% RH
After a 30-minute warm-up and after calibration
Effective measurement
range
Twice the measurement range
Number of input channels
2
Input coupling
AC, DC, GND, AC-RMS, and DC-RMS
Maximum sample rate
100 kS/s
Input format
Isolated unbalanced
1
Frequency characteristics
(–3 dB point when a sine wave with an amplitude equivalent to 60% of the range is applied)
Waveform observation mode: DC to 40 kHz
RMS observation mode:
DC, 40 Hz to 10 kHz
Voltage-axis sensitivity
range
When using 10:1 probe attenuation: 2 V to 20 kV range (1-2-5 steps)
1:1 ProbeFactor:
200 mV to 2 kV range (1-2-5 steps)
Maximum input voltage (at a frequency of 1 kHz or less)
Combined with the 700929 (10:1):2
1000 V (DC+ACpeak)
850 V (DC+ACpeak)
Combined with the 701901 (1:1) and 701954:5
Direct input or cable not complying with the safety standard:8 850 V (DC+ACpeak)
Maximum allowable common mode voltage (at a frequency of 1 kHz or less)
Working voltage of safety standard
Combined with the 700929
(across probe tip H and earth3):
(across probe tip L and earth4):
Combined with 701901(1:1)+701954 (across tip H and earth6):
(across tip L and earth7):
Direct input or cable not complying with the safety standard:9
(across the input terminal, H or L, and earth)
Vertical (voltage) axis accuracy1
Waveform observation mode DC accuracy
RMS observation mode
DC accuracy
AC accuracy (when a sine wave is input)
AC accuracy (when the crest factor is 2 or less)
AC accuracy (when the crest factor is 3 or less)
1000 Vrms (CAT II)
400 Vrms (CAT II)
700 Vrms (CAT II)
400 Vrms (CAT II)
30 Vrms (42 VDC+ACpeak)
±(0.25% of range)
±(1.0% of range)
±(1.5% of range)
±(2.0% of range)
±(3.0% of range)
Input connector
BNC connector (isolated type)
Input impedance
1 MΩ±1%, approx. 35 pF
Lower –3 dB point when
AC coupled
1 Hz or less (0.1 Hz or less when using the 700929)
Common mode rejection
ratio
80 dB (50/60 Hz) or more (typical10)
Residual noise level
(Input section shorted)
±1 mV or ±0.2% of range, whichever is greater (typical10)
} 40 Hz to 1 kHz
range
Withstand voltage
3700 Vrms for 1 minute (across each terminal and earth) (60 Hz)
Allowable transient surge
voltage (instantaneous)
±5200 Vpeak (across each input terminal and earth)
Insulation resistance
500 VDC, 10 MΩ or more (across each input terminal and earth)
A/D conversion resolution
16 bits (24000 LSB/range)
Temperature coefficient
(only when observing
waveforms)
Zero point: ±(0.02% of range)/°C (typical10)
Gain:
±(0.02% of range)/°C (typical10)
Response time
(only when observing
RMS)
Rising (0 to 90% of 10 div):
100 ms (typical10)
Falling (100 to 10% of 10 div): 250 ms (typical10)
Bandwidth limit
Select from OFF, 10 kHz, 1 kHz, and 100 Hz
Cutoff characteristics: –12 dB/OCT (typical10)
Probe attenuation setting
Voltage probe: 1:1, 10:1, 100:1, and 1000:1
Current probe: 10 A:1 V (for the 701933) and 100 A:1 V (for the 701930/701931)
18-20
IM 701240-01E
18.12 Module Specifications
Item
1
Specifications
Compatible probes/cables Connection cable (for high voltage 1:1): Recommended 1
701901 (isolated type BNC-safety alligator clip adapter × 2: For measuring 850 V
(DC+ACpeak) or less),
701954 (alligator clip (dolphin type) red/black 2-piece set) is required separately
Voltage probe (10:1 safety probe): Recommended 2
700929 (10:1 safety probe) .20 to 45 pF: For measuring 1000 V (DC+ACpeak) or less
Current probe (power can be supplied from the SL1400)
701930 (150 A), 701931 (500 A), and 701933 (30 A)
2
3
4
1 Value measured under standard operating conditions (section 18.11).
Combined with the 700929
Combined with the 701901+701954
701901
2.
5
H
H
700929
3.
701954
L
5.
6.
6
L
7.
4.
7
Direct input (cable not complying with the safety standard)
8
H
BNC
8.
L
9.
Withstand voltage: 3700 Vrms for 1 minute
9
10
10 Typical value represents a typical or average value. It is not strictly warranted.
11
WARNING
12
13
14
15
Specifications
• When applying high voltage using this module, use the 1:1 safety cable
(combination of 701901 and 701954) or the isolated probe (700929).
• The measurement category of the direct input of this module is 400 Vrms-CAT II
on the low side and 700 Vrms-CAT II on the high side. Use caution because the
measurement category differs between the low and high sides.
• Do not apply input voltage exceeding the maximum input voltage, withstand
voltage, or allowable surge voltage.
• To prevent electric shock, be sure to furnish protective earth grounding of the
SL1400.
• To prevent electric shock, be sure to fasten the module screws. Otherwise, the
electrical and mechanical protection functions will not be activated.
• Avoid continuous connection under an environment in which the allowable surge
voltage or higher voltage may occur.
16
17
18
App
Index
IM 701240-01E
18-21
18.12 Module Specifications
Universal (Voltage/Temp.) Module (701261) Specifications
Universal (Voltage/Temp.) Module (with AAF) (701262) Specifications
Item
Specifications
Standard operating
conditions
Temperature: 23±5°C
Humidity:
55±10% RH
After a 30-minute warm-up and after calibration
Function
Temperature (thermocouple) or voltage measurement (switchable)
Effective measurement
range
[Voltage measurement] Twice the measurement range
Number of input channels
2
Input coupling
TC, DC, AC, and GND
TC: Temperature (thermocouple) measurement
DC: Voltage measurement (DC coupling)
AC: Voltage measurement (AC coupling)
Maximum sample rate
when measuring voltage
100 kHz
Data update rate when
measuring temperature
500Hz
Input format
Isolated unbalanced
Measurement range
[Voltage measurement]
Voltage sensitivity:
[Temperature measurement] Thermocouple:
50 mV to 200 V range (1-2-5 steps)
K, E, J, T, L, U, N, R, S, B, W, and Au7Fe
Measurement
range/accuracy1
[Voltage measurement]
50 mV to 200 V range (1-2-5 steps)
±(0.25% of range)
Voltage sensitivity:
Voltage accuracy:
[Temperature measurement]2
Type
Measurement range
Accuracy
K
E
±(0.1% of reading + 1.5°C)
Except ±(0.2% of reading + 1.5°C) for –
J
T
L
U
N
–200 to 1300°C
–200 to 800°C
200°C to 0°C
–200 to 1100°C
–200 to 400°C
–200 to 900°C
–200 to 400°C
0 to 1300°C
R
S
0 to 1700°C
0 to 1700°C
±(0.1% of reading + 3°C)
Except ±8°C for 0 to 200°C
±5°C for 200 to 800°C
B
0 to 1800°C
±(0.1% of reading + 2°C)
Except ±8°C for 400 to 700°C
Effective range is 400 to 1800°C
W
0 to 2300°C
±(0.1% of reading + 3°C)
Au7Fe3
0 to 300K
0 to 50K: ±4K
50 to 300K: ±2.5K
Frequency characteristics1 (–3 dB point when a sine wave with an amplitude equivalent to 60% of the range is applied)
[Voltage measurement] DC to 40 kHz
[Temperature measurement] DC to 100 Hz
Maximum input voltage4
(at a frequency of 1 kHz or less)
Both temperature and voltage input: 42 V (DC+ACpeak) (as a value that meets the safety standard)
150 V (DC+ACpeak) (maximum allowable voltage, as a value that does not damage the instrument
when applied)
Maximum allowable common mode voltage5 (at a frequency of 1 kHz or less)
42 V (DC+ACpeak) (CAT I and CAT II, 30 Vrms) for both temperature and voltage input
Vertical resolution
[Voltage measurement] During voltage input: 24000 LSB/range
[Temperature measurement] When measuring temperature: 0.1°C
Lower frequency –3 dB point when AC coupled
[Voltage measurement]
Input connector
Binding post
Input impedance
Approx. 1 MΩ
18-22
0.5 Hz or less
IM 701240-01E
18.12 Module Specifications
1
Item
Specifications
Common mode rejection
ratio
[Voltage measurement]
80 dB or more (50/60 Hz) (typical6)
[Temperature measurement] 120 dB or more (50/60 Hz, with 2-Hz filter ON, signal source
resistance of 500 Ω or less) (typical6)
Residual noise level
(Input section shorted)
[Voltage measurement] ±100 µV or ±0.1% of range, whichever is greater (typical6)
A/D conversion resolution
[Voltage measurement] 16 bits (24000 LSB/range)
Temperature coefficient
[Voltage measurement] Zero point: ±(0.01% of range)/°C (typical6)
Gain:
±(0.02% of range)/°C (typical6)
2
3
4
Reference junction compensation accuracy (when the input terminal temperature is balanced)
K, E, J, T, L, U, N: ±1°C
R, S, B, W:
±1.5°C
Au7Fe:
±1K
Bandwidth limit
5
[Temperature measurement] (digital filter + analog filter)
Select from OFF, 30 Hz, 8 Hz, and 2 Hz + 150 Hz secondary analog filter
[Voltage measurement]
Select from OFF, AUTO, 4 kHz, 400 Hz, and 40 Hz.
Cutoff characteristics: –12 dB/OCT (typical6, setting other than AUTO)
Cutoff frequency (fc) when set to AUTO (only on the 701262)
Sample Rate
Cutoff Frequency (fc)
100 kHz or higher
100 Hz to 50 kHz
50 Hz or lower
40 kHz
40% of the sample rate
20 Hz
9
Table of cutoff frequency characteristics of the anti-aliasing filter (AAF)
When the filter is set to Auto, the anti-aliasing filter and low-pass filter are automatically set
according to the sample rate.
AAF
Low-Pass Filter
100 kS/s
50 kS/s
20 kS/s
10 kS/s
5 kS/s
2 kS/s
1 kS/s
500 S/s
200 S/s
100 S/s
50 S/s
20 S/s to 5 S/s
2 S/s or less
Ext sample
40 kHz
20 kHz
8 kHz
4 kHz
2 kHz
800 Hz
400 Hz
200 Hz
80 Hz
40 Hz
20 Hz
20Hz
20 Hz
40 kHz
OFF
OFF
OFF
4 kHz
4 kHz
4 kHz
400 Hz
400 Hz
400 Hz
40 Hz
40 Hz
40 Hz
40 Hz
OFF
10
11
12
13
14
15
Specifications
1 Value measured under standard operating conditions (section 18.11).
2 Does not include the reference junction temperature compensation accuracy.
3 This module supports Au7Fe with 0.07% metal content with respect to gold.
16
H
4
L
5
17
6 Typical value represents a typical or average value. It is not strictly warranted.
18
WARNING
App
• Do not apply input voltage exceeding the maximum input voltage or allowable
common mode input voltage.
• To prevent electric shock, be sure to furnish protective earth grounding of the SL1400.
• To prevent electric shock, be sure to fasten the module screws. Otherwise, the
electrical and mechanical protection functions will not be activated.
IM 701240-01E
7
8
Cutoff characteristics during AUTO: –65 dB at 2×fc (typical6)
Sample Rate
6
18-23
Index
18.12 Module Specifications
Temperature, High Precision Voltage Isolation Module (701265) Specifications
Item
Specifications
Standard operating
conditions
Temperature: 23±5°C
Humidity:
55±10% RH
After a 30-minute warm-up and after calibration
Function
Temperature (thermocouple) or voltage measurement (switchable)
Number of input channels
2
Input coupling
TC, DC, and GND
TC: Temperature (thermocouple) measurement
DC: Voltage measurement (DC coupling)
Data update rate
500 Hz
Input format
Isolated unbalanced
Measurement range
[Voltage measurement]
Voltage sensitivity:
[Temperature measurement] Thermocouple:
1 mV to 100 V range (1-2-5 steps)
K, E, J, T, L, U, N, R, S, B, W, and Au7Fe
Measurement
range/accuracy1
[Voltage measurement]
1 mV to 100 V range (1-2-5 steps)
±(0.08% of range + 2 µV)
Voltage sensitivity:
Voltage accuracy:
[Temperature measurement]2
Type
Measurement Range
Accuracy
K
E
J
T
L
U
N
–200 to 1300°C
–200 to 800°C
–200 to 1100°C
–200 to 400°C
–200 to 900°C
–200 to 400°C
0 to 1300°C
±(0.1% of reading + 1.5°C)
Except ±(0.2% of reading + 1.5°C) for –200 to 0°C
R
S
0 to 1700°C
0 to 1700°C
±(0.1% of reading + 3°C)
Except ±8°C for 0 to 200°C
±5°C for 200 to 800°C
B
0 to 1800°C
±(0.1% of reading + 2°C)
Except ±8°C for 400 to 700°C
Effective range is 400 to 1800°C
W
0 to 2300°C
±(0.1% of reading + 3°C)
Au7Fe3
0 to 300K
0 to 50K:
±4K
50 to 300K: ±2.5K
Frequency characteristics1 (–3 dB point when a sine wave with an amplitude equivalent to 60% of the range is applied)
[Voltage measurement]:
DC-100 Hz
[Temperature measurement]: DC-100 Hz
Maximum input voltage4 (at a frequency of 1 kHz or less)
42 V (DC+ACpeak) for both temperature and voltage input
Maximum allowable common mode voltage5 (at a frequency of 1 kHz or less)
42 V (DC+ACpeak) (CAT I and CAT II, 30 Vrms) for both temperature and voltage input
Vertical resolution
[Voltage measurement]:
During voltage input: 24000 LSB/range
[Temperature measurement]: When measuring temperature: 0.1°C
Input connector
Binding post
Input impedance
Approx. 1 MΩ
Common mode rejection ratio
[Voltage measurement]:
80 dB or more (50/60 Hz) (typical6)
[Temperature measurement]: 120 dB or more (50/60 Hz, with 2-Hz filter ON, signal source
resistance of 500 Ω or less) (typical6)
Residual noise level (input section shorted)
[Voltage measurement]
±4 µV or ±0.1% of the range, whichever is greater (typical6)
A/D conversion resolution
[Voltage measurement]:
Temperature coefficient
[Voltage measurement]
Zero point: ±(0.01% of range)/°C + 0.05 µV/C°C (typical6)
Gain:
±(0.02% of range)/°C (typical6)
18-24
16 bits (24000 LSB/range)
Twice the measurement range
IM 701240-01E
18.12 Module Specifications
Item
1
Specifications
Reference junction compensation accuracy (when the input terminal temperature is balanced)
K, E, J, T, L, U, N: ±1°C
R, S, B, W:
±1.5°C
Au7Fe:
±1K
2
Bandwidth limit (digital filter)
Select from OFF, 30 Hz, 8 Hz, and 2 Hz
3
Input bias current
20 nA or less
The zero point appears to be offset when the input is open due to the effects of bias current on this
module. However, this is not a malfunction.
Connect the input to the object to be measured.
1 Value measured under standard operating conditions (section 18.11).
2 Does not include the reference junction temperature compensation accuracy.
3 This module supports Au7Fe with 0.07% metal content with respect to gold.
5
6
H
4.
L
4
5.
7
6 Typical value represents a typical or average value. It is not strictly warranted.
8
WARNING
9
• Do not apply input voltage exceeding the maximum input voltage or allowable
common mode input voltage.
• To prevent electric shock, be sure to furnish protective earth grounding of the
SL1400.
• To prevent electric shock, be sure to fasten the module screws. Otherwise, the
electrical and mechanical protection functions will not be activated.
10
11
12
13
14
15
Specifications
16
17
18
App
Index
IM 701240-01E
18-25
18.12 Module Specifications
Strain Module (NDIS) (701270) Specifications
Item
Specifications
Standard operating
conditions
Temperature: 23±5°C
Humidity:
55±10% RH
After a 30-minute warm-up and after calibration and auto balance
Effective measurement
range
–FS to +FS (set using upper and lower limits)
Number of input channels
2
Maximum sample rate
100 kS/s
Input format
DC bridge (auto balancing), balanced differential input, and isolated
Auto balance type
Electronic auto balance
Auto balance range
±10000 µSTR (1 gauge method)
Bridge voltage
Select from 2 V, 5 V, and 10 V.
Gauge resistance
120 to 1000 Ω (bridge voltage: 2 V)
350 to 1000 Ω (bridge voltage: 2 V, 5 V, and 10 V)
Gauge factor
1.90 to 2.20 (set in 0.01 steps)
Frequency characteristics1 (–3 dB point when a sine wave with an amplitude equivalent to 60% of the range is applied)
DC to 20 kHz
mV/V range support
Supports the strain gauge transducer unit system.
mV/V range = 0.5×(µSTR range/1000)
Measurement range (FS) and measurement range
When using STR range
Measurement Range (FS)
500 µSTR
1000 µSTR
2000 µSTR
5000 µSTR
10000 µSTR
20000 µSTR
When using mV/V range
Measurement Range (FS)
0.25 mV/V
0.5 mV/V
1 mV/V
2.5 mV/V
5 mV/V
10 mV/V
Measurement Range
–500 to +500 µSTR
–1000 to +1000 µSTR
–2000 to +2000 µSTR
–5000 to +5000 µSTR
–10000 to +10000 µSTR
–20000 to +20000 µSTR
Measurement Range
–0.25 to +0.25 mV/V
–0.5 to +0.5 mV/V
–1 to +1 mV/V
–2.5 to +2.5 mV/V
–5 to +5 mV/V
–10 to +10 mV/V
DC accuracy1
±(0.5% of FS + 5 µSTR)
Maximum input voltage
(At 1 kHz or less)
Between Input+ and Input– 10 V (DC+ACpeak)
Maximum allowable
common mode voltage
(At 1 kHz or less)
Between each terminal and earth ground
42 V (DC+ACpeak) (CAT I and CAT II, 30 Vrms)
Input connector
NDIS connector (Recommended by JSNDI (The Japanese Society for Non-destructive Inspection)
Common mode rejection
ratio
80 dB (50/60 Hz) or more (typical2)
A/D conversion resolution
16 bit (48000 LSB/±FS: when Upper is +FS and Lower is –FS)
Temperature coefficient
Zero point: ±5 µSTR/°C (typical2)
Gain:
±(0.02% of FS)/°C (typical2)
Bandwidth limit
Select from OFF, 1 kHz, 100 Hz, and 10 Hz
Cutoff characteristics: –12 dB/OCT (typical2)
Function
mV/V support. Supports the strain gauge transducer unit system.
Standard accessories
NDIS connector (for external connection: PRC03-12A10-7M10.5 by Tajimi) A1002JC: 2 pieces
Compatible accessories (sold separately)
Recommended bridge head 701955
(NDIS 120 Ω, enhanced shield version, comes with a 5-m cable)
Recommended bridge head 701956
(NDIS 350 Ω, enhanced shield version, comes with a 5-m cable)
18-26
IM 701240-01E
18.12 Module Specifications
1
Item
Specifications
Precautions
• Highly sensitive measurements are made in the µV level in strain measurements. Therefore, take
measures against noise at the strain sensor perimeter, bridge head, and cable wiring.
• Depending on the noise environment, an error may result in the balance. Check the influence
before making measurements.
• The bridge head specified by YOKOGAWA has high noise resistance.
• Some of the strain gauge sensors and bridge heads made by other manufacturers do not have
sensing wires connected. (No such problems with bridge heads made by YOKOGAWA. ) If such
products are used, an error may result in the bridge voltage leading to measurement errors,
because sensing does not work effectively. If possible, it is desirable that sensing be done very
close to the bridge. However, if this is not possible, use the NDIS conversion cable (DV450-001)
that is sold separately by YOKOGAWA.
Outline specifications of the DV450-001: Sensing cable, NDIS male-female, 30 cm in length,
insert it as close to the bridge as possible.
• The connector shell is connected to the case potential.
• When a bridge head (701955 or 701956) is used, the connector shell, cable shield, and the
bridge head case are all connected to the case potential of the SL1400.
• When a bridge head (701955 or 701956) is used, the floating GND is connected to the bridge
head case inside the bridge head.
• Be sure to execute balancing again when you change the range or the bridge voltage.
2
3
4
5
6
7
1 Value measured under standard operating conditions (section 18.11).
2 Typical value represents a typical or average value. It is not strictly warranted.
8
Module front View
F
A
G
B
E
C
D
A: Bridge+ (positive bridge voltage)
B: Input- (negative measurement signal)
C: Bridge- (negative bridge voltage)
D: Input+ (positive measurement signal)
E: Floating common
F: Sense+ (positive bridge voltage sensing)
G: Sense- (positive bridge voltage sensing)
9
10
The connector shell is connected to the case potential.
11
WARNING
• Do not apply input voltage exceeding the maximum input voltage, withstand
voltage, or allowable surge voltage.
• To prevent electric shock, be sure to furnish protective earth grounding of the
SL1400.
• To prevent electric shock, be sure to fasten the module screws. Otherwise, the
electrical and mechanical protection functions will not be activated.
• Avoid continuous connection under an environment in which the allowable surge
voltage may occur.
12
13
14
15
Specifications
16
17
18
App
Index
IM 701240-01E
18-27
18.12 Module Specifications
Strain Module (DSUB, Shunt-Cal) (701271) Specifications
Item
Specifications
Standard operating
conditions
Temperature: 23±5°C
Humidity:
55±10% RH
After a 30-minute warm-up and after calibration and auto balance
Effective measurement
range
–FS to +FS (set using upper and lower limits)
Number of input channels
2
Maximum sample rate
100 kS/s
Input format
DC bridge (auto balancing), balanced differential input, and isolated
Auto balance type
Electronic auto balance
Auto balance range
±10000 µSTR (1 gauge method)
Bridge voltage
Select from 2 V, 5 V, and 10 V.
Gauge resistance
120 to 1000 Ω (bridge voltage: 2 V)
350 to 1000 Ω (bridge voltage: 2 V, 5 V, and 10 V)
Gauge factor
1.90 to 2.20 (set in 0.01 steps)
Frequency characteristics1 (–3 dB point when a sine wave with an amplitude equivalent to 60% of the range is applied) DC to
20 kHz
mV/V range support
Supports the strain gauge transducer unit system.
mV/V range = 0.5×(µSTR range/1000)
Measurement range (FS) and measurement range
When using STR range
Measurement Range (FS)
500 µSTR
1000 µSTR
2000 µSTR
5000 µSTR
10000 µSTR
20000 µSTR
When using mV/V range
Measurement Range (FS)
0.25 mV/V
0.5 mV/V
1 mV/V
2.5 mV/V
5 mV/V
10 mV/V
Measurement Range
–500 to +500 µSTR
–1000 to +1000 µSTR
–2000 to +2000 µSTR
–5000 to +5000 µSTR
–10000 to +10000 µSTR
–20000 to +20000 µSTR
Measurement Range
–0.25 to +0.25 mV/V
–0.5 to +0.5 mV/V
–1 to +1 mV/V
–2.5 to +2.5 mV/V
–5 to +5 mV/V
–10 to +10 mV/V
DC accuracy1
±(0.5% of FS + 5 µSTR)
Maximum input voltage
(At 1 kHz or less)
Between Input+ and Input– 10 V (DC+ACpeak)
Maximum allowable
common mode voltage
(At 1 kHz or less)
Between each terminal and earth ground
42 V (DC+ACpeak) (CAT I and CAT II, 30 Vrms)
Input connector
9-pin D-Sub connector (female)
Common mode rejection
ratio
80 dB (50/60 Hz) or more (typical2)
A/D conversion resolution
16 bit (48000 LSB/±FS: when Upper is +FS and Lower is –FS)
Temperature coefficient
Zero point: ±5 µSTR/°C (typical2)
Gain:
±(0.02% of FS)/°C (typical2)
Bandwidth limit
Select from OFF, 1 kHz, 100 Hz, and 10 Hz
Cutoff characteristics: –12 dB/OCT (typical2)
Function
mV/V support. Supports the strain gauge transducer unit system.
Shunt calibration support. Built-in shunt calibration relay (1 gauge method).
Standard accessories
Connector shell set for soldering
A1520JD (9-pin D-Sub): 2 pieces, A1618JD (connector shell): 2 pieces
Compatible accessories (sold separately)
Recommended bridge head 701957 (D-Sub 120 Ω, shunt-Cal, comes with a 5-m cable)
Recommended bridge head 701958 (D-Sub 350 Ω, shunt-Cal, comes with a 5-m cable)
18-28
IM 701240-01E
18.12 Module Specifications
1
Item
Specifications
Precautions
• Highly sensitive measurements are made in the µV level in strain measurements. Therefore, take
measures against noise at the strain sensor perimeter, bridge head, and cable wiring.
• Depending on the noise environment, an error may result in the balance. Check the influence
before making measurements.
• The bridge head specified by YOKOGAWA has high noise resistance.
• When executing shunt calibration, be sure to calculate the shunt resistance in advance, and
execute it in a range so that the measured values do not exceed the range even when the shunt
resistance is ON.
• Some of the strain gauge sensors and bridge heads made by other manufacturers do not have
sensing wires connected. (No such problems with bridge heads made by YOKOGAWA. ) If such
products are used, an error may result in the bridge voltage leading to measurement errors,
because sensing does not work effectively. Perform sensing as close to the bridge head as
possible. (There is no conversion cable for sensing on D-Sub connector types.)
• The connector shell is connected to the case potential.
• When a bridge head (701957 or 701958) is used, the connector shell, cable shield, and the
bridge head case are all connected to the case potential of the SL1400.
• When a bridge head (701957 or 701958) is used, the floating GND is connected to the bridge
head case inside the bridge head.
• Be sure to execute balancing again when you change the range or the bridge voltage.
2
3
4
5
6
7
1 Value measured under standard operating conditions (section 18.11).
2 Typical value represents a typical or average value. It is not strictly warranted.
8
Module front View
5
3
4
9
8
1
2
7
6
1: Floating common
2: Sense- (positive bridge voltage sensing)
3: Shuntcal- (negative shunt signal)
4: Shuntcal+ (positive shunt signal)
5: Sense+ (positive bridge voltage sensing)
6: Bridge- (negative bridge voltage)
7: Input- (negative measurement signal)
8: Input+ (positive measurement signal)
9: Bridge+ (positive bridge voltage)
9
10
11
WARNING
• Do not apply input voltage exceeding the maximum input voltage, withstand
voltage, or allowable surge voltage.
• To prevent electric shock, be sure to furnish protective earth grounding of the
SL1400.
• To prevent electric shock, be sure to fasten the module screws. Otherwise, the
electrical and mechanical protection functions will not be activated.
• Avoid continuous connection under an environment in which the allowable surge
voltage may occur.
12
13
14
15
Specifications
16
17
18
App
Index
IM 701240-01E
18-29
18.12 Module Specifications
Acceleration/Voltage Module (with AAF) (701275) Specifications
Item
Specifications
Standard operating
conditions
Temperature: 23±5°C
Humidity:
55±10% RH
After a 30-minute warm-up and after calibration
Effective measurement
range
Twice the measurement range
Number of input channels
2
Input coupling
AC, DC, ACCL (acceleration), and GND
Maximum sample rate
100 kS/s
Input format
Isolated unbalanced
1
Frequency characteristics
(–3 dB point when a sine wave with an amplitude equivalent to 60% of the range is applied)
Waveform measurement mode:
DC to 40 kHz
Acceleration measurement mode: 0.4 Hz to 40 kHz
Voltage-axis sensitivity
range
1:1 ProbeFactor: 50 mV to 100 V range (1-2-5 steps)
10:1 ProbeFactor: 500 mV to 1 kV range (1-2-5 steps)
(combined with the recommended probe 701940)
Acceleration (±5 V = ×1 range:
×0.1 to ×1 to ×100 (1-2-5 steps))
Maximum input voltage(At 1 kHz or less)
42 V (DC+ACpeak)2
Maximum allowable common mode voltage (at a frequency of 1 kHz or less)
Working voltage of safety standard
30 Vrms (CAT I and CAT II)3
Vertical (voltage) axis
accuracy
Waveform measurement mode DC accuracy:
Acceleration measurement mode:
±(0.25% of range)
±(0.5% of range) at 1 kHz
Input connector
Metal BNC connector
Input impedance
1 MΩ±1%, approx. 35 pF
Lower –3 dB point when
AC coupled
0.4 Hz or less (0.04 Hz or less when using the 701940) (typical4)
Common mode rejection
ratio
80 dB (50/60 Hz) or more (typical4)
Residual noise level
(Input section shorted)
±100 µV or ±0.1% of the range, whichever is greater (typical4)
A/D conversion resolution
16 bits (24000 LSB/range)
Temperature coefficient
When in waveform measurement mode (excluding AUTO filter)
Zero point: ±(0.02% of range)/°C (typical4)
Gain:
±(0.02% of range)/°C (typical4)
Bandwidth limit
Select from OFF, Auto, 4 kHz, 400 Hz, and 40 Hz
Cutoff characteristics: –12 dB/OCT (typical4, excluding AUTO)
Cutoff frequency (fc) when set to AUTO
Sample rate of 100 kHz or higher:
Sample rate of 100 Hz to 50 kHz:
Sample rate of 50 Hz or less:
Cutoff characteristics when set to AUTO:
Probe attenuation setting
fc = 40 kHz
fc = 40% of the sample rate
fc = 20 Hz
–65 dB at 2×fc (typical4)
Voltage probe 1:1, 10:1, 100:1, and 1000:1
Current probe 10 A:1 V (for the 701933) and 100 A:1 V (for the 701930/701931)
Compatible probes/cables Connection cable (for low voltage 1:1)
366926 (non-isolated type BNC-alligator clip × 2: For measuring low voltage less than or equal
to 42 Vpeak)
Voltage probe (10:1 passive probe) 701940
17 to 46 pF: For measuring 600 V (DC+ACpeak) or less
Current probe (power can be supplied from the SL1400)
701930 (150 A), 701931 (500 A), and 701933 (30 A)
Sensor supply current
(voltage)
OFF or 4 mA±10% (approx. 22 VDC)
Applicable acceleration
sensor
Built-in amplifier type
Kistler Instrument Corporation: Piezotron, PCB Piezotronics Incorporated: ICP, ENDEVCO
Corporation: ISOTRON, etc.
18-30
IM 701240-01E
18.12 Module Specifications
Item
1
Specifications
Table of cutoff frequency characteristics of the anti-aliasing filter (AAF)
When the filter is set to Auto, the anti-aliasing filter and low-pass filter are automatically set
according to the sample rate.
Sample rate
AAF
Low-Pass Filter
100 kS/s
50 kS/s
20 kS/s
10 kS/s
5 kS/s
2 kS/s
1 kS/s
500 S/s
200 S/s
100 S/s
50 S/s
20 to 5 S/s
2 S/s or less
Ext sample
40 kHz
20 kHz
8 kHz
4 kHz
2 kHz
800 Hz
400 Hz
200 Hz
80 Hz
40 Hz
20 Hz
20 Hz
20 Hz
40 kHz
OFF
OFF
OFF
4 kHz
4 kHz
4 kHz
400 Hz
400 Hz
400 Hz
40 Hz
40 Hz
40 Hz
40 Hz
OFF
2
3
4
5
6
7
1 Value measured under standard operating conditions (section 18.11).
Combined with the 10:1 passive probe
(701940)
H
2.
3.
9
H
BNC
L
8
Direct input (cable not complying with
the safety standard)
2.
L
3.
10
11
4 Typical value represents a typical or average value. It is not strictly warranted.
12
WARNING
13
14
15
Specifications
• Do not apply input voltage exceeding the maximum input voltage, withstand
voltage, or allowable surge voltage.
• To prevent electric shock, be sure to furnish protective earth grounding of the
SL1400.
• To prevent electric shock, be sure to fasten the module screws. Otherwise, the
electrical and mechanical protection functions will not be activated.
• Avoid continuous connection under an environment in which the allowable surge
voltage may occur.
16
17
18
App
Index
IM 701240-01E
18-31
18.12 Module Specifications
Frequency Module (701280) Specifications
Item
Specifications
Standard operating
conditions
Temperature: 23±5°C
Humidity:
55±10% RH
After the warm-up time of 30 minutes has elapsed
Measurement function
Frequency, RPMs, RPSs, period, duty cycle, power supply frequency, pulse width, pulse integration,
and velocity
Effective measurement
range
Twice the measurement range
Number of input channels
2
Data update rate
25 kHz (40 µs)
Output delay
Up to 2 computation periods
Input format
Isolated unbalanced
Input connector
BNC connector (isolated type)
Maximum input voltage
Module only (when 1:1 cable is connected, across input terminals H and L): 42 V (DC+ACpeak)4
Combined with the 700929 (10:1) (across the probe tips, H and L):
420 V (DC+ACpeak)2
Maximum allowable
common mode voltage
Working voltage of safety standard
Module only (when 1:1 cable is connected, across input terminal L and earth)
30 Vrms (CAT I and CAT II)5
Combined with the 700929 (10:1) (across probe tip H or L and earth)
300 Vrms (CAT I and CAT II)3
Insulation resistance
500 VDC, 10 MΩ or more (across each input terminal and earth)
Minimum measurement
resolution
50 ns
Measured data resolution
16 bits (24000 LSB/range)
Measurement accuracy1
• When in frequency, RPM, RPS, or velocity measurement mode6
Measurement accuracy is specified according to the measurement range and input frequency
[Definition of measurement accuracy]
±(0.05% of range + accuracy dependent on the input frequency)
[Accuracy dependent on the input frequency]
Input frequency of 2 or less:
0.05% of the input frequency + 0.001 Hz
Input frequency of 2 to 10 kHz:
0.1% of the input frequency
Input frequency of 10 to 20 kHz:
0.3% of the input frequency
Input frequency of 20 or higher:
0.5% of the input frequency
• When in power supply frequency mode7
When the center frequency is 50/60 Hz
±0.03 Hz (0.01 Hz resolution)
When the center frequency is 400 Hz:
±0.3 Hz (0.01 Hz resolution)
(Input set to 100 VAC or 200 VAC with sine wave input)
• When in period measurement mode*6
Measurement accuracy is specified according to the measurement range and input period
[Definition of measurement accuracy]
±(0.05% of range + accuracy dependent on the input period)
[Accuracy dependent on the input period]
Input period of 500 µs or greater:
0.05% of the input period
Input period of 100 to 500 µs:
0.1% of the input period
Input period of 50 to 100 µs:
0.3% of the input period
Input period of 50 µs or less:
0.5% of the input period + 0.1 µs
• When in duty cycle measurement mode8
Dependent on the input frequency
Input frequency of 1 kHz or less:
±0.1%
Input frequency of 1 to 10 kHz:
±0.2%
Input frequency of 10 to 50 kHz:
±1.0%
Input frequency of 50 to 100 kHz:
±2.0%
Input frequency of 100 to 200 kHz:
±4.0%
• When in pulse width measurement mode*8
Measurement accuracy is specified according to the measurement range and input pulse width
[Definition of measurement accuracy]
±(0.05% of range + accuracy dependent on the input pulse width)
[Accuracy dependent on the input pulse width]
Input pulse width of 500 µs or greater:
0.05% of the input pulse width
Input pulse width of 100 to 500 µs:
0.1% of the input pulse width
Input pulse width of 50 to 100 µs:
0.3% of the input pulse width
Input pulse width of 50 µs or greater:
0.5% of the input pulse width + 0.1 µs
18-32
IM 701240-01E
18.12 Module Specifications
Item
1
Specifications
Input voltage range (±FS)1:1 ProbeFactor:
±1 V, ±2 V, ±5 V, ±10 V, ±20 V, and ±50 V(±FS)
10:1 ProbeFactor: ±10 V, ±20 V, ±50 V, ±100 V, ±200 V, 500 V(±FS)
(combined with the recommended probe 700929)
Input impedance
2
1 MΩ±1%, approx. 35 pF
Pull-up function: 4.7 kΩ, approx. 5 V (pull-up can be turned ON only when the input is set to Pull-Up
5V)
Input coupling
3
AC and DC
4
Probe attenuation setting
10:1 and 1:1
Minimum voltage width
for pulse detection
200 mVP-P
Bandwidth limit
Select from Full, 100 kHz, 10 kHz, 1 kHz, and 100 Hz
Cutoff characteristics: –12 dB/OCT (typical9)
5
Threshold
Set within the FS of the voltage range. Set in units of 1% of the FS.
Hysteresis
Select ±1%, ±2.5%, or ±5% of the FS of the voltage range
Preset function
Logic (5V/3V/12V/24V), electromagnetic pickup, zero crossing, pull-up, AC100V, AC200V, and
user-defined
Slope selection
Select rising or falling
Lower –3 dB point when
AC coupled
0.5 Hz or less (0.05 Hz or less when using the 700929) (typical9)
6
Chatter elimination function OFF or 1 to 1000 ms (1 ms resolution)
Eliminates the chatter that occurs such when the contact input is turned ON/OFF. Can discard the
signal changes over the specified interval.
Input status indication
function
Input status indication through the LEDs of each channel
When in operation: Illuminates in green when pulse input is detected
When overdriven: Illuminates in red when the input voltage exceeds the range
7
8
9
10
Compatible probes/cables Connection cable (1:1): Recommended 1
366926
Voltage probe (10:1 safety probe): Recommended 2
700929 (10:1 safety probe) 20 to 45 pF: For measuring 1000 V (DC+ACpeak) or less
11
1 Value measured under standard operating conditions (section 18.11).
Combined with the 700929
H
H
700929
12
Direct input (cable not complying with the safety standard)
BNC
2.
L
3.
13
4.
L
5.
3.
14
Withstand voltage: 1500 Vrms for 1 minute
Allowable transient surge voltage (between earth and input): ±2100 Vpeak
15
Specifications
6 Input waveform of 1 Vpp, rectangular wave, rise/fall time within 1 µs (input range: ±10 V, bandwidth limit: Full, and
hysteresis: ±1%)
7 Input waveform of 90 Vrms, sine wave (input range: AC100V, bandwidth limit 100 kHz, and hysteresis: ±1%)
8 Input waveform of 1 Vpp, rectangular wave, rise/fall time within 5 ns (input range: ±10 V, bandwidth limit: Full, and hysteresis: ±1%)
9 Typical value represents a typical or average value. It is not strictly warranted.
16
17
WARNING
• Do not apply input voltage exceeding the maximum input voltage, withstand
voltage, or allowable surge voltage.
• To prevent electric shock, be sure to furnish protective earth grounding of the SL1400.
• To prevent electric shock, be sure to fasten the module screws. Otherwise, the
electrical and mechanical protection functions will not be activated.
• Avoid continuous connection under an environment in which the allowable surge
voltage may occur.
IM 701240-01E
18-33
18
App
Index
18.12 Module Specifications
Specifications by Measurement Modes
Item
Specifications
Frequency
Measurable frequency range
Selectable vertical axis sensitivity range
Minimum resolution
RPMs
Measurable RPMs range
Selectable vertical axis sensitivity range
Computing method
Selectable pulse/rotate range
RPSs
Measurable RPSs range
Selectable vertical axis sensitivity range
Computing method
Selectable pulse/rotate range
0.01 Hz to 200 kHz
1 Hz to 500 kHz range (1-2-5 steps)
0.001 Hz
0.01 to 100000 rpm (where the input frequency is DC to 200 kHz).
1 to 100000 rpm range (1-2-5 steps)
Computed from the frequency based on the number of pulses per rotation
RPMs = Frequency/(pulse/rotate value) × 60
1 to 99999
0.001 to 2000 rps (where the input frequency is DC to 200 kHz).
0.1 to 2000 rps range (1-2-5 steps)
Computed from the frequency based on the number of pulses per rotation
RPSs = Frequency/(pulse/rotate value)
1 to 99999
Period
Measurable period range
Selectable vertical axis sensitivity range
Minimum resolution
5 µs to 50 s (where the minimum pulse width is 2 µs
100 µs to 50 s range (1-2-5 steps)
0.1 µs
Duty cycle
Measurable duty cycle range
Selectable vertical axis sensitivity range
Measurable frequency range
Measurement pulse selection
Minimum resolution
0 to 100%
10 to 200% range (1-2-5 steps)
0.1 Hz to 200 kHz
Select positive or negative pulse
0.01%
Power supply frequency
Measurable frequency range
Selectable vertical axis sensitivity range
Center frequency setting
Minimum resolution
Pulse width
Measurable pulse width
Selectable vertical axis sensitivity range
Measurement pulse selection
Minimum resolution
Pulse integration
Maximum pulse count
Selectable vertical axis sensitivity range
Frequency measuring range
Computation function
Selectable Unit/Pulse range
Counter reset
Speed
Selectable vertical axis sensitivity range
Computing method
Selectable Distance/Pulse range
18-34
30 to 70 Hz (when the center frequency is 50 Hz), 40 to 80 Hz (when the
center frequency is 60 Hz), 380 to 420 Hz (when the center frequency is
400 Hz)
1 to 20 Hz range (resolution: 0.01 Hz)
Select from 50 Hz, 60 Hz, and 400 Hz
0.0 1Hz
2 µs to 50 s (where the input frequency is up to 200 kHz)
100 µs to 50 s range (1-2-5 steps)
Select positive or negative pulse
0.1 µs
2×10⁹ pulses
5.000E+21 to 100.0E–21 range (1-2-5 steps: total of 123 steps)
0.1 Hz to 200 kHz (where the minimum pulse width is 2 µs)
Set the physical amount per pulse and display by converting the values into
physical values such as distance and flow rate.
–9.9999E+30 to +9.9999E+30
Manual reset and over-limit reset
5.000E+21 to 100.0E–21 range (1-2-5 steps: total of 123 steps)
Set the amount of displacement per pulse and compute the velocity from
the frequency
Automatic unit time conversion of s, min, and hour.
–9.9999E+30 to +9.9999E+30
IM 701240-01E
18.12 Module Specifications
1
Functional Specifications
Item
Specifications
Deceleration prediction
Computes the deceleration condition in realtime when the pulse input is cut off.
Can be specified when measuring the frequency, RPMs, RPSs, period, and velocity
2
Stop prediction
Sets the frequency to 0 after a certain time elapses after the pulse input is cut off.
Stop interval setting: Set in the range of 1.5 to 10 times (10 settings) the period of the pulse
measured last
Can be specified when measuring the frequency, RPMs, RPSs, period, and velocity
3
Smoothing
Computes the moving average of the measured data using the specified time
Specified time: 0.1 to 1000 ms (0.1 ms resolution)
Can be specified on all measurement parameters
4
Pulse average
Performs frequency measurement per specified number of pulses. When fluctuation exists
periodically in the pulse interval, the fluctuation can be eliminated.
Specified number of pulses: 1 to 4096
Can be specified when measuring the frequency, RPMs, RPSs, power supply frequency, period,
pulse integration, and velocity
5
Offset function
Observe fluctuation with respect to the offset frequency
Offset range:
Can be set up to 1000 times the maximum value/div value
• Frequency:
0 Hz to 200 kHz
• RPMs:
0 rpm to 50 krpm
• RPSs:
0 to 1000 rps
• Period:
0 to 50 s
• Duty:
0 to 100%
• Pulse width:
0 to 50 s
• Pulse integration: –1.0000×10²² to 1.0000×10²²
• Velocity:
–1.0000×10²² to 1.0000×10²²
6
7
8
9
10
11
12
13
14
15
Specifications
16
17
18
App
Index
IM 701240-01E
18-35
18.13 Logic Probe Specifications
High-Speed Logic Probe (700986) Specifications
Item
Specifications
Number of inputs
8
Input format
Non-isolated (earth of all bits is common, SL1400 earth and earth of all bits are common)
Maximum input voltage
42 V (DC+ACpeak) (CAT I and CAT II, 30 Vrms) across the probe tip and earth
(At 1 kHz or less)
Response time
1 µs or less
Input impedance
100 kΩ or more
Threshold level
Approx. 1.4 V
Isolation Logic Probe (700987) Specifications
Item
Specifications
Number of inputs
8
Input format
Isolated (all bits are isolated)
Input connector
Safety terminal type (for banana plug) × 8
Input switching
Switchable between AC and DC for each bit
Input signal display
High and low indicated by an LED for each bit (illuminated when high)
Applicable input range
DC input:
AC input:
High/Low detection for 10 to 250 VDC
High/Low detection for a 50/60-Hz AC system for 80 to 250 VAC
Threshold level
DC input:
AC input:
6 V ± 50% (high level: 10 to 250 VDC, low level: 0 to 3 VDC)
50 VAC ± 50% (high level: 80 to 250 VAC, low level: 0 to 20 VAC)
Response time
DC input:
AC input:
Within 1 ms
Within 20 ms
Input impedance
Approx. 100 kΩ
Maximum input voltage
250 Vrms1 (CAT I and CAT II)
(across H and L of each bit)
Maximum allowable
250 Vrms1 (CAT I and CAT II)
common mode voltage
(across the input terminal, H or L, and earth)
Maximum allowable
voltage between bits
250 Vrms1 (CAT I and CAT II)
Withstand voltage
2000 VAC for 1 minute
(across input terminal and earth)
Insulation resistance
500 VDC, 10 MΩ or more
(across input terminal and earth)
Fuse2
Location
H side of input terminal
Max. Rated Voltage
250 V
Max. Rated Current
50 mA
Type
Time lag
Standard
VDE/SEMKO
certified
1 Make sure the ACpeak voltage does not exceed 350 V and the DC voltage does not exceed 250 V when the frequency is
1kHz or less.
2 Because all the fuses used by this instrument are inside the case, the user cannot exchange them. If you believe a fuse inside
the case is blown, contact your nearest YOKOGAWA dealer.
Logic Probe (702911 and 702912) Specifications
Item
Specifications
Number of inputs
8
Input format
Non-isolated (earth of all bits is common, SL1400 earth and earth of all bits are common)
Maximum input voltage
±35 V
Response time
3 µs or less
Input impedance
10 kΩ or greater
Threshold level
Approx. 1.4 V
Input type
TTL level or contact input (switching type)
18-36
IM 701240-01E
1
18.14 External Dimensions
2
SL1400
Unit: mm
3
Rear View
4
5
6
7
8
9
10
13.5
355
4
11
225
9
12
250
13
14
15
Specifications
8
16
Unless otherwise specified, tolerance is ±3% (however, tolerance is ±0.3 mm when
below 10 mm).
17
18
App
Index
IM 701240-01E
18-37
18.14 External Dimensions
Module
High-Speed 10 MS/s, 12-Bit Isolation Module (701250)
High-Speed High-Resolution 1 MS/s, 16-Bit Isolation Module (701251)
High-Speed 10 MS/s, 12-Bit Non-Isolation Module (701255)
High-Voltage 100 kS/s, 16-Bit Isolation Module (with RMS) (701260)
24.5
8.4
108.5
200.9
Universal (Voltage/Temp.) Module (701261)
Universal (Voltage/Temp.) Module (with AAF) (701262)
Temperature, High Precision Voltage Isolation Module (701265)
(7.2)
208.1
200.9
8.4
108.5
24.5
Strain Module (DSUB, Shunt-Cal) (701271)
Strain Module (NDIS) (701270)
24.5
8.4
24.5
200.9
18-38
8.4
24.5
200.9
8.4
108.5
ACT
OVER
108.5
ACT
OVER
4mA 22V
4mA 22V
8.4
Frequency Module (701280)
Acceleration/Voltage Module (with AAF) (701275)
24.5
200.9
108.5
108.5
200.9
IM 701240-01E
Appendix
Appendix 1
Relationship between the Record
Time, Sample Rate and Record Length
in Memory Mode
10 M
100 µs
200 µs
500 µs
1 ms
2 ms
5 ms
10 ms
20 ms
50 ms
100 ms
200 ms
500 ms
1s
2s
5s
10 s
20 s
30 s
50 s
1 min
100 s
200 s
5 min
10 min
20 min
30 min
50 min
1 hour
100 min
2 hour
5 hour
10 hour
20 hour
30 hour
50 hour
100 hour
5 day
10 day
20 day
30 day
1k
2k
5k
10 k
20 k
50 k
100 k
200 k
500 k
1M
2M
5M
10 M
20 M
50 M
—
—
—
—
—
—
—
—
—
—
—
—
—
—
—
—
—
—
—
—
—
—
—
—
—
5M
2M
1M
—
—
—
—
—
1k
1k
—
2.5 k
2k
1k
5k
4k
2k
10 k
5k
25 k 10 k
50 k 20 k 10 k
100 k 40 k 20 k
250 k 100 k 50 k
500 k 200 k 100 k
1 M 400 k 200 k
1 M 500 k
2.5 M
2M 1M
5M
4M 2M
10 M
25 M 10 M 5 M
50 M 20 M 10 M
— 40 M 20 M
— 30 M
—
— 50 M
—
—
—
—
—
—
—
—
—
—
—
—
—
—
—
—
—
—
—
—
—
—
—
—
—
—
—
—
—
—
—
—
—
—
—
—
—
—
—
—
—
—
—
—
—
—
—
—
—
—
—
—
—
—
—
—
—
—
—
—
—
—
—
—
500 k 200 k 100 k
—
—
—
—
—
—
—
—
—
—
—
—
1k
—
—
2.5 k
1k
—
5k
2k
1k
10 k
4k
2k
25 k 10 k
5k
50 k 20 k 10 k
100 k 40 k 20 k
250 k 100 k 50 k
500 k 200 k 100 k
1 M 400 k 200 k
2.5 M
1 M 500 k
5M
2M
1M
10 M
4M
2M
15 M
6M
3M
25 M 10 M
5M
30 M 12 M
6M
50 M 20 M 10 M
— 40 M 20 M
—
— 30 M
—
—
—
—
—
—
—
—
—
—
—
—
–
—
—
—
—
—
—
—
—
—
—
—
—
—
—
—
—
—
—
—
—
—
—
—
—
—
—
—
—
—
—
—
—
—
—
—
—
—
—
50 k
20 k
—
—
—
—
—
—
—
1k
2.5 k
5k
10 k
25 k
50 k
100 k
250 k
500 k
1M
1.5 M
2.5 M
3M
5M
10 M
15 M
30 M
—
—
—
—
—
—
—
—
—
—
—
—
—
—
—
—
—
—
—
—
—
—
—
—
1k
2k
4k
10 k
20 k
40 k
100 k
200 k
400 k
600 k
1M
1.2 M
2M
4M
6M
12 M
24 M
36 M
—
—
—
—
—
—
—
—
—
—
—
—
—
—
10 k
—
—
—
—
—
—
—
—
—
1k
2k
5k
10 k
20 k
50 k
100 k
200 k
300 k
500 k
600 k
1M
2M
3M
6M
12 M
18 M
30 M
36 M
—
—
—
—
—
—
—
—
—
—
—
—
5k
—
—
—
—
—
—
—
—
—
—
1k
2.5 k
5k
10 k
25 k
50 k
100 k
150 k
250 k
300 k
500 k
1M
1.5 M
3M
6M
9M
15 M
18 M
30 M
36 M
—
—
—
—
—
—
—
—
—
—
2
3
Sample Rate (S/s)
Rec.
Time
1
2k
—
—
—
—
—
—
—
—
—
—
—
1k
2k
4k
10 k
20 k
40 k
60 k
100 k
120 k
200 k
400 k
600 k
1.2 M
2.4 M
3.6 M
6M
7.2 M
12 M
14.4 M
36 M
—
—
—
—
—
—
—
—
—
1k
—
—
—
—
—
—
—
—
—
—
—
—
1k
2k
5k
10 k
20 k
30 k
50 k
60 k
100 k
200 k
300 k
600 k
1.2 M
1.8 M
3M
3.6 M
6M
7.2 M
18 M
36 M
—
—
—
—
—
—
—
—
500
—
—
—
—
—
—
—
—
—
—
—
—
—
1k
2.5 k
5k
10 k
15 k
25 k
30 k
50 k
100 k
150 k
300 k
600 k
900 k
1.5 M
1.8 M
3M
3.6 M
9M
18 M
36 M
—
—
—
—
—
—
—
100
50
20
10
5
200
—
—
—
—
—
—
—
— length
— unit:
—Word —
— Record
—
—
—
—
—
—
—
—
—
—
—
—
—
—
—
—
—
—
—
—
—
—
—
—
—
—
—
—
—
—
—
—
—
—
—
—
—
—
—
—
—
—
—
—
—
—
—
—
—
—
—
—
—
—
—
—
—
—
—
—
—
—
—
—
—
—
—
—
—
—
—
—
Roll mode
1k
—
—display*
—
—
—
2k
—
—
—
—
1k
4k
1k
—
—
—
2k
6k
600
—
—
3 k 1.5 k
10 k
1k
—
—
5 k 2.5 k
12 k
3 k 1.2 k
600
—
6k
20 k
5k
2k
1k
—
10 k
40 k
10 k
4k
2k
1k
20 k
60 k
15 k
6k
3 k 1.5 k
30 k
120 k
30 k
12 k
6k
3k
60 k
240 k 120 k
60 k
24 k
12 k
6k
360 k 180 k
90 k
36 k
18 k
9k
600 k 300 k 150 k
60 k
30 k
15 k
720 k 360 k 180 k
72 k
36 k
18 k
1.2 M 600 k 300 k 120 k
60 k
30 k
1.44 M 720 k 360 k 144 k
72 k
36 k
3.6 M 1.8 M 900 k 360 k 180 k
90 k
7.2 M 3.6 M 1.8 M 720 k 360 k 180 k
14.4 M 7.2 M 3.6 M 1.44 M 720 k 360 k
21.6 M 10.8 M 5.4 M 2.16 M 1.08 M 540 k
36 M 18 M
9 M 3.6 M 1.8 M 900 k
— 36 M 18 M 7.2 M 3.6 M 1.8 M
— 43.2 M 21.6 M 8.64 M 4.32 M 2.16 M
—
— 43.2 M 17.28 M 8.64 M 4.32 M
—
— 34.56 M 17.28 M 8.64 M
—
— 25.92 M 12.96 M
—
—
—
4
5
6
7
8
9
10
11
12
13
14
15
When the acquisition mode is not Average
When the acquisition mode is Average
All channels can be used
16
Record length 5 MW or less: Up to 11 channels can be used
Record length 10 MW or less: Up to 5 channels can be used
Record length 1 MW or less:
All channels can be used
17
Appendix
Record length 25 MW or less: Up to 3 channels can be used
Record length 50 MW or less: Up to 1 channel can be used
–
18
Not selectable
* For settings below the thick line (record length of 1 s or longer), roll mode display is enabled
when the trigger mode is auto, auto level, single, or log.
App
Index
IM 701240-01E
App-1
Appendix 2
Relationship between the Chart Speed,
Sample Rate and Record Length in
Recorder Mode
The relationship between the chart speed, sample rate, and record length during Chart
Recorder mode (see chapter 9) is as follows:
Chart Speed
Sample Rate
(S/s)
Record Length
(Word)
Maximum Number
of Divisions That
Can Be Saved
Record Time
20 mm/s
10 mm/s
5 mm/s
2 mm/s
1 mm/s
5k
2k
1k
500
200
2.5 M
2M
2M
2.5 M
2M
1000
1000
1000
1000
1000
8.33 min
16.66 min
33.3 min
1.38 h
2.76 h
100 mm/min
50 mm/min
25 mm/min
20 mm/min
10 mm/min
5 mm/min
2 mm/min
1 mm/min
200
200
100
50
20
20
5
5
1.2 M
2.4 M
2.4 M
1.5 M
1.2 M
2.4 M
1.5 M
1.5 M
1000
1000
1000
1000
1000
1000
1000
500
1.66 h
3.33 h
6.66 h
8.33 h
16.6 h
1.38 day
3.47 day
3.47 day
100 mm/h
50 mm/h
25 mm/h
20 mm/h
10 mm/h
5
5
5
5
5
1.8 M
1.8 M
1.8 M
1.8 M
1.8 M
1000
500
250
200
100
4.16 day
4.16 day
4.16 day
4.16 day
4.16 day
The sample rates in the table above are the data acquisition rate to the internal memory
when the acquisition mode is set to normal.
If the acquisition mode is set to envelope, the data is acquired at the maximum sample
rate of each input module. Then, the maximum and minimum values are determined over
each interval defined by the sample rate in the table above and stored in the internal
memory.
App-2
IM 701240-01E
Appendix 3
Maximum Number of Acquisitions to
the History Memory and Time Axis
Range That Allows Realtime
Recording
Maximum Number of Acquisitions to the History Memory
Maximum Number
of Acquisitions
1k
2.5 k
5k
10 k
25 k
50 k
100 k
250 k
500 k
1M
2.5 M
5M
10 M
25 M
50 M
2000
483
324
241
121
60
29
11
4
3
1
1
1
1
1
2
3
4
The maximum number of acquisitions is as follows:
Record Length
1
5
6
7
8
9
Record length unit: Word
10
Time Axis Range That Allows Realtime Recording and Maximum Sample Rate
The time axis range and maximum sample rate vary depending on the number of
channels as follows:
Channels Used
Time Axis Range
Maximum Sample Rate
12 or more
6 to 11 channels
4 to 5 channels
3 channels
1 to 2 channels
200 s to 30 day
1 min to 30 day
30 s to 30 day
20 s to 30 day
10 s to 30 day
5 kS/s
10 kS/s
20 kS/s
50 kS/s
100 kS/s
11
12
13
14
15
16
Appendix
17
18
App
Index
IM 701240-01E
App-3
Appendix 4
How to Calculate the Area of a
Waveform
Integ1TY
Total Area for Positive Side Only: S1+S2
S2
S1
Integ2TY
Total Area for both Positive and Negative Sides: S1+S3–S2
S3
S1
S2
Integ1XY
(1) Multiple Loops
(2) Non-Closed Curve
Area S= n×S0
n: Number of Loops
S0
S0
Start Point
Start Point,
Stop Point
Stop Point
Waveform
(3) Loop Tracing a Figure-Eight
(4) Spiral Loop
Area S= | S0– S1 |
S1
S1
S0
Start
Point
S0
Start Point
Stop Point
App-4
Area S= S0
Area Enclosed by
a Curve Connecting
the Start and Stop
Points
Area S= S0×2+S1
Number of Overlaps
Varies According to
the Number of Loops.
Stop Point
IM 701240-01E
Appendix 4 How to Calculate the Area of a Waveform
1
Integ2XY
(1) When Only One Y Data Corresponds to X Data
1
3
Stop Point
Start Point
2
X Axis (Y=0)
Area S= –S0
S0
Area S=S0
S0
3
Stop Point
Start Point
4
X Axis (Y=0)
2
4
Start Point
Stop Point
X Axis (Y=0)
Area S= –S0
S0
5
Area S=S0
S0
Start Point
Stop Point
6
X axis (Y=0)
(2) When the Waveform Extends into the Negative Side
7
Start Point
8
S0
S1
X Axis (Y=0)
Area S=S0–S1
Stop Point
9
(2) When Two or more Y Data Correspond to X Data
Start Point
Area S=S0
S0
S1
Stop Point
X Axis (Y=0)
10
S0
Stop
Point
Start Point
Area S=S0+2×S1+S2
11
S2
X Axis (Y=0)
12
13
14
15
16
Appendix
17
18
App
Index
IM 701240-01E
App-5
Appendix 5
ASCII Header File Format
//YOKOGAWA ASCII
App-6
FILE FORMAT
$PublicInfo
FormatVersion
Model
Endian
DataFormat
GroupNumber
TraceTotalNumber
DataOffset
1.11
SL1400
Big
Trace
4
13
111548
$Group1
TraceNumber
BlockNumber
TraceName
BlockSize
VResolution
VOffset
VDataType
VUnit
VPlusOverData
VMinusOverData
VIllegalData
VMaxData
VMinData
HResolution
HOffset
HUnit
Date
Time
4
1
CH1
10010
4.1666667E-04
1.0000000E+00
IS2
?
?
?
-32768
32767
-32767
2.0000000E-04
-2.0018000E+00
s
2006/1/15
14:25:38.54
CH2
10010
2.0833333E-02
0.0000000E+00
IS2
V
?
?
-32768
32767
-32767
2.0000000E-04
-2.0018000E+00
s
2006/1/15
14:25:38.54
CH3
10010
2.0833333E-02
0.0000000E+00
IS2
V
?
?
-32768
32767
-32767
2.0000000E-04
-2.0018000E+00
s
2006/1/15
14:25:38.54
CH4
10010
2.0833333E-02
0.0000000E+00
IS2
V
?
?
-32768
32767
-32767
2.0000000E-04
2.0018000E+00
s
2006/1/15
14:25:38.54
$Group2
TraceNumber
BlockNumber
TraceName
BlockSize
VResolution
VOffset
VDataType
VUnit
VPlusOverData
VMinusOverData
VIllegalData
VMaxData
VMinData
HResolution
4
1
CH5
10010
2.0833333E-03
0.0000000E+00
IS2
V
?
?
-32768
32767
-32767
2.0000000E-04
CH6
10010
2.0833333E-03
0.0000000E+00
IS2
V
?
?
-32768
32767
-32767
2.0000000E-04
CH7
10010
2.0833333E-03
0.0000000E+00
IS2
V
?
?
-32768
32767
-32767
2.0000000E-04
CH8
10010
2.0833333E-03
0.0000000E+00
IS2
V
?
?
-32768
32767
-32767
2.0000000E-04
IM 701240-01E
Appendix 5 ASCII Header File Format
HOffset
HUnit
Date
Time
-2.0018000E+00
s
2006/1/15
14:25:38.54
$Group3
TraceNumber
BlockNumber
TraceName
BlockSize
VResolution
VOffset
VDataType
VUnit
VPlusOverData
VMinusOverData
VIllegalData
VMaxData
VMinData
HResolution
HOffset
HUnit
Date
Time
-2.0018000E+00
s
2006/1/15
14:25:38.54
2.0018000E+00
s
2006/1/15
14:25:38.54
1
2
3
4
1
CH15
10010
4.1666667E-01
0.0000000E+00
IS2
Hz
?
?
-32768
32767
-32767
2.0000000E-04
-2.0018000E+00
s
2006/1/15
14:25:38.54
$PrivateInfo
DisplayPointNo.
1
1
1
1
MathBlockNo.
1
ModelVersion
3.1
PTraceName
CH1
CH5
CH15
PUpperScaleData 6.00E+00
25.000V
5000.0Hz
PLowerScaleData -4.00E+00
-25.000V
-5000.0Hz
0.00000V
0.00000V
0.00000Hz
CH16
10010
4.1666667E-01
0.0000000E+00
IS2
Hz
?
?
-32768
32767
-32767
2.0000000E-04
-2.0018000E+00
s
2006/1/15
14:25:38.54
Math1
10010
2.0833333E-04
2.0000000E+00
IS2
EU
?
?
-32768
32767
-32767
2.0000000E-04
-2.0018000E+00
s
2006/1/15
14:25:38.54
Math2
10010
2.0833332E-05
0.0000000E+00
IS2
EU
?
?
-32768
32767
-32767
2.0000000E-04
2.0018000E+00
s
2006/1/15
14:25:38.54
1
1
1
1
1
1
1
1
1
4
5
6
7
8
9
10
11
12
13
CH2
CH6
CH16
250.0V
25.000V
5000.0Hz
-250.0V
-25.000V
CH3
CH7
Math1
250.00V
25.000V
4.50000E+00EU
-250.00V
-25.000V
CH4
CH8
Math2
250.00V
25.000V
250.000E-03EU
-250.00V
-25.000V
-5000.0Hz
0.00000V
0.00000V
0.00000Hz
-500.000E-03EU
0.00000V
0.00000V
250.000E-03EU
0.00000V
0.00000V
14
15
16
17
Appendix
POffsetName
-2.0018000E+00
s
2006/1/15
14:25:38.54
18
Note
The header file is a common file used by YOKOGAWA’s measuring instruments. Therefore,
data that is not required by the SL1400 (0s) is also included.
App
Index
IM 701240-01E
App-7
Appendix 5 ASCII Header File Format
$PublicInfo (Common Information)
FormatVersion:
Header file version number (common to YOKOGAWA’s header
files)
Model:
Model name
Endian:
Endian mode when saving data (Big/Ltl)1
DataFormat:
Storage format of the binary waveform data (Trace/Block)2
GroupNumber:
The number of “$Group”s indicated below
TraceTotalNumber: Total number of selected waveforms
DataOffset:
Binary file start position3
$Group1 (Group Information)
TraceNumber:
BlockNumber:
TraceName:
BlockSize:
VResolution:
Number of waveforms in this group
Number of blocks in this group4
Name of each waveform
Number of data points in a single block of each waveform
Value of coefficient VResolution of the Y-axis conversion equation
of each waveform5
VOffset:
Value of coefficient VOffset of the Y-axis conversion equation of
each waveform5
VDataType:
Type of binary file waveform data for each waveform6
VUnit:
Unit used on the Y-axis of each waveform (no effect on the data)
VPlusOVerData:
Error data when the binary data of each waveform is greater than
or equal to this value
VMinusOVerData: Error data when the binary data of each waveform is less than or
equal to this value
VMaxData:
Maximum value of binary data for each waveform
VMinData:
Minimum value of binary data for each waveform
HResolution:
Value of coefficient HResolution of the X-axis conversion equation
of each waveform7
HOffset:
Value of coefficient HOffset of the X-axis conversion equation of
each waveform7
HUnit:
Unit used on the X-axis of each waveform (no effect on the data)
Date:
Date when a trigger is activated
Time:
Time when a trigger is activated
For details on 1 to 7, see the next page.
$PrivateInfo (Model-Specific Information)
ModelVersion:
MathBlockNo.:
DisplayPointNo.:
PTraceName:
PUpperScaleData:
PLowerScaleData:
POffsetName:
App-8
Version No. of the instrument
Block No. of block to be computed
Value indicating the memory position (nth point in the memory)
corresponding the left end of the display record length.
Label for each waveform
Scale value of the top edge of the screen
Scale value of the bottom edge of the screen
Offset value
IM 701240-01E
Appendix 5 ASCII Header File Format
1
Creation of an ASCII Header File
If waveform data (waveform) is stored on a storage medium (such as a PC card), the
following two files are automatically created.
• Waveform display data file (.wvf)
• ASCII header file (.hdr)
The waveform data file can be recalled to the instrument using the FILE menu. The
ASCII header files explained here cannot be viewed on the SL1400. Use the data on a
PC for analysis.
1 Endian mode when saving data
Big:
Ltl:
2
3
4
5
Motorola 68000-family data
Intel 86 family data
6
2 Storage format of the binary waveform data
Trace: Grouped into blocks for each waveform.
Block: Grouped into blocks by a given time interval.
Trace is used on the SL1400.
7
3 Binary file start position
8
Offset from the beginning of the file.
4 Maximum number of blocks in the group
9
Maximum number of blocks applies if the number of blocks varies between
waveforms.
10
5 Y-axis conversion equation for each waveform
Y-axis value = VResolution × raw data + VOffset
6 Data type
ISn:
IUn:
FSn:
FUn:
Bm:
11
n-byte signed integer
n-byte unsigned integer
n-byte signed real number
n-byte unsigned real number
m-bit data
12
13
7 X-axis conversion equation for each waveform
X-axis value = HResolution × (Data No. – 1) + HOffset
14
15
16
Appendix
17
18
App
Index
IM 701240-01E
App-9
Appendix 6
Key
Soft Key
List of Default Values
Default Setting
CH1 to 16 (HS10M12(701250))
Range
Variable
Position
Coupling
Probe
BandWidth
V Zoom
Linear Scale
InVert
Label
500 V
OFF
0.00 div
DC
10:1
Full
×1
OFF
OFF
Channel number
CH1 to 16 (HS1M16(701251))
Range
Variable
Position
Coupling
Probe
BandWidth
V Zoom
Linear Scale
InVert
Label
500.0 V
OFF
0.00 div
DC
10:1
Full
×1
OFF
OFF
Channel number
CH1 to 16 (NONISO_10M12(701255))
Range
500 V
Variable
OFF
Position
0.00 div
Coupling
DC
Probe
10:1
BandWidth
Full
V Zoom
×1
Linear Scale
OFF
InVert
OFF
Label
Channel number
CH1 to 16 (HV(with RMS)(701260))
Range
Variable
Position
Coupling
Probe
BandWidth
V Zoom
Linear Scale
InVert
Label
50.00 V
OFF
0.00 div
DC
1:1
Full
×1
OFF
OFF
Channel number
CH1 to 16 (UNIVERSAL(701261)/UNIVERSAL(AAF)(701262))
Range
50.00 V
Variable
OFF
Position
0.00 div
Coupling
DC
BandWidth
Full
V Zoom
×1
Linear Scale
OFF
InVert
OFF
Label
Channel number
App-10
Key
Soft Key
CH1 to 16 (TEMP/HPV(701265))
Range
Variable
Position
Coupling
BandWidth
V Zoom
Linear Scale
InVert
Label
Default Setting
50.00 V
OFF
0.00 div
DC
Full
×1
OFF
OFF
Channel number
CH1 to 16 (STRAIN_NDIS(701270)/STRAIN_DSUB(701271))
Range Unit
µSTR
Range
±20000 µSTR
Upper
20000 µSTR
Lower
–20000 µSTR
Excitation
2V
Gauge Factor
2.00
BandWidth
Full
Linear Scale
OFF
InVert
OFF
Label
Channel number
CH1 to 16 (ACCL/VOLT(701275))
Range
Variable
Position
Coupling
Probe
BandWidth
V Zoom
Linear Scale
InVert
Label
500.0V
OFF
0.00div
DC
10:1
Full
×1
OFF
OFF
Channel number
CH1 to 16 (FREQ(701280))
Range
Variable
Position
FV Setup
Input Setup
V Zoom
Offset
Linear Scale
Label
10 kHz
OFF
0.00 div
Frequency
User
×1
0.0 Hz
OFF
Channel number
Logic A, Logic B
Display
Position
VZoom
Label
Display Bits
Bit Label
Bit Mapping
Probe
OFF
0 div
×1
LogicA or LogicB
ON
A–1 to A–8,
B–1 to B–8
Auto
700986
IM 701240-01E
Appendix 6 List of Default Values
1
Key
Soft Key
Default Setting
START/STOP
Key
ACQ
SIMPLE/ENHANCED
Type
Slope
Source
LeVel
Hysteresis
Hold Off
100 kS/s
100 ms
Normal
Infinite
OFF
Int
Simple
Rising edge
CH1
0V
0.0 µs
MODE
Auto
HISTORY
Mode
Operation:Math1
Operation:Math2
Operation:Math3
Operation:Math4
Operation:Math5
Operation:Math6
Operation:Math7
Operation:Math8
Start Point
End Point
Threshold:Trace
Threshold:Upper
Threshold:Lower
AVerage:Mode
Phase Shift
Filter:Select
Filter:Type
Filter:Band
Filter:CutOff
FFT Point
FFT Window
OFF
OFF
OFF
OFF
OFF
OFF
OFF
OFF
OFF
–5 div
5 div
CH1
0.0 V
0.0 V
OFF
0.000 ms
FILT1
Gauss
Low-Pass
10.0%
1k
Hanning
0
One
0
Oldest number
OFF
Mode
Item Setup:Trace
Item Setup:Item
Delay Setup:Trace
Delay Setup:Mode
1cycle Mode
Time Range1
Time Range2
Trace
Dist/Prox Mode
Distal
Mesial
Proximal
High/Low Mode
OFF
CH1
OFF
CH1
OFF
OFF
–5 div
5 div
CH1
%
90%
50%
10%
Auto
Mode
Format
Allocation
Main
Main
0 to 3 in order from
1CH
500 µs/div
500 µs/div
0 div
0 div
Type
OFF
Format
Interpolation
Graticle
Mapping
Trancelucent
Extra Window
Scale Value
Trace Label
Accumulate
Monitor
4 Zone
Line
Grid
Auto
OFF
OFF
ON
OFF
OFF
Both
Mode
W1:XTrace
W1:YTrace
W2:XTrace
W2:YTrace
W3:XTrace
W3:YTrace
W4:XTrace
W4:YTrace
Start Point
End Point
T-Y
2
3
4
5
6
7
8
ZOOM
Z1 Mag
Z2 Mag
Z1 Position
Z2 Position
POSITION/DELAY
Position
Delay
50%
0.0 µs
CURSOR
DISPLAY
OFF
OFF
OFF
OFF
OFF
OFF
100
Cont
File Item
Auto Naming
Setup
Numbering
Print to
Format
Time Range1
Time Range2
(Zoom Print) Mag
Printer
Normal
–5 div
5 div
5 ms
Auto Setup
Trace
0V
All
Auto Cal
ON
11
13
14
15
FILE
16
PRINT
X-Y
10
12
ACTION
Mode
Buzzer
Image
PRINT
SaVe to File
Send Mail
Mail Count
Sequence
9
17
Appendix
Select Record
Display Mode
Start Record
End Record
Search Mode
MEASURE
IM 701240-01E
Default Setting
MATH
STOP
Sample Rate
Record Time
Mode
Count
RealTime Out
Time Base
Soft Key
SETUP
18
CAL
App
–5 div
5 div
Index
App-11
Appendix 6 List of Default Values
Key
Soft Key
Default Setting
MENU
System Config:Language(Menu)
Depends on the suffix
code.
System Config:Click Sound
ON
Self Test:SCSI ID:Own ID
6
Self Test:SCSI ID:Internal ID
4
Others:Video Out
ON
Others:HDD Motor
ON
Others:Start Mode
OFF
Others:Action Mode
OFF
Others:START/STOP Response Time
Quick
Others:LCD:Auto Off
OFF
Others:LCD:Auto Off Time
1min
Others:LCD:Brightness
5
Remote Cntl:Device
GP-IB
Remote Cntl:Address
1
App-12
IM 701240-01E
Appendix 7
1
Key Assignments of the USB
Keyboard
2
104 Keyboard (US)
Key
3
With the Ctrl Key Held Down on
the USB Keyboard
When the Soft Keyboard Is Displayed
on the SL1400
+Shift on the
–
USB Keyboard
*
*
B
MENU menu
*
*
C
Execute PRINT
*
*
D
DISPLAY menu
*
*
*
*
*
*
*
*
A
E
F
FILE menu
G
H
HISTORY menu
*
*
I
Execute IMAGE SAVE
*
*
*
*
J
K
*
*
L
ALL CH menu
*
*
M
MEASURE menu
*
*
N
CH SEL menu
*
*
*
*
O
P
CHART SPEED menu
*
*
Q
Execute CLEAR TRACE
*
*
R
Execute RESET
*
*
*
*
S
T
RANGE FINE mode
*
*
U
CURSOR menu
*
*
V
Execute FEED
*
*
W
POSITION FINE mode
*
*
X
MODE menu
*
*
*
*
Y
Z
ZOOM menu
*
*
1
CH1 menu
*
*
2
CH2 menu
*
*
3
CH3 menu
*
*
4
CH4 menu
*
*
5
CH5 menu
*
*
6
CH6 menu
*
*
7
CH7 menu
*
*
8
CH8 menu
*
*
9
CH9 menu
*
*
0
CH10 menu
*
*
Enter
Return (Enter), Select
*
*
Esc
Escape
*
*
*
*
Back Space
Other (Normal Condition)
4
5
6
7
8
9
10
11
12
13
14
15
16
Tab
*
*
*
=
*
*
[
*
*
]
*
*
*
*
;
*
*
'
*
*
,
*
*
*
*
/
INITIALIZE/CAL menu
.
/
PRINT menu
Caps Lock
*
*
*
*
17
Appendix
*
-
Space Bar
18
App
Index
* Character or symbol similar to the normal PC keyboard is entered.
(Example) 1 key: 1 is entered if the USB keyboard is not +shift. ! is entered if the USB keyboard is +shift.
IM 701240-01E
App-13
Appendix 7 Key Assignments of the USB Keyboard
Key
With the Ctrl Key Held Down on
the USB Keyboard
When the Soft Keyboard Is
Displayed on the SL1400
+Shift on the
–
USB Keyboard
Other (Normal Condition)
F1
CH11 menu
Select soft key 1
Same as left
Select soft key 1
F2
CH12 menu
Select soft key 2
Same as left
Select soft key 2
F3
CH13 menu
Select soft key 3
Same as left
Select soft key 3
F4
CH14 menu
Select soft key 4
Same as left
Select soft key 4
F5
CH15 menu
Select soft key 5
Same as left
Select soft key 5
F6
CH16 menu
Select soft key 6
Same as left
Select soft key 6
Select soft key 7
Same as left
Select soft key 7
Escape
Escape
Same as left
Escape
µ
Same as left
F12
START/STOP
Ω
Same as left
Print Screen
Execute PRINT
Scroll Lock
Execute IMAGE SAVE
Pause
Execute SNAPSHOT
Insert condition
Same as left
F7
F8
F9
F10
F11
Insert
START/STOP
Home
Decrease the RANGE value
Decrease the RANGE value
Page Up
Increase the POSITION value
Increase the POSITION value
Delete
*
*
End
Increase the RANGE value
Increase the RANGE value
Page Down
Decrease the POSITION value
Decrease the POSITION value
Cursor to the right
Cursor to the right
Same as left
Cursor to the left
Cursor to the left
Same as left
Cursor to the left
Jog shuttle down
Select soft key 4
Same as left
Jog shuttle down
Jog shuttle up
Select soft key 6
Same as left
Jog shuttle up
*
*
*
*
-
*
*
Cursor to the right
(Numeric)
Num Lock
/
*
*
START/STOP
START/STOP
+
*
*
Enter
*
*
1
*
2
*
Jog shuttle down
3
*
Decrease the POSITION value
4
*
Cursor to the left
5
*
Return(Enter), Select
Increase the RANGE value
6
*
Cursor to the right
7
*
Decrease the RANGE value
8
*
Jog shuttle up
9
*
Increase the POSITION value
0
*
Insert condition
.
*
Delete
Character or symbol similar to the normal PC keyboard is entered.
(Example) 1 key: 1 is entered if the USB keyboard is not +shift. ! is entered if the USB keyboard is +shift.
App-14
IM 701240-01E
Appendix 7 Key Assignments of the USB Keyboard
1
109 Keyboard (Japanese)
Key
With the Ctrl Key Held Down on
the USB Keyboard
A
When the Soft Keyboard Is
Displayed on the SL1400
+Shift on the
–
USB Keyboard
*
*
MENU menu
*
*
C
Execute PRINT
*
*
D
DISPLAY menu
*
*
*
*
*
*
*
*
B
E
F
FILE menu
G
H
HISTORY menu
*
*
I
Execute IMAGE SAVE
*
*
J
*
*
K
*
*
L
ALL CH menu
*
*
M
MEASURE menu
*
*
N
CH SEL menu
*
*
*
*
O
P
CHART SPEED menu
*
*
Q
Execute CLEAR TRACE
*
*
R
Execute RESET
*
*
*
*
S
T
Execute RANGE FINE
*
*
U
CURSOR menu
*
*
V
Execute FEED
*
*
W
POSITION FINE mode
*
*
X
MODE menu
*
*
*
*
Y
Z
ZOOM menu
*
*
1
CH1 menu
*
*
2
CH2 menu
*
*
3
CH3 menu
*
*
4
CH4 menu
*
*
5
CH5 menu
*
*
6
CH6 menu
*
*
7
CH7 menu
*
*
8
CH8 menu
*
*
9
CH9 menu
*
*
0
CH10 menu
*
*
Enter
Return (Enter), Select
*
*
Esc
Escape
*
*
*
*
Space Bar
*
*
-
*
*
*
Back Space
Other (Normal Condition)
3
4
5
6
7
8
9
10
11
12
13
14
Tab
*
*
*
[
*
*
;
*
*
:
*
*
]
*
*
,
*
*
.
*
*
*
*
*
*
/
Caps Lock
*
PRINT menu
15
16
17
Appendix
^
@
2
18
Character or symbol similar to the normal PC keyboard is entered.
(Example) 1 key: 1 is entered if the USB keyboard is not +shift. ! is entered if the USB keyboard is +shift.
App
Index
IM 701240-01E
App-15
Appendix 7 Key Assignments of the USB Keyboard
Key
With the Ctrl Key Held Down on
the USB Keyboard
When the Soft Keyboard Is
Displayed on the SL1400
+Shift on the
–
USB Keyboard
Other (Normal Condition)
F1
CH11 menu
Select soft key 1
Same as left
Select soft key 1
F2
CH12 menu
Select soft key 2
Same as left
Select soft key 2
F3
CH13 menu
Select soft key 3
Same as left
Select soft key 3
F4
CH14 menu
Select soft key 4
Same as left
Select soft key 4
F5
CH15 menu
Select soft key 5
Same as left
Select soft key 5
F6
CH16 menu
Select soft key 6
Same as left
Select soft key 6
Select soft key 7
Same as left
Select soft key 7
Escape
Escape
Same as left
Escape
µ
Same as left
F12
START/STOP
Ω
Same as left
Print Screen
Execute PRINT
Scroll Lock
Execute IMAGE SAVE
Pause
Execute SNAPSHOT
Insert condition
Same as left
F7
F8
F9
F10
F11
Insert
START/STOP
Home
Decrease the RANGE value
Decrease the RANGE value
Page Up
Increase the POSITION value
Increase the POSITION value
Delete
*
*
End
Increase the RANGE value
Increase the RANGE value
Page Down
Decrease the POSITION value
Decrease the POSITION value
Cursor to the right
Cursor to the right
Same as left
Cursor to the left
Cursor to the left
Same as left
Cursor to the left
Jog shuttle down
Select soft key 4
Select soft key 4
Jog shuttle down
Jog shuttle up
Select soft key 6
Same as left
Jog shuttle up
INITIALIZE/CAL menu
*
*
*
*
*
*
*
*
-
*
*
\
Cursor to the right
/
(Numeric)
Num Lock
/
*
*
START/STOP
START/STOP
+
*
*
Enter
*
*
1
*
2
*
Jog shuttle down
3
*
Decrease the POSITION value
4
*
Cursor to the right
5
*
Return (Enter), Select
Increase the RANGE value
6
*
Cursor to the right
7
*
Decrease the RANGE value
8
*
Jog shuttle up
9
*
Increase the POSITION value
0
*
Insert condition
.
*
Delete
Character or symbol similar to the normal PC keyboard is entered.
(Example) 1 key: 1 is entered if the USB keyboard is not +shift. ! is entered if the USB keyboard is +shift.
App-16
IM 701240-01E
Appendix 8
Waveform Acquisition Operation When
the Power Supply Recovers after a
Power Failure
The waveform acquisition operation when the power supply recovers after a power
failure varies depending on the following two conditions.
• Start Mode (Power On)
Whether to start the waveform acquisition at power on.
• Acquisition memory backup switch
Whether to back up the acquisition memory
When Start Mode (Power On) is OFF
• When the backup switch is OFF
The history memory is cleared.
Waveform acquisition does not start regardless of whether measurement was in
progress before the power failure.
• When the Backup Switch Is ON
The history memory is held.
If waveform acquisition was in progress before the power failure, the waveform
acquisition is resumed.*
Waveform acquisition does not start if measurement was stopped before the power
failure.
Note
The behavior when the backup switch is ON but the batteries go flat while backing up the data is
as follows:
• The history memory is cleared.
• Waveform acquisition does not start regardless of whether measurement was in progress
before the power failure.
1
2
3
4
5
6
7
8
9
10
11
12
When Start Mode (Power On) is ON
• When the Backup Switch Is OFF
The history memory is cleared.
Waveform acquisition starts regardless of whether measurement was in progress
before the power failure.
• When the Backup Switch Is ON
The history memory is held.
If waveform acquisition was in progress before the power failure, the waveform
acquisition is resumed.* Waveform acquisition starts if measurement was stopped
before the power failure.
Note
*
IM 701240-01E
• If the acquisition mode is set to average or if realtime recording is in progress, the
waveform acquisition is restarted. If a power failure occurs during realtime recording, the
realtime recording file becomes an invalid file (this file cannot be loaded). Be sure that the
power supply is not interrupted during realtime recording.
• Acquisition of waveforms continues during roll mode display. If the display is not in roll
mode, pre-trigger data is acquired from the beginning for pre-triggered waveforms. The
data of post-trigger waveform up to the power failure is considered valid, and the acquisition
of waveforms continues from that point.
App-17
14
15
16
17
Appendix
The behavior when the backup switch is ON but the batteries go flat while backing up the data is
as follows:
• The history memory is cleared.
• Waveform acquisition starts regardless of whether measurement was in progress before the
power failure.
13
18
App
Index
Appendix 9
Basic Defining Equation of Strain
Definition of Strain
∆L/L = ε
(1)
ε:
Strain
L:
Initial length of the material
∆L: Amount of change due to external strain
Definition of the Gauge Factor
Gauge factor (K) refers to the ratio between the mechanical strain and the change in the
resistance of the strain gauge resistor.
ε=
∆R/R
∆L
=
L
K
(∆R/R)=K×ε
(2)
(3)
R: Gauge resistance
∆R: Amount of change in resistance when a strain is received
Normally, K=2.0. However, the value varies depending on the strain gauge material.
General Equation of the Measured Voltage (V) and Strain (ε) of the Wheatstone
Bridge (1 Gauge Method)
If we assume V to be the voltage measured on the bridge and E to be the voltage
applied to the bridge,
V = (1/4)×E×(∆R/R)
(4)
From equation (3),
(∆R/R) = K×ε
Thus, V = (1/4)×E×K×ε
(5)
• When Determining the Strain (ε) from the Measured Voltage (V) (Strain Gauge (1
Gauge Method))
If we derive ε from equation (5)
ε = (4/K)×(V/E)
(6)
• When Determining the Measured Value of the Strain Gauge Sensor (e) from the
Voltage Measured on the Bridge (V) (Strain Gauge Sensor)
Assuming e to be the measured value (measured value of the strain gauge sensor:
mV/V unit) and substituting ε = e in equation (6),
ε = (4/K)×(V/E)
(7)
In the case of a strain gauge sensor, set the Gauge Factor (K) to 2 on the SL1400. If
you change the value of K, conversion is made using the above equation.
App-18
IM 701240-01E
Appendix 10 Shunt Calibration of the Strain Module
1
2
Shunt calibration is used to correct the gain of strain measurements by inserting a known
resistance (shunt calibration resistance (shunt resistance)) in parallel with the strain
gauge. The Strain Module (701271(STRAIN_DSUB) supports shunt calibration and
contains a built-in relay circuit for shunt calibration.
To execute shunt calibration, a bridge head that supports shunt calibration (701957/
701958) is needed.
Measurement instrument
Bridge Head 701957/701958
(with shunt cal support)
B8023WP
Bridge+ Bridge+
9
6
8
7
5
2
4
3
1
BridgeInput+
Input+
InputSense+
R
Shuntcal-
InputR
Shuntcal+
R
Shunt resistor
Sense+
BridgeSense-
GND
terminal
SenseShuntcal+
Shuntcal-
Floating
Common
Case
Sense+
Sense-
The floating common of the module is
grounded within the bridge head. 1
Twist
Bridge+
BridgeInput+
Twist
Input-
9
6
8
7
5
2
4
3
1
Sense+
Twist
SenseShuntcal+
Twist
Shell
The connector shell is
connected to the case
potential of the bridge
head. 2
ShuntcalFloating Common
Shield
+
-
701271
STRAIN_DSUB
Bridge
Power
Shunt calibration relay circuit (Built into the strain
module. Turns ON/OFF automatically when shunt
calibration is executed.)
Shunt resistor (Applied to the bridge head)
7
Shuntcal
ON/OFF
ShuntcalAll module
Floating signals are
Common
isolated.
The connector shell is connected to the case
potential of the measurement instrument. 2
Case
120 Ω
120 Ω
10
12
13
120 Ω
14
In+
In120 Ω
Bridge-
9
Shunt resistor, when correcting the positive side
Bridge+
Bridge
voltage
8
11
Shunt calibration relay circuit (Built into the strain
module. Turns ON/OFF automatically when shunt
calibration is executed.)
120 Ω
In-
6
SenseShuntcal+
• When correcting the gain on the positive side
Bridge+
In+
5
AD
Sense+
1. The GND (floating common) of the module is connected to the case potential inside the bridge box.
2. The bridge head case, the cable shield, and the measurement instrument case are connected as measures against noise.
• When correcting the gain on the negative side (normal)
4
Module
+
-
Shell
The shield is connected to
the bridge head case and
the measurement instrument
case. 2
3
120 Ω
Bridge
voltage
Bridge-
15
16
Appendix
17
18
App
Index
IM 701240-01E
App-19
Appendix 10 Shunt Calibration of the Strain Module
Shunt Calibration Procedure
1. Calculate the strain value (µSTR) corresponding to the shunt resistor to be used. For
the calculation procedure, see “Calculating the Shunt Resistance” in the next section.
2. Execute balancing without applying a load to the strain gauge and correct the zero point.
3. Execute shunt calibration and correct the gain.
Shunt calibration is executed using SL1400 channel menu > Linear Scale > Mode.
Usually, the negative gain is corrected. However, if you are correcting the positive
gain, change the position of the shunt resistor as shown in the upper right figure.
• Shunt calibration
• Balance
Strain
After execution
Gain is corrected.
Strain
Before
execution
After
execution
Current measured
value 1
Strain input
P2:X
The zero point is
corrected when
balancing is executed.
Before execution
Strain input
P2:Y
The strain value corresponding to the
shunt resistor is set to P2:Y of the setup menu.
1. Automatically obtained when shunt calibration is executed.
Execution Menu of Shunt Calibration
The execution menu of shunt calibration is set using channel menu > Linear Scale >
Mode. In normal shunt calibration, only P2:Y is set. In addition to the normal shunt
calibration (when the shunt calibration relay circuit is ON), the SL1400 allows the setting
of a zero point when the relay circuit is OFF. This function is useful when the strain
value is not 0 after the execution of balancing.
Items in the Execution Menu
(1)P1:X: If (Shunt Cal) Exec is executed, the input value when the relay circuit is OFF
is applied.
(2)P1:Y: Sets the value (usually 0) when the relay circuit is OFF.
(3)P2:X: If (Shunt Cal) Exec is executed when the relay circuit is ON, the input value
when the relay circuit is ON is applied.
(4)P2:Y: Set the strain value corresponding to the shunt resistance when the relay
circuit is ON.
(1)
(2)
(3)
(4)
App-20
IM 701240-01E
Appendix 10 Shunt Calibration of the Strain Module
1
Note
•
•
When executing shunt calibration, select an appropriate range so that the measured values
do not exceed the range when the shunt calibration relay circuit is ON. The SL1400 attempts
shunt calibration within the current specified range.
If shunt calibration fails (the measured value exceeds the range, for example), an error
message is displayed. In such case, change the range and execute shunt calibration again.
Taking Measures against Noise
Because measurements are made at the µV level, the strain gauge is extremely
susceptible to noise. If the execution of balancing or shunt calibration fails, it may be
due to the effect of noise. Check the following points.
• Because the strain gauge is attached away from the bridge head, it is recommended
that twisted wire be used for extension.
• Use a bridge head with high noise resistance. It is recommended that YOKOGAWA
bridge head (701957/701958) with high noise resistance be used.
To execute shunt calibration, the shunt resistance (Rs) and the expected strain (ε) need
to be calculated in advance. Use ε as given in the equation below (normally a negative
value). With the SL1400, enter the value into “P2-Y” under the shunt calibration
execution menu. However, when using the general method given for shunt calibration
(the easy method), an error of 1 to 2% can be introduced as the strain value (ε)
increases. Therefore, calculate using the detailed method whenever possible. Also, you
must select a setting range value that will not result in an overrange.
Equation for Rs and ε When Executing Shunt Calibration
• General Equation
∆R/R = K×ε
∆R = R–R//Rs
1
R
+
1
Rs
(1): Basic Equation of Strain
(2): Equation of the change in resistance when the shunt
resistance is ON
=
5
6
Rs=R×(1-K×ε)/(K×ε)
8
9
10
12
13
R×Rs
R+Rs
14
If ∆R is cancelled out from (1) and (2),
(Equation A): General equation used to calculate the
shunt resistance (includes error)
15
16
Strain (strain you wish to generate when the shunt resistance is turned ON)
Gauge factor
Bridge resistance
Resistance change
Shunt resistance (shunt resistance you wish to derive)
17
Appendix
ε:
K:
R:
∆R:
Rs:
4
11
In this manual, the parallel equation of resistors are expressed as follows:
1
3
7
Calculation of the Shunt Resistance
R//Rs=
2
18
App
Index
IM 701240-01E
App-21
Appendix 10 Shunt Calibration of the Strain Module
• Detailed Equation
V0=E×(R1×R3–R2×R4)/{(R1+R2)×(R3+R4)}
(1): Basic Equation of Wheatstone Bridge
When shunt calibration is ON,
V0=E×(R1×R3–R'×R4)/{(R1+R')×(R3+R4)}
(2): Equation when turned ON
(3): Equation of combined resistance R'
(4): Since R1 to R4 are equal, we represent
them as R
R'=R2//Rs
R1=R2=R3=R4=R
Also, from the basic equation of strain,
V0/E=K×ε/4
(5): Basic equation of strain
If V0/E and R1 to R4 are cancelled out from (2), (3), (4), and (5),
Rs=R×(1–K×ε/2)/(K×ε)
E:
V0:
R1 to R4:
Rs:
R':
Bridge voltage
Bridge output voltage
Bridge resistance (except, R1=R2=R3=R4)
Shunt resistance (shunt resistance you wish to derive)
Combined resistance when the relay is turned ON (R'=R//Rs)
R1
R4
V0
R2
(Equation B): Detailed equation used to calculate
the shunt resistance (no error)
E (Bridge power supply)
R3
Rs
App-22
IM 701240-01E
Appendix 10 Shunt Calibration of the Strain Module
1
Calculation Example
• When Determining the Corresponding Shunt Resistance (Rs) from the Strain (ε)
Given a gauge factor (K) of 2,
Detailed equation
Rs = R×(1–ε)/(2×ε)
(6)
(equation B)
General equation
(equation A)
Rs = R×(1–2×ε)/(2×ε)
3
(7): Error of 1 to 2% present
4
Desired Strain
ε (µSTR)
Derived by the Detailed Equation (6)
Rs Value (Ω)
R=120 Ω
R=350 Ω
Rs value (Ω) Derived by the
General Equation (7)
R=120 Ω
R=350 Ω
1,000
2,000
5,000
10,000
59,940
29,940
11,940
5,940
59,880
29,880
11,880
5,880
174,825
87,325
34,825
17,325
174,650
87,150
34,650
17,150
• When Determining the Corresponding Strain (ε) from the Shunt Resistance (Rs)
If we derive e from equation (6) and (7),
Detailed equation
ε = 1/(1+2×Rs/R)
(8)
(equation B)
General equation
(equation A)
2
ε = 1/{2×(1+Rs/R)}
(9): Error of 1 to 2% present
When the Bridge Resistance R is 120 Ω
5
6
7
8
9
10
RS Value (Ω)
Strain ε (µSTR) Derived by
the Detailed Equation (8)
Strain ε (µSTR) Derived by
the General Equation (9)
60,000
30,000
12,000
6,000
999
1,996
4,975
9,901
998
1,992
4,950
9,804
11
13
12
When the Bridge Resistance R is 350 W
RS Value (Ω)
Strain ε (µSTR) Derived by
the Detailed Equation (8)
Strain ε (µSTR) Derived by
the General Equation (9)
180,000
90,000
36,000
18,000
971
1,941
4,838
9,629
970
1,937
4,814
9,537
14
15
16
Appendix
17
18
App
Index
IM 701240-01E
App-23
Appendix 11 Measurement Principles (Measurement
Method and Update Rate) of the
Frequency Module
Measurement Principles of the Frequency Module
The measurement principles of period, frequency, pulse width, and duty cycle on the
frequency module (701280 (FREQ)) are described below.
Period and Frequency Measurement
The frequency module updates the waveform at a rate of 25 kHz (40-µs interval). The
measurement method differs for frequencies above 25 kHz and below 25 kHz.
• When the input signal is less than or equal to 25 kHz, measurement is made as
described in (1).
• When the input signal is greater than or equal to 25 kHz, measurement is made as
described in (2).
• The sequence of processing described below is performed simultaneously through
pipeline processing. Thus, the period (t) and frequency (f) are updated every 40 µs.
(1)When the input signal is less than or equal to 25 kHz
Measures the time of occurrence of the pulse edge (T1) in measurement interval A.
Measures the time of occurrence of the pulse edge (T2) in measurement interval B.
Calculates the period (t) = T2 – T1 in measurement interval C.
The frequency (f) is calculated as 1/period (t).
When the period of the input pulse spans over multiple measurement intervals, computation is
performed at the measurement interval following the interval in which the edge is detected.
A
Measurement
interval: 40 µs
B
C
40 µs
40 µs
Period (t)
Time: T2
Time: T1
Input pulse
Period (t) = T2–T1
Frequency (f) = 1/period (t)
(2)When the input signal is greater than or equal to 25 kHz
Measures the time of occurrence of the last pulse edge (Te1) in measurement interval A.
Measures the time of occurrence of the last pulse edge (Te2) in measurement interval B.
Measures the number of pulses between the last pulse edge in measurement interval
A and the last pulse edge of measurement interval B.
Calculates the period (t) = (Te2 – Te1)/the number of pulses in measurement interval C.
Period (t) is the average value of multiple pulses.
The frequency (f) is calculated as 1/period (t).
If the input pulse period is short, the SL1400 automatically takes the average of
multiple pulses and calculates the period and frequency. Therefore, the resolution does not
degrade even when the input pulse period is short, and highly accurate measurement is
possible.
A
Measurement
interval: 40 µs
B
C
40 µs
40 µs
Number of pulses: 3
Time: Te1
Time: Te2
Input pulse
Period (t) = (Te2 – Te1)/3
Frequency (f) = 1/period (t)
App-24
IM 701240-01E
Appendix 11 Measurement Principles (Measurement Method and Update Rate) of the Frequency Module
1
Pulse Width and Duty Cycle Measurement
• When the input signal is less than or equal to 25 kHz, measurement is made as
described in (1).
• When the input signal is greater than or equal to 25 kHz, measurement is made from
the last waveform in the measurement interval as described in (2).
• The sequence of processing described below is performed simultaneously through
pipeline processing. Thus, the period (t) and frequency (f) are updated every 40 µs.
(1)When the input signal is less than or equal to 25 kHz
Measures the times of occurrences of pulse edges (T1, T2, and T3) in measurement
intervals A and B.
In measurement interval C:
For pulse width:
Calculates pulse width = T2 – T1.
For duty cycle:
Calculates duty cycle = (T2 – T1)/(T3 – T1).
B
A
Measurement
interval: 40 µs
40 µs
2
3
4
5
6
C
7
40 µs
Pulse width
8
Time: T2 Time: T3
Time: T1
9
Input pulse
Pulse width = T2 – T1
Duty cycle = (T2 – T1)/(T3 – T1)
(2)When the input signal is greater than or equal to 25 kHz
Measures the times of occurrences of pulse edges (T1, T2, and T3) in measurement
interval A.
In measurement interval B:
For pulse width:
Calculates pulse width = T2 – T1.
For duty cycle:
Calculates duty cycle = (T2 – T1)/(T3 – T1).
A
Measurement
interval: 40 µs
10
11
12
13
B
40 µs
14
Pulse width
15
T1 T2 T3
Input pulse
16
Pulse width = T2 – T1
Duty cycle = (T2 – T1)/(T3 – T1)
Appendix
17
18
App
Index
IM 701240-01E
App-25
Appendix 11 Measurement Principles (Measurement Method and Update Rate) of the Frequency Module
Computation Format (Resolution) of the Frequency Module
The computation flow on the frequency module is indicated below.
Range value
Value/Div
Offset value
Internally, all calculations
are performed using
floating-point.
Input
32-bit counter
A(Float)
2400 LSB/div
1 LSB weight
C(Float)
D(Float)
2400 LSB
/div
E(Binary)
Various
computations
Frequency
Period
....
50 ns resolution
Binary
Floatingpoint
computation
Floating
point data
Float
Computation (floating-point)
Float
ACQ
Memory
16bit Binary
The frequency module measures the period of the input signal using a 32-bit counter of
50-ns resolution. Therefore, the minimum resolution of the counter values is 50 ns.
Various computations are performed in floating point format. The data that is output from
the frequency module and written to the acquisition memory (ACQ Memory) is 16-bit
binary data. The data is converted using a weight of 1 LSB that is determined by Value/
div. The data is normalized to 2400 LSB/div when displayed on the screen.
Input: Conversion from the 32-bit Counter Value to Floating Point
Converts the count value obtained using the 32-bit counter with 50-ns resolution to
floating point format, and determines period A using the following equation.
Period: A (float) = (count value) × 50 ns
Computation
Various computations are performed in floating point format based on the settings.
Example)
Frequency: C (float) = 1/A (float)
Calculation of the 1 LSB Weight of the Output
The 1 LSB weight of the output is determined from the range (Value/div).
Since 1 div = 2400 LSB,
1 LSB weight of the output = (Value/div)/2400
Computation Output: Conversion from Floating Point to 16-bit Binary
(When Offset Is 0)
When the offset value is 0, offset calculation is not performed, and C (float) = D (float).
The data is converted into 16-bit binary data and written to the acquisition memory (ACQ
Memory).
16-bit binary data: E (binary) = D (float)/(1 LSB weight of the output)
Offset Computation
When the offset value is not 0, the offset value is computed in floating point format using
the following equation and converted to 16-bit binary data.
D (float) = C (float) – offset value (float)
In offset computation, if the computed result C is equal to the offset value, the output is
0. If the computed result C (float) is less than the offset value, E (binary) is negative.
App-26
IM 701240-01E
Appendix 11 Measurement Principles (Measurement Method and Update Rate) of the Frequency Module
1
Filter Characteristics (Time Delay) of the Smoothing Filter
The smoothing filter is a moving average filter in which computation is performed in
realtime. The computation interval of moving average is 40 µs (25 kHz). It is constant
independent of the sampling rate of the SL1400.
The moving average order (the number of points of moving average) is specified in time.
The maximum value is 25000 order (when set to 1000 ms).
The characteristics of the smoothing filter are as follows:
• The filter is a low-pass filter.
• Pass band is flat.
• Has linear phase characteristics and constant group delay by filter order.
The group delay is derived using the following equation.
Group delay = (the number of points of moving average – 1) × 40 µs/2
• Has comb-shaped bandwidth characteristics.
0
2
3
4
5
6
MEAN (Moving Average) Frequency Characteristics
7
dB
-20
8
9
-40
2
4
8
16
32
64
128
-60
-80
0f
0.1f
0.2f
0.3f
0.4f
10
11
0.5f
(f: sampling frequency [Hz])
12
The figure below shows the result when the smoothing filter is applied to a waveform that
changes in steps. The switching filter setup time follows the step change.
13
Smoothing filter setup time
14
Waveform after applying
the smoothing filter
15
Waveform before applying
the smoothing filter
16
Appendix
17
18
App
Index
IM 701240-01E
App-27
Appendix 12 List of Preset Settings of the
Frequency Module
Logic 5V
Logic 24V
Setup Item
Setting
Setup Item
Setting
V Range
Coupling
Probe
Bandwidth
Threshold
Hys
Slope
Chatter Elimination
Pull Up
±10 V
DC
Yes1
Yes2
2.5 V
Yes3
Yes4
Yes5
No
V Range
Coupling
Probe
Bandwidth
Threshold
Hys
Slope
Chatter Elimination
Pull Up
±50 V
DC
Yes1
Yes2
12 V
Yes3
Yes4
Yes5
No
Logic 3V
Pull-up 5V
Setup Item
Setting
Setup Item
Setting
V Range
±5 V (Probe = 1:1)
±10 V (Probe = 10:1)
DC
Yes1
Yes2
1.5 V
Yes3
Yes4
Yes5
No
V Range
Coupling
Probe
Bandwidth
Threshold
Hys
Slope
Chatter Elimination
Pull Up
±10 V
DC
1:1
Yes2
2.5 V
Yes3
Yes4
Yes5
Yes6
Coupling
Probe
Bandwidth
Threshold
Hys
Slope
Chatter Elimination
Pull Up
ZeroCross
Logic 12V
Setup Item
Setting
V Range
Coupling
Probe
Bandwidth
Threshold
Hys
Slope
Chatter Elimination
Pull Up
±20 V
DC
Yes1
Yes2
6V
Yes3
Yes4
Yes5
No
Setup Item
Setting
V Range
Coupling
Probe
Bandwidth
Threshold
Hys
Slope
Chatter Elimination
Pull Up
Yes7
AC
Yes1
Yes2
0V
Yes3
Rising edge
Yes5
No
When you select a preset, the setup items are automatically set to the settings in the table. The meaning of Yes and No in the table
is as follows:
Yes: Item that can be set to an arbitrary value
No: Item that cannot be set (not displayed on the menu)
1.
2.
3.
4.
5.
6.
7.
Probe type: Select 1:1 or 10:1.
Bandwidth limit: Select 100 Hz, 1 kHz, 10 kHz, 100 kHz, or Full. Full is not selectable for AC100V and AC200V.
Hysteresis: Select ±1%, ±2.5%, or ±5%.
Slope: Select rising or falling.
Chatter elimination: Select from 0 ms to 1000 ms.
Pull-up: Select ON or OFF. Selectable only for Pull-up 5V.
Voltage range:
(Probe = 1:1) Select ±1 V, ±2 V, ±5 V, ±10 V, ±20 V, or ±50 V.
(Probe = 10:1) Select ±10 V, ±20 V, ±50 V, ±100 V, ±200 V, or ±500 V.
App-28
IM 701240-01E
Appendix 12 List of Preset Settings of the Frequency Module
AC100V
1
EM Pickup
Setup Item
Setting
Setup Item
Setting
V Range
Coupling
Probe
Bandwidth
Threshold
Hys
Slope
Chatter Elimination
Pull Up
±200 V
AC
10:1
Yes2(Full is not allowed)
0V
Yes3
Rising edge
Yes5
No
V Range
Coupling
Probe
Bandwidth
Threshold
Hys
Slope
Chatter Elimination
Pull Up
±1 V
DC
1:1
Yes2
0V
Yes3
Rising edge
Yes5
No
AC200V
2
3
4
5
User
Setup Item
Setting
Setup Item
Setting
V Range
Coupling
Probe
Bandwidth
Threshold
Hys
Slope
Chatter Elimination
Pull Up
±500 V
AC
10:1
Yes2(Full is not allowed)
0V
Yes3
Rising edge
Yes5
No
V Range
Coupling
Probe
Bandwidth
Threshold
Hys
Slope
Chatter Elimination
Pull Up
Yes7
Yes8
Yes1
Yes2
Yes9
Yes3
Yes4
Yes5
No
6
7
8
When you select a preset, the setup items are automatically set to the settings in the table. The meaning of Yes and No in the table
is as follows:
Yes: Item that can be set to an arbitrary value
No: Item that cannot be set (not displayed on the menu)
1.
2.
3.
4.
5.
6.
7.
Probe type: Select 1:1 or 10:1.
Bandwidth limit: Select 100 Hz, 1 kHz, 10 kHz, 100 kHz, or Full. Full is not selectable for AC100V and AC200V.
Hysteresis: Select ±1%, ±2.5%, or ±5%.
Slope: Select rising or falling.
Chatter elimination: Select from 0 ms to 1000 ms.
Pull-up: Select ON or OFF. Selectable only for Pull-up 5V.
Voltage range:
(Probe = 1:1) Select ±1 V, ±2 V, ±5 V, ±10 V, ±20 V, or ±50 V.
(Probe = 10:1) Select ±10 V, ±20 V, ±50 V, ±100 V, ±200 V, or ±500 V.
8. Coupling: Select DC or AC.
9. Threshold level: Set within the specified voltage range.
9
10
11
12
13
14
15
16
Appendix
17
18
App
Index
IM 701240-01E
App-29
Appendix 13 TCP and UDP Port Number Used in
Ethernet Communications
The TCP and UDP port numbers that are used on the Ethernet interface of the SL1400
are as follows:
TCP Port Numbers
Port Number
Description
Function
20
File Transfer [Default Data]
FTP server, FTP client*, and a portion of the
Web server
21
File Transfer [Control]
FTP server, FTP client, and a portion of the
Web server
25
Simple Mail Transfer Protocol
SMTP client
80
World Wide Web HTTP
Web server and WebDAV server
515
-
LPR client
10001
-
Instrument control via the Ethernet interface
UDP Port Numbers
Port Number
Description
67
Bootstrap Protocol Server
DHCP client
68
Bootstrap Protocol Client
(receive wait port)
123
Network Time Protocol
SNTP client
*
App-30
Function
The port number when FTP passive mode (see section 15.10) is turned OFF. If FTP passive
mode is turned ON, the port number is arbitrary.
If FTP passive mode is OFF, connection is established from the server. If you are connecting
the SL1400 behind a firewall, turn FTP passive mode ON.
For the procedure of changing the FTP passive mode, see section 15.10.
IM 701240-01E
Index
Index
Symbols
1
Page
!s!mSTR ............................................................................ 5-25
.BTD ................................................................................ 13-42
.CSV .................................................................... 13-19, 13-34
.FLD ................................................................................ 13-19
.HDR ............................................................................... 13-19
.JTD ................................................................................ 13-42
.NTD ................................................................................ 13-42
.PTD ................................................................................ 13-42
.SET ................................................................................ 13-27
.SNP ................................................................................ 13-31
.WDF ............................................................................... 13-52
.WVF ............................................................................... 13-19
1Cycle Mode ................................................................... 11-27
author ................................................ 9-25, 9-26, 13-46, 13-48
auto calibration .................................................................. 4-20
auto level mode ......................................................... 2-24, 6-1
auto mode .................................................................. 2-24, 6-1
auto naming ........................................................ 13-17, 13-21
auto OFF ........................................................................... 16-5
auto print .................................................................. 9-16, 9-18
auto scroll ................................................................ 2-34, 8-10
auto setup ...................................................... 2-49, 4-17, 4-18
automated measurement of waveform parameters .......... 2-45
average ............................................................................... 7-3
average mode ........................................................... 2-28, 7-4
Avg ...................................................................................... 1-7
AX+B ......................................................................... 2-9, 5-18
B
A
Page
IM 701240-01E
B < time trigger .................................................................. 2-20
B > time, B < time, or B timeout trigger ............................. 6-30
B > time trigger .................................................................. 2-20
B TimeOut trigger .............................................................. 2-20
backlight ............................................................................ 16-5
backup (data in the acquisition memory) .......................... 7-16
balance .................................................................... 5-26, 5-29
bandwidth limit ........................................................... 2-9, 5-11
battery backup ................................................................ 18-11
battery box .......................................................................... 1-1
bias ................................................................................... 5-31
bias current ....................................................................... 5-32
binary ....................................................... 11-12, 13-14, 13-19
binary computation .................................................. 2-41, 10-4
bit label .................................................................... 5-44, 5-45
bit mapping ............................................................. 5-44, 5-45
block diagram ...................................................................... 2-2
box average ................................................................ 7-3, 7-6
box average mode ..................................................... 2-29, 7-4
BoxAvg ................................................................................ 1-7
bridge head ........................................................................... iv
bridge head, connection of ................................................ 3-25
bridge voltage ................................................................... 5-28
brightness ......................................................................... 16-5
built-in printer ............................................................. 1-1, 12-1
burnout ........................................................... 2-12, 5-23, 5-24
C
3
4
5
6
7
8
9
10
11
12
13
14
15
Page
Cal Exec ............................................................................ 4-20
calibration .......................................................................... 4-20
calibration period, recommended .................................... 18-11
carrying the instrument ....................................................... 3-2
CD-ROM ............................................................................... iii
center ................................................................................ 6-38
center frequency ............................................................... 5-42
center level ........................................................................ 6-39
Ch Data .......................................................... 9-7, 12-5, 13-45
Ch Information ............................................... 9-7, 12-5, 13-45
Ch Label ............................................................................ 12-4
Ch Message ................................................... 9-7, 12-5, 13-45
channel information ............................... 2-36, 8-24, 9-10, 12-9
channel label ....................................................................... 9-7
channel messages .................................................. 9-10, 12-9
channel, turning ON/OFF of ................................................ 5-1
characters, number of ......................................................... 4-5
Index-1
16
17
18
Index
A delay B trigger ..................................................... 2-18, 6-20
A->B(N) trigger .................................................................. 6-17
A4 print ........................................................... 9-20, 12-3, 12-6
AC (input coupling) ............................................................. 2-8
AC-RMS (input coupling) .......................................... 2-8, 2-11
acceleration measurement ....................................... 2-13, 5-31
acceleration sensor ........................................................... 5-32
accessories, optional ............................................................ iv
accessories, standard ........................................................... iii
ACCL ................................................................................ 5-31
ACCL (input coupling) ......................................................... 2-8
accumulate mode ................................................................ 8-6
accumulate time .................................................................. 8-6
accumulated display .................................................. 2-33, 8-6
accurate measurements ..................................................... 3-9
ACQ Count ........................................................................ 7-13
ACQ count ........................................................................ 6-46
acquisition count ......................................................... 7-4, 7-8
acquisition memory, backing up ........................................ 2-32
acquisition mode ....................................................... 2-28, 7-4
acquisition mode (chart recorder mode) ............................. 9-5
acquisition mode at power on ............................................. 7-2
action ......................................... 6-45, 6-46, 7-13, 7-14, 15-14
action mail ....................................................................... 15-16
action mode ............................................................ 6-45, 7-13
action mode (power on) .................................................... 7-13
action-on-stop ................................................................... 2-32
action-on-trigger ....................................................... 2-26, 6-45
actions, number of ............................................................ 6-45
addition ............................................................................. 10-1
addition, subtraction, multiplication, and divisio ................ 2-41
aliasing ................................................................................ 2-3
all channel menu ............................................................... 5-46
All Reset .......................................................................... 13-54
All Set .............................................................................. 13-54
allocation ............................................................................. 8-8
ambient humidity ................................................................. 3-3
ambient temperature ........................................................... 3-3
angle cursor .................................................................... 11-21
annotation ......................... 9-7, 9-10, 12-5, 12-9, 13-45, 13-47
anti-aliasing filter ............................................................... 5-12
ASCII ............................................................................... 13-14
attach image file .............................................................. 15-13
attenuation ................................................................ 5-10, 7-3
Attr .................................................................................. 13-53
Page
2
App
Index
Index
chart recorder ...................................................................... 9-1
chart recorder mode .................................................. 2-37, 9-1
chart speed ......................................................................... 9-4
chatter elimination ............................................................. 5-40
cleaning ............................................................................... 3-2
CLEAR TRACE ................................................................. 8-16
clear trace ................................................................ 2-35, 8-16
click sound ........................................................................ 16-1
code .................................................................................. 17-2
color .... 9-25, 9-26, 12-12, 12-14, 12-15, 12-16, 13-35, 13-37,
13-46, 13-48, 16-4
comb-shaped bandwidth characteristics ...................... App-27
combination of bit data .................................................... 11-23
command communications ............................................... 2-47
comment ......................................................................... 13-21
communication port ......................................................... 15-21
compensation signal ......................................................... 3-22
compression ........................... 9-25, 9-26, 13-35, 13-46, 13-48
compression format ........................................................ 13-37
computation range ............................................................ 10-3
computation target channels ............................................. 10-3
computed waveforms, scaling of ....................................... 2-42
computer interface .......................................................... 18-10
condition ....................................... 6-17, 6-19, 6-20, 11-5, 11-8
condition A ..................................................... 6-19, 6-22, 6-25
condition B ............................................ 6-19, 6-22, 6-33, 6-36
Connect Log List ................................................. 15-18, 15-19
connection lead types ....................................................... 3-28
connection to a PC ............................................................ 2-51
CONT ................................................................................ 5-45
continue .............................................................................. 7-9
control script .................................................................... 15-38
conventions ........................................................................... ix
cooling method ................................................................ 18-11
copy ................................................................................ 13-56
copy destination .............................................................. 13-57
copy source file ............................................................... 13-58
copy to all trace ............................................................... 11-25
corrective action ................................................................ 17-2
count ........................................................................... 7-3, 7-4
coupling ............................................................................... 5-8
current probe ......................................................................... iv
current probe, connection of ............................................. 3-18
current-to-voltage conversion ratio ................................... 5-10
current-to-voltage ratio ........................................................ 2-9
cursor jump ......................................................... 11-16, 11-24
cursor measurement .............................................. 2-44, 11-11
cursor, movement range of ............................................. 11-22
cursor position, selectable range of ................................ 11-24
cursor type ...................................................................... 11-20
cycle frequency ....................................................... 6-40, 6-43
cycle mode ...................................................................... 11-30
cycle statistics ................................................................. 11-33
cyclic statistical processing ................................... 2-46, 11-36
D
Page
dark/light ...................... 9-6, 9-9, 9-16, 9-18, 12-4, 12-8, 13-44
data capture .................................................................... 15-29
data points, number of ........................................................ 8-4
data, saving in the internal memory ........................ 2-39, 2-40
data size ...... 13-20, 13-26, 13-31, 13-34, 13-37, 13-42, 13-52
data type ......................................................................... 13-14
date ....................................................................... 3-14, 13-21
date/time ........................................................................... 6-13
DC (input coupling) ............................................................. 2-8
DC-RMS (input coupling) .......................................... 2-8, 2-11
deceleration prediction ............................................ 2-15, 5-43
Index-2
default gateway ................................................................. 15-5
default language .................................................................... ii
default values ............................................................... App-10
degree ............................................................................. 11-14
degree cursor .................................................................. 11-21
delay ................................................................................... 6-5
delay between channels ................................................. 11-29
delay measurement ........................................................ 11-29
delay setup ...................................................................... 11-26
delay time .......................................................................... 6-22
Dest Dir ........................................................................... 13-57
DHCP ...................................................................... 15-3, 15-5
differential probe ................................................................... iv
differential probe, connection of ........................................ 3-20
dir name .......................................................................... 13-60
direct input using a knob ..................................................... 4-3
direction ......................................................... 8-10, 9-13, 9-14
directory, creation of ....................................................... 13-61
disable ............................................................................... 6-19
display ........................................................................ 5-1, 10-2
display format ................................................................... 2-32
display bits ........................................................................ 5-44
display font ........................................................................ 16-2
display format ...................................................................... 8-2
display interpolation .......................................................... 2-33
display mode .................................................. 8-11, 11-1, 11-3
display range ....................................................................... 2-6
Display, Range etc. ........................................................... 5-46
display screen ..................................................................... 1-7
display, turning ON/OFF of ................................................. 5-1
display type ....................................................................... 5-20
distal ................................................................................ 11-27
distance/flow rate .............................................................. 2-14
distance/pulse ................................................................... 5-43
div/page ....................................................... 9-25, 9-26, 13-46
division .............................................................................. 10-1
divisions, number of per page ......................................... 13-48
DNS ........................................................................ 15-4, 15-6
DNS server ....................................................................... 15-4
document information ..................................................... 13-48
domain name .................................................................... 15-4
domain suffix ..................................................................... 15-4
dot display ........................................................................... 2-5
drive letter ....................................................................... 13-64
duty cycle ....................................................... 2-14, 5-36, 5-42
E
Page
Edge on A trigger ..................................................... 2-19, 6-23
edge or .............................................................................. 6-25
edge trigger ......................................................................... 6-8
emission .......................................................................... 18-12
enable ............................................................................... 6-19
Endian mode .................................................................. App-9
enhanced trigger ............................................................... 2-18
Env ...................................................................................... 1-7
envelope ............................................................................. 7-3
envelope mode ......................................................... 2-28, 7-4
error messages ................................................................. 17-2
ESC key .............................................................................. 1-1
Ethernet interface .............................................................. 15-1
Ethernet port ....................................................................... 1-4
excitation ........................................................................... 5-26
ext ........................................................................... 5-49, 6-11
EXT CLK IN ...................................................................... 14-3
external clock .................................................................... 5-50
external clock input ........................................................... 14-3
external clock input terminal ............................................... 1-4
IM 701240-01E
Index
external dimensions ........................................................ 18-37
external start ..................................................................... 14-6
external start/stop input connector ...................................... 1-4
external stop ..................................................................... 14-6
external trigger ......................................................... 2-17, 6-11
external trigger input ......................................................... 14-1
extra area ....................................... 9-6, 9-8, 12-3, 12-7, 13-47
extra window ........................................................... 2-36, 8-20
F
Page
FEED key .......................................................................... 3-12
FFT ................................................................................... 10-7
FFT function ...................................................................... 2-42
FFT points ......................................................................... 10-8
FFT points, number of ....................................................... 10-9
FFT window ...................................................................... 10-8
file attribute ..................................................................... 13-55
file name ......................................................................... 13-21
file name, renaming of .................................................... 13-61
filter .............................................................. 2-15, 5-43, 13-17
filter characteristics ...................................................... App-27
fine ........................................................................... 12-2, 12-6
Fit Meas Range to Z1 ......................................................... 8-9
FlatTop ........................................................... 2-41, 10-8, 10-9
flexible zone ........................ 9-6, 9-8, 12-4, 12-8, 13-44, 13-47
float ................................................................................. 13-14
floating ............................................................................ 13-19
format ....... 8-1, 8-8, 9-6, 12-1, 12-3, 12-7, 12-12, 12-15, 13-8,
13-11, 13-35, 13-47
free software ..................................................................... 2-51
frequency .......................................................................... 5-35
frequency characteristics .................................................... 5-9
frequency measurement ......................................... 2-13, 5-33
frequency module, LEDs on ................................................ 3-7
front panel ........................................................................... 1-1
FTP client ................................................................ 2-47, 15-8
FTP passive .................................................................... 15-47
FTP passive mode .......................................................... 15-47
FTP server ........................................ 2-48, 15-8, 15-10, 15-17
FTP server (on the Web browser) ................................... 15-28
function .......................................................... 5-34, 5-41, 18-3
functional ground terminal ............................................ 1-1, 1-2
fuse ................................................................................. 18-11
FV Setup ........................................................................... 5-34
G
Page
IM 701240-01E
Page
H&V ..................................................................... 11-15, 11-19
H&V cursor ...................................................................... 11-21
handling precautions ........................................................... 3-1
Hanning .......................................................... 2-41, 10-8, 10-9
HD ................................................................................... 13-21
HD out ................................................................................. 1-7
HDD ................................................................................ 17-13
HDD motor ........................................................................ 13-4
Hexa ................................................................................ 11-12
history ............................................................................. 13-15
history clear ....................................................................... 11-2
history data, statistical processing of .................... 2-46, 11-37
history map ....................................................................... 11-3
history memory ................................................................. 2-30
history search ................................................. 2-43, 11-5, 11-8
history statistics ............................................................... 11-34
history waveforms ............................................................. 11-1
history waveforms, displaying of ....................................... 2-43
hold off ................................................................................ 6-6
hold off time ........................................................................ 6-7
horizontal ............................................................ 11-11, 11-17
horizontal axis ..................................................................... 2-3
horizontal cursor ............................................................. 11-20
horizontal zoom ................................................................. 2-34
hysteresis .................................................................. 6-8, 6-10
I
Page
ID number of the internal hard disk ................................. 13-13
ID number of the SL1400 ................................................ 13-13
image data, attachment of .............................................. 15-15
immunity .......................................................................... 18-13
infinite .................................................................................. 7-3
initialization .................................................... 2-49, 4-15, 4-16
input conditions ....................................................... 5-34, 5-40
input coupling ............................................................... 2-8, 5-8
input module, precautions when installing .......................... 3-6
input modules ................................................................. iii, 1-3
input setup ........................................................................ 5-33
input signal trigger ............................................................. 2-17
input signal types .............................................................. 5-45
installation conditions .......................................................... 3-3
installation position .............................................................. 3-4
instrument information .................................................... 15-42
instrument number ................................................................. ii
insulation resistance ....................................................... 18-11
intensity ............................................................................. 16-4
internal clock ..................................................................... 5-50
internal hard disk ............................................................... 13-4
internal hard disk drive test ............................................. 17-14
internal ID ........................................................................ 13-12
internal memory, saving data in .............................. 2-39, 2-40
interpolation ..................................................... 8-3, 9-16, 9-17
interval .................................................. 5-3, 9-13, 9-14, 15-13
inversion .................................................................. 2-10, 5-21
IP address ................................................................ 15-3, 15-5
1
2
3
4
5
6
7
8
9
10
11
12
13
14
15
16
17
18
J
Page
jog shuttle, entering values using ........................................ 4-3
Jog Shuttle+SELECT ............................................................ ix
Jump Exec ...................................................................... 11-16
Index
gain ......................................................................... 5-31, 5-32
gateway ............................................................................. 15-3
gauge ............................................................. 9-7, 12-4, 13-45
gauge factor ................................................... 2-12, 5-26, 5-28
gauge factor, definition of ............................................. App-18
gauge print ..................................................... 9-9, 12-8, 13-47
general specifications ..................................................... 18-11
Get Measure ..................................................................... 5-20
GMT .................................................................... 15-44, 15-45
GND (input coupling) .......................................................... 2-8
GP-IB connector ................................................................. 1-4
graphic color ..................................................................... 16-3
graticule ....................................... 2-33, 9-8, 9-18, 12-8, 13-47
graticule width ........................................................... 9-9, 12-8
Greenwich Mean Time .................................................... 15-45
grid ................................................................... 2-33, 9-8, 9-18
grid width ........................................................................... 9-18
H
App
Index
Index-3
Index
K
Page
key operation ...................................................................... 4-1
key test ............................................................................ 17-14
keyboard .................................................................. 4-6, 17-12
keys, locking of ................................................................. 16-6
keyword ............................................. 9-25, 9-26, 13-46, 13-48
knobs .................................................................................. 1-5
L
Page
label .................................................................................. 8-19
language ........................................................................... 16-1
LCD ................................................................................... 16-5
LCD OFF ........................................................................... 16-5
length ...................................................................... 9-20, 9-22
level ..................................................................................... 6-8
level indicator ........................................................... 2-36, 8-22
line ............................................................................. 6-12, 8-3
line trigger ......................................................................... 2-17
linear interpolation ............................................................. 2-33
linear scaling ............................................................. 2-9, 5-18
link ................................................................................... 15-43
lock, releasing ................................................................... 16-6
log ................................................................................... 15-40
log mode .................................................................... 2-24, 6-2
logic ..................................................... 11-6, 11-7, 11-9, 11-10
logic bit .............................................................................. 6-15
logic input connector ......................................................... 3-28
logic pattern ...................................................................... 6-18
logic probe ............................................................................ iv
logic probe, connection of ................................................. 3-29
logic probe specifications ................................................ 18-36
logic probe types ..................................................... 3-28, 5-45
logic setup ....................................................................... 11-12
logic signal input connector ................................................. 1-4
logic trigger ....................................................................... 6-15
logic waveform, measurement example of ..................... 11-23
logic waveforms ................................................................ 2-16
login name ............................................................ 15-8, 15-10
low-pass filter .................................................................... 5-12
lower limit ................................................................ 5-15, 5-16
LPR client function .......................................................... 15-11
LPR name ....................................................................... 15-11
LPR server .......................................................... 15-11, 15-12
LPR timeout .................................................................... 15-47
M
Page
MAC address .................................................................. 15-46
Mag ..................................................................................... 8-8
magnified print ................................................................ 13-47
mail address .................................................................... 15-13
mail count ........................................................................ 15-14
mail server .......................................................... 15-13, 15-15
mail test ........................................................................... 15-13
mail test transmission ..................................................... 15-15
MailBaseTime ................................................................. 15-13
main power switch .............................................................. 1-4
make dir .......................................................................... 13-60
manual number ....................................................................... i
MANUAL TRIG ................................................................. 6-48
manual trigger ......................................................... 2-27, 6-48
mapping .............................................................................. 8-1
marker .................................................................. 11-13, 11-20
marker cursor .................................................................. 11-21
markings ............................................................................... ix
maximum sample rate ....................................................... 5-51
Index-4
measure .......................................................................... 13-32
measured values ..................................................... 9-10, 12-9
measurement item ............................................................ 5-41
measurement lead, connection of ..................................... 3-23
measurement parameters ............................................... 11-28
measurement range ............................................................ 2-6
measurement trend ......................................................... 15-34
media info ........................................................... 13-10, 13-11
memory ........................................................................... 17-12
memory test .................................................................... 17-14
menu language ................................................................. 16-1
mesial .............................................................................. 11-27
message ........................................................................... 17-2
message language ............................................................ 16-1
mode ..................................... 6-1, 6-45, 6-46, 7-13, 7-14, 10-1
MODEL .................................................................................. ii
module, installation procedure of ........................................ 3-6
module specifications ...................................................... 18-14
Move to Front ...................................................................... 8-9
moving average ................................................................ 2-15
multiplication ..................................................................... 10-1
mV/V ................................................................................. 5-25
N
Page
name plate .......................................................................... 1-4
net mask ........................................................................... 15-3
net print ........................................................................... 12-15
NetWork .......................................................................... 13-21
network ............................................................................. 15-2
network drive ................................................................... 15-49
network printer ..................................................... 12-15, 15-12
NO. ......................................................................................... ii
normal ....................................................... 1-7, 7-3, 12-1, 12-6
normal mode ............................................. 2-24, 2-28, 6-1, 7-4
number of times condition is met ...................................... 6-19
numbering ....................................................................... 13-21
numeric ............................................................................. 9-13
numeric monitor ....................................................... 2-36, 8-24
numeric value recording .................................................... 2-37
numeric values .................................................................. 9-13
O
Page
offset ................................................................................. 5-17
offset function .................................................................... 2-16
operating altitude ............................................................ 18-11
operating temperature range .......................................... 18-11
operation ............................................................ 4-2, 4-4, 10-1
operation (USB mouse) ...................................................... 4-9
operation, flow of .................................................................... x
optional accessories ............................................................. iv
options ................................................................................... ii
OR trigger ................................................................ 2-19, 6-27
order ................................................................................ 11-12
orientation ......................................... 9-25, 9-26, 13-46, 13-48
output device ........................................................... 9-13, 9-14
output format ........................ 12-6, 12-14, 12-16, 13-37, 15-12
output resolution ................................................. 12-14, 12-16
overall value .................................................................... 10-10
overview .......................................................................... 17-15
own ID ............................................................................. 13-12
P
Page
P-P Comp ....................................................................... 13-15
P-P compression ..................................................... 2-4, 13-20
P1-P2 ........................................................................ 2-9, 5-19
IM 701240-01E
Index
IM 701240-01E
probe compensation signal output terminal ........................ 1-1
probe, connection of ......................................................... 3-15
probe, phase correction of ................................................ 3-21
probe power ........................................................................ 1-2
property .................................................... 13-17, 13-22, 13-55
PROTECT key ........................................................... 1-1, 16-6
protective grounding ............................................................. vii
proximal .......................................................................... 11-27
pull up ............................................................................... 5-40
pulse ....................................................................... 2-10, 5-42
pulse average ................................................................... 2-16
pulse integration ............................................. 2-14, 5-38, 5-42
pulse width ............................................ 2-14, 5-37, 5-42, 6-33
pulse width trigger ............................................................. 6-30
pulse/rotate ............................................................. 5-49, 5-51
Q
1
2
3
4
5
Page
quad ...................................................................... 8-14, 11-17
6
R
7
Page
R ..................................................................................... 13-55
R/W ................................................................................. 13-55
range ......................................................................... 5-4, 5-13
RANGE FINE .................................................................... 5-13
read direction .................................................................. 11-22
realtime ........................................................................... 13-50
RealTime Out ...................................................................... 7-9
realtime recorded waveforms, loading of ........................ 13-50
realtime recording ..................................................... 2-31, 7-9
realtime recording area ......................................... 13-9, 13-11
recall ................................................................................. 13-2
recommended replacement parts ................................... 17-16
RECORD COND ................................................................. 9-3
record condition .................................................................. 9-3
record length ................................................................ 2-4, 5-3
record time .................................................................. 2-3, 5-2
recorder mode ..................................................................... 9-1
recording format .................................................................. 9-8
Rect ................................................................................... 10-8
rectangular .............................................................. 2-41, 10-9
Ref Value ........................................................................ 11-14
reference cycle ......................................................... 6-40, 6-43
reference date and time .................................................... 6-14
reference junction compensation ............................ 2-12, 5-24
rename ............................................................................ 13-59
replacement period ......................................................... 17-16
reprint ...................................................................... 2-40, 9-20
reprint setup ............................................................ 9-20, 9-24
resolution ............................................................ 12-12, 12-15
response time ..................................................................... 7-2
result window .................................................................... 8-10
revolution .......................................................................... 5-35
RJC ................................................................ 2-12, 5-23, 5-24
RMS measurement .................................................. 2-11, 5-22
roll mode ............................................................................. 5-3
roll mode display ................................................................. 2-5
roll paper ....................................................................... v, 3-10
roll paper handling ............................................................ 3-10
rotate ................................................................................. 2-10
rotations, number of .......................................................... 5-42
RPMs ...................................................................... 2-13, 5-35
RPSs ....................................................................... 2-13, 5-35
Running ............................................................................... 1-7
Index-5
8
9
10
11
12
13
14
15
16
17
18
Index
package, checking the contents of ......................................... ii
panel keys ........................................................................... 1-5
paper, feeding of ............................................................... 3-12
paper size ......................................... 9-25, 9-26, 13-46, 13-48
parameter .......................................................................... 11-8
partition .................................................................. 13-9, 13-11
parts replacement ........................................................... 17-16
passive probe ........................................................................ iv
password ......................................... 15-8, 15-10, 15-17, 15-19
PC card ...................................................... 13-3, 13-21, 17-13
PC card interface test ..................................................... 17-14
PC card slot ........................................................................ 1-4
PC environment .............................................................. 15-21
PC OS ............................................................................. 13-62
PC, TCP/IP settings of ...................................................... 15-6
PDF ................................................................................. 13-43
PDF file ............................................................................. 9-24
PDF file, creation of ................................................ 2-40, 2-51
PDF file example ................................................... 9-28, 13-49
PDF setup ......................................................................... 9-25
period ................................................................................ 5-36
period trigger ........................................................... 2-21, 6-34
periodic mail .................................................................... 15-16
persist ................................................................................. 8-6
phase .............................................................................. 10-13
phase correction of the probe ........................................... 3-21
phase shift ............................................................. 2-42, 10-12
phase, shifting of ............................................................. 10-11
pointer ...................................................................... 9-17, 9-18
port number .................................................................. App-30
position ................................................................. 5-6, 6-3, 8-8
Post... .................................................................................. 1-7
power connector ................................................................. 1-4
power cord, connection of ................................................... 3-8
power cycle ....................................................................... 15-4
power down operation ......................................................... 3-9
power frequency ............................................................... 5-37
power spectrum computation ............................................ 10-7
power spectrum display .................................................... 2-41
power supply frequency ................................. 2-14, 5-37, 5-42
power supply, warning concerning ...................................... 3-8
power switch, turning ON/OFF of ........................................ 3-9
power up operation ............................................................. 3-9
Pre... ................................................................................... 1-7
precautions, handling .......................................................... 3-1
precautions, safety ......................................................... vi, 3-1
preset ...................................................................... 5-33, 5-39
preview .................................................. 9-21, 9-22, 12-5, 12-9
print example (numeric value recording) ........................... 9-15
print example (reprint) ....................................................... 9-23
print example (T-Y waveform recording) ........................... 9-12
print example (X-Y waveform recording) .......................... 9-19
print font .................................................................. 9-17, 9-18
print interval .............................................................. 9-9, 12-8
Print Mag ........................... 9-20, 9-22, 9-24, 9-26, 12-2, 13-43
print magnification ............................................................. 12-7
print setup ......................................................................... 9-16
print size .......................................................................... 12-14
print style .................................................................... 2-37, 9-3
print to ....... 9-20, 9-21, 9-24, 9-26, 12-1, 12-11, 12-15, 13-43,
13-47
printer .............................................................................. 17-13
printer name .................................................................... 15-12
printer output ....................................................................... 9-3
printer roll paper ............................................................ v, 3-10
printer test ....................................................................... 17-14
probe ....................................................................... 5-10, 5-44
probe attenuation ................................................................ 2-9
App
Index
Index
S
Page
safety precautions .......................................................... vi, 3-1
safety standard ............................................................... 18-12
sample rate ............................................... 2-3, 5-2, 9-16, 9-17
sample rate, maximum ...................................................... 5-51
sampling interval ................................................................. 5-3
satisfaction, time of ........................................................... 6-36
save interval ........................................................ 13-15, 13-20
scale ............................................. 9-7, 9-18, 10-1, 12-4, 13-45
scale font ........................................................................... 16-2
scale value display ............................................................ 8-18
scale values ............................................................ 2-36, 8-18
scaling ............................................................................... 10-3
scaling of computed waveforms ........................................ 2-42
screen color ...................................................................... 16-4
screen image data, saving of .......................................... 13-35
screen image, printing of ................................................... 2-49
scroll direction ................................................................... 8-12
scroll speed ....................................................................... 8-12
SCSI ................................................................................ 17-13
SCSI connector ................................................................... 1-4
SCSI device, connection of ............................................... 13-7
SCSI ID ........................................................................... 13-12
SCSI test ......................................................................... 17-14
SCSI5 .............................................................................. 13-21
SCSI5-1 .......................................................................... 13-21
search condition ..................................................... 11-7, 11-10
search mode ........................................................... 11-5, 11-8
search parameter ............................................................ 11-10
search result window ........................................................ 8-12
search setup ........................................................... 11-5, 11-8
search zone ...................................................................... 11-7
select param ..................................................................... 11-8
self test ............................................................................ 17-12
send mail ......................................................................... 15-14
sensitivity ................................................................ 5-31, 5-32
sensor (frequency module) ............................................... 3-32
sequence .............................. 6-45, 6-46, 7-9, 7-10, 7-13, 7-14
sequential store ......................................................... 2-29, 7-8
set pattern ................................................................ 6-17, 6-20
Set/Reset ........................................................................ 13-54
setup data, saving of ....................................................... 13-23
setup menu, displaying of ................................................... 4-1
setup parameters that are saved .................................... 13-26
shot recording ............................................................. 9-3, 9-5
show map .......................................................................... 11-2
show result ...................................................................... 11-35
shunt calibration ......................................... 2-13, 5-30, App-19
shunt resistance ........................................................... App-21
side panel, left ..................................................................... 1-4
side panel, right ................................................................... 1-2
signal flow ........................................................................... 2-2
signal output source .......................................................... 3-32
simple .................................................................................. 6-8
simple trigger .................................................................... 2-17
sine ..................................................................................... 8-3
sine interpolation ............................................................... 2-33
single ................................................................................... 7-9
single (N) ............................................................................. 6-1
single (N) mode ......................................................... 2-24, 6-2
single mode ................................................................ 2-24, 6-1
size .................................................................................. 12-12
SL1400 environment ....................................................... 15-22
slope ................................................................................... 6-8
smoothing filter .................................................................. 2-15
SMTP client ....................................................................... 2-48
SMTP client function ....................................................... 15-13
SMTP timeout ................................................................. 15-47
Index-6
SNAPSHOT ...................................................................... 8-16
snapshot .................................................................. 2-35, 8-16
snapshot waveforms, saving of ....................................... 13-28
SNTP .............................................................................. 15-44
SNTP server time .............................................................. 3-14
soft key ............................................................................ 17-12
soft keys .............................................................................. 1-1
source ................................................................................. 6-8
span .................................................................................... 5-5
spare parts ............................................................................. v
specifications .................................................................... 18-1
speed ................................................................................ 8-10
stand ................................................................................... 1-2
standard accessories ............................................................ iii
standard operating conditions ......................................... 18-11
standard time .................................................................. 15-45
start mode (power on) ......................................................... 7-1
start point .......................................................................... 8-14
start record ........................................................................ 11-1
START/STOP Response Time ........................................... 7-1
statistical processing .................................. 2-45, 11-32, 11-36
statistics .......................................................................... 11-32
stop prediction ......................................................... 2-15, 5-43
Stopped ............................................................................... 1-7
storage altitude ............................................................... 18-11
storage media ................................................................. 13-21
storage temperature ........................................................ 18-11
store ........................................................................ 13-1, 13-2
STP cable ......................................................................... 15-1
strain ................................................................................. 2-12
strain, definition of ........................................................ App-18
strain gauge, connection of ............................................... 3-25
strain measurement ................................................ 2-12, 5-25
string, entry of ................................................................... 2-49
strings, entry of ................................................................... 4-4
sub title .............................................. 9-25, 9-26, 13-46, 13-48
subnet mask ...................................................................... 15-5
subtraction ........................................................................ 10-1
suffix code .............................................................................. ii
synchronization channel ......................................... 6-40, 6-43
system conditions ........................................................... 17-15
system configuration ........................................................... 2-1
system requirements ....................................................... 15-21
T
Page
T < T1, T2 < T ................................................................... 2-22
T < Time ............................................................................ 2-21
T > Time ............................................................................ 2-21
T-Y .................................................................................... 8-13
T-Y recording to the built-in printer ..................................... 9-5
T-Y waveform recording ............................................ 2-37, 9-3
T-Y waveform recording, starting of .................................. 9-11
T-Y&X-Y ............................................................................ 8-13
T/div .................................................................................... 2-3
T1 < T < T2 ....................................................................... 2-21
TC (input coupling) .............................................................. 2-8
TCP/IP, setting up the ....................................................... 15-3
temperature measurement ....................................... 2-12, 5-23
temperature unit ................................................................ 5-24
test item .......................................................................... 17-12
test type .......................................................................... 17-13
thermocouple, connection of ............................................. 3-24
thermocouple type .................................................. 2-12, 5-24
thumbnails ....................................... 2-50, 13-39, 13-40, 13-42
time ..................................... 3-14, 6-13, 6-30, 9-7, 12-4, 13-45
time 1 ................................................................................ 6-34
time 2 ................................................................................ 6-34
IM 701240-01E
Index
time axis .............................................................................. 2-3
time base ................................................................ 5-49, 5-50
time difference from GMT ............................................... 15-44
time interval ....................................................................... 6-14
time print ........................................................ 9-9, 12-8, 13-47
time reference mark ............................................................ 6-4
time unit ............................................................................ 5-43
time window ...................................................................... 10-9
timeout ............................................ 15-8, 15-10, 15-17, 15-19
timer trigger ............................................................. 2-17, 6-13
title .................................................... 9-25, 9-26, 13-46, 13-48
top panel ............................................................................. 1-1
trace label ......................................................................... 8-19
trademarks .............................................................................. i
translucent ........................................................................ 8-17
translucent display ............................................................ 2-35
transmission interval ....................................................... 15-15
transmission time ............................................................ 15-15
TRIG IN ............................................................................. 14-1
TRIG OUT ......................................................................... 14-2
trigger delay .............................................................. 2-25, 6-5
trigger hold-off ................................................................... 2-26
trigger hysteresis ............................................................... 2-26
trigger input terminal ........................................................... 1-4
trigger level ................................................................ 2-25, 6-9
trigger mode .............................................................. 2-24, 6-1
trigger mode (chart recorder mode) .................................... 9-5
trigger mode (realtime recording) ...................................... 7-10
trigger on the power signal ................................................ 6-12
trigger output ..................................................................... 14-2
trigger output terminal ......................................................... 1-4
trigger position ........................................................... 2-25, 6-3
trigger slope ............................................................ 2-25, 6-10
trigger source ............................................................. 2-25, 6-9
trigger type ........................................................................ 2-17
troubleshooting ................................................................. 17-1
TTL .................................................................................... 5-45
type ................................................................................... 5-23
U
Page
Waiting for trigger ................................................................ 1-7
warm-up time .................................................................. 18-11
wave window ..................................................................... 6-40
wave window trigger ................................................ 2-23, 6-40
waveform acquisition .......................................................... 7-1
waveform data, clearing of ................................................ 11-3
waveform data, saving of ................................................ 13-14
waveform display area expansion ..................................... 2-36
waveform display area, expansion of ................................ 8-24
waveform inversion ........................................................... 5-21
waveform label ......................................................... 2-36, 8-19
waveform mapping ..................................................... 2-32, 8-2
waveform parameter search ............................................. 2-43
waveform parameter values, trend of ............................. 15-34
waveform parameters, automated measurement of ........ 2-45,
11-25
waveform parameters, saving the result of the auto ....... 13-32
Web server ............................................................ 2-48, 15-20
weight ...................................................................... 7-3, 18-11
Wheatstone Bridge ...................................................... App-18
width .................................... 6-38, 6-41, 9-6, 9-16, 12-4, 13-44
window .............................................................................. 6-37
Window Mag ........................................................... 9-20, 9-24
Window Pos ............................................................ 9-20, 9-24
window trigger ......................................................... 2-22, 6-37
window width ..................................................................... 6-44
Windows 2000 ..................................................... 13-62, 15-21
Windows network drive ................................................... 15-48
Windows XP ........................................................ 13-62, 15-21
withstand voltage ............................................................ 18-11
2
3
4
5
6
7
8
9
10
11
12
X
Page
X axis ................................................................................ 8-13
X trace ............................................................................... 8-13
X-axis mode ...................................................................... 8-14
X-Y .................................................................................... 8-13
X-Y recorder ........................................................................ 9-1
X-Y recorder mode ..................................................... 2-40, 9-1
X-Y waveform ................................................................... 2-35
X-Y waveform recording ................................ 2-40, 9-16, 9-17
Z
Page
zone ........................................................................... 8-1, 11-5
zone search ...................................................................... 2-43
zoom, horizontal ................................................................ 2-34
zoom position ................................................. 5-14, 8-12, 9-22
zoom print ................................................................ 12-2, 12-6
zoom rate .............................................. 5-13, 5-14, 8-11, 9-22
zoom, vertical ...................................................................... 2-7
zoom waveform, screen when displaying ........................... 1-8
zoomed trace .................................................................... 8-11
13
14
15
16
17
18
Index
Page
value entry using the USB keyboard ................................... 4-6
values, entry of ........................................................... 2-49, 4-3
velocity ........................................................... 2-14, 5-38, 5-43
vent holes ............................................................................ 1-4
vertical .................................................................. 11-12, 11-18
vertical axis ......................................................................... 2-6
vertical cursor .................................................................. 11-21
IM 701240-01E
W
1
Page
unit ............................................................................... ix, 10-3
unit/pulse ........................................................................... 5-42
upper limit ................................................................ 5-15, 5-16
USB ................................................................................. 13-21
USB connector for a PC ...................................................... 1-4
USB connector for peripherals ............................................ 1-4
USB keyboard ..................................................................... 4-6
USB keyboard, key assignments ................................. App-13
USB keyboard language ................................................... 16-1
USB mouse ......................................................................... 4-9
USB mouse operation ....................................................... 2-49
USB PERIPHERAL interface ............................................ 18-8
USB printer ..................................................................... 12-11
USB storage device .......................................................... 13-5
user account ................................................................... 15-17
user name ........................................................... 15-17, 15-19
UTP cable ......................................................................... 15-1
V
vertical position ........................................................... 2-7, 5-7
vertical zoom ....................................................................... 2-7
VIDEO OUT (SVGA) ......................................................... 14-4
video signal output ............................................................ 14-4
voltage axis ......................................................................... 2-6
voltage range ............................................................... 2-6, 5-4
App
Index
Index-7