1
SERVICE MANUAL
FOR
MODEL 902 AUTOMATIC
ANALYZER
Copyright Hitachi, Ltd. 1997. All rights reserved. Printed in Japan.
Part No. 713-9039 KN-K (H-LT)
MODEL 902 AUTOMATIC ANALYZER
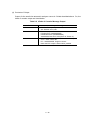
CONTENTS
1.
PRODUCT SPECIFICATIONS ................................................................................. 1-1
2.
TROUBLESHOOTING ............................................................................................. 2-1
3.
FLOW PATH DIAGRAMS ........................................................................................ 3-1
4.
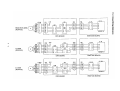
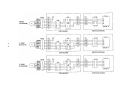
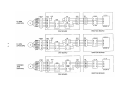
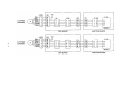
BLOCK DIAGRAMS ................................................................................................. 4-1
5.
ISE ........................................................................................................................... 5-1
6.
SWITCH SETTING................................................................................................... 6-1
7.
EXPLANATION OF FUNCTION ............................................................................... 7-1
8.
MOTORS, DETECTORS AND FUSES .................................................................... 8-1
9.
ANALYTICAL METHODS......................................................................................... 9-1
10.
CIRCUIT DIAGRAMS ............................................................................................... 10-1
11.
CROSS WIRING REFERENCE ............................................................................... 11-1
12.
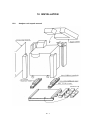
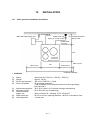
INSTALLATION........................................................................................................ 12-1
13.
MAINTENANCE AND INSPECTION ........................................................................ 13-1
14.
ADJUSTMENT SPECIFICATIONS ........................................................................... 14-1
15.
OEM ......................................................................................................................... 15-1
16.
SYSTEM INTERFACE.............................................................................................. 16-1
-i-
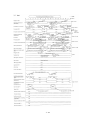
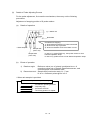
1. PRODUCT SPECIFICATIONS
1.1
Overall System .........................................................................................................1-1
1.2
Sampling System .....................................................................................................1-2
1.3
Reagent System.......................................................................................................1-3
1.4
Reaction System ......................................................................................................1-4
1.5
Photometic System ..................................................................................................1-5
1.6
ISE (option) ..............................................................................................................1-5
1.7
Installation Conditions ..............................................................................................1-6
1.8
User Interface...........................................................................................................1-6
1.9
Dionized Water ........................................................................................................1-6
1.10 Analytical Methods ...................................................................................................1-7
1.11 Accuracy Methods....................................................................................................1-7
1.12 Data Storage ............................................................................................................1-7
1.13 System Interface ......................................................................................................1-8
1.14 Options for Analyzer.................................................................................................1-8
1-0
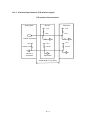
1. PRODUCT SPECIFICATIONS
1.1
Overall System
Configuration
: Console type automatic analyzer, with analytical and operation units
integrated
Principle
: Discrete type, random access, single-line multi-analysis system;
entire reaction monitoring system
Analytical methods
: Colorimetry (absorbance measurement), ion selective electrode
method (ISE; option)
Throughput
: Colorimetry
No. of analysis items : Colorimetry
ISE
Serum indexes
Calculation items
; 200 tests/hr (Photometry only max. 300 tests/hr
inclusive of ISE)
;
;
;
;
36
3 (Na, K, Cl)
3
8
Reaction time
: 10 minutes max.; 3, 4, 5, 10 minutes for concentration calculation
(same as Model 7070/7170)
Measurable samples
: Serum (or blood plasma) and urine; one sample kind per channel
Application
: Emergency (stat) and routine analyses
Test item selection
: Via entry from operation panel, entry from system interface, entry
from no. of items settable (11 kinds)
1-1
1.2 Sampling System
Sample container
: Hitachi standard sample cup
Sample tube ; diameter 13 to 17 mm
length 75 to 100 mm
Sample disk
: 60 positions
Outer row; 35 positions (routine and stat samples)
(with free adapter, barcode reader attachable)
Inner row; 25 positions (standard + control samples (22),
rinse solutions (3))
Detergents
: 3 kinds
(W1 ; for sample probe rinsing) HITERGENT
(W2 ; for sample carryover evasion) ISE RINSE SOLUTION
(W3 ; for sample carryover evasion) HICARRYNON
Sampling mechanism
: Pipetter driven by stepping motor
2 to 50 µL of sample/test (in 0.1 µL steps)
Pipetting mode
: Normal
; prescribed volume discharged at cell
bottom
Aqueous sample ; system water solution for sample probe
internal rinsing usable as STD-1
Sample pre-dilution not performed
Insufficient sample detection : Resistance detection method
Sample ID
: Barcode reader (option)
Following code shemes are usable in combination; CODE 39,
CODE 128, INTERLEAVED 2 OF 5, NW7 (Modulas 10,
Modulas 16)
Automatic rerun
: Auto rerun function not provided
Stat sample analysis
: Routine sample analysis interruptible for stat sample analysis
Sample carryover
: Sample carryover evasion function available; 2 kinds of
detergents settable on sample disk inner row
Sample conveyance
: Can be sampled directly from belt-line
1-2
1.3 Reagent System
Reagent disk
:
One disk, 40 positions
(20 positions each on inner and outer rows)
Reagent cooling
:
Cooling water circulating system (3 to 15°C) (option for Chinadestined instrument)
Reagent bottle
:
50 mL, 20 mL (adapter necessary)
(without barcode, concentrated reagent unusable)
Detergents
:
HITERGENT (50 mL); position 40 (fixed)
(for addition to reaction bath)
Detergent 1 ; for reagent probe, stirring rod rinsing, reagent
probe carryover evasion, reaction cell carryover
evasion
Detergent 2 ; for reagent probe carryover evasion, reaction cell
carryover evasion
(settable on reagent disk inner row)
ISE reagent
:
Internal standard solution (position 37 (fixed))
Diluent
(position 38 (fixed))
Pipetting mechanism
:
Pipetter driven by stepping motor; 20 to 350 µL/test (in 1 µL
steps)
Reagent addition timing :
3 steps (0, 1.5 and 5 minutes); throughput is maintained even
when adding 3 reagents.
Carryover evasion
Rinsing for carryover evasion possible; throughput may decrease
by specifying carryover evasion.
:
1-3
1.4 Reaction System
Reaction disk
: Turntable type disk (10-minute reaction per rotation)
Reaction cell
: Optical path length 6 mm (area 6 × 5 mm)
No. of reaction cells
: 48
Reaction cell control
: One rotation + one pitch feed (18 seconds)
Sample pipetting position : One position (fixed)
Reagent pipetting position : One position (fixed)
Reaction temperature
: 37 ± 0.1°C (warm water circulating system)
Stirring
: By means of stirring rod rotation
Timing for stirring; after each addition of R1,R2,R3
Stirring possible for a minimum volume of 100 µL
Stirring position
: One position (fixed)
Reacting solution volume : Minimum ; 250 µL (minimum required volume for photometry)
Maximum ; 500 µL (temperature control, rinsing upper limit)
Photometric position
: One position (fixed)
Cell rinsing
: After completion of photometry (rinsing 3 times; rinsing with
detergent not performed)
Carryover evasion
: Rinsing for carryover evasion possible; throughput may decrease
by specifying cell carryover evasion
1 -4
1.5
Photometric System
Photometer
: Multiwavelength photometer (absorptiometry)
Wavelengths
: 12 wavelengths
(340, 376, 415, 450, 480, 505, 546, 570, 600, 660, 700, 800 nm)
Monochromator
: Grating
Detector
: Photodiode
Linearity
: Up to 2.5 Abs (10 mm cell conversion)
Photometric method : Direct photometry of reaction cell (at one or two wavelengths)
Correction
1.6
: Cell blank correction prior to analysis
(passed cell blank measurement alone)
ISE (option)
Electrodes
: Flow cell type, liquid-membrane ISE cartridge
Reference electrode flow path : 1 MKCL, liquid flow path
Measuring temperature
: 36°C ± 2°C (warm water circulating system)
System
: Indirect (dilution) potentiometry, 50-times dilution
Measuring cycle
: 36 sec/sample (18 sec for sample, 18 sec for internal
standard solution)
Measured items
: Na, K, Cl
Measurable samples
: Serum and urine
Linearity
: Na ; 10 to 250 mmol/L
K ; 1 to 100 mmol/L
Cl ; 10 to 250 mmol/L
Reagent bottle
: Internal standard solution
; 50 mL max.
Diluent
; 50 mL max.
Reference electrode solution ; 500 mL max.
1-5
1.7
Installation Conditions
Power requirement
: 230 V, 50/60 Hz, less than 1.5 kVA
Deionized water consumption : Less than 15 L/hr
Waste liquid drain
: 2 systems (for concentrated and diluted liquids)
Ambient temperature/humidity : Temperature ; 18 to 30°C
Humidity
; 20 to 80% (non-condensing)
Analyzer dimensions
: 720 W × 720 D × 1085 H mm
Analyzer weight
: Within 200 kg
BTU
: 1300 kcal/hr max.
Noise (mean) in operation
: < 55 dB
1.8
User Interface
Application
: Routine analysis for Asia version
Display
: Backlighted LCD; 256 × 128 dots, graphic
Keyboard
: Touch screen keys (72 keys)
Printer
: Thermal roll-paper printer (20 digits)
Multi-language
compatibility
1.9
: Display ; Japanese/English/Chinese/German/Spanish applicable
Printer ; English alone
Deionised Water
Pressure
: 0.5 to 3.5 kgf/cm2
Conductivity : 1 µs/cm or less, germ-free
1-6
1.10 Analytical Methods
Assay modes
: One-point
One-point end (+ prozone check)
Two-point rate
Two-point end (+ prozone check)
Three-point two-item
One-point rate two-item
Rate A (+ sample blank correction)
Rate A (+ serum indexes)
Rate B two-item (same wavelength)
Rate B two-item (different wavelengths)
ISE
Data alarms
: Based on Model 7070/7170
Standard solution
: 22 kinds max. (positions to be shared with control sera)
Calibration types
: Linear (2-point linear)
K factor
4 parameter LOGIT-LOG
5 parameter LOGIT-LOG
Spline
Segmented line
Calibration method
: At startup only; all points (FULL) and reagent-blank-corrected
calibration
Calculation channels
: For 8 channels
Test-to-test compensation
: For 8 channels
1.11 Accuracy Control
Control serum
: 5 kinds max. (positions shared with standard solutions)
1.12 Data Storage
Routine sample data
: 400 samples (in data disk)
Stat sample data
: 50 samples (in data disk)
Control sample data
: 5 kinds × 30 (in SRAM)
1-7
1.13 System Interface
Interface
: RS-232C and current loop
Communication protocol : Based on Model 7070/7170
Communication details
: Communication with host; communication details based on Model
7070/7170
1.14 Options for Analyzer
ISE
Sample ID accessory
: Model
; BL180
Maker
; Keyence
Barcode spec. ; CODE 39, ITF, NW7 (Modulas 10, Modulas 16),
CODE 128
1-8
2. TROUBLESHOOTING
2.1
Alarm Code Table ....................................................................................................2-1
2.1.1
LCD Display Alarm .....................................................................................2-24
2.2
Motor Control Alarms................................................................................................2-26
2.2.1
Operation Check Procedure at Occurrence of Alarm .................................2-27
2.3
Parameter Check .....................................................................................................2-29
2.3.1
Processing Flow .........................................................................................2-29
2.3.2
Details of Parameter Check........................................................................2-30
2.3.3
Details of Twin Test Simultaneous Analysis ...............................................2-34
2.4
Data Alarm ...............................................................................................................2-35
2.4.1
Data Alarm Registratin Flow .......................................................................2-35
2.4.2
Data Alarm Code List..................................................................................2-36
2.4.3
Data Alarm Codes ......................................................................................2-37
2.4.4
ISE Data Alarms .........................................................................................2-49
2.4.5
Alarm Check Method ..................................................................................2-52
2.4.6
Check and Set Alarm of Each Data ............................................................2-60
2.4.7
Details of Data and Alarm Outputs Resulting from Calibration ...................2-61
2.4.8
Output Check List for Each Photometry Assay CALIB. METHOD .............2-62
2.5
Retry Code Table .....................................................................................................2-64
2.5.1 Logging Program List ......................................................................................2-65
2.6
Daily Alarm Trace.....................................................................................................2-67
2.6.1
Cumulative Alarm Trace .............................................................................2-69
2.6.2
Parameter Code List...................................................................................2-72
2.6.3
Communication Trace.................................................................................2-74
2.6.4
Cumulative Instrument Operation List.........................................................2-78
2.6.5
FD File Management ..................................................................................2-79
2-0
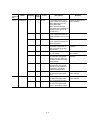
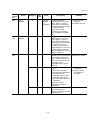
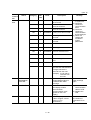
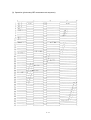
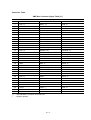
2. TROUBLESHOOTING
2.1
Alarm Code Table
Category
1
2
3
4
5
6
7
8
9
10
11
12
13
14
15
16
17
18
19
20
21
22
23
24
25
26
27
28
29
30
31
32
33
34
35
36
37
Alarm Name
Category
38
39
40
41
42
43
44
45
46
47
48
49
50
51
52
53
54
55
56
57
58
59
60
61
62
63
64
65
66
67
68
69
70
71
72
73
74
STIRRER
RINSE
R.DISK
S.PROBE
S.DISK
S. SHORT
S. SYRINGE
REAG. PROBE
REAG. DISK
R. SYRINGE
ISE SIPPER
ISE SYRING.
ISE STOP ?
TEMP CONT.
INC. WATER
REF. WATER
DIST. WATER
DIST. SENS.
RESERVOIR
SIPPER
Alarm Name
VAC. TANK
LAMP
CELL BNK1
CELL BNK2
ADC1 ?
ADC2 ?
ADC3 ?
BARCODE 1
BARCODE 2
REAG. SHORT
REAG. LEVEL
TS OVER
PATNT OVER
SAMP. END
DC POWER
FUSE
POWER FAIL
(cont’d)
2-1
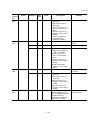
Category
75
76
77
78
79
80
81
82
83
84
85
86
87
88
89
90
91
92
93
94
95
96
97
98
99
100
101
102
103
104
105
106
107
108
109
110
111
112
113
Alarm Name
MOTOR CONT.
MOTOR TOUT
Category
114
115
116
117
118
119
120
121
122
123
124
125
126
127
128
129
130
131
132
133
134
135
136
137
138
139
140
141
142
143
144
145
146
147
148
149
150
151
152
STANDARD ?
CALIB.
CALIB. SD ?
SENS. ?
ISE LEVEL
ISE NOISE
ISE PREP.
ISE SLOPE
ISE I. STD
REF. SHORT
TWIN TEST ?
CHEM. PARAM ?
CLB. PARAM ?
VOLUME ?
CMP. TEST ?
S. INDEXES ?
ON BOARD ?
REAG. POS ?
CLB (IS) POS
2-2
Alarm Name
ACI ERROR
FD WRITE ?
FD READ ?
NO FD
FD PROTECT
PRINTER
SYSTEM I/F
WATER EXG.
PANEL I/F
REAGNT ?
CELL C. O.
ISE C. O.
Alarm
Alarm
Control
No.
1 to 8
STIRRER
21,22
RINSE
Category
Subcode
1
1
STOP
1
2
STOP
1
3
STOP
1
4
STOP
1
5
STOP
1
6
STOP
1
7
STOP
1
8
STOP
3
1
STOP
3
2
STOP
Level
Description
In ascending action of the
stirrer, it does not reach the
upper dead point (on the
rinsing bath side).
(Alarm at the first upper
dead point after resetting will
be issued from other than
the cell side.)
In ascending action of the
stirrer, it does not reach the
upper dead point (on the cell
side).
In descending action of the
stirrer, it does not leave the
upper dead point.
When the stirrer moves
toward the rinsing bath, it
does not reach the rinsing
bath position.
The stirrer does not come to
the cell position.
At resetting, the stirrer does
not reach the rinsing bath
position (home position) in
its return movement to the
home position.
At resetting, the stirrer does
not leave the rinsing bath
position (home position) in
its departing movement
from the home position.
In rotation of the stirrer, it is
not set at the upper dead
point.
The rinsing mechanism does
not reach the upper dead
point in ascending motion.
The rinsing mechanism does
not leave the upper dead
point in descending motion.
2-3
Remedy
Check the upper dead
point detector.
Same as above
Same as above
Check the home
detector.
Check the detector on
the cell side.
Check the home
detector.
Same as above
Check the upper dead
point detector.
Check the upper dead
point detector.
Same as above
(cont’d)
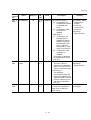
Alarm
Control
No.
61 to 65
71
Alarm
R. DISK
SAMPLE
PROBE
Category
Subcode
5
1
5
Level
Description
Remedy
STOP
The reaction disk cannot
recognize its stop position.
2
STOP
5
3
STOP
5
4
STOP
5
5
STOP
6
1
S.STOP/
STOP
The reaction disk does not
stop at the specified
position.
At resetting, the reaction
disk cannot recognize its
home position.
At resetting, the first cell
on reaction disk does not
stop at the specified
position.
When the reaction disk
turns, the serum probe,
reagent probe, stirrer or
rinsing mechanism is not
set at the upper dead point
(on the cell side).
(When this alarm is
issued, another alarm (on
rinsing or stirring
mechanism) may concur.)
The serum probe does not
reach the upper dead point
in ascending motion (on
other than the cell side).
(Alarm at the first upper
dead point after resetting
will be issued from other
than the cell side.)
The serum probe does not
reach the upper dead point
in ascending motion (on
the cell side).
The serum probe moves
down abnormally in
descending action (on
other than the cell side).
(±3 mm from cup bottom,
0 to 4 mm from cell
bottom)
The serum probe moves
down abnormally in
descending action (on the
cell side).
The serum probe does not
go down from the upper
dead point in descending
motion.
Check the detectors for
stop positions on the
inner and outer tracks.
Same as above
(Note 1)
72 to 85
SAMPLE
PROBE
6
2
STOP
6
3
S.STOP/
STOP
(Note 1)
6
4
STOP
6
5
S.STOP/
STOP
(Note 1)
NOTE: 1. S.STOP may be issued only during operation.
2-4
Check the home
detector.
Check the home
detector or inner/outer
track detector.
(1) Perform resetting.
(2) Check the upper
dead point detector
of the mechanism
which caused
alarm.
Check the upper dead
point detector.
Same as above
(1) Check the liquid
level detector.
(2) Replace the liquid
level detector PC
board.
Same as above
Check the upper dead
point detector.
(cont’d)
Alarm
Alarm
Control
No.
72 to 85 SAMPLE
PROBE
Category
Subcode
6
6
Level
STOP
Description
The serum probe does not
go down from the upper
dead point in descending
motion (on the cell side).
Detection of abnormal
6
7
S.STOP/
descending motion of the
STOP
serum probe remains on.
(Note 1)
When serum probe turns to
6
8
S.STOP/
the cell side, the cell position
STOP
cannot be detected.
(Note 1)
6
9
S.STOP/
When the serum probe turns
STOP
from the cell side to other
position, it does not come off
(Note 2)
the cell position.
6
11
S.STOP/
Before the probe goes down,
STOP
the liquid level detector is
(Note 1)
already turned on.
6
12
WARNIN
The serum probe moves
G
down abnormally in
descending action (only at
turning of the serum probe in
adjustment).
6
13
S.STOP/
In rotation of the serum
STOP
probe, it is not set at the
(Note 2)
upper dead point.
6
14
STOP
In rotation of the serum
probe from the reset
position, it does not come off
the reset position.
6
15
STOP
In rotation of the serum
probe to the reset position, it
cannot detect the reset
position.
101 to
SAMPLE
8
1
S.STOP/
The sample disk cannot
106
DISK
STOP
detect the stop position on
(Note 2)
outer track.
8
2
S.STOP/
The sample disk does not
STOP
stop at the specified position
(Note 2)
on outer track.
8
3
S.STOP/
The sample disk cannot
STOP
detect the stop position on
(Note 2)
inner track.
8
4
S.STOP/
The sample disk does not
STOP
stop at the specified position
(Note 2)
on inner track.
NOTE: 2. S.STOP may be issued only during operation.
2-5
Remedy
Check the upper dead
point detector.
Refer to alarm code
6-3.
Check the home
detector.
Same as above
Refer to alarm code
6-3.
Same as above
Check the upper dead
point detector.
Check the home
detector.
Same as above
Check the outer track
detector.
Same as above
Check the inner track
detector.
Same as above
(cont’d)
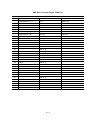
Alarm
Alarm
Control
No.
101 to
SAMPLE
106
DISK
Category
Subcode
8
5
8
107
SAMPLE
DISK
8
251 to
310
SAMPLE
SHORT
11
551 to
552
SAMPLE
SYRINGE
15
15
561 to
568
REAGENT
PROBE
16
16
16
16
Level
STOP
Description
At resetting, the sample disk
cannot detect the home
position.
6
STOP
At resetting, the sample disk
does not stop at the specified
point of home position.
7
STOP
At resetting, the sample disk
does not leave the home
position.
1 to 60 WARNING In sipping from the sample
cup, sample on the sample
disk is inadequate.
Sub-code groups
Routine/
stat samples : 1 to 35
Control STD : 36 to 57
W1 to W3
: 58 to 60
1
S.STOP/
The serum syringe does not
STOP
reach the upper dead point.
2
S.STOP/
The serum syringe does not
STOP
go down from the upper dead
point.
1
STOP
The reagent probe does not
reach the upper dead point in
ascending motion.
2
STOP
The reagent probe moves
down abnormally in
descending motion.
3
STOP
The reagent probe does not
go down from the upper dead
point in descending motion.
4
WARNING Detection of abnormal
descending motion of the
reagent probe remains on.
2-6
Remedy
Check the home
detector.
Same as above
Check the home
detector.
Add sample.
Check the upper
dead point detector.
Same as above
Check the upper
dead point detector.
Check liquid level
detection.
Check the upper
dead point detector.
Check the
descending error
detector.
(cont’d)
Alarm
Alarm
Control
No.
561 to
REAGENT
568
PROBE
581 to
593
621 to
622
REAGENT
DISK
REAGENT
SYRINGE
Category
Subcode
16
5
STOP
16
6
STOP
16
7
STOP
16
8
STOP
18
1
STOP
18
2
STOP
18
3
22
1
22
2
Level
Description
When the reagent probe
turns toward the cell, it
cannot detect the cell
position.
When the reagent probe
turns from the cell side to
other position, it does not
leave the cell position.
Before the probe goes down,
the liquid level detector is
already turned on.
In rotation of the reagent
probe, it is not set at the
upper dead point.
The stop position of reagent
disk cannot be detected.
The reagent disk does not
stop at the specified position.
STOP
The home position of reagent
disk cannot be detected.
STOP
The reagent syringe does not
reach the upper dead point.
STOP
The reagent syringe does not
move down from the upper
dead point.
STOP
The sipper nozzle does not
reach the upper dead point
(during resetting/
operation).
WARNING/ The sipper nozzle does not
STOP
leave the upper dead point.
641
ISE
SIPPER
24
1
642
ISE
SIPPER
24
2
661 to
662
ISE
SYRNG
26
1
WARNING/
STOP
(Note 4)
The sipper syringe does not
reach the upper dead point.
26
2
WARNING/
STOP
(Note 4)
The sipper syringe does not
leave the upper dead point.
27
1
WARNING/
STOP
The ISE function is stopped
due to alarm.
(This warning is indicated
when restart in the sampling
stop status was attempted.)
Remedy
Check the home
detector.
Same as above
Check liquid level
detection.
Check the upper
dead point detector.
Check home
detection or count
detector.
Same as above
Check home
detection.
Check the upper
dead point detector.
Same as above
Check the upper
dead point detector of
ISE sipper.
Same as above
(Note 4)
671
ISE STOP
OK ?
(Note 4)
NOTES:
3.
4.
Check the upper
dead point detector of
ISE Syringe.
Check alarm log and
deal with the alarm.
S.STOP may be issued only during operation.
Though the photometry assay function works, the ISE function does not work.
2-7
(cont’d)
Alarm
Alarm
Control
No.
681
TEMP
CONTROL
Category
Subcode
28
1
28
2
INCUBATOR
WATER
REF
WATER
29
1
30
1
711
DISTILLED
WATER
31
1
712
DIST
WATER
DIST
WATER
SENSOR
RESERVOIR
SIPPER
31
2
32
1
34
1
37
1
38
1
41
1
41
2
41
3
691
701
721
724
771
781
811 to
813
VACUUM
TANK
PHOTOMETER LAMP
Level
Description
The water temperature of
incubation bath is higher
than 45.0°C.
WARNING The water temperature of
incubation bath is outside a
range of 37 ± 0.5°C.
(This is checked only at
operation.)
WARNING The water level of
incubation bath is too low.
WARNING
WARNING A period of 24 hours has
passed since exchange of
incubation bath water.
STOP
The water level of distilled
water tank is too low.
(This alarm will not be
issued during initialization
and water exchange.)
WARNING The water level of distilled
water tank is too low.
WARNING The water level sensor in
distilled water tank is
abnormal.
WARNING The waste solution reservoir
is full.
STOP
The negative pressure of
vacuum pump is too low.
WARNING Water is accumulated in the
vacuum tank.
WARNING In passed cell blank
measurement, a value of
more than 3.3 Abs is
indicated in any one of 4
measurements.
(3 times or less)
S.STOP
In passed cell blank
(Restart
measurement, a value of
unmore than 3.3 Abs is
allowable) indicated for all of ADC1,
ADC2 and λ1 to λ12.
The above alarm code 41-1
S.STOP
is issued 10 times
(Restart
consecutively.
unallowable)
2-8
Remedy
Check the thermistor
or thermostat of
heater.
Same as above
Replenish water or
check the drain
solenoid valve.
Exchange incubation
bath water.
Check the water level
sensor.
Same as above
Check float switch.
Check waste solution
tank detection.
Check vacuum level
at vacuum suction.
Check SV12 or SV14.
(1) Replace light
source lamp.
(2) Check 12 V
power supply.
(cont’d)
Alarm
Alarm
Control
No.
1231
CELL
BLANK
Category
Subcode
Level
Description
Remedy
45
1
S.STOP
(Restart
unallowable)
In passed cell blank
measurement, any one of
ADC1, ADC2, λx and λy
differs from the reference
value (Note 5) by more than
0.1 Abs through 10
consecutive cycles.
(Counting is not made in
use for stopped cell blank
test.)
In 4 passed cell blank
measurements, any one of
ADC1, ADC2, λx and λy
differs from the reference
value (Note 5) by more than
0.1 Abs twice or more.
(In case any one of those
values differs only once, the
average value of normal
data is treated as a value of
passed cell blank.)
Any one of I/O error,
boundary error of parameter
block pointer, I/O device
busy, channel error and I/O
device error (PC board not
mounted, device
inoperable, time-out) has
occurred.
•A/D count value remains
at 0.
•After A/D conversion,
interruption is impossible.
•The command or
parameter given to A/D
PC board is abnormal.
•A/D conversion cannot be
completed.
(Time-out occurs.)
(Reference voltage is
checked.)
The number of A/D starts
cannot be reset to 0.
(This is checked at reaction
measurement.)
(1) Carry out cell
washing.
(2) Replace the cell.
1241 to
1400
PASS CELL
BLANK
46
1 to 48 WARNING
1441 to
1444
ADC1?
47
1
WARNING
47
2
WARNING
47
3
WARNING
2-9
Same as above
Replace ECPU230 or
EMIO100 PC board.
(1) Replace Log Amp
PC board.
(2) Check 2 V and
6 V reference
voltages.
Same as above
(cont’d)
Alarm
Alarm
Control
No.
1441 to ADC1?
1444
1451 to
1453
1461 to
1462
ADC2?
ADC3?
Category
Subcode
Level
47
4
WARNING
48
1
abnormal.
•A/D count for 6 V is
abnormal.
Normal count for 2 V
(7547 < count value <
8341)
Normal count for 6 V
(22460 < count value <
25023)
(This is checked at
measurement of
reference voltage.)
WARNING Refer to alarm code 47-1.
48
2
WARNING Refer to alarm code 47-2.
48
3
49
1
WARNING Refer to alarm code 47-4.
Reference voltage for
ISE: 2 V and 8 V
Normal count for 2 V
(7547 < count value <
8341)
Normal count for 8 V
(30184 < count value <
33364)
Normal offset value
(22811 < count value <
40547)
WARNING Refer to alarm code 47-2.
49
2
WARNING
Description
•A/D count for 2 V is
•A/D count for 2 V is
Remedy
Same as above
Replace ISE AMP PC
board.
Same as above
Same as above
Replace EMIO100
PC board.
Same as above
abnormal.
•A/D count for 6 V is
1471 to
4506
BARCODE1
50
abnormal.
Normal count for 2 V
(12452 < count value <
13763)
Normal count for 6 V
(37356 < count value <
41288)
1 to 35 WARNING Data reception from the
barcode reader has not
been completed before ID
reception time-out.
(Sub-code indicates the
position No. on disk.)
2 - 10
Replace the label or
barcode reader.
(cont’d)
Alarm
Alarm
Control
No.
1801 to BARCODE2
1805
Category
54
1931 to
1971
REAGENT
SHORT
57
2231 to
2271
REAGENT
LEVEL
59
2781 to
2830
2851,
2852
UNASSIGNED
TS OVER
2861
PATIENT
SAMPLE
OVER
Subcode
Level
Description
1 to 5 WARNING An error has occurred in
communication with the
barcode reader. (Parity
error, framing error or
overrun error)
Sub-code indication
1 : Unassigned
2 : Unassigned
3 : Sample disk barcode
reader
4 : Unassigned
5 : Unassigned
1 to 40 WARNING •The volume of reagent to
be sipped from a reagent
bottle is inadequate.
•The reagent volume is a
total amount of one kind
of reagent for each test
item.
(1) Sub-code indicates
position No.
(2) Positions 37 and 38
are used for ISE.
(3) Position 40 is used for
HITERGENT.
(4) Position 39 is used for
HIALKALI.
1 to 40 WARNING Reagent volume is smaller
than the remaining reagent
check value specified with
system parameter.
67
1
68
1
WARNING Because 400 samples are
registered in routine sample
test selecting information,
new test selecting
information cannot be
registered from the host.
WARNING Because 400 samples are
registered in routine sample
test selecting information, a
new routine sample cannot
be analyzed.
2 - 11
Remedy
Check the
communication cable
of barcode reader.
Set new reagent.
Set reagent newly.
After completion of
analysis, register TS
again.
Same as above
(cont’d)
Alarm
Alarm
Control
No.
2891 to DC POWER
2894
2911
FUSE
2921
POWER
FAIL
MOTOR
CONTROLLER
MOTOR
TIMEOUT
2941 to
2973
2991 to
3023
Category
Subcode
71
1
STOP
71
2
STOP
71
3
71
71
72
4
11
1
73
1
75
76
Level
Description
15 V DC power supply is
abnormal.
-15 V DC power supply is
abnormal.
WARNING 12 V lamp power supply is
abnormal.
STOP
5 V power supply is abnormal.
E.STOP
24 V DC
E.STOP
AC fuse has blown.
WARNING Power supply to the
instrument is interrupted
1 to 18 STOP
Data cannot be written into
the motor controller.
1 to 18 E.STOP
Replace the ±15 V
power supply
module.
Same as above
Replace the 12 V
power supply.
5 V for other than
CPU board
Replace the F3
fuse.
Check power
supply.
Replace ECPU230.
Motor operation was
(1) Replace
abnormal. Error has been
ECPU230.
detected in the time-out check (2) Check the
of motor controller.
mechanism
which caused
alarm.
Sub-code
Motor
1
Reaction disk
2
3
4
5
6
7
8
9
10
11
12
13
14
15
16
17
18
2 - 12
Remedy
Sample disk
Reagent disk
Rinsing mechanism
up/down
Sample arm
up/down
Sample arm
rotation
Reagent arm
up/down
Reagent arm
rotation
Stirrer up/down
Stirrer rotation
ISE sipper up/down
(Unassigned)
Serum syringe
Reagent syringe
ISE syringe
(Unassigned)
GMCNT
(Unassigned)
(cont’d)
Alarm
Control
No.
Alarm
Category
3101 to
3189
STANDARD?
83
3251 to
3291
CALIBRATION
84
3401 to
3438
CALIB.SD?
85
Subcode
Level
Description
1 to 40 WARNING <<Photometry assay>>
(ch.)
(1) In calibration, the
STD absorbance data
is indicated with
alarm.
(2) In calibration, data
calculation is
disabled.
<<ISE assay>>
(1) In calibration, the
potential data of
standard or internal
standard solution is
indicated with ADC
error, insufficient
sample alarm, noise
alarm or level alarm.
(2) In calibration, data
calculation is
disabled.
(The result of calibration
is not updated nor saved
onto FD.)
1 to 40 WARNING <<Photometry assay>>
(ch.)
The factor value 'K'
determined in calibration
differs from the previous
value by more than ±20%.
<<ISE assay>>
The calibrator
concentration value and
slope value determined in
calibration differ from the
previous values by more
than the compensation
limit (%).
1 to 36 WARNING The mean error determined
(ch.)
in multi-point calibration is
larger than the SD limit
(input value).
2 - 13
Remedy
(Photometry assay)
•Replace STD
sample.
•Check the
concentration
parameter.
(ISE assay)
Same as above
(Photometry assay)
(ISE assay)
Same as above
Replace STD and
check again.
(cont’d)
Alarm
Control
No.
3551 to
3588
Alarm
Category
SENSITIVITY?
86
Subcode
Level
Description
1 to 36 WARNING In linear (with 2 to 6 points) or
(ch.)
nonlinear calibration, a
difference between the mean
STD (1) absorbance and the
mean STD (N) (Note 7 )
absorbance is smaller than
the sensitivity limit (input
value).
Remedy
The result of
calibration is not
updated nor saved
onto FD.
NOTES :
7. N: = 2 for linear
(2points)
= 2 to 6 for nonlinear
and linear (3 to 6
points)
(Span point input value)
8. If either STD (1) or STD
(N) alone has been
measured, the
absorbance value of the
other STD is checked
using the previous data.
4151 to
4153
ISE LEVEL
90
1
WARNING The mean potential value
(EAV) at three out of five
measurement points of
internal standard solution is
outside the following range.
(Internal standard)
Na : -90.0mV ≤ EAV ≤-10mV
(1) Replace STD
and carry out
calibration.
(2) Replace the Na
electrode.
⇒ OK
90
2
WARNING K : -90.0mV ≤ EAV ≤ -10mV
⇒ OK
90
3
WARNING Cl : 100.0mV ≤ EAV ≤
180.0mV
⇒ OK
4161 to
4163
ISE NOISE
91
1
WARNING A difference (FIV) between
maximum and minimum
potential values at three of
five measurement points of
internal standard solution is
outside the following range.
(Internal standard, sample)
(1) Same as above
(2) Replace the K
electrode.
(1) Same as above
(2) Replace the Cl
electrode.
Carry out reagent
priming and check
for bubble
formation.
Na : 0.7mV < FIV(2) - FIV(4)
91
2
WARNING K
: 1.0mV < FIV(2) - FIV(4)
Same as above
91
3
WARNING Cl : 0.8mV < FIV(2) - FIV(4)
Same as above
2 - 14
(cont’d)
Alarm
Control
No.
4171 to
4173
4181 to
4183
4191 to
4193
Alarm
ISE PREP.
ISE SLOPE
ISE I.STD
Category
Subcode
92
1
92
2
92
3
93
1
93
2
93
3
94
1
94
2
94
3
Level
Description
Remedy
WARNING Upon calibration, the slope
•Make sure that the
value is within the following
standard solution
range.
and reagent are set
properly.
Na : 45.0mV ≤ Slope value
≤ 49.9mV or
•Make sure that the
standard solution is
68.1mV ≤ Slope value
free from
WARNING K : 45.0mV ≤ Slope value
concentration or
≤ 49.9mV or
deterioration.
68.1mV ≤ Slope value
•Make sure that the
WARNING Cl : -39.9mV ≤ Slope value
electrodes (Na, K,
≤ -35.0mV or
Cl) are within their
-68.1mV ≥ Slope value guaranteed life.
WARNING (1) In the result of
calibration, the slope
value is within the
following range.
(2) The response
characteristic of
electrode is poor (in case
carry-over rate (A) is as
indicated below).
Na : (1)SLOPE < 45.0mV
(2)0.232 < A
WARNING K : (1)SLOPE < 45.0mV
(2)0.160 < A
WARNING Cl : (1)SLOPE < -35.0mV
(2)0.490 < A
WARNING The concentration of internal
standard solution (C(IS)) is
within the following range.
Na : C(IS) < 120.0mEq/L or
160.0mEq/L < C(IS)
WARNING K
: C(IS) < 3.0mEq/L or
7.0mEq/L < C(IS)
WARNING Cl : C(IS) < 80.0mEq/L or
120.0mEq/L < C(IS)
2 - 15
Refer to alarm
codes 92-1 to 3.
Same as above
Same as above
(1) Replace STD
and carry out
calibration
again.
(2) Replace the
internal
standard
solution.
Same as above
Same as above
(cont’d)
Alarm
Control
No.
4201 to
4203
Alarm
ISE
REAGENT
SHORT
Category
Subcode
95
1
95
2
95
4211
TWLN
TEST?
96
Level
Description
Unassigned
(Liquid level detection for
IS/DIL solution)
Unassigned (Same as
above)
3
WARNING The volume of reference
electrode solution is 30 mL
or less.
1 to 36 WARNING (1) when analyzing two
(ch.)
tests at a time, the
assigned method for
the corresponding test
is inadequate.
(2) Assignment of the
corresponding test is
being done or not
being done when
analysis for two tests is
not being made at the
same time.
(3) When analyzing two
tests at the same time,
the analytical
parameters are not
identical.
Sub-codes (1 to 36)
signify the channel
numbers.
2 - 16
Remedy
Replace the
reference electrode
solution with new
one.
Check the ISE
reagent volume.
•Start setting in
order from the
tests that are
designated by the
Measured Point of
the first half of the
1 channel 2 Test
Analysis Method (3
Point, 1 Point and
Rate, Rate B)
•When not
analyzing two tests
at the same time,
do not designate
'Two Test Analysis'
for the Analysis
Parameter.
•With the Analysis
Parameter screen
for the applicable
test, unify all the
parameters below
for the
Simultaneous 2
Test Analysis Test.
• Analytical Method
• Reaction Time
• Sample Volume
• Reagent
Pipetting volume
(R1-R3)
• Calibration
Method
• Calibration Point
• Standard solution
volume
• Standard solution
position
(cont’d)
Alarm
Control
No.
Subcode
Alarm
Category
Level
4511 to
4548
CHEMISTRY
PARAMETER?
98
1 to 36 WARNING (1) The relationship
(ch.)
between assay code and
photometric point is
improper.
(2) The assigned
photometric point lags
behind the specified
reaction time.
(Operation is
impossible.)
4661 to
4698
CALIBRATION
PARAMETER CALIB.
99
1 to 36 WARNING (1) The relationship
Check parameter
(ch.)
between assay code and and input it again.
calibration type is
improper.
(2) Necessary calibration
points for calibration
type are not input.
(3) Necessary standard
positions for calibration
are not input.
(4) The relationship
between calibration type
and calibration method
is improper.
(5) The standard
concentration values are
not set in ascending
order. (Except for STD
(3) and (4) for isozyme)
(6) Concentration value is
not zero when '99' is
entered for POS. of STD
(1).
1. The photometry assay
data in other than
manual mode is
checked.
2. Operation is
unallowable.
3. Check in (4) is made
with regard to
specifications of timeout calibration, lot-to-lot
calibration, bottle-tobottle calibration and
test selecting
information.
2 - 17
Description
Remedy
Correct the
parameter.
(cont’d)
Alarm
Control
No.
Alarm
Category
Subcode
Level
Description
Remedy
4811 to
4848
VOLUME
CHECK?
100
1 to 36 WARNING (1) The total reagent
(ch.)
volume up to the last
photometric point is
more than 250 to
500 µL.
(2) The volumes of
reagents 1 to 3 are all
zero.
(3) The reagent volume
having a timing behind
the reaction time is not
zero.
(4) The total liquid volume
of sample and reagent is
less than 250 µL.
1. When '999' (stirring
only) is specified for
reagent volume, 0 µL is
taken for the volume.
However, when '999' is
specified for the reagent
volume having a timing
behind the reaction time,
an error occurs.
2. Operation is
unallowable.
3. The final liquid volume
is a total volume of
sample and reagent
within 250 to 500 µL.
Check parameter.
If the improper
condition indicated
by alarm can be
detected, correction
and reentry are
required.
5261
CMP. TEST
103
1 to 8
Call up calculation
item screen and
check the
compensation
formula on it.
WARNING The setting of formula
number corresponding to
the relevant code is
improper.
(1) An unmeasurable test is
specified for
compensation.
(2) A compensated test is
not included in the
formula.
(3) In photometry assay for
compensated test, the
electrolyte parameter is
specified.
2 - 18
(cont’d)
Alarm
Control
No.
Alarm
Category
5271 to
5356
SERUM
INDEXES?
104
5431
ON BOARD?
106
5441
REAG.POS?
107
5481
CLB(IS)
POS.
108
5511 to
5516
ACI ERROR
114
Subcode
Level
Description
1 to 36 WARNING (1) Although the sub-code
(ch.)
corresponds to the
serum index
measurement test, the
rate-A assay is not
assigned.
(2) Although the sub-code
corresponds to the
serum index
measurement test and
sample blank is to be
corrected, reagent 2
discharge is specified.
(Analysis does not start.)
1
WARNING There is no measurable
channel.
There is no channel for
which necessary reagent
has been prepared.
(Analysis does not start.)
1 to 38 WARNING (1) The reagent position
specified for a
photometry assay is
also specified for other
photometry assay.
(2) The same reagent
position is specified for
both carry-over cleaning
agent and photometry
assay or ISE test.
(Analysis does not
start.)
1
WARNING When ISE is provided,
calibrator or control
positions are set at 55 to 57.
(Analysis does not start.)
1 to 6 WARNING Barcode IC malfunctions.
1: Unassigned
2: Unassigned
3: Sample
4: Unassigned
5: Unassigned
6: Transfer
2 - 19
Remedy
Check parameter
for serum indexes.
Check each
parameter.
Check each
reagent.
Check the position
for control
calibration.
Replace RSDIST
PC board.
(cont’d)
Alarm
Control
No.
5561 to
5568
5571 to
5578
Alarm
FD-WRITE?
FD READ?
Category
Subcode
119
1
119
2
119
3
119
4
119
5
119
6
119
7
119
8
120
1
120
2
120
3
120
4
Level
Description
WARNING A hardware error has
occurred in writing the
routine sample
measurement data.
WARNING A hardware error has
occurred in writing the stat
sample measurement data.
WARNING A hardware error has
occurred in writing the
control sample
measurement data.
WARNING A hardware error has
occurred in writing the
individual or cumulative
alarm information.
WARNING A hardware error has
occurred in writing the
parameter data.
WARNING A hardware error has
occurred in execution of FD
formatting, copying into FD
or FDD cleaning.
WARNING A hardware error has
occurred in writing the cell
blank data.
WARNING A hardware error has
occurred in writing the
routine sample test
selecting information.
WARNING A hardware error has
occurred in reading the
routine sample
measurement data.
WARNING A hardware error has
occurred in reading the stat
sample measurement data.
WARNING A hardware error has
occurred in reading the
control sample
measurement data.
WARNING A hardware error has
occurred in reading the
individual or cumulative
alarm information.
2 - 20
Remedy
(1) Clean the FD.
(2) Replace the FD
with a new one.
(3) Replace the FD
drive.
Refer to alarm
category No. 119.
(cont’d)
Alarm
Control
No.
5571 to
5578
Alarm
FD READ?
Category
Subcode
120
5
120
6
120
7
120
8
5581
FD NOT
INSERTED
121
1,2
5601
FD
PROTECT
PRINTER
123
1,2
125
1
125
2
125
4
125
5
5621 to
5625
Level
Description
WARNING A hardware error has
occurred in reading the
parameter data.
WARNING A hardware error has
occurred in reading the
channel assignment.
WARNING A hardware error has
occurred in reading the cell
blank data.
WARNING A hardware error has
occurred in reading the
control parameter.
WARNING System disk is not set in
drive 1 or data disk is not
set in drive 2.
WARNING A write-protected disk is
inserted.
WARNING Power supply is turned off
or the connector is
disconnected.
WARNING Paper has run out or the
printer head has risen.
WARNING A hardware error has
occurred on the printer.
WARNING A time-out error of the
printer has occurred.
2 - 21
Remedy
Refer to alarm
category No. 119.
Insert the relevant
disk.
Unprotect the disk.
Check the power
supply or connector.
Set paper or lower
the printer head.
Check the printer
cable.
(1) Check the
printer cable.
(2) Replace the
printer.
(cont’d)
Alarm
Control
No.
5631 to
5643
Alarm
Category
Subcode
SYSTEM I/F
126
1
WARNING A reception time-out error
has occurred.
126
2
126
3
126
4
WARNING A transmission time-out
error has occurred.
WARNING A BCC error or checksum
error has occurred.
WARNING A parity error has occurred.
126
5
126
6
126
7
WARNING A framing error has
occurred.
WARNING An overrun error has
occurred.
WARNING Frame error
126
8
WARNING Text length error
126
9
WARNING Function character error
126
10
WARNING Sample information error
126
11
126
12
WARNING Test selecting information
error
WARNING Comment information error
126
13
5681
BATH
EXCHANGE
FAILURE
130
5696
PANEL I/F
140
5701
REAGENT?
141
Level
Description
WARNING Reception cannot continue
up to the end code because
an illegal character is
received from the host.
Example) A null code is
received from
the host.
1
WARNING The start key has been
pressed despite failure in
incubation bath water
exchange.
1
WARNING An error has occurred in
LCD display module
communication.
('Communication error'
appears on the LCD
display.)
1 to 36 WARNING Either reagent positions R1
to R3 or reagent volume
alone is "0" (no
specification).
2 - 22
Remedy
(1) Check the cable
of system I/F.
(2) Check the
contents of
communication
trace.
(3) Check the
contents of
communication
by line analyzer.
(4) Check if a
change has
occurred in
system
parameters.
Do incubation bath
water exchange
again.
(1) Check the
communication
cable of LCD.
(2) Replace the
LCD.
Check and correct
the contents of
parameters R1 to
R3.
(cont’d)
Alarm
Control
No.
Alarm
Category
5771
CELL C. O.
145
5821
ISE C. O.
146
Subcode
Level
Description
1 to 10 WARNING (1) More than 2 types of
carry over evasion (cell)
are specified for 1 test.
(2) Sub-codes (1 to 10)
signify the evasion
types.
1 to 40 WARNING R1 type is not specified for
ISE test of Reagent Probe
Carry Over Evasion.
2 - 23
Remedy
Check and correct
the carry over
evasion (cell).
Check and correct
the Reagent Probe
carry over evasion.
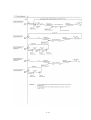
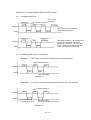
2.1.1 LCD Display Alarm
Output of Boot Error
Boot error is output to the console and the buzzer for small-size automatic analyzer (beeper is
used). Output is issued unconditionally to the console whenever connected. For the small-size
automatic analyzer, on the other hand, either of the destinations shown below is selected
depending on system. For selection method, refer to (3).
(1) Output to Console
Output to the console always uses a log message. This is because output cannot be
issued in the EAT format within a period from system start to EAT task start. Upon output,
a message is sent out line by line by scroll-up method as in the logging message of
VxWorks. Note that a line is fed before and after a message.
Output format is shown below. For contents of output, refer to (4).
(2) Buzzer Output for Small-Size Automatic Analyzer
The kinds of output are the same as the three kinds in the small-size immunological
system. Each output has a distinctive tone at the frequency indicated below.
1) Self Test Error
2) Loading Error
3) OS Initial Error
Sounding
:
:
:
:
50 Hz
250 Hz
1 Hz
Continuous
(3) Distinction in Error Message Output
For distinction in error output of small-size automatic analyzer, the configuration register of
a flash memory is used.
According to the readout value of this register, output destination is distinguished as shown
below. The value is set by hardware. (No setting is required in software.)
Table 2-1 Flash-Memory Configuration Register
(0xf2000b)
Value
0x01
Bus error
Meaning
Output to small-size automatic analyzer
Other
2 - 24
(4) Contents of Output
Output for the small-size automatic analyzer comes in 3 kinds described above. So, the
kinds of console output are listed below.
Table 2-2 Kinds of Console Message Output
Error
Self-test error
1.
Boot error
1.
2.
3.
OS initial error
1.
Output Message
Self Test Error (0xXX)
XX: Self-test error code
Rom Uncompress Error
F/D Boot Error (0xXXXXXXXX)
FROM Boot Error (0xXXXXXXXX)
XXXXXXXX: Boot error code (Refer to Section 5.)
OS Initial Error (Vect = 0xXX,PC=0xXXXXXXXX)
Vect = 0xXX: Vector No.
PC = 0xXXXXXXXX: Program counter
Note that EAT output is issued when possible.
2 - 25
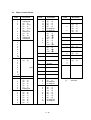
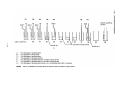
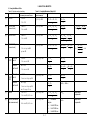
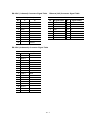
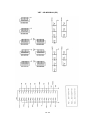
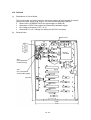
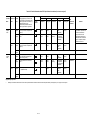
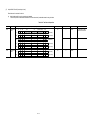
2.2
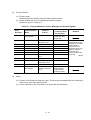
Motor Control Alarms
Alarm
Code
1 - 1
2
3
4
5
2 -
3 -
4
5 -
6 -
6
7
8
9
10
1
2
3
4
5
6
7
8
9
10
1
2
3
4
5
6
7
8
9
10
1
2
3
4
5
6
1
2
3
4
5
6
7
8
Check
Procedure
(3) - 4)
Unassigned
(4) - 5)
(2) - 2)ž3)
(3) - 4)
(2) - 2)ž3)
(3) - 4)
Unassigned
(4) - 5)
(8) - 9)
Unassigned
Unassigned
Unused
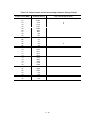
Alarm
Code
6 - 9
10
11
12
13
14
15
7 - 1
8
Check
Procedure
(4) - 5)
(5) - 6)
(7) - 8)
(6) - 7)
(8) - 9)
Unassigned
Unassigned
(2) - 3)
(3) - 4)
(9) - A
(10) - A
(2) - 3)
(3) - 4)
(2) - 3)
(10) - C
(1) - 1)
(2) - 2)
(9) - B
(10) - B
Unused
9
Unused
10
Unused
11
Unused
12
Unused
13
Unused
14
Unused
15 - 1
2
3
4
16 - 1
2
3
4
5
6
7
8
9
10
(1) - 1)
(4) - 5)
Unassigned
Unassigned
(3) - 4)
(6) - 7)
(4) - 5)
(70 - 8)
(3) - 4)
(4) - 5)
(7) - 8)
(8) - 9)
Unassigned
Unassigned
2
3
4
7 -
(3)
(4)
- 4)
- 5)
(OP)
Unused
(2) - 3)
(3) - 4)
(2) - 2)
(3) - 4)
(2) - 2)
(1) - 1)
Unassigned
(3) - 4)
(3) - 4)
(5) - 6)
(6) - 7)
(4) - 5)
(4) - 5)
(7) - 8)
(3) - 4)
5
2 - 26
Alarm
Code
17
Check
Procedure
Unused
18 -
19
(2) - 3)
(3) - 4)
(1) - 1)
(2) - 2)
(2) - 3)
(3) - 4)
Unused
20
Unused
21
Unused
22 - 1
2
23
(1) - 1)
(4) - 5)
Unused
24 - 1
2
25
(1) - 1)
(4) - 5)
Unused
26 - 1
2
3
4
(1)
(4)
1
2
3
(*)
:
- 1)
- 5)
OPTION
2.2.1
1. For items other than 7 and 8 ,
check whether the motor remains
running even after timeout.
NOTE:
If so, it should be identified as a
motor time out error.
2. Operation check method for 2-pitch
returning of sample disk.
3. Item 10 ; Operation check method
for 2-pitch feed of sample disk.
4. Item 9 ; Check at resetting.
2 - 27
Notes:
1. In check procedure other than 7 and 8 ,
motor running status is checked after time-out.
When running, a motor time-out error occurs.
2. Operation check procedure at 2-pitch return of
the sample disk.
3.
10 is the operation check procedure at 2-pitch
feed of the sample disk.
4.
.
2 - 28
9 is the check at resetting.
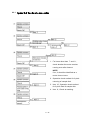
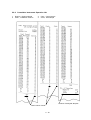
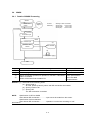
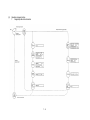
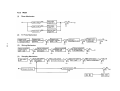
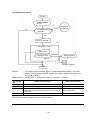
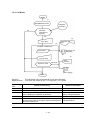
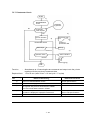
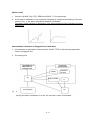
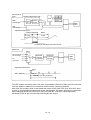
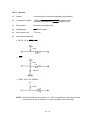
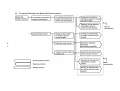
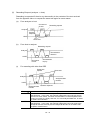
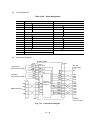
2.3
Parameter Check
Parameter check is carried out on the channel for which test is selected on the CHANNEL
ASSIGNMENT screen at start of analysis.
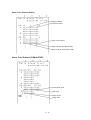
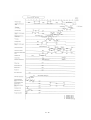
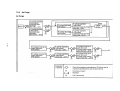
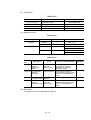
2.3.1 Processing Flow
(1)
At input of START key in STANDBY status.
Twin test
simultaneous analysis
parameter check
NG
STOP
Check result?
OK
Analytical method
check
1)
Calibration parameter
check
Serum index analytical
method check
Volume check
Reagent relationship check
at carry-over cleaning
Upper/lower limit value
check
CH, ACTIVATE check
Test-to-test
compensation check
Check result?
OK
Analytical mode check
1)
2 - 29
NG
START
STOP
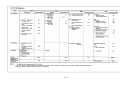
2.3.2 Details of Parameter Check
No.
1
2
Designation
of Check
Check of
parameters
for twin test
simultaneous
analysis
Assay code
check
Details of Check
Alarm
Display
The following are checked
for measurable (level 1,
Note 1) photometry tests.
(1) In case of twin test
simultaneous analysis,
the opposite test must
be specified properly.
• Two tests must form
a unique pair, and
one of them alone
must designate the
other.
(2) In case of other than
twin test simultaneous
analysis, tests must not
be paired.
(3) In case of twin test
simultaneous analysis,
two tests must be
identical in all of the
following parameters.
• Data mode
• STD POS.
• STD S. VOL
• Assay code
• Reaction time
• Sample volume
• Reagent volume
• Calibration type
• Calibration point
• Span point
TWIN TEST?
The following are checked
for measurable (level 1)
photometry tests.
(1) Relationship between
assay code and
photometric point
(check of photometric
point input and input
range)
Refer to the analytical
method table in 1.1.1.
CHEM
PARAM?
Subdivision
1 to 37
(CH No.)
Remarks
Details of this check
are given in "Details
of twin test
simultaneous
analysis" in 2.3.3.
In case of twin test
simultaneous
analysis, an alarm
is issued if one of
two tests is not
registered or the
manual mode is
selected.
NOTE:
1. The term
'measurable'
indicates either
of the following
two levels.
Level 1:
Test registered
and manual
mode not
selected
Level 2:
Same as above
and reagent
provided
2 - 30
1 to 37
(CH No.)
(cont’d)
No.
Designation
of Check
2
Assay code
check
3
Calibration
parameter
check
Details of Check
Alarm
Display
(2) Photometric points after CHEM
the specified reaction
PARAM?
time must not be set.
Refer to Note 6 in
"analytical method
table" of 1.1.1.
The following are checked
CLB. PARAM?
for measurable (level 1)
photometry tests.
(1) Relationship between
assay code and
calibration type
Refer to "relationship
between calibration type
and analytical method"
in 2.1.
(2) Entry must be made for
CALIB. POINTS
necessary for calibration
type.
Refer to "output by each
calibration method and
check table" in 2.7.
(3) Entry must be made for
STD POS. necessary
for calibration.
For STD specified by
measured STD No. in
"output by each
calibration method and
check table" of 2.7, it is
checked whether STD
POS. is input or not.
2 - 31
Subdivision
Remarks
1 to 37
(CH No.)
1 to 37
(CH No.)
NOTES:
1. Checked
against the
specification of
calibration test
selecting
information.
(cont’d)
No.
3
4
Designation
of Check
Calibration
parameter
check
Volume
check
Details of Check
Alarm
Display
Subdivision
(4) The input value for
CLB. PARAM?
SPAN POINT must be
normal.
• When calibration
type is LINEAR (2 to
6-point) or LOGITLOG (3P or 4P)
1) The above input
value must not
equal 0.
2) The above input
value must not
exceed that for
CALIB. POINTS.
(5) Relationship between
calibration type and
calibration method
Refer to "output by each
calibration method and
check table" in 2.7.
(Note 2)
(6) STD CONC. must be
set in ascending order.
Check is made only for
necessary STD POS.
Note that isozyme STD
(3) and (4) are
excluded.
"=" is not regarded as in
ascending order.
(7) When '99' is entered for
POS. of STD (1),
CONC. must be 0.
The following are checked
VOLUME ?
for measurable photometry
tests.
(1) The total liquid volume
up to the final
photometric point must
be 500 µL or less.
(2) At least one of R1 to R3
volumes must not be 0.
(3) The reagent volume
having a timing behind
the reaction time is not 0.
(4) The minimum liquid
volume must be at least
250 µL.
2 - 32
Remarks
1 to 37
(CH No.)
NOTES:
2. Checked
against the
specification of
calibration test
selecting
information.
1 to 37
(CH No.)
When reagent
volume = 0, the
relevant reagent is
not used.
(cont’d)
No.
Designation
of Check
5
Test-to-test
compensation check
6
Serum index
analytical
method
check
7
Cell carry
over
8
ISE carry
over
Details of Check
For formula No. where
compensated test is
measurable:
(1) The compensation test
must be measurable.
In addition, when the
compensation test is
already registered as a
compensated test in any
preceding formula No.,
the check result for the
formula No. must be
OK.
(2) The compensated test
must be on the right
side of the formula.
(3) When the compensated
test is a photometry
test, no ISE test must
be registered for the
compensation test.
(1) The assay code for tests
for serum index
measurement must be
RATE-A. This check is
made only when the
tests are measurable.
(2) In the RATE-A test with
serum indexes, no R2
must be specified when
sample blank correction
is carried out.
(1) More than 2 types of
carry over evasion (cell)
are specified for 1 test.
(2) Sub-codes (1 to 10)
signify the evasion
types.
R1 type is not specified for
ISE test of Reagent Probe
Carry Over Evasion.
Alarm
Display
Subdivision
Remarks
CMP. TEST?
44 to 51
(FORMULA
No.)
S. INDEXES?
1 to 37
(CH No.)
CELL. C. O.
1 to 10
Check and correct
the carry over
evasion (cell).
ISE C. O.
1 to 40
Check and correct
the Reagent Probe
carry over evasion.
2 - 33
This check is not
performed in case
of ORIGINAL ABS.
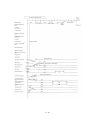
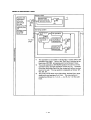
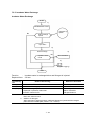
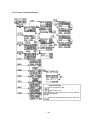
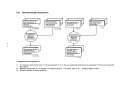
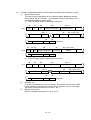
2.3.3 Details of Twin Test Simultaneous Analysis
∇
P.Q
CH = 1 to 37
Assay code
for twin test
simultaneous
analysis
Note 1
P: Designates
opposite test.
Q: Designated by
opposite test.
P.Q
P.Q
NG
Note 2
OK
NG
Note 2
OK
P.Q
Designated
by one test
alone
NG
Note 2
OK
Check result OK
Identical in
all parameters
with opposite
test
Note 3
NG
Note 2
OK
Not paired
NG Note 2
∆
NOTES:
1.
2.
3.
Unmeasurable channels are excluded.
However, in twin test simultaneous analysis, alarm occurs when either
one of the two tests is unmeasurable.
Alarm is registered with a channel No. assigned for subdivision.
Refer to "Details of Parameter Check" in 2.3.2.
2 - 34
2 - 35
2.4.2 Data Alarm Code List
Output String
PRINTER
No.
1
2
3
4
5
6
7
8
9
10
11
12
13
14
15
16
17
18
19
20
21
22
23
24
25
26
27
28
29
30
31
C S.
R I/F
T
Data Alarm
ADC?
ADC abnornal
CELL?
Cell blank abnormal
SAMPLE
Sample short
REAGN
Reagent short
ABS?
Absorbance over
Prozone error
∗∗∗∗∗P
Reaction limit over at all
LIMT0
points
Reaction limit over except 1 LIMT1
point
Reaction limit over except 2 LIMT2
or 3 points
Linearity abnormal at 9
LIM.
points or more
Linearity abnormal at 8
LIM.8
points or less
Standard 1 absorbance
S1ABS?
abnormal
Duplicate error
DUP
STD error
STD?
Sensitivity error
SENS
Calibration error
CALIB
SD error
SD?
Noise error
NOISE
Level error
LEVEL
Slope abnormal
SLOPE?
Internal standard
I.STD
concentration abnormal
Sample value abnormal
R.OVER
Test-to-test compensation
CMP.T
error
Test-to-test compensation
CMP.T!
disabled
Calculation test error
CALC?
Overflow
OVER
Calculation disabled
???
Expected value high limit
H
over
Expected value low limit over L
Electrode preparation
PREP.
SD absorbance over
>AMAX
A
Q
V
T
Z
P
I
A
Q
V
T
Z
P
I
J
J
K
K
W W
F
N
L
Photometry
Assay
R
o
u
t
i
n
e
S
t
a
t
C S R S C S
o T o t o T
n D u a n D
t
t t t
r
i
r
o
n
o
l
e
l
O
O
O
O
O
O
O
O
O
O
O
O
O
O
O
O
O
O
O
O
O
O
O
O O
O
O
O O
O
O
O O
O
O
O O
O
O
O
O
O
O
O
F
O
H
O
O
O
O
O
U
S
Y
B
G
N
L
E
D
&
C
&
C
M
M
%
0
X
%
0
X
ISE
Remarks
O O
O O
O O
O O •Data may become blank
space.
•Data may become blank
space.
•Prozone value is output to the
printer only when the monitor
is in the real time mode.
∗∗∗∗∗ indicates a prozone
value (5-digit).
O
O
O O
O O
O O
O O
O O
O
O O
O
O
O
O O
O O
O
O
O
O
O
O O
O
O
O
O
O
O
O
O
O
O
O
O O
O
O
O
O
O
O
O
•Data becomes blank space.
O O
O
O
O
O
O O
O
O
O
O
•Data becomes blank space
•Data becomes blank space.
•May concur with other alarm.
O
•May concur with other alarm.
>
R
>
O
O
O
O
•Data becomes blank space.
BM only
NOTES: 1. If any data caused multiple data alarms, the alarm registered first will be output.
2. When [Specify] is entered for measured value space parameter in the start condition screen.
2 - 36
2.4.3 Data Alarm Codes
No.
Data Alarm
ADC abnormal
Printer
ADC?
S. I/F
Description
A
The ADC value of main or
sub wavelength (only main
wavelength in single
wavelength photometry) is
zero.
Q
(Photometry assay only)
Two or more of the four
passed cell blank values to
be used for CELL BLANK
are abnormal.
Note: Abnormal when the
difference from the
reference value
(value measured
with cell blank
function on the
maintenance
screen) is ± 0.1 Abs
or more.
Cell blank
abnormal
CELL?
Sample short
SAMPL
V
Reagent short
REAGN
T
Before sample aspiration,
the presence/absence of
sample is checked and it is
found that the sample is
absent.
Before reagent aspiration,
the presence/absence of
reagent is checked and it is
found that the reagent is
absent.
2 - 37
Remedy
• Perform measurement
again.
• Turn off the power switch,
and then turn it on.
• Perform cell blank
measurement once a
week or after
replacement of the light
source lamp or reaction
cuvette.
• Confirm the adequate
volume of HITERGENT.
After taking a proper
measure, exchange
incubation bath water
once.
• Rinse or replace the
reaction cuvette and
perform cell blank
measurement.
• After washing the light
transmitting window in the
incubation bath, perform
cell blank measurement.
• Inject the sample in a
volume of expected
consumption + 50 µL or
more into a standard cup.
• Insert the lead wire.
• Prepare and set reagent
newly.
• Insert the lead wire.
(cont’d)
No.
Data Alarm
Absorbance over
Printer
ABS?
Prozone error
*****P
('*****'
indicates
a
prozone
value.)
S. I/F
Description
Z
(Photometry assay)
The absorbance value to be
used for calculation after cell
blank correction exceeds 3.3
Abs. The absorbance is
checked for every
wavelength.
P
(Photometry assay only)
In 1-point or 2-point assay
with prozone check, the
prozone error is indicated if
'prozone' is detected.
Prozone check is performed
by comparing the prozone
value (hereafter referred to
as PC value) obtained from
calculation mentioned below
with the prozone limit value
preset on the chemistry
parameter screen. For the
lower prozone limit, the
prozone error is indicated if
the PC value is smaller. For
the upper prozone limit, the
error is indicated if the PC
value is larger.
In the event of prozone error,
the relevant PC value is also
printed out (only in real-time
monitor printing mode).
2 - 38
Remedy
• In 1-point & rate, rate-A
or rate-B assay, check is
not carried out for the
interval to determine the
absorbance change rate
if an ascending reaction
setting is made for that
interval.
• Dilute the sample or
reduce its volume, and
then perform
measurement again.
• Set the sample correctly.
• Prepare the reagent
again.
• Prozone check values
are printed out only in
the real-time monitor
printing mode.
• Delution or retest with
decreased volume is
performed.
• For no-check, enter
‘-32000’ (lower limit) at
“Prozone limit value” on
the parameter setting
menu screen 1.
(cont’d)
No.
Data Alarm
Prozone error
Printer
*****P
('*****'
indicates
a
prozone
value)
S. I/F
Description
P
Shown below are the
expressions for calculation of
the PC value. Assuming that
the preset photometric points
are P1 and P2 and the
difference in absorbance
between two wavelengths at
photometric point P is E:
Remedy
(1) In 1-point assay
PC value =Ep2, p2-1-k
Ep2, p1-1
k: Liquid volume
correction factor
Note that k = 1 when
1 ≤ P1, P2 ≤ 5 or
6 ≤ P1, P2 ≤ 16 or
17 ≤ P1, P2 ≤ 33 or
34 ≤ P1, P2 ≤ 73.
Prozone check is not
carried out if P2 = 0.
(2) In 2-point assay
PC value =
Ep 2 − Ep 3
P2'− P3
Ep 4 − Ep 3
P4 − P3
Note that prozone check is
not carried out if P3 = 0 or
|Ep4 - Ep3| ≤ 100 × 10
-4
Abs.
When P2' = 0, P2 is used.
In either case of (1) and (2),
prozone check is not made
for STD (1) measurement.
2 - 39
(cont’d)
No.
Data Alarm
Reaction limit
over
Printer
S. I/F
LIMT 0
I
LIMT 1
J
LIMT 2
K
All points NG
Only one point
OK
Only two or three
points OK
Description
(Photometry assay only)
In 2-point rate, 1-point & rate,
rate-A or rate-B assay, the
main wavelength absorbance
at the photometric point to be
used for calculation exceeds
the reaction limit value (value
obtained after automatic
correction of input reaction
limit value). The error
condition varies depending
on the number of photometric
points within the reaction limit
range as shown below.
(1) The reaction limit is
exceeded at all points in
the input photometric
range.
(2) The reaction limit is
exceeded at the second
and subsequent points
excluding the first point.
(3) The reaction limit is
exceeded at the third and
subsequent points
excluding the first two
points, or at the fourth
and subsequent points
excluding the first three
points.
2 - 40
Remedy
• This alarm is issued
whenever the input
photometric range
values l and m for
calculation of the
absorbance change rate
do not satisfy l + 2 < m.
(Caution)
In 2-point rate assay, check
is made using not the input
photometric range values l
and m alone but all
photometric points between
l and m.
• Dilute the sample or
reduce its volume, and
then perform
measurement again.
• Prepare the reagent
again.
• Check for leakage or
clogging of the reagent
pipettor.
• Input correct values on
parameter registration
menu.
(cont’d)
No.
Data Alarm
Printer
S. I/F
Linearity
abnormal
LIN.
W
Number of
photometric
points in reaction
limit level range ≥
9
Description
Remedy
(Photometry assay only)
In 1-point & rate, rate-A or
rate-B assay, the absorbance
at each photometric point to
be used for calculation of the
absorbance change rate does
not satisfy the following
relational requirement.
• Make sure the sample
does not contain dust,
etc.
• Dilute the sample and
measure it again.
• If the stirring motor does
not rotate normally,
report to the
servicemen.
• The light source lamp
should not be used
beyond 750 hours.
• Replace the light source
lamp and perform cell
blank measurement.
∆ E 1 − ∆E b
∆E
LIN. 8
4 ≤ Number of
photometric
points in reaction
limit level range ≤
8
F
× 100
≤ Linearity limit value
Where, ∆E: Absorbance
change rate determined from
absorbance at each
photometric point in reaction
limit level range by least
squares method
∆E1: Absorbance change
rate in first half
∆Eb: Absorbance change
rate in second half
Assuming that the number of
photometric points in the
reaction limit level range is N,
∆E1, ∆Eb and linearity limit
LIMIT8 and LIN.LIMIT
value can be represented as
values are both fixed.
shown below.
(Unit: %,
value: LIN.LIMIT = 10,
(1) When N ≥ 9
LIMIT8 = 30)
Linearity limit
value LIMIT 8
∆E f
∆E b
2 - 41
(cont’d)
No.
Data Alarm
Printer
LIN.
8
4 ≤ Number of
photometric
points in reaction
limit level range ≤
8
S. I/F
Description
F
(2) When 4 ≤ N ≤ 8
Remedy
Linearity limit value LIN.
LIMIT
∆E f
∆E b
Note that linearity check is
not carried out in the
following cases.
• The number of
photometric points in the
reaction limit level range
is three or less.
• |∆E|≤ 60
(× 10e - 4ABS/min)
• |∆Ef - ∆Eb|≤ 60
(× 10e - 4ABS/min)
Standard 1
absorbance
abnormal
S1ABS?
H
Duplicate error
DUP
U
(Photometry assay) (Note 1) • Prepare the standard
properly.
In calibration, the mean value
of two measured absorbance • Set the standard
values of STD (1) is not
properly.
within the specified standard
• Unless check is desired,
1 absorbance range (input
input a value within
value).
- 32000 to 32000 for
Value is absorbance with
"standard 1 absorbance
End-point Assay, in the case
range" on the parameter
of late assay, is main wave O
registration menu 1
length first absorbance.
screen.
(Photometry assay)
• Replace the seal piece
of pipettor.
In calibration, this error is
indicated if the difference in
• Check fastening of
absorbance (or absorbance
joints.
change rate) between the first • Unless check is desired,
and second measurements of
input 32000 for
STD (i) is larger than the
"duplicate limit
DUPLICATE LIMIT (input
absorbance" on the
value).
parameter registration
(i = 1 to N: N indicates the
menu 1 screen.
number of standards.)
2 - 42
(cont’d)
No.
Data Alarm
STD error
Printer
STD?
S. I/F
S
Description
Remedy
(Photometry assay)
• The parameters on the
screen and FD are not
(1) In calibration, any one of
updated.
the following alarms is
encountered with the
measured STD
absorbances:
ADC abnormal, cell blank
abnormal, sample short,
reagent short,
absorbance over, reaction
limit over, linearity
abnormal, prozone error,
duplicate error,
calculation disabled and
standard 1 absorbance
abnormal.
(2) In calibration, calculation
is disabled before
completion.
(3) In non-linear calibration
(EXPONENTIAL and
Logit-Log5P), an extreme
value is found.
(4) After execution of nonlinear calibration
(SPLINE), the result of
extreme value/inflection
point check is NG.
(ISE)
Calibration is invalid.
(Any one of the following
alarms is encountered: ADC
abnormal, sample short,
calculation disabled, noise
error and level error.)
2 - 43
(cont’d)
No.
Data Alarm
Sensitivity error
Printer
SENS
S. I/F
Description
Y
(Photometry assay)
Sensitivity check is carried out
only for linear (2 to 6-point),
non-linear or isozyme P
calibration.
This error is indicated if the
difference in mean absorbance
between STD (1) and STD (N)
is smaller than SENSITIVITY
LIMIT (input value).
Remedy
• The parameters on the
screen and FD are not
updated.
• Set the standard
solutions and reagent
properly.
• Prepare the standard
solutions newly.
• Check the sample
syringe for leakage,
clogging, etc.
N: Linear (2-point)/
• Unless check is
isozyme P calibration ..... 2
desired, input 0 for
Non-linear/linear (3 to 6"sensitivity limit
point) calibration ..... 2 to 6
absorbance" on the
(input value for SPAN
parameter registration
POINT)
menu.
Note, however, that N = 2
when CALIB. POINTS = 2 in
non-linear LOGIT-LOG
(3P)/(4P) calibration.
For the mean absorbance of
STD (1) in span calibration, the
following data is used.
Linear ..... Previous S1 ABS
Non-linear ..... Previously
updated mean
absorbance
SD error
SD?
G
Sensitivity check is not made
in R.B. calibration.
(Photometry assay)
• Set in correct
concentration series.
This error is indicated upon
completion of non-linear
• Replace the seal piece
calibration or if the SD value in
of pipettor.
linear (multi-point) calibration is • Check fastening of
larger than SD LIMIT (input
joints.
value).
• Unless check is
desired, input 999.9
for "SD limit
absorbance" on the
parameter registration
menu.
2 - 44
(cont’d)
No.
Data Alarm
Calibration error
Printer
S. I/F
CALIB
B
Description
(Photometry assay)
In linear (2 to 6-point) or
isozyme P calibration, the
calibration condition is checked
at calculation of parameter K.
This error is indicated if there is
a difference of ±20% or more
between the current and
previous K values.
(ISE)
The calibration concentration or
slope level for display does not
satisfy the following expression.
|Previous value - current value|
Remedy
• Same as in SENS
• Pay attention to
storage method and
the time period of
placement on the
sample disk.
• If the result is
satisfactory,
operation can be
continued. After
measurement,
record parameters
on the maintenance
menu to store the K
value.
(Previous value + current value )/2
×100% > COMPENSATE LIMIT
Noise error
NOISE
N
(ISE)
This error is indicated if the
difference between the
maximum and minimum
potentials is within the following
range at three of the five
measuring points for each test
(on internal standard or sample).
Na : 0.7mV < |FIV(2) - FIV(4)|
K : 1.0mV < |FIV(2) - FIV(4)|
Cl : 0.8mV < |FIV(2) - FIV(4)|
2 - 45
• Set reagent and
perform ISE priming
(with internal
standard solution
and diluent) once.
• Make sure O-ring is
fitted to each
electrode and its
holder and it is not
fitted doubly.
After reattaching,
perform ISE priming
(with reference
electrode solution).
• Replace the tube
and perform ISE
priming (with
reference electrode
solution) once.
• Clean the waste
solution drain path.
• Clean the syringe
and plunger and
replace the seal
piece.
(cont’d)
No.
Data Alarm
Level error
Printer
LEVEL
S. I/F
Description
Remedy
L
(ISE)
This error is indicated if the
mean potential is outside the
following range at three of the
five measuring points for each
test (on internal standard).
•Set reagent and perform
ISE priming (with
reference electrode
solution) twice.
•Replace the electrode
and perform ISE
priming (with reference
electrode solution)
once.
•Retighten the nipple.
Or after replacing the
rubber packing, perform
ISE priming (with
reference electrode
solution) once.
•Confirm the proper
combination of tube and
reagent.
•Plug in the cord
properly.
•Replace the electrode.
•Remove the probe and
correct clogging.
•Set properly.
•Confirm the proper
combination of tube and
reagent.
Na : -90.0mV ≤ EAV ≤ -10mV
⇒ OK
K : -90.0mV ≤ EAV ≤ -10mV
⇒ OK
Cl : 100.0mV ≤ EAV ≤
180.0mV ⇒ OK
Slope abnormal
Electrode
preparation
SLOPE?
PREP.
E
R
(ISE)
(1) The slope level for display
is within the following
range.
Na, K : SLOPE < 45.0mV,
Cl
: SLOPE > -35.0mV
(2) Electrode response is
degraded.
(Carry-over rate is as
shown below.)
Na : 0.232 < A
K : 0.160 < A
Cl : 0.490 < A
Upon calibration, the slope
value is within the following
range.
•Make sure that the
standard solution and
reagent are set properly.
•Make sure that the
standard solution is free
Na, K : 45.0mV ≤ Slope value
from concentration or
≤ 49.9mV or
deterioration.
68.1mV ≤ Slope value
•Make
sure that the
Cl
: -39.9mV ≤ Slope value
electrodes
(Na, K, Cl)
≤ -35.0mV or
are
within
their
-68.1mV ≤ Slope value
guaranteed life.
2 - 46
(cont’d)
No.
Data Alarm
Printer
S. I/F
Description
Remedy
(ISE)
The internal standard
concentration (C(IS)) is within
the following range.
Na : C(IS) < 120.0mEq/L or
160.0mEq/L < C(IS)
K : C(IS) < 3.0mEq/L or
7.0mEq/L < C(IS)
CL : C(IS) < 80.0mEq/L or
120.0mEq/L < C(IS)
Any data alarm other than
shown below is indicated for
the test to be used for
calculation.
Calculation disabled, test-totest compensation disabled,
expected value over
Concentration value (or activity
value) cannot be output within
the specified range of digit
count.
•Confirm monthly flow
path washing.
•Replace the diluent and
internal standard
solution.
•In process of calculation, the
denominator becomes zero.
•An overflow occurs in
logarithmic or exponential
calculation.
•In isozyme Q-channel
concentration calculation, the
data alarm of 'calculation
disabled' is indicated for the
isozyme P-channel data or
the isozyme P channel is not
measured.
•Calculation for a calculation
test has been attempted with
the data having a data
blanking alarm.
The test result is outside the
expected value range (outside
mean value ± 2SD in case of a
control sample).
•Smaller than the lower limit
value
•The data is left blank.
•Determine the cause of
failure to color
development such as
improper kind of
standard solution, wrong
set position and
clogging of sample
probe.
•Dilute the sample or
reduce its volume and
perform analysis again.
Internal standard
concentration
abnormal
I. STD
D
Calculation test
error
CALC?
%
Overflow
OVER
O
Calculation
disabled
???
X
Expected value
over
L
H
–
–
•Larger than the upper limit
value
2 - 47
•Check the data alarm
name and take a proper
measure.
•The data is left blank.
•Prepare appropriate
standard solution.
•This alarm is not
indicated for serum
index.
•Correct setting on the
parameter registration
menu 1 screen.
(cont’d)
No.
Data Alarm
Sample value
abnormal
Test-to-test
compensation
error
Test-to-test
compensation
disabled
SD absorbance
over
Printer S. I/F
Description
&
R. OVER
(ISE)
The sample concentration
(C(S)) is within the following
range.
Na : C(S) < 10.0mEq/L or
C(S) > 250.0mEq/L
K : C(S) < 1.0mEq/L or
C(S) > 100.0mEq/L
Cl : C(S) < 10.0mEq/L or
C(S) < 250.0mEq/L
C
CMP.T
(1) In test-to-test
compensation calculation,
any data alarm other than
shown below is indicated
for the compensation data.
(2) In isozyme Q-channel
concentration calculation,
any data alarm other than
shown below is indicated
for the isozyme P-channel
concentration.
Calculation disabled, testto-test compensation
disabled, overflow, random
error, systematic error, QC
error, expected value over
M
CMP.T!
(1) In process of calculation for
test-to-test compensation,
the denominator becomes
zero.
(2) The test to be used for testto-test compensation is not
measured.
(3) Any test to be used for testto-test compensation has
the data alarm of
'calculation disabled' or
'test-to-test compensation
disabled.'
(4) Any compensation test has
the data alarm which
leaves the data blank.
>
>AMAX
At standard concentration of
“∞ ”, absorbance of sample or
absorbance change rate is over
or the same compared with
presumptive absorbance or
absorbance change rate.
2 - 48
Remedy
•Dilute the sample and
analyze it again.
•Direct measurement is
impossible. Utilize
standard addition
method, etc.
•Remove the probe and
correct clogging.
•Check the channel data
used for test-to-test
compensation.
•The data is left blank.
•Make sure masking is
not specified for the test
to be used for
compensation.
•Check the calculation
formula on the
parameter registration
menu 3 screen.
2.4.4 ISE Data Alarms
Alarm on ISE data processing has 2 kinds shown below; calibration alarm and data alarm.
(1) Calibration Alarm
Priority
Alarm
Printout
CRT
S. I/F
ISE
Processing
N.E.C.R
STD
Alarm Output
on Operation
Monitor Screen
1
STD error
STD?
–
S
×
O
O
2
Slope
abnormal
SLOPE?
–
E
×
O
O
3
Electrode
preparation
PREP
–
R
×
O
O
4
Internal
standard
concentration
abnormal
I. STD
–
D
×
O
O
5
Calibration
error
CALIB
–
B
×
O
O
< Key >
N
:
E
:
C
:
STD :
Routine sample measurement
Stat sample measurement
Control sample measurement
Calibration measurement
2 - 49
Remarks
In calibration
measurement,
this alarm is set
at any of the
data alarms in
(2) (excluding
data alarms 6 to
9).
(2) Data Alarm
Priority
Alarm
Printout
CRT
S. I/F
ISE
Processing
Alarm Output
on Operation
Monitor Screen
Remarks
ISE
Check
Data
Alarm
N.E.C.R
STD
1
ADC
abnormal
ADC?
A
A
O
O
O
Registration is made on
the operation monitor in
ADC task.
O
2
Sample short
SAMPLE
V
V
O
O
×
At occurrence of this
alarm, the 'calculation
disabled' alarm is also set
(for making output data
blank).
×
3
Noise error
NOISE
N
N
O
O
O
O
4
Level error
LEVEL
L
L
O
O
O
O
5
Sample value
abnormal
R.OVER
&
&
O
×
×
×
6
Calculation
disabled
???
×
×
O
O
×
×
7
Test-to-test
compensation
disabled
CMP.T!
M
M
O
×
×
8
Test-to-test
compensation
error
CMP.T
C
C
O
×
×
×
9
Overflow
OVER
O
O
O
×
×
O
2 - 50
Check is not performed in
ISE data processing.
×
(3) Registration of Data Alarm "sample short"
Measured Sample
Other than STD (1)
STD (1)
Alarm Issued in Sampling
(Note 1)
1st Time
2nd Time
A
B
C
–
–
–
A
B
C
–
–
–
–
Water
discharge
NOTES:
Data Output
Data Alarm
(Note 2)
(Note 3)
×
O
O
×
O
O
O
O
O
×
O
O
×
×
1. A: Pre-detection is not made.
B: Pre-detection is made and at least either one of the following is encountered.
(i) The number of remaining pulses is zero.
(ii) Abnormal fall detection is activated within ±2 mm of the cup bottom level recognized
in probe adjustment.
C: Other than A and B
(Pre-detection refers to liquid level detection till a time point just before sample aspiration
since start of probe fall.)
2. O: Output
×: Space
3. O: Issued
×: Not issued
2 - 51
2.4.5 Alarm Check Method
(1)
Photometry Assay Calibration Check
(a)
SD check of approximate expression
When SD in the difference between the automatically generated calibration curve
and the measured absorbance value in non-linear calibration is larger than "SD limit
absorbance," comment SD? is printed. SD value is printed under the test name in
the result of calibration. Unless check is desired, input 999.9.
(b)
Duplication check
In measurement of reagent blank and standard solution, comment DUP is printed
when the difference in absorbance between two measurements is larger than
"duplicate limit absorbance." Unless check is desired, input 32000.
(c)
Sensitivity check
When the difference in absorbance between reagent blank (STD1) and standard
solution (having the maximum concentration if there are multiple standard
solutions), comment SENS is printed. Unless check is desired, input 0.
(d)
Standard solution 1 absorbance check
When the absorbance of reagent blank (standard solution 1) exceeds "standard 1
absorbance range," comment S1 ABS is printed. In an end-point assay test, the
absorbance value on the left side of calibration result printout is checked and that
on the right side is checked in a rate-assay test. Unless check is desired, input 32000 to 32000.
2 - 52
(2)
Reaction Limit Level Check
When concentration or enzyme activity is abnormally high in a rate assay test, correct
data is unobtainable because the substrate or coenzyme in reagent is consumed
completely. Therefore, the upper or lower reaction limit absorbance is set for check .
Check is made on the absorbance at the main wavelength alone.
< Relationship between Alarm Name and Photometric Point >
When 4 points or more over the specified photometric range are within the reaction limit,
measurement is carried out normally. In case no point, 1 point or 2 points are within the
reaction limit, a reference value is obtained depending on an absorbance change
between the first two points. In case 3 points are within the reaction limit (with comment
LIMT2), the value obtained depending on an absorbance change among the first three
points is printed as a reference value.
ABS.
ABS.
Reaction limit level
Time
Time
Input photometric range
(with comment LIMT1)
Input photometric range
(with comment LIMT0)
ABS.
ABS.
Reaction limit
level
Time
Time
Input photometric range
(with comment LIMT2)
Input photometric range
(with comment LIMT2)
Fig. 2-1 Reaction Limit Level Check
< Automatic Correction of Reaction Limit Level >
The instrument corrects the input reaction limit level by adding an absorbance value due
to sample turbidity, etc.
Reaction limit level = Input reaction limit absorbance value + (L1 - LB)
L1 :
Sample absorbance at photometric point 1
LB :
Reagent blank absorbance at photometric point 1
When L1 - LB ≤ 0, automatic calibration will not be performed.
2 - 53
(a)
Electrolyte compensable range check.
When the ratio of change in calibrator concentration or slope value from the
previous one is larger than the input value, comment CALIB is printed. Unless
check is desired, input 200%.
(b)
Calibration check
When calibration factor K has changed by 20% or more from the previous value,
comment CALIB is printed (check value is fixed at 20%).
(c)
STD check
If any of the following alarms occurs on calibration data, comment STD? is printed.
• ADC abnormal (ADC?)
• Reaction limit over (LIMT0, 1, 2)
• Cell blank abnormal (CELL?)
• Reaction linearity abnormal (LIN. or LIN.8)
• Sample short (SAMPL)
• Duplicate error (DUP)
• Reagent short (REAGN)
• Standard 1 absorbance abnormal
(S1ABS?)
• Absorbance over (ABS!)
• Calculation disabled (???)
• Prozone error (xxxxxP)
(d)
Measure to be taken on printout of comment
When comment STD? or SENS is indicated, calibration curve will not be updated.
Therefore, recalibration is necessary. In case of CALIB or SD!, sample
measurement is allowed after making sure the result of calibration is normal. In this
case, however, the result of calibration will not be saved automatically onto the
floppy disk. Before turning off power supply, parameters should be recorded on the
maintenance screen.
Table 2-1 Handling of Calibration Result with Comment
Printed
Comment
Calibration Result
(display on screen)
Alarm Name on
Operation Monitor Screen
Automatic Saving onto
Floppy Disk
The reagent blank (S1ABS)
and calibration factor (K) of
the relevant test are not
saved automatically onto
floppy disk.
STD?
Not updated
(previous result remains)
Calibration curve generation disabled
(code 70-1 to 49)
SENS
Not updated
(previous result remains)
Standard solution sensitivity abnormal
(code 73-1 to46)
CALIB
Updated
(to new result)
Calibration abnormal
(code 70-1 to 49)
SD !
Updated
(to new result)
Calibration SD abnormal
(code 72-1 to 46)
2 - 54
(3) Reaction Linearity Check
In a rate assay test, the linearity in absorbance change is checked.
Check value varies with the number of points (N) in photometric range.
Fig. 2-2 Reaction Linearity Check
< When N ≥ 9 >
The difference in absorbance change quantity between the first-half 6 points (5 sections)
and the latter-half 6 points is obtained and then divided with the overall absorbance
change quantity. When the result of this calculation exceeds the limit in linearity check,
comment LIN. is printed together with the result of measurement.
∆Af − ∆Ab
∆A
× 100 > Linearity limit value.....LIN.
< When 4 ≤ N ≤ 8 >
The difference in absorbance change quantity between the first-half 3 points (2 sections)
and the latter-half 3 points is obtained and then divided with the overall absorbance
change quantity. When the result of this calculation exceeds the limit in linearity check,
comment LIN.8 is printed together with the result of measurement.
∆Af 9 − ∆Ab 9
∆A
× 100 > Linearity limit value.....LIN.8
9
• ∆Af, ∆Ab and ∆A in the above formula are all converted into absorbance change in a minute
by the least squares method.
• In the following cases, reaction linearity is not checked.
a) The number of photometric points (N) within the reaction limit is 3 or less ("reaction limit
over" will occur).
b)
-4
Absorbance change in a minute is 60 × 10 Abs or less, or |∆Af - ∆Ab| is equal to or
-4
smaller than 60 × 10 .
2 - 55
(4)
Prozone Check
In immunological reaction, the absorbance of calibration curve falls at high concentrations
so that correct data is unobtainable (this is called "zone phenomenon or prozone effect").
Therefore, prozone check is performed by the two methods below and a data comment is
indicated when required.
< Antigen Readdition Method >
In 1-point assay, a small amount (approx. 50 µL) of sample containing antigen is readded
for the second reagent (R2 to R4) to check the change in absorbance before and after
addition (the dashed line in Fig. 2-3 indicates that absorbance falls due to excessive
antigen).
< Reaction Rate Ratio Method >
In 2-point assay, check is performed according to the ratio of the initial reaction rate after
addition of antiserum to the mean reaction rate.
Check Abs.
R1
Rn (antigen)
(antiserum)
Fig. 2-3
Time
Antigen Readdition Method
Rn (nth reagent) Time
R1
(1st reagent)
Fig. 2-4 Reaction Rate Ratio Method
2 - 56
Antigen Readdition Method
(1-point assay)
Absorbance for concentration
calculation
Prozone check value
(PC value)
Ax =
Al + Al-1
Reaction Rate Ratio Method
(2-point assay)
Ax = Am + Am-1 -k Al + Al-1
2
2
PC = Am + Am-1 -k Al + Al-1
2
PC =
2
2
(Am - An)/(m-n)
× 100
(Ap - An)/(p-n)
< Judgment >
In case of 'limit value - above,' comment xxxP (xxx indicates PC value) is printed when PC
value is larger than the limit value. In case of 'limit value - below,' the comment is printed
when PC value is smaller than the limit value.
• Prozone check will not be performed in the following cases.
(1) In STD (1) measurement
-4
(2) |Ap - Am| < 100 × 10 Abs
2 - 57
(5)
ISE Calibration Alarm Check
Alarm Name
Alarm Check Method (alarm setting condition)
Standard error
Calibration is invalid.
(Any of the following alarms has occurred; ADC abnormal, sample short,
calculation disabled, noise error and level error.)
Slope abnormal
(1)
(2)
ISE prepare
(1)
The slope for display is within the following range.
Na, K :
Slope < 45.0 mV
Cl
Slope > -35.0 mV
:
Electrode response is degraded (carry-over ratio is as given below).
Na
:
0.232 < A
K
:
0.160 < A
Cl
:
0.490 < A
The slope for display is within the following range.
Na, K :
45.0 mV ≤ Slope ≤ 49.9 mV or
68.1 mV ≤ Slope
Cl
:
-39.9 mV ≤ Slope ≤ -35.0 mV or
-68.1 mV ≥ Slope
(2)
Electrode response is degraded (carry-over ratio is as given below).
Na
:
0.154 < A
K
:
0.107 < A
Cl
:
0.330 < A
Internal standard
concentration
abnormal
The concentration of internal standard solution (C(IS)) is within the following
range.
Calibration
abnormal
On each of the calibrator concentration and slope for display, the previous and
current values are compared and the result exceeds the COMPENSATE LIMIT
value.
Na
K
Cl
:
:
:
C (IS) < 120.0 mEq/L or 160.0 mEq/L < C (IS)
C (IS) < 3.0 mEq/L or 7.0 mEq/L < C (IS)
C (IS) < 80.0 mEq/L or 120.0 mEq/L < C (IS)
Previous value - Current value
(Previous value + Current value)/2
2 - 58
× 100 (%) > COMPENSATE Limit
(6)
ISE Data Alarm Check
Alarm Name
Alarm Check Method
ADC abnormal
The result of ADC is abnormal. (Checked in ADC task)
Sample short
Sample volume is inadequate. (Checked in control task)
Noise error
This alarm is issued when a difference between maximum and minimum
potential values at three out of five measurement points in each test is within
the following range (on internal standard and sample).
Na : 0.7 mVFIV (2) - FIV (4)
K : 1.0 mVFIV (2) - FIV (4)
Cl : 0.8 mVFIV (2) - FIV (4)
Level error
This alarm is issued when a difference between maximum and minimum
potential values at three out of five measurement points in each test is within
the following range (on internal standard).
Na :
K :
Cl :
Sample value abnormal
The sample concentration (C(S)) is within the following range.
Na :
K :
Cl :
Calculated disabled
-90.0 mV ≤ EAV ≤ -10 mV
⇒ OK
-90.0 mV ≤ EAV ≤ -10 mV
⇒ OK
100.0 mV ≤ EAV ≤ 180.0 mV ⇒ OK
C (S) < 10 mEq/L or C (S) > 250 mEq/L
C (S) < 1 mEq/L or C (S) > 100 mEq/L
C (S) < 10 mEq/L or C (S) > 250 mEq/L
Due to zero division, log-X, etc.
2 - 59
2.4.6 Check and Set Alarm of Each Data
(1)
Calibration
Priority
1
2
3
4
5
6
Data Kind
Potential of internal
standard solution
Low potential of
standard solution
High potential of
standard solution
Calibrator potential
Slope value (for
display)
Concentration of
internal standard
solution
Calibrator
concentration
Correction factor
(2)
Na
K
Cl
Na
K
Cl
Na
K
Cl
Na
K
Cl
Na
K
Cl
Na
K
Cl
Noise error Level error
Na
K
Cl
Na
K
Cl
Calculation
disabled
ADC
abnormal
Sample
short
Noise
error
↑
↑
↑
↑
↑
↑
Slope
abnormal
Preparation
abnormal
Internal
standard
concentration
abnormal
Calibration
abnormal
Calculation
disabled
Level error
Calibration Calculation
abnormal disabled
Calculatio
n disabled
Routine Sample Measurement (1st), Stat Sample Measurement (1st) and Control Sample
Measurement
Priority
1
2
3
4
5
6
Data Kind
Sample
concentration
Na
K
Cl
ADC
abnormal
Sample
short
Noise error Level error Sample
value
abnormal
If multiple data alarms concur, the one with the highest priority will be indicated.
2 - 60
Calculatio
n disabled
2.4.7 Details of Data and Alarm Outputs Resulting from Calibration
Sample error factors
Standard
solution
LOW
ISL2
ISL3
ISM1
ADC
Noise
Level
Noise errror
EL2
EL3
ADC
Sample
Noise short
Level
ADC error
Level error
Sample short
IS
potential
Low
potential
Noise error
Standard
solution
HIGH
ISM2
ISM3
ISC1
ADC
Noise
Level
ADC error
EM2
EM3
ADC
Sample short
Level
Noise error
ADC error
Sample short
Standard
solution
CALIBRATOR
ISC2
ISC3
ISC4
ADC
Noise
Level
EC2
EC3
ADC
Sample short
Level
Level error
STD error
Slope abnormal
Preparation
abnormal
Calibration
abnormal
Calculation
disabled
Internal standard
concentration
Calculation disabled
Calibrator
concentration
Calibration abnormal
Calculation disabled
Correction
factor
Internal standard
concentration
abnormal
Calculation
disabled
Calibration
abnormal
Calcuration
disabled
Calcuration
disabled
Slope abnormal
Preparation abnormal
Calibration abnormal
Calculation disabled
IS
concentration
Calibration
potential
Noise error
Calculation error factors
Slope
High
potential
Sample short
Calculation disabled
2 - 61
Slope
Internal
standard
concentration
Calibration
concentration
Correction
factor
2 - 62
(1)
List of Calibration Output Media
Output Medium
CRT
(screen name)
Output Data
Calibration curve
parameters
(S1ABS, K, A, B, C)
PRT
S. I/F
×
×
CALIBRATION MONITOR
O
×
×
CALIBRATION LIST
×
SD value
Serum index blank
CALIBRATION LIST
Blank level
×
×
×
Absorbance or absorbance
change rate
×
CALIBRATION MONITOR
O
Initial or final observance
×
CALIBRATION MONITOR
O
NOTE: In plotting of measured absorbance values, the currently measured STD alone is
taken.
(2)
Relationship between Alarm and Output in Calibration
Data Alarm Name
Updating of Screen
Parameter
Screen Display
of Alarm
S1ABS error
DUPLICATE error
STD error
No
No
No
No
No
Yes
SENSITIVE error
CALIB error
SD error
No
Yes
Yes
Yes
Yes
Yes
No alarm
Yes
No
Remarks
NOTE: For CALIB and SD errors, "∗" is output on logging for discrimination.
2 - 63
2.5
Retry Code Table
Code
Description
Allowable
Retry Count
1
Alarm fuse blown
1/50 ms
2
12 V for lamp
1/4.5 sec
3
15 V for CPU rack
1/50 ms
Remarks
Check is not made when lamp is turned
off (during initialization, water exchange
or sleep).
4
-15 V for CPU rack
1/50 ms
14
Liquid in vacuum tank
1/4.5 sec
15
Vacuum pressure abnormal
1/4.5 sec
16
Waste solution tank
1/4.5 sec
17
Incubation bath water inadequate
100/4.5 sec
Checked in the following statuses;
standby, operation, sampling stop.
18
Distilled water short
1) 10/6 sec
Water supply
2) 50/6 sec
Warning
3) 150/6 sec
STOP
1/6 sec
Check is not made within 10 sec after
vacuum pump turns on.
19
Distilled water sensor abnormal
Check is not made during initialization,
water exchange or wake-up.
31
GPCNT1
10
Only at power-on
32
GPCNT2
10
Only at power-on
33
GPCNT3
10
Only at power-on
34
GPCNT4
10
Only at power-on
35
GPCNT5
10
Only at power-on
36
GPCNT6
10
Only at power-on
37
GPCNT7
10
Only at power-on
38
GPCNT8
10
Only at power-on
46
GMCNT1
10
Only at power-on
47
GMCNT2
10
Only at power-on
48
GMCNT3
10
Only at power-on
50
ADC controller
1
Only at power-on
71
Checksum error detected in operation
unit
1
72
Checksum error detected in analyzing
unit
1
49
102
103
104
105
106
107
2 - 64
2.5.1 Logging Program List
No.
1
Function
Monitor printout
2
Calibration result
printout
3
Remaining
reagent volume
printout
4
Cell blank printout
5
Reproducibility
check printout
Cumulative
mechanism
information
printout
6
7
8
ISE check printout
10
Photometer check
printout
Alarm trace
printout (DAILY)
11
12
13
14
15
16
Processing
Real time printout: Specify "print" on
the start condition menu screen.
Printout is made when the specified
values in all tests for one sample are
calculated during operation.
Batch printout: Specify sample
number on the data monitor screen.
Real time
and batch
Printout is made when "calibration" is
selected on the start condition menu
screen and the result of calibration is
output.
Specify "remaining reagent volume
printout" on the start condition menu
screen.
Real time
×
Batch
×
Specify "cell blank" on the
maintenance screen.
Specify "reproducibility check" on the
maintenance screen.
Specify "cumulative mechanism
information" on the mechanism check
menu screen.
Batch
O
Batch
O
Batch
×
Batch
O
Batch
×
Specify "ISE" check on the mechanism
check menu screen.
Specify "photometer check" on the
maintenance screen.
Specify "alarm trace information" on
the mechanism check menu screen.
Specify "alarm trace information" on
the mechanism check menu screen.
Real time
×
Printout is made when "original Abs." is
specified on the system parameter
screen and operation is executed.
Specify "communication trace printout"
on the mechanism check menu screen.
Specify "work sheet printout" on the TS
registration screen of routine analysis.
Specify "Barcode Reader" check on
the mechanism check menu screen
Real time
Parameter printout Specify "parameter" on the
maintenance screen.
Program check
Specify "program check" on the
printout
mechanism check menu screen.
9
Alarm trace
printout
(CUMULATIVE)
Original Abs.
printout
Communication
trace printout
Work sheet
printout
Barcode Reader
check
NOTES:
Printout Stop
by Stop Key
Output Method
1. The stop key is invalid during printout.
2. The stop key need be pressed to stop analysis.
(1) Initialization of Printer
2 - 65
Batch
O
(In batch mode
alone)
O
(Note 1)
Batch
O
Batch
O
×
(Note 2)
Batch
O
Batch
O
Real time
×
Effected when power supply is turned on or there is a printer alarm at start of printing
one processing.
(2) Paper Feed
• At end of printout
At the end of each printout (in batch mode of No. 1 and in Nos. 3 to 15), paper is
fed by 3 lines.
(Paper is also fed when printout is stopped by stop key input.)
(3) Page Length
Page length is not determined.
(4) Printing Performance
4 lines/sec (80 characters/sec), 2.54 cm/6 lines, paper feed in pitches of 4.23 mm/line
(1/6 inch)
(5) Printing System
Numerals are right-justified with space at leading positions unless there is a
comment.
(6) Printout with No Blank Space
• Channel number is not registered in keyed-in information.
• Measured data is unavailable.
(7) For Leaving Blank Space
Overflow has occurred at the location where measured data is to be printed.
2 - 66
2.6
Daily Alarm Trace
(1)
Outline
The alarm and retry data from power-on to present time point are printed when "daily" in
"alarm trace data" is specified on the mechanism check menu screen.
(2)
Details of Printout
(a) Title
The title "Daily Alarm Trace," date and time are printed.
The printing order of year, month and day depends on the date printout order
specification.
(b) Time (24-hour base)
Time when alarm and retry data has been saved onto FD.
(c) Instrument status
Numerical value representing the instrument status. For details, refer to Table
2-2.
(d) Occurrence count
Indicates how many times the same alarm/retry data as that in a single cycle has
occurred successively (in the number of cycles within 1 to 999).
(e) Identification character
'A' is printed out for alarm data, and 'R' for retry data. Printout is not made when
there is no data in each case.
(f) Alarm data
The alarm data is printed out in the order of main alarm code (3-digit integer), sub
alarm code (3-digit integer) and time of occurrence up to 10 kinds. If 10 kinds are
exceeded, excess ones are not stored. However, they are saved as cumulative data.
Time of occurrence: Time on the basis of operation cycle (000 to 179) when the
alarm has occurred (in 100 msec).
(g) Retry data
The retry data is printed out in the order of retry code (3-digit integer), retry count (3digit integer) and time of occurrence up to 10 kinds. If 10 kinds are exceeded, excess
ones are not stored. However, they are saved as cumulative data.
(h) Key operation data
The key operation data is printed out in the order of key operation code (3-digit
integer), key operation count (3-digit integer) and time of key operation (3-digit
integer). Printout is made only once.
2 - 67
Table 2-2 Instrument Status Code Table
Blank row is the unassigned one.
Code
Instrument Status
Code
Instrument Status
Code
Instrument Status
1
Initialization
23
45
Incubation bath water
exchange
2
Standby
(including parameter check)
24
46
Resetting
3
Preparation for operation
25
47
Probe position adjustment
(sample probe rotation)
4
Operation
26
48
Probe position adjustment
(sample probe up/down)
5
Sampling stop
27
49
Probe position adjustment
(reagent probe rotation)
6
28
50
Probe position adjustment
(reagent probe up/down)
7
29
T/M stop
51
Probe position adjustment
(stirrer)
30
Emergency stop
8
52
Mechanism check
9
Stop
31
53
Barcode Reader check
10
32
54
ISE check (internal standard
electromotive force
measurement)
11
33
Rinsing (cell)
55
12
34
Rinsing (ISE)
56
13
35
Rinsing (all)
57
14
36
15
37
Photometer check
59
16
38
ISE priming (IS)
60
17
39
61
18
40
62
19
41
20
42
21
43
22
44
58
ISE priming (REF)
63
Cell blank
65
Routine sampling stop
(restart unallowable)
64
66
2 - 68
Mechanism resetting during
operation
(3)
Printout System
(a) Data is printed out in the sequential order starting from the newest data.
(b) When the alarm/retry data in a single cycle does not reach 10 kinds, it is printed out
closely with no blank line left.
(c) When there is no alarm data or retry data, its title alone is printed.
(4)
Notes
(a) Printout can be stopped in steps of cycle by stop key input.
(b) Up to 500-cycle data starting from the oldest one is saved onto FD. However, if the
same data has recurred in consecutive cycles, storage is made as one-cycle data.
(c) In case of FD error, processing is terminated with the title alone printed.
2.6.1 Cumulative Alarm Trace
(1)
Outline
The alarm data and retry data saved in the FD are printed when "cumulative" in "alarm
trace data" is specified on the mechanism check menu screen.
(2)
Details of Printout
(a) Title
The title "Cumul. Alarm Trace," date and time are printed.
The printing order of year, month and day depends on the date printout order
specification.
(b) Final alarm occurrence date/time
The printing order of occurrence date depends on the date printout order
specification. Time printout is fixed to 24-hour base.
(c) Identification character
'A' is printed out for alarm data, 'R' for retry data and 'K' for key operation. Printout is
not made when there is no data in each case.
(d) Alarm data
The alarms, which have occurred in a day, are printed out in the order of main alarm
code (3-digit integer), sub alarm code (3-digit integer) and occurrence count (3-digit
integer) up to 20 kinds.
(Occurrence count: The cumulative number of identical alarms which have occurred
in a day)
(e) Retry data
The retries, which have occurred in a day, are printed out in the order of retry code
(3-digit integer) and retry count (3-digit integer) up to 20 kinds.
2 - 69
(f) Key operation data
The key operation data is printed out in the order of key operation code (3-digit
integer), key operation count (3-digit integer) and time of key operation (3-digit
integer). Printout is made up to 16 kinds.
(3)
Printout System
(a) Data is printed out in the sequential order starting from the newest data.
(b) When the alarm/retry data in a day does not reach 20 kinds, it is printed out closely
with no blank line left.
(c) When there is no alarm data or retry data, its title alone is printed.
(4)
Notes
(a) Printout can be stopped in steps of day by stop key input.
(b) The data obtained from power-on to power-off is taken as daily data and the data for
up to 256 days is saved onto FD starting from the newest data. In case of continuous
energization, however, a day's data is automatically closed when the day changes
and subsequent data is treated as for the following day.
(c) In case of FD error, processing is terminated with the title alone printed.
2 - 70
Alarm Trace Printout (DAILY)
Instrument status
Occurrence count
Time of occurrence
Retry count (or sub alarm code)
Retry code (or main alarm code)
Alarm Trace Printout (CUMULATIVE)
Occurrence count
Sub code
Main
code
Retry circuit
Retry code
2 - 71
2.6.2 Parameter Code List
2 - 72
(1)
Parameter Printout
Table 2-3 Contents of Printout
( O: Printed ×: Not printed )
Numerical
Input from
Screen
0
1 to 37
38 to 40
99
(2)
Contents of Printout
Without ISE
With ISE
Title
O
O
Photometry assay parameter
ISE parameter
O
O
×
O
8calculation tests
8 compensation tests
Control positions (1 to 5)
Serum indexes
Printing order
Printing format (when with card printer)
Set test
Carry-over evasion
System parameter
DIP switch data
O
O
(× for ISErelated tests)
Program Check Printout
Program version No.
2 - 73
Remarks
2.6.3 Communication Trace
(1)
Outline
The contents of communication between the analyzer and external system are printed
according to the specification of "communication trace printout" on the mechanism check
menu screen.
(2)
Printing Items and Their Contents
Details are given in Table 2-4.
Table 2-4 Printing Items and Their Contents
Printing Item
Contents
Title
Title "Communication Trace," date and time are printed.
The printing order of year, month and day depends on the
date printout order specification.
Time
Communication start time – Communication end time
(hour, minute, second)
(hour, minute, second)
Communication mode Transmission AU → HOST
Reception
HOST → AU
Error message
Refer to Table 2-5.
Example of communication text
Refer to the system I/F specification.
2 - 74
(3)
Printout System
(a) Printout order
Sequential printout starting from the latest communication
(b) Presence/absence of error message and printout system
Details are given in Table 2-5.
Table 2-5 Presence/Absence of Error Message and Printout System
Error
Message
Contents
of Error
None
Both transmission
and reception
None (normal)
BCC SUM
HOST → AU
PARITY
FRAMING
OVER RUN
FRAME
LENGTH
CHAR1
HOST →
HOST →
HOST →
HOST →
HOST →
HOST →
CHAR2
CHAR3
HOST → AU
HOST → AU
CHAR4
TIME OUT
HOST → AU
Both transmission
and reception
BCC error or
checksum error
Parity error
Framing error
Overrun error
Frame error
Text length error
Function character
error
Sample data error
Test selecting
information error
Comment error
Transmission or
reception time-out
error
NOTE:
(4)
Communication
Mode
AU
AU
AU
AU
AU
AU
Printout System
(communication
text example)
Only communication
function No. and
sample data
All data printed
All data printed
All data printed
All data printed
All data printed
All data printed
All data printed
Remarks
In printout of
communication text
(example), an ASCII
control code is
converted into a
character string and
printed, and then
line is fed and
communication text
is printed.
(Note)
All data printed
All data printed
All data printed
Only time point,
communication
mode and error
message printed
Control codes and corresponding character strings are listed in Table 2-8.
Notes
(a) Printout is terminated by stop key input. Printout can be stopped after the contents of
trace in one cycle have been printed.
(b) A text is printed on two lines when it is longer than 20 characters.
2 - 75
Table 2-6 Control Codes and Corresponding Character Strings Printed
Control Code (NEX)
00
01
02
03
04
05
06
07
08
09
0A
0B
0C
0D
0E
0F
10
11
12
13
14
15
16
17
18
19
1A
1B
1C
1D
1E
1F
Character String
Use in AU (Analyzer Unit)
NUL
SOM
STX
ETX
EOT
ENQ
ACK
BEL
BS
NT
LF
VT
FF
CR
S0
S1
DLE
DC1
DC2
DC3
DC4
NAK
SYN
ETB
CAN
EM
SUB
ESC
FS
GS
RS
US
O
O
O
O
2 - 76
(5) Communication Trace Printout
5
0
5
0
Communication Trace
94/07/25 16:30
08:11:17 – 08:11:18
AU–>HOST
:A 10110ABCDEFG
08:11:11 – 08:11:12
HOST–>AU
:A 10110ABCDEFG
08:05:08 – 08:05:09
AU–>HOST
:A 10210ABCDEFG
08:05:00 – 08:05:01
HOST–>AU
?
08:04:10 – 08:04:11
AU–>HOST
:A 10210ABCDEFG
08:03:00 – 08:03:01
HOST–>AU CHAR. ERR
:A 05105ABCDEFGHIJKL
A0101010101010101010
10104
Communication start and end time points
Communication mode and error message
Communication text example
2 - 77
2.6.4 Cumulative Instrument Operation List
1.
2.
Routine; Routine sample
Calib.; Calibration solution
3.
4.
Cont.; Control serum
STAT; Stat sample
Number of analyzed samples
Total number of tests
2 - 78
2 - 79
3. FLOW PATH DIAGRAMS
3.1
List of Solenoid Valves.............................................................................................3-1
3.2
Overall Piping Diagramm..........................................................................................3-2
3.3
Flow Rate at Each Location .....................................................................................3-3
3.4
WASH ...................................................................................................................3-4
3.4.1
Details of WASH Processing ......................................................................3-5
3.5
Carry-over Evasion Function ....................................................................................3-6
3-0
3. FLOW PATH DIAGRAMS
3.1
List of Solenoid Valves
Voltage
Maker
Application
Part No.
A2-5617
HB-11-X0185
HB-11-X0185
HB-11-X0193
Open/Close
When
Energized
Open
Open
Open
Open
24 V DC
24 V DC
24 V DC
24 V DC
CKD
CKD
CKD
CKD
713-0321
713-1059
713-1059
713-1379
2-way
HB-11-X0193
Open
24 V DC
CKD
SV 6
2-way
HB-11-X0193
Open
24 V DC
CKD
Water supply intake
Sample syringe
Reagent syringe
Incubation bath water intake
Stirring and washing water
supply
Reagent probe outside
washing water supply
SV 8
2-way
HB-11-X0193
Open
24 V DC
CKD
713-1379
SV 9
2-way
HB-11-X0193
Open
24 V DC
CKD
SV 10
2-way
HB-11-X0193
Open
24 V DC
CKD
SV 11
3-way
A2-5619
–
24 V DC
CKD
SV 12
2-way
NTV-2-HN
Open
24 V DC Takasago
SV 13
2-way
NTV-2-HN
Open
24 V DC Takasago
SV 14
3-way
NRV
–
24 V DC Takasago
SV 15
2-way
A2-5618
Open
24 V DC
SV 16
SV 17
SV 18
2-way
2-way
2-way
MTV-21-SM6M
MTV-21-SM6M
MTV-21-SM6M
Open
Open
Open
24 V DC Takasago
24 V DC Takasago
24 V DC Takasago
Sample probe outside
washing water supply
Rinsing and nozzle tip
washing water supply
Rinsing and cell blank water
supply
Rinsing and cell washing
water supply
Waste solution discharge
(low concentration)
Waste solution discharge
(high concentration)
Vacuum tank (evacuation)
Incubation bath water
discharge
ISE syringe
ISE sample discharge
ISE and REF aspiration
SPV 1
Pinch
valve
SD10BA-2A-00T
Open
24 V DC
SV No.
2-way/
3-way
SV 1
SV 2
SV 3
SV 4
2-way
2-way
2-way
2-way
SV 5
Type
3-1
CKD
Advance ISE aspiration
713-1379
713-1379
713-1379
713-1379
707-0290
713-0331
713-0331
713-0332
713-0320
713-0317
713-0324
713-0325
707-0327
SV9 SV4 SV5
SV6
SY3
SV10
3-2
SY16
SV8
SY2
3.3
Flow Rate at Each Location
Location
S probe Outside
washing
Inside
washing
Flow Rate
mL/min
270 ± 30
Remarks
SV unit restrictor ø1.5/tube L = 80, restrictor ø1.0/tube L = 650
Tube = Tygon ø3.17 × ø6.35
35 ± 5
R probe Outside
washing
270 ± 30
Inside
washing
120 ± 20
SV unit restrictor ø1.5/tube L = 80, restrictor ø1.0/tube L =820
Tube = Tygon ø3.17 × ø6.35
Stirring and washing
320 ± 30
SV unit restrictor ø1.5/tube L = 80, restrictor ø1.15/tube L =
1000 Tube = Tygon ø3.17 × ø6.35
Rinsing
High
concentration
waste solution
probe
90 ± 10
SV11/branch tube/tube L = 395/high
concentration waste solution probe
Low
concentration
waste solution
probe
90 ± 10
Cell blank washing
Tube = Tygon ø2.38 × ø3.96
450 ±150
(µL/0.8 sec)
Nozzle tip washing
140 ± 15
Incubation bath flow
rate
Returning from water
supply pump
Flow rate through lamp
Restrictor ø1.0
Same as above
SV unit restrictor ø1.5/tube A = 580, specials/tube B = 500
Tube A = Tygon ø3.17 × ø6.35, tube B = Silastic tube ø1.0 ×
ø3.0
SV unit restrictor ø1.5/tube L = 1080
Tube = Tygon ø2.38 × ø3.96
After pouring water into the incubation bath with cells set, flow
velocity on water surface should be measured with cells
removed (in sec/circumference).
3.7 ± 0.2
(L/min)
0.30 or more Measure with the lamp coolant tube disconnected at the lamp
inlet.
(L/min)
3-3
3.4
WASH
3.4.1 Details of WASH Processing
START
Maintenance
screen
Unnecessary
1)
Operator's
judgment
Function
:
Necessary :
Washing of each mechanism
WASH (cell)
15 min 20 sec
WASH (ISE)
5 min 44 sec
WASH (All)
20 min 20 sec
WASH necessary?
Necessary
"Execution" input
2)
WASH
Made
"STOP" input
Operation check
Normal
3)
Abnormal
Alarm indication
4)
FD (alarm logging)
END
Step No.
Contents of Processing
1)
Start from MAINTENANCE screen
2)
3)
4)
Reference Document
Screen specifications
See next page
When mechanism operates, its operation is checked. If abnormal, Screen specifications
alarm is indicated.
Alarm code table
Alarm will be saved into the alarm FD.
FD specifications
Remarks: (1) Start method and resulting action
(a) Specify DAILY.
All cells, probes (S and R), stirrer and ISE mechanism are washed.
(b) Specify reaction cell.
(c) Specify ISE.
The ISE mechanism is washed.
NOTE:
Specification of ISE for WASH
when without ISE mechanism ...............Input cannot be made from the screen.
Specification of all mechanisms
when without ISE mechanism ...............Operation is carried out according to "cell"
specification.
3-4
3-5
3.5
Carry-over Evasion Function
(1)
Outline
The carry-over evasion function is provided to prevent occurrence of inaccurate data due
to sample carry-over in photometry assay and ISE tests.
This function works on routine samples alone and does not work on calibrator and control
samples. Carry-over is evaded by changing the measuring sequence among the reagents
or samples, which may cause carry-over, or by execution of washing. The kinds of
evasion/washing are listed below.
(a) Evasion of reagent carry-over due to reagent probe and washing for evasion
(b) Evasion of carry-over between reagents due to cell and washing for evasion
(c) Evasion of sample carry-over due to sample probe and washing for evasion
(a) Evasion of reagent carry-over due to reagent probe and washing for evasion
(I)
Condition for carry-over evasion
When the evasion of reagent carry-over due to reagent probe is set, it is
attempted at first by changing the reagent sampling sequence (test sequence).
If this method is unusable, carry-over evasion by washing is executed. That is,
when the sequence of pipetting reagents (R1 to R3) with the reagent probe
matches the specified pattern, carry-over is prevented by (i) to (iii) below. In (ii)
and (iii), throughput is degraded.
(i) For avoiding the relevant pattern, channel registration is changed for a
different test within the test sequence of the same sample.
(ii) When step (i) cannot be taken, a channel is registered after reagent probe
washing cycle.
(iii) Cell is made blank and the system waits till deviation from the specified
pattern.
(II)
Method of carry-over evasion
The reagent probe is washed by aspirating detergent (detergent 1 or 2) or
system water (distilled water for washing the inside of probe) and discharging it
into a cell. At this time, the stirring rod is also washed in that cell.
(III)
Carry-over evasion-specified pattern
The patterns, for which the evasion of carry-over between reagent types is
specified, are listed below.
"→ ALL" indicates that evasion is required in all types of R1, R2 and R3.
ALL represents 3 reagent types for 3-reagent system, and 2 reagent types for 2reagent system.
R3 → R3, R3 → R2, R3 → R1,
R2 → R3, R2 → R2, R2 → R1,
R1 → R3, R1 → R2, R1 → R1
(IV) Registration of carry-over evasion-specified pattern
Up to 40 kinds of patterns, for which the evasion of carry-over due to the
reagent probe is specified, can be registered.
3-6
(V)
Probe washing cycle
Probe washing employs one (1) machine cycle.
Within one machine cycle, the specified detergent (system water) placed on the
reagent disk is aspirated in the specified volume and discharged into the cell at
the same timing as for reagent aspiration and discharge.
(VI) Measure for ISE
Of the reagents for ISE, the internal standard solution and diluent are applicable
to carry-over evasion. Carry-over evasion cannot be specified for reference
electrode solution.
(VII) Specification from screen
From the screen, the following need be specified; a carry-over giving test and
its reagent type (R1, R2, R3), a carry-over receiving test and its reagent type
(R1, R2, R3), detergent set position on the reagent disk and detergent volume.
An example of specification is shown below.
[GPT]
↑
Carryover
giving test
(CH1 to 36)
[1]
↑
Reagent
type
(1:R1
2:R2
3:R3)
[LDH]
↑
Carryover
receiving
test
(CH1 to
36, ISE
ALL)
[4]
↑
Reagent
type
(1:R1
2:R2
3:R3)
[38]
↑
Detergent set position
(1 to 39...ISE excluded
1 to 36,39...ISE
allowed
W1..........System
water)
[350]
↑
Detergent
discharge
volume
(50 µL to
350 µL)
(VIII) Examples of evading procedure
Examples of carry-over evading procedure are shown below.
A to C represent tests, and W stands for washing.
Example of Carry-over
Evasion-specified Pattern
AR3
BR2
AR3
AR3
AR3
AR3
AR3
BR3
BR1
Example of Evading Procedure
3-7
CR2 (example of succeeding in evasion by
change in channel registration)
W
BR3
W
BR1
(b) Evasion of carry-over between reagents due to cell and washing for evasion
(I)
Condition for carry-over evasion
The cell used for analysis of the specified test is not used for analysis in the
next round (after 48 cycles). Instead, it is washed for prevention of carry-over.
(II)
Method of carry-over evasion
Cell is washed by aspirating detergent (detergent 1 or 2) or system water and
discharging it into a cell. At this time, washing is facilitated by stirring.
Carry-over evasion of cell is also effected during S. Stop. After completion of
washing all cells, auto stop occurs.
When stop status is set for any cause other than auto stop, cell washing for
evading carry-over due to the previous operation will not be resumed in start
from the standby status.
Execution of cell washing degrades throughput.
(III)
Registration of carry-over evasion-specified pattern
Up to 10 kinds of patterns, for which the evasion of carry-over due to cell is
specified, can be registered.
(IV) Specification from screen
From the screen, the following need be specified; a carry-over giving test,
detergent set position on the reagent disk and detergent volume.
An example of specification is shown below.
[TG]
[38]
↑
↑
Detergent set position
Carry(1 to 39...ISE excluded
over
giving test 1 to 36,39...ISE allowed
(CH1 to 36) W1… System water)
(V)
[350]
↑
Detergent discharge
volume
(50 µL to 350 µL)
Cell washing cycle
When detergent discharge volume exceeds 350 µL, detergent is discharged by
using 2 timings among the 3 timings (R1, R2, R3) for reagent aspiration and
discharge in one cycle.
(VI) Example of evading procedure
An example of carry-over evading procedure is shown below.
A to E represent tests, and W stands for washing.
Carry-over Evasion-specified Test
A
3-8
Example of Evading Procedure
a-th cycle............ B
A
C.......
(a -1)th cycle....... D
W
E.......
(c) Evasion of sample carry-over due to sample probe and washing for evasion
(I)
Condition for carry-over evasion
Sample carry-over is prevented by washing the sample probe.
(II)
Method of carry-over evasion
The sample probe is washed at the timing just before pipetting the sample
whose measurement includes a sample carry-over washing-specified test
(between sample pipettings).
The sample probe is washed by the following method. The determined volume
(65 µL) of detergent is aspirated from the specified washing cup on the sample
disk and discharged into the washing bath where the sample probe is washed
with water. At this time, stirring is not made.
(III)
Tests with sample probe washing
Tests of control sample and standard solution are excluded.
(IV) Sample probe washing cycle
The sample probe is washed in one cycle time. Washing of the sample probe
will not degrade throughput.
(V)
Registration of carry-over evasion-specified pattern
Up to 8 kinds of patterns, for which the evasion of carry-over due to the sample
probe is specified, can be registered.
(VI) Specification from screen
From the screen, the following need be specified; a test, for which washing of
the sample probe is specified for carry-over evasion, and the detergent set
position on the sample disk. An example of specification is shown below.
[AFP]
↑
Carryover
giving test
(CH1 to 36)
[W1]
↑
Detergent set position
(W1, W2, W3)
(VII) Examples of evading procedure
An example of carry-over evading procedure is shown below.
A to C represent tests, and W stands for washing.
Carry-over Evasion-specified Test
Example of Evading Procedure
..... B
W
A
B
C
W
A
W
A
B
A
Sample i
3-9
Sample i+1
Sample i+2
Sample i+3
(2)
Priority of Carry-over Washing
On concurrence of multiple carry-over washing timings, priority is given on the principle
below.
(a) Cell washing > probe washing
When the cell used for reagent probe washing requires washing, priority is given to
cell washing. On this occasion, probe washing is carried out after cell washing.
However, when use of the detergent at the same reagent position is specified for both
reagent probe washing and cell washing, the reagent probe washing step can be
substituted by the cell washing process. Therefore, only the cell washing is carried
out omitting the reagent probe washing.
(b) As for sample probe washing and cell washing, priority is given to cell washing.
(c) For sample probe washing and reagent probe washing, priority is given to sample
probe washing.
(d) When reagent probe washing R1, R2 or R3 and cell washing become necessary
simultaneously with the same cell, the next cell can be used for preventing overflow if
the total volume in a cell exceeds 540 µL.
3 - 10
4. BLOCK DIAGRAMS
4.1
Model 902 Operating Principle ...............................................................................4-1
4.2
Principle of 902.........................................................................................................4-2
4.2.1
Measuring Principle ....................................................................................4-2
4.3
Block Wiring Diagramm............................................................................................4-6
4-0
4. BLOCK DIAGRAMS
4.1
Model 902 Operating Principle
Interface
Reagent
pipetter
Rinse water
pump
Serum
pipetter
Microcomputer
Multiwavelength
photometer
Rinsing
Stirriing
Serum sampling
mechanism
Reaction disk
Log converter
A/D converter
Reagent pipetting
mechanism
LCD with touch
panel
Printer
Sample disk
Incubation bath
Reagent disk
Fig. 4-1 System Configuration of 902
4-1
Floppy disk
4.2
Principle of 902
4.2.1 Measuring Principle
The measuring principle of the 902 will be explained by dividing it into operation of
mechanisms, analytical flow, and operating position.
(1)
Operation of Mechanisms
The 902 consists of sample disk, sampling mechanism, reagent disk, reagent pipetting
mechanism, reaction disk, reaction bath, stirring mechanism, rinse mechanism,
photometric system, touch screen type LCD, etc. The analytical operation will be
explained with reference to the 902 system configuration in Fig. 4-1.
(a) Set sample cups or test tubes containing sample on the sample disk and reagent on
the reagent disk. Also set the test items requested for the samples plus the
measurement conditions on the LCD. At the start of analysis, the operations below
will be carried out automatically.
(b) Reaction cuvette rinsing and water blank measurement
The reaction cuvettes are rinsed, and the absorbance of the cuvettes (containing
water) is measured four times. The measured value becomes the water blank value
for each cuvette. After completion of the water blank measurement, the water is
aspirated from the cuvettes.
(c) Sampling
After water blank measurement, the reaction cuvette rotates to the sample pipetting
position, the sample disk turns and the sample cup or test tube containing sample is
brought to the sampling position. The sample probe then moves to above the
sample cup or test tube, and descends into it. A liquid level sensor is attached to the
probe, which stops the probe descent when the tip of the probe contacts the surface
of the sample. The necessary volume of sample for analysis is aspirated by the
sample pipetter. The sample probe then moves to above the reaction cuvette at the
sample pipetting position and descends until the probe tip reaches the bottom of the
cuvette, whereby the sample is discharged. Thereafter the probe moves to the probe
rinse bath where its inside and outside are rinsed with deionized water.
(d) 1st reagent addition and stirring
When the reaction cuvette containing discharged sample stops at the 1st reagent
adding position, the reagent pipetting mechanism aspirates the required volume of
reagent. Then the reagent probe moves to above the reaction cuvette and
discharges the reagent. A liquid level sensor is also attached to the reagent probe,
which stops the probe when its tip contacts the surface of the reagent. The
necessary volume of reagent is discharged by the reagent pipetter. After the reagent
discharge, the probe moves to the probe rinse bath where its inside and outside are
rinsed with deionized water. After the 1st reagent addition, the reacting solution is
stirred by the stirring mechanism. And after the stirring, the stirring rod is thoroughly
rinsed with the rinse water.
(e) Photometry
After addition of the 1st reagent, measurement of absorbance of the reacting solution
starts. The absorbance during the reaction is measured at 18-second intervals.
4-2
(f) 2nd and 3rd reagent addition and stirring
About 1.5 minutes later, the 2nd reagent is added to the reaction cuvette, and about
5 minutes later the 3rd reagent is added. As with the 1st reagent addition, the
reagent pipetting mechanism aspirates the reagent and the necessary volume is
discharged into the reaction cuvette from the reagent probe. After discharging each
reagent, the reacting solution is stirred by the stirring mechanism. Note that if the
reagent pipetting volume is not set in the analytical parameters for a certain reagent
(1st to 3rd), the addition and stirring for that reagent will not be made. Also, stirring
without reagent pipetting can be specified as well.
(g) Rinsing
At the completion of analysis, the reacting solution is aspirated and drained and
deionized water is injected into the reaction cuvettes to rinse them out.
(h) Analytical result output
The measured absorbance data undergoes concentration conversion at the data
processor, is output to the printer, transferred online to the host computer and saved
in a floppy disk. Values from which the water blank value is subtracted are used for
the data processing.
4-3
4-4
(3)
Operating Position
Figure 4-3 shows the operating position of each mechanism around the reaction disk.
Reacting solution aspiration
and deionized water injection
Deionized water
aspiration and injection
Cuvette no. at reset
Deionized water
injection for water
blank measurement
For water blank
measurement (1)
For water blank
measurement (2)
For water blank
measurement (3)
Deionized water
aspiration
For water blank
measurement (4)
Light
source
lamp
Rotating
direction
Stirring position
Sample pipetting
position
Reagent adding position
(1st, 2nd, 3rd reagents)
ISE aspirating position
Position no. on reaction disk
Fig. 4-3 Operating Position of Each Mechanism around the Reaction Disk
4-5
4-6
5. ISE
5.1
Functional Specifications of Model 902 ISE . ............................................. 5-1
5.2
Outline of ISE Unit...................................................................................... 5-2
5.3
Configuration of ISE Hardware................................................................... 5-5
5.4
ISE Measurement Sequence ..................................................................... 5-6
5.5
ISE A/D Conversion ................................................................................... 5-8
5.6
Flow Path Diagram................................................................................. See section 3.
5.7
Time Chart ................................................................................................. 5-9
5.8
Cross Wiring Reference ............................................................................. See section 11.
5.9
Circuit Diagrams........................................................................................ See section 12.
5-0
5. ISE
5.1
Functional Specifications of Model 902 ISE
Item
Measurable samples
Specification
Measuring temperature
Throughput
Measurement system
Serum, urine, blood
plasma
35 ± 2°C
Continuous measurement
Dilution to 1/50
Data accuracy
Data reproducibility
Data accuracy
Measuring concentration
range
Serum
Urine
Maintenance
Rinsing operation
Reagent priming
Potential measurement
Sampling
Printout
Upon simultaneous
request for photometry
and ISE
Upon independent request
for ISE
5-1
100 samples/hr max.
Sample volume: 10 µL
Dilution volume: 490 µL
Simultaneous reproducibility:
Serum
CV ≤ 1%
(N = 30)
Urine
CV ≤ 2%
Normal standard serum:
Na, Cl ±1.5 mmol/L
K
±0.1 mmol/L
Na
: 80 to 180 mmol/L
K
: 1.5 to 10 mmol/L
Cl
: 60 to 120 mmol/L
Na, Cl : 10 to 250 mmol/L
K
: 1 to 100 mmol/L
Kind
: Daily
Method : Automatic, pipetting from sample
cup
Internal standard, reference electrode
solution
Measurement of electromotive force of
Na/K/Cl in stand-by status
Priority given to ISE for calibrator, routine
sample and control sample
Data printed out immediately after
calculation
5.2
Outline of ISE Unit
Sample disk
Sample/rinse solution
SIP nozzle
Reaction disk
Sample diluent
Internal
standard
Diluent
Reagent disk
Sipper syringe
Drain
Reference electrode solution
Fig. 5-1 ISE Principle
5-2
(1)
Movement of Reaction Disk (Model 902)
Cell rinse
Reaction disk
Diluent/internal standard
Sample/rinse solution
Reagent nozzle path
ISE aspiration nozzle
The reaction sequence consists of processes carried out while the reaction disk provided
with 48 cells turns one revolution on 48 cycles.
The processes are classified into operation process and measurement process.
Process
Operation
Measurement
Work
Photometry
Sample pipetting
Reagent pipetting/stirring
(R1, R2, R3)
Electrode aspiration
Cell rinse
Cell blank measurement
Reaction monitor photometry
ISE
•
•
Cell Position
•
•
1
18
•
•
•
•
•
7
38 to 47
26
26
For ISE analysis, two cells are required for each sample (one cell for sample and the
other for internal standard solution).
No.
1
2
3
4
5
6
7
8
9
10
11
Operation Sequence
Photometry
S pipetting into cell 1 and R3 pipetting into cell
18
Stirring of cell 18 at same position
12-step feed and R2 pipetting into cell 6
Stirring of cell 6 at same position
5-step feed and R1 pipetting into cell 1
Stirring of cell 1 at same position
Measurement at cell position 26 which passes
optical axis at intervals of 18 sec and data
acquisition
Aspiration of solution at cell position 7 into
electrode after 6-cycle turning
Rinsing of cell after lapse of 10-minute reaction
time at cell position 38 to 47
Feed of cell 48 to S pipetting position
Repetition of no. 1 to 10 on 18-second cycle
5-3
•
•
•
•
•
•
•
ISE
Internal
Sample
Standard
•
•
•
•
•
•
•
•
•
•
•
•
•
(2)
Mechanical Operation when Sample is Short
Condition of
Alarm
Occurrence
Sample
Aspiration
ISE Diluent
Sipper
Aspiration
Data Output
(A)
×
×
×
×
×
(B)
O
O
×
×
O
Internal
Standard
Solution
For details of (A) and (B), refer to the specifications of the sample probe.
(Sample probe alarm occurrence conditions and mechanical operation)
(3)
Error Handling
Upon occurrence of error in ISE hardware, WARNING or STOP alarm is issued.
For the sample already pipetted into the cell, data is not output if an error occurs before
sipper aspiration (because data is not verified).
(4)
Mechanical Operation when Reagent is Short
Reagent Short
*
ISE Diluent
Aspiration
ISE diluent
×*
Internal standard
solution
Internal Standard
Solution Aspiration
O
×*
Sipper Aspiration
Data Output
×
×
×
×
Aspiration/discharge is conducted if a liquid level sensor is provided.
5-4
5.3
Configuration of ISE Hardware
ISE Hardware Configuration
AMP
(G = 1)
Na electrode (Vn)
K electrode (Vk)
Cl electrode (Vc)
Ref electrode (Vr)
Reference voltage (V2)
Reference voltage (V8)
Reference voltage (V0)
AMP
(G = 20)
MPX
AMP AMP
(G = 1) (G = 1)
ADC control
Vout
ADC
DPRAM
Software
Driver
Application
Vos
ADC controller
(1)
The ADC controller converts the analog values of the ISE electrodes and reference
voltages (V2/V8/V0) to digital ones upon receiving an instruction from the application via
the driver and stores the digital values into the DPRAM (dual port RAM). The values are
taken into the application via the driver.
(2)
The application accesses the driver, but does not control the ADC directly.
(3)
ADC input value Vout is as follows.
(a)
When MPX selects Na electrode
Vout = -20 × (Vn - Vr) + Vos [mV]
(b)
When MPX selects K electrode
Vout = -20 × (Vk - Vr) + Vos [mV]
(c)
When MPX selects Cl electrode
Vout = 20 × (Vcl - Vr) + Vos [mV]
(d)
When MPX selects Ref electrode
Vout = -Vr + Vos [mV]
(e)
When MPX selects reference voltage (V2) Vout = 2,000 ± 5 [mV]
(f)
When MPX selects reference voltage (V8) Vout = 8,000 ± 5 [mV]
(g)
When MPX selects reference voltage (V0) Vout =Vos [mV]
NOTES:
1.
2.
3.
The unit is mV.
Each AMP offset voltage is included in Vos.
With the 902, Vos is 110 mV.
5-5
5.4
ISE Measurement Sequence
For the dilution bath in ISE measurement, be sure to use two connected reaction cuvettes.
(1)
Sample Pipetting
S. probe
SMP.
Cuvette no.
Cycle no.
Stop no.
(2)
n+2
11
1
n+1
12
1
Sample pipetting volume: Fixed at 10 µL
n
13
1
Diluent Pipetting + Water + Stirring
S. probe
DIL
SMP.
Cuvette no.
Cycle no.
Stop no.
(3)
n+2
11
3
n+1
12
3
Diluent pipetting volume :
Water
:
n
13
3
Fixed at 308 µL
Fixed at 182 µL
Total 490 µL
Internal Standard Solution Pipetting + Water + Stirring
S. probe
Cuvette no.
Cycle no.
Stop no.
(4)
IS
DIL
SMP.
n+2
12
3
n+1
13
3
Internal standard
solution pipetting volum
Water
:
n
14
3
Sample Aspiration
ISE sipper
Cuvette no.
Cycle no.
Stop no.
IS
DIL
SMP.
n+2
17
1
n+1
18
1
Sample measurement
n
19
1
5-6
: Fixed at 318 µL
Fixed at 182 µL
Total 500 µL
(5)
Internal Standard Solution Aspiration
ISE sipper
DIL
SMP.
Cuvette no. n + 2
Cycle no.
18
Stop no.
1
∗
Internal standard solution measurement
n+1
19
1
n
20
1
Electrode conditioning is carried out when 2 hours or 24 hours have elapsed after ISE
measurement. Two cells are used for the conditioning and internal standard solution is
aspirated.
5-7
5.5
ISE A/D Conversion
(1)
ISE A/D Conversion Timing
10 msec
Na
K
Cl
REF
Na
1
(2)
(3)
K ................................ REF
Na
2
K
Cl
REF
5
(a)
As shown in the above figure, measure the electromotive force 5 times each for Na,
K and Cl in this order.
(b)
The A/D conversion interval time for each is 10 msec.
(c)
ADC alarm is issued if the ADC count, even once, is 0.
ADC Setting Parameters
• Number of integrations :
• Software trigger interval :
8
10 msec
ISE ADC Calibration Timing
10 msec
2V
8V
OFF
(a)
As shown in the above figure, measure the reference voltages
(2 V, 8 V and offset voltage).
(b)
The A/D conversion interval time for each is 10 msec.
(c)
At the time of initialization and T/M resetting, the RESET command is issued for the
ADC controller.
(d)
Number of integrations (1 time) = 8
5-8
5-9
5 - 10
5 - 11
5 - 12
5 - 13
5 - 14
5 - 15
5 - 16
5 - 17
5 - 18
5 - 19
5 - 20
5 - 21
5 - 22
5 - 23
6. SWITCH SETTING
6.1
Short Pins on Mother Board ....................................................................... 6-1
6.2
Setting of DIP Switch on ECPU237 Board ................................................. 6-1
6.3
Setting on DIP Switches on EMOT200 Board ............................................ 6-1
6.4
LOG AMP (P/N 707-5009........................................................................... 6-2
6.5
ISE AMP (P/N 707-5023) ........................................................................... 6-2
6.6
Setting and Function of YD-702D-6539 Short Plugs .................................. 6-3
6-0
6. SWITCH SETTING
6.1
Short Pins on Mother Board
Make sure that the mother board (MVSB100) is provided with short pins.
JP5 and JP10 in the unoccupied slots (2nd and 3rd slots) should be shorted.
6.2
Setting of DIP Switch on ECPU237 Board
Set the DIP switch (8 pins) on the ECPU237 board as follows.
SW 1
2
3
4
5
6
7
8
ON
ON
ON
ON
ON
OFF
ON
OFF
OFF
ON
6.3
1
2
3
4
5
6
7
8
ON
Setting of DIP Switches on EMOT200 Board
The following table shows DIP switch settings on the EMOT200 board.
(1)
SW1
SW No.
Function
1
Photometer wavelength
2
3
4
5
6
7
8
Unused
Unused
Unused
Unused
For serviceman
Alarm release
For debugging
Description
OFF: For domestic use and Asia
ON : For Europe and USA
ON : Test count clear, probe adjust pulse input enabled
ON : Alarm release
ON : Watchdog release
6-1
(2)
SW2
SW No.
1
2
3
4
5
6
7
8
6.4
Function
Description
Sample transfer
External personal computer
Unused
Sample ID
ISE
Unused
Unused
Unused
ON :
ON :
With sample transfer
With external personal computer
ON :
ON :
With sample ID
With ISE
LOG AMP (P/N 707-5009)
SW No.
Type
SW1
Rotary
Setting
Remarks
Selection of main wavelength
O
SW2
Rotary
Selection of sub wavelength
O
SW3
Toggle
Multiplexer (F: manual setting)
C
6.5
C
F
ISE AMP (P/N 707-5023)
SW No.
Type
SW1
Rotary
Setting
Remarks
Address setting
O
6-2
6.6
Setting of YD-702D-6539 Short Plugs
Setting of Drive 1
YD-702D-6539
T1
J2
DS0
T2
DS1
RY
Short plug is not mounted.
IF
DC
Short plug is mounted.
DC2
H2
H4
Setting of Drive 2
YD-702D-6539
T1
J2
DS0
T2
DS1
RY
Short plug is not mounted.
IF
DC
Short plug is mounted.
DC2
H2
H4
6-3
6.6
Setting of YD-702D-6037D Short Plugs
Setting of Drive 1
YD-702D-6037D
RY
T2
J2
DC
T1
DS1
DS0
H4
Short plug is not mounted.
H2
Short plug is mounted.
IF
Setting of Drive 2
YD-702D-6037D
J2
T2
RY
DC
T1
DS1
DS0
H4
Short plug is not mounted.
H2
Short plug is mounted.
IF
6-4
Function of Each Short Plug
Designation
of Short Pin
IF
T1
T2
H2
H4
Function
Selection of how to change recording capacity mode
IF T1
T2
Function
O
O
O 2 modes (2.0/1.0 MB)
Automatic changeover with inserted disk
2.0 MB : When HD disk is used
1.0 MB : When DD disk is used
S
S
O 2 modes (2.0/1.0 MB)
Changeover with MODE SELECT signal
2.0 MB : When MODE SELECT signal is "HIGH"
1.0 MB : When MODE SELECT signal is "LOW"
S
S
S
2 modes (2.0/1.0 MB)
Changeover with MODE SELECT signal
2.0 MB : When MODE SELECT signal is "LOW"
1.0 MB : When MODE SELECT signal is "HIGH"
S
O
O 3 modes (2.0/1.6/1.0 MB)
Changeover with inserted disk plus MODE SELECT signal
2.0 MB : When HD disk is used and MODE SELECT
signal is "HIGH"
1.6 MB : When HD disk is used and MODE SELECT
signal is "LOW"
1.0 MB : When DD disk is used regardless of MODE
SELECT signal
S
O
S
3 modes (2.0/1.6/1.0 MB)
Changeover with inserted disk plus MODE SELECT signal
2.0 MB : When HD disk is used and MODE SELECT
signal is "LOW"
1.6 MB : When HD disk is used and MODE SELECT
signal is "HIGH"
1.0 MB : When DD disk is used regardless of MODE
SELECT signal
O
O
S
2 modes (1.6/1.0 MB)
Automatic changeover with inserted disk
1.6 MB : When HD disk is used
1.0 MB : When DD disk is used
Note: The recording capacity mode is changed over with the logic level ("H"/"L") of
MODE SELECT signal.
Selection of HIGH DENSITY signal output pin
H2 H4
Function
S
O Output to J1-2 pin
O
S
Output to J1-4 pin
O
O Not output (open)
6-5
(cont'd)
Designation
of Short Pin
DC
RY
DS0, 1
Function
Selection of J1-3, 4 pin output signal function
DC RY
Function
O
S
Output of READY signal
S
O Output of DISK CHANGE signal
O
O Open
Drive selection
Function of short plug S: Shorted, O: Opened
6-6
7. EXPLANATION OF FUNCTIONS
7.1
Timing Charts.............................................................................................7-2
7.1.1 Routine Analysis plus Wash ...........................................................7-2
7.1.2 Reset ..............................................................................................7-3
7.1.3 T/M Cell Blank Measurement ..........................................................7-4
7.1.4 Air Purge.........................................................................................7-5
7.1.5 Probe Adjustment ...........................................................................7-6
7.1.6 Operation ........................................................................................7-7
7.1.7 Wash ..............................................................................................7-10
7.1.8 Photometer Check ..........................................................................7-11
7.1.9 Water Exchange .............................................................................7-12
7.2
Measurement
........................................................................................7-13
7.2.1 ADC Timing.....................................................................................7-14
7.2.2 Configuration of Photometry ADC Hardware ..................................7-15
7.2.3 Configuration of Temperature ADC Hardware ................................7-16
7.2.4 Temperature Measurement Data Flow............................................7-17
7.3
Outline of Function.....................................................................................7-20
7.3.1
Status Transition (routine/easy analysis) ......................................7-21
7.3.2
Scheduling when Sample is Insufficient .......................................7-25
7.3.3
Calculation of Measurement End Time (bath processing) ............7-25
7.4
Instrument Status .......................................................................................7-27
7.4.1
Initialize Status .............................................................................7-27
7.4.2
Reset Status .................................................................................7-28
7.4.3
Standby Status .............................................................................7-29
7.4.4
Operation (reaction disk) ..............................................................7-30
7.5
Maintenance Functions ..............................................................................7-35
7.5.1
Reset ............................................................................................7-35
7.5.2
Wash ............................................................................................7-36
7.5.3
Mechanism Check ........................................................................7-37
7.5.4
Air Purge.......................................................................................7-41
7.5.5
Incubator Water Exchange ...........................................................7-42
7.5.6
Cell Blank .....................................................................................7-44
7.5.7
Photometer Check ........................................................................7-45
7.6
Screen Transition .......................................................................................7-47
7.6.1
Screen Configuration of Model 902 Automatic Analyzer ..............7-47
7.6.2
Screen Transition Diagram ...........................................................7-48
7-0
7. EXPLANATION OF FUNCTION
7-1
7-2
7-3
7.1.3 T/M Cell Blank Measurement Time Chart
5 to 52
cycles
18.5 cell
feed
1 to 52
cycles
: PCP check
30.5 cell
feed
1-cell
shift
Reaction
disk
Cell rinse High/low- Cell Cell
mechanism concentra- rinse blank
tion
SV11 SV10
vacuum
waste
solution
SV14
7-4
Wash
SV9
Highconcentr
ation
water
drain
SV13
Reaction
disk
Lowconcentr
ation
water
drain
SV12
7-5
7-6
7.1.6 Operation
(1)
Operation (sample probe)
1. Function
• To discharge sample into reaction cell (photometry and ISE assays)
• To discharge rinse water into reaction cell
2. Sample probe status transition
X(µ1)
NOTES:
1.
When STD (1) POS#99 is specified in analytical parameters .
2.
Sample pipettiing
volume
conpensation
:
Actual pipetting volume "yµL" versus value input from screen "xµL" is calculated via following formula.
3.
One addional pulse is applied for sample aspiration and discharge .
7-7
20.0 to 15.5
y(µ1)
x
15.6 to 25.5
1.04788 × -0.7109
25.6 to 50.0
1.03160 × -0.2479
(2)
Operation (reagent probe)
1.
Reagent probe status transition
7-8
(3) Operation (photometry/ISE measuremment sequence)
7-9
7 - 10
7.1.8 Photometer Check
7 - 11
7.1.9 Water Exchange
Incubator Water Exchange
7 - 12
7.2 Measurement
(1)
Forty-nine cells are measured in each cycle.
(2)
Thirty-nine measurements (4 cell blank measurements, 35 sample absorbance
measurements) are made in each cycle.
(3)
In case of at least one ADC failure in thirty-nine measurements, data is 0 and ADC alarm
is added.
(4)
ADC
(a)
Time: Refer to the description of ADC parameters.
(b)
Calibration equation ×100,000 =
16667 63338B − 25000A
X
B− A
B− A
ABS in terms of 10 mm cell
(measured with 6 mm cell)
A = Calibrated ADC count for 2 V voltage
B = Calibrated ADC count for 6 V voltage
C = Measured ADC count
(c)
Immediately after calibration, subtraction is made atB initialization, resetting upon
operation start and T/M resetting. Note, however, that data at initialization is
discarded.
At this time, ADC CALIB alarm is issued if A or B is out of the range given below.
7546 ≤ A ≤ 8341
22640 ≥ B ≥ 25023
(d)
Number of conversion bits: 16 bits
(e)
The RESET command is issued to the ADC controller at initialization and T/M
resetting.
7 - 13
7.2.1 ADC Timing
1
2
3
4
5
6
7
8
9
10
11
12
S
8.7
R
9.1
S
7.8
9.2
13.0
13 14 15
16
17
18
S
R
3.2
Photometry
ADC
2.9
5.1
5.3
13.3
S R
12.5
12.2
ISE ADC
0.3 2.7
Temperature
ADC
S : Start
R : Read
7 - 14
12.8
12.7
R
18.0
18.0
7.2.2 Configuration of Photometry ADC Hardware
Configuration of Photometry ADC Hardware
LOG AMP
output (for 12
wavelengths)
Reference
voltage 2 V
Reference
voltage 6 V
MPX
Buffer amplifier ADC controller
ADC
DPRAM
Driver
(software)
Application
(software)
ADC control
(1)
The ADC controller converts the analog values of the LOG AMP output voltage, reference
voltage 2 V and reference voltage 6 V to the digital ones upon receiving the instruction
from the application via the driver and stores the digital values into the DPRAM.
The values are taken in the application via the driver.
(2)
The application accesses to the driver, but does not control the ADC directly.
ADC Setting Parameters
• Integration = 32 times
• Hardware trigger time-out = 150 msec
• Software trigger interval = 30 msec
7 - 15
7.2.3 Configuration of Temperature ADC Hardware
Configuration of Temperature ADC Hardware
Amplifier
Thermal sensor
(feeler)
MPX
Buffer amplifier
ADC controller
ADC
Reference voltage 2 V
DPRAM
ADC control
Reference voltage 6 V
Driver
(software)
Application
(software)
(1)
The ADC controller converts the analog values of the temperature sensor, reference
voltage 2 V and reference voltage 6 V to the digital ones upon receiving the instruction
from the application via the driver and stores the digital values into the DPRAM.
The values are taken in the application via the driver.
(2)
The application accesses to the driver, but does not control the ADC directly.
ADC Setting Parameters
• Integration = 32 times
• Software trigger interval = 30 msec
7 - 16
7.2.4 Temperature Measurement Data Flow
Temperature Measurement Data Flow
(relative) d
ULONG
0
4
0 2 V counter value
UCOUNT
Error
information
0
2
8
6 V counter value
Error
information
Measurement 16
1st counter value
for incubator
Error
information
24 2nd counter value
for incubator
32 3rd counter value
for incubator
40 4th counter value
for incubator
FLOAT
0
Average incubator
temperature in cycle 1
Average of 4
calculated
4
Average incubator
temperature in cycle 2
temperature
values
8
Average incubator
temeprature in cycle 3
Error
inforamtion
Error
information
Error
information
0→ 1→ 2
Next storage pointer
48
12
56
16
61
20
72
24
A
80
Information at acquisition of each counter value is
set for error information.
(ADC return information)
(1)
(2)
0:
1:
2:
3:
4:
Normal
Reference 2 V counter value abnormal
Reference 6 V counter value abnormal
Time-out (200 msec)
I/O error
(3)
A
0
The average of 4 calculated temperature
values is set to the relevant temperature
storage area indicated by the pointer.
Error InformationData
1) In the event of error in reference 2 V/6 V
measurement, "0" is set for both
temperatures indicated by the pointer.
2) In the event of error in incubator
temperature measurement, "0" is set for
the temperature.
The temperature is "0" unless 3 cycles pass
after initial startup, because all temperatures
are not set.
(unmeasured area)
ULONG
Average incubator
temperature in 3 cycles
4
8
(1)
(2)
(3)
Set the average value in 3 cycles. (value rounded to 1st decimal point and multiplied by 10)
If "0" (error)is acquired at least once for the temperature in cycle 1 to 3, "0" is set for the relevant
temperature. In addition, alarm judgement at occurrence of error is not made.
In the event of error, 0°C is output to the external object.
If Temperature acquisition is made before the lapse of 3 cycles after intial startup, 0°C is output.
7 - 17
Temperature Measurement Sequence
Dummy lead
Reference
2V
changeover
AD START
Lead/
incubator
changeover
AD START
Dummy lead Dummy lead
Lead/
incubator
changeover
AD START
Dummy lead
Lead/
incubator
changeover
AD START
Dummy lead
Lead/
incubator
changeover
Lead/
incubator
changeover
AD START
Dummy lead
Lead
AD START
3 cycles (54000)
Cycle 1
Cycle 2
Cycle 3
Temperature ADC : Required time
400 msec × 6 cycles : 2.4 sec
• Calculation/alarm judgement are made in the past three cycles.
The temperature is judged according to the status and an alarm is output.
The temperature used for judgement is calculated in the following manner.
1. Average of 4 temperature values measured in a single cycle
2. Average temperature in 3 cycles
3. Alarm judgement by value rounded to 1st decimal point and multiplied by 10
(1)
MPX Data
No.
1
2
3
(2)
Item
Reference voltage (2 V)
Incubator temeprature
Reference voltage (6 V)
MPX Data
6
5
7
Temperature Calculation Formula
1) Incubator Temperature (Pt feeler)
T = 29.0 × (Y - A)/(B - A) + 7.96
T:
Y:
A:
B:
Incubator temperature (°C)
ADC count value at measurement
Count value for reference voltage (2 V)
Count value for reference voltage (6 V)
NOTE: The interrupt register is 100 msec before A/D start.
7 - 18
(3)
Alarm Specifications
Item
Abnormal control
Out of control
Count value for reference voltage (2 V)
Count value for reference voltage (6 V)
ADC time-out
Range
| T - 37.0 | > 0.5 (*1)
T > 45.0 (heater off)
100 msec or more
*1: Supervised only during preparation, operation and sampling stop.
The others are supervised in all statues.
7 - 19
7 - 20
7.3.1 Status Transition (routine/easy analysis
7 - 21
7 - 22
7.3.1 Status Transition (easy analysis mode)
7 - 23
7 - 24
7.3.2 Scheduling when Sample Is Insufficient
(1)
Outline
If insufficient sample alarm is issued three times in succession, channel registration is
stopped for the subsequent tests for the relevant sample and system error is issued for
empty cell. For alarm indicatiton, refer to the alarm specifications.
(2)
Routine Sample
If insufficient sample alarm is issued for three tests in succession, subsequent channel
registration is stopped.
(a) Channel registration is stopped for TS not yet channel-registered (waiting for
channel registration) for the same sample.
(b) Channel registration is not changed when already channel-registered for the same
sample.
(c) Sampling is made as scheduled when CH registration is made for other sample.
(d) The alarm "sample short" is added to the sample for which insufficient sample alarm
is issued.
(3)
Control Sample/Calibration Sample
Channel registration is not stopped even when insufficient sample alarm is issued for
three tests in succession.
(a) The alarm "sample short" is added to the sample for which insufficient sample alarm
is issued.
7.3.3 Calculation of Measurement End Time (batch processing)
(1)
Outline
The expected analysis end time at scheduling timing is calculated and displayed on the
screen upon input of the START key from the standby status.
(2)
Basis for Calculation
The analysis end time is calculated on the basis of (a) and (b) given below.
(a) Calculation conditions
The end time is calculated by taking the samples requested at input of the START
key as samples to be measured. Note that the expected time is calculated only in
sample ID mode, and neither displayed not calculated in host communication mode
and when there is no TS request.
MODE
With ID
Sample no.
HOST
End Time Display
O
×
×
×
O
×
×
O
7 - 25
(b)
Calculation equation
In channel registration to the cell, assignment is made for each test in decreasing
order of analysis time. This means that the test assigned after all the others is not
necessarily output last. Accordingly, the last output test is searched and the
expected end time is calculated from the analysis start time and analysis time for the
test.
Expected analysis end time (min) =
initialization time + start time (Note 1) + analysis time (Note 2) +
wash time required after completion of analysis
NOTES: 1.
2.
3.
Start time: 18.0 (sec) × (number of samples up to last output test [35
samples max.] - 1)
Analysis time: Reaction time for last output test
(any of 10 min, 5 min, 4 min and 3 min)
When carryover evasion is specified:
Example: When (n-2) th analysis is last output test:
1st
(n-3) th
(n-2) th
nth
18.0 (s)
0.0
Analysis end time
Start time = 18.0 (sec) × [(n-2) - 1]
Analysis time = Analysis time for ((n-2) th test)
(3)
Difference from Actual Analysis Time
The expected analysis end time differs from the actual one in the following cases.
(a) When unusable cell was on reaction disk (excluding execution of cell wash)
Case in which an unusable cell was fround on reaction disk through cell blank check
before analysis
(b) Presence/absen ce of test for which carry-over evasion is specified
The processing time changes when wash for carry-over evasion is carried out.
(For details, refer to the description of carry-over evasion.)
(c) Upon occurrence of insufficient sample alarm
(d) Upon occurrence of insufficient reagent alarm
(e) Upon occurrence of error related to analysis such as ID error
(f)
Upon occurrence of error related to instrument
7 - 26
7.4 Instrument Status
7.4.1 Initialize Status
POWER UP processing
24 V ON 1
Mechanism controller initialization 2
Communication port initialization 3
(Note)
Reset 4
Occurrence of
emergency stop error
Incubator water exchange 5
Standby
Emergency stop
NOTE: If any reaction disk alarm is issued during reset, initialization is stopped
and the standby status is established.
(1)
Initialization related to analysis is completed at the end of the above flow.
(2)
For details of each processing in the numbered box in the above flow, refer the table
given below.
(3)
After completion of the processing in box no. 3, instrument monitoring is started
periodically.
Box No.
Details of Processing
1
Waiting for 500 msec after turning on 24 V
2
CPCNT, CMCNT initialization
3
Initialization of communication ports excluding S I/F port (for 6 channels)
4
Refer to the time chart specifications.
5
Same as above
7 - 27
7.4.2 Reset Status
Reset Status
Parameter check
Mechanism reset (1)
Reset of mechanism control information (2)
Operation
(1)
Refer to the description of mechanism reset in the T/M reset flow.
(2)
Mechanism control information includes the following.
1) Sample disk mechanism control information
2) Sample pipetting mechanism control information
3) Reaction disk mechanism control information
4) Cell rinse mechanism control information
5) Cell stirring mechanism control information
6) Reagent disk mechanism control information
7) Reagent pipetting mechanism control information
8) ISE measurement mechanism control information
7 - 28
7.4.3 Standby Status
Each status
Feed pump OFF
Vacuum pump OFF
Wait for
startup of each
processing
(1)
If the water level in the incubator drops, the feed pump and SV4 are turned on for 1
second.
(2)
The incubator pump and light source lamp remain turned on.
(3)
Incubator temperature control is made.
Parameter Check
Standby
Displayed alarm clear
Instrument monitor
Instrument
monitor
Parameter
check
NG
WARNING display
OK
Reset
For details of parameter check, refer to the specifications of data processing functions.
7 - 29
7.4.4 Operation (reaction disk)
Photometer
R1
Reagent
pipetting/stirring
R2
R3
R4
R5
R6
R7
Sample pipetting
ISE sipper
The reaction disk accommodates forty-eight reaction cells.
The reaction disk rotates by one revolution + one cell (= 49 cells) in one cycle (= 18 sec).
The rotation/stop timing in one cycle is as follows.
Stop (1st)
Stop (2nd)
12-cell rotation
Stop (3rd)
5-cell rotation
7 - 30
32-cell rotation
Operation (photometry assay)
• Relationship between 48 Cells Measured in 1 Cycle, Photometric Sequence and 10-minute
Reaction Measurement Sequence
R. Disk Rotation
12-cell Rotation
5-cell Rotation
32-cell Rotation
Measurement
sequence
1 2 3 4 5 6 7 8 9
10 11 12
13 14 15 16 17
18 19 20 21 22 23 24 25 26 27 28 29
30 31 32 33 34 35 36 37 38 39 40 41
42 43 44 45 46 47 48 49
POS # before
measurement
15 16 17 18 19 20
21 22 23 24 25 26
27 28 29 30 31
32 33 34 35 36 37 38 39 40 41 42 43
44 45 46 47 48 1 2 3 4 5 6 7 8 9 10
11 12 13 14 15
POS # after
measurement
14 15 16 17 18 19
20 21 22 23 24 25
26 27 28 29 30
31 32 33 34 35 36 37 38 39 40 41 42
43 44 45 46 47 48 1 2 3 4 5 6 7 8 9
10 11 12 13 14
Photometric
point
E24 E22 E20 E18
E16 E14 E23 E21
E19 E17 E15 E13
E12 E10 E8 E11
E9
E6 E4 E2 R10 R8 CB3 CB1 R6 R4 R2
E35 E53 E31 E29 E27 E25 E7 E5 E3
E1 R9 CB4 CB2 R7 R5 R3 R1 E34
E32 E30 E28 E26
λ1
Wavelength set by analytical parameter
λ2
Explanation of Photometric Point
CB1 to CB4 : Passing cell blank
E1 to E35 : Routine
R1 to R10
Abnormality in measurement causes occurrence of
PHOTOMETER LAMP or other alarm. For details of
alarm, refer to the alarm specifications.
: Invalid data
7 - 31
Operatiton (sample disk)
Sampling position
S. barcode
Crosslink (5 points)
(sample disk stop position at reset)
Outer track :........................................35 positions For routine and stat samples
Inner track : 25 positions ............... For control serum, standard solution, detergent (W1, W2, W3)
(position-free except detergent)
(1)
Definition of Control Variable
Represented by optional position POS # (x, y) on the S. disk.
x: Track variable (1: outer track, 2: inner track)
y: Position variable (1 to 35: outer track, 1 to 25: inner track)
(2)
Rotation Control System
In rotation from POS #1 (x, y) to POS #2 (x', y'), the sample disk stops at position POS2-1
(x'-1, y'-1), is fed 1 pitch (back) and stops the next position (sampling position).
(a) x = x’ fore :
θ (back) ≥ θ (fore)
back :
θ (back) < θ (fore)
(b) x = x' The sample disk rotates in order of POS #N (x, y) → POS #N (n, m) (nearby
intermediary position in direction determined in (1)) → POS #2 (x'-1, y'-1) →
POS #2 (x', y').
The direction of rotation is determined in the same manner as in (1). Note
that the sample disk moves back when POS #N (n, m) is ahead of POS #21 (x'-1, y'-1) in the above direction of rotation.
NOTE:
θ is an angle between the current position and one position before the
destination.
For rotation and stop in one cycle, refer to the following page.
7 - 32
Operation (cell rinse mechanism)
(1)
Function
Reaction cell rinse (wash with water 5 times including cell blank water)
(2)
Status Transition for Cell Rinse
Start
All cells are not empty.
IDLE
Aspiration
R1 to R4, R6, R7
All cells are empty.
All cells are empty.
All cells
contain liquid.
Discharge
All cells have been
washed and no blank
water is discharged.
IDLE
Some cell has not been washed,
blank water is discharged or rinse
tip wash water is discharged.
All cells are empty, all cells have been
washed, no blank water is discharged
and nor rinse tip wash water is
discharged.
(3)
NOTE:
Operation for cells located
under RINSE 1 to 7
Discharge of Cell Blank Water
Cell blank water is discharged in the operation status and sampling stop status. Note,
however, that discharge and measurement are not made in two cycles after start from the
standby status.
(4)
Rinse Tip Wash
The rinse tip (R7) is washed over cycle 3 to 9 immediately after start of operation.
(while cell no. 1 shifts from R3 to R6)
7 - 33
(5)
Rinse Nozzle Arrangement
7 - 34
7.5 Maintenance Functions
7 - 35
7 - 36
7.5.3 Mechanism Check
START
1)
MAINTENANCE
screen
No
Judgement
by operator
Mechanism check
required?
Yes
Input of "Execute"
2)
Mechanism check
Input of "Stop"
3)
Abnormal
Operation check
Normal
Alarm indication
4)
FD (alarm logging)
END
Function
: The reaction disk, sampling system, reagent dispensing system, cell rinse
system, stirring system and ISE system are made to operate the same as in
the operation status.
Required time : Reset 20 sec + mechanism check 18 sec/cycle × X times
Processing
No.
1)
2)
3)
4)
Details of Processing
Start from MAINTENANCE screen
Refer to the following page.
At mechanism check, operation is checked and alarm is
displayed on the instrument monitor screen if operation
is abnormal.
The above alarm is stored in FD.
Remarks: Operation is repeated until the End key is input.
7 - 37
Reference Document
Screen specifications
Screen specifications
Alarm code table
FD specifications
Details of Mechanism Check
7 - 38
11
7 - 39
00
7 - 40
7 - 41
7.5.5 Incubator Water Exchange
Incubator Water Exchange
START
1)
MAINTENANCE screen
No
Judgement by
operator
Wafer exchange
required
Input "Start"
2)
Wafer exchange
Operation check
normal
3)
No
Alarm indication
4)
FD (alarm logging)
END
Function
: Incubator water is exchanged twice and Hitergent is injected.
Required time : 210 sec
Processing
No.
1)
2)
3) 4)
Remarks:
Details of Processing
Start from MAINTENANCE screen
Refer to the following page.
At water exchange, operation check is conducted and alarm
is displayed if operation is abnormal.
The alarm is stored in FD.
1.
2.
Reference Document
Screen specifications
Screen specifications
Alarm code table
FD specifications
Incubator water drain
Drain with solenoid valve
Addition of Hitergent
After execution of water exchange, undiluted Hitergent is injected with the reagent
probe into the incubator (550 µL/time × 15 = 8.25 cc).
7 - 42
7 - 43
7.5.6 Cell Blank
START
1)
MAINTENANCE screen
Judgement
by operator
No
Cell blank
measurement
required?
Yes
5)
Input "Start"
2)
Cell blank data
print
Cell blank measurement
Storage of cell
blank data
Data output
FD
3)
Input of "End"
Operation check
Abnormal
Alarm
indication
4)
FD
(alarm logging)
END
Function
: The cell blank value is measured for all cells (48 cells).
Required time : 10 min 24 sec (reset 20 sec + 12 sec/cycle × 52 cycles)
Processing
No.
Details of Processing
1)
2)
3)
Start from MAINTENANCE screen
Refer to the next page.
At cell blank measurement, operation is checked and
alarm is displayed if operation is abnormal.
4)
5)
The above alarm is stored in FD.
Raw abbsorbance values and difference data for all cells
(48 cells) are printed on the report and all raw absorbance
values are saved in FD.
Remarks
7 - 44
Reference Document
Screen specifications
Screen specifications
Alarm code specifications
Report specifications
FD specifications
7.5.7 Photometer Check
START
1)
MAINTENANCE
screen
No
Judgement
by operator
Photometer
check required
Yes
3)
Input of "Execute"
2)
Photometer check
Photometer data
print
Storage of
photometer data
Memory
Data output
4)
Abnormal
Alarm indication
Operation check
Normal
5)
FD
(alarm logging)
END
Function
: Absorbances at 12 wavelengths are measured and output onto the p rinter
together with the previously measured data.
Required time : 1 min 50 sec (reset 20 sec + 18 sec/cycle × 5 cycles)
Processing
No.
1)
2)
3)
4)
5)
Remarks
Details of Processing
Start from MAINTENANCE screen
Refer to the next page.
Absorbances at 12 wavelengths (main/sub) are printed
out together with previous ones stored in CRAM.
The recent result data is stored in CRAM.
At execution of photometer check, operation is checked
and alarm is displayed if operation is abnormal.
The above alarm is stored in FD.
7 - 45
Reference Document
Screen specifications
Photometer report data check
Screen specifications
Alarm code specifications
FD specifications
(1)
Precision Check
(a) Statitical calculation is made for the result data of routine samples.
(b) Specify Precision Check on the MAINTENANCE screen.
(c) Statistical data for a maximum number of samples is calculated. Up to forty tests
including ISE assay are applicable.
(d) The statistical data shown in the following table is output.
Output Statistical Data
Output Format
Data Count (N)
3-digit integral
Maximum value (MAX) 6-digit real number with
sign/decimal point
Minimum value (MIN)
Same as above
Mean value (MEAN)
7-digit real number with
sign/decimal poin
Standard deviation
(SD)
Coefficient of variation
(CV)
(e)
(f)
(g)
(h)
Same as above
6-digit real number with decimal
point
Number of Digits below
Decimal Point
−
According to STD(1) CONC
Same as above
1 digit increased below
decimal point as compared
with STD(1) CONC
Same as above
Fixed at 2 digits
The result data is read from FD.
The result data provided with an alarm is excluded from calculation (also not
counted for N). Note that reference value range over and overflow are excluded
from alarm.
Statistics are not output for unmeasured tests and subsequent tests are placed
close.
When N < 2, statistical calculation is not carried out.
7 - 46
7 - 47
7.6.2 Screen Transition Diagram
Special Remarks:
STAT (emergency) key
Start condition key
Select the next screen if two or more screens
are available.
Returns to the opposite direction of the arrow.
7 - 48
7 - 49
7 - 50
7 - 51
7 - 52
8.
MOTORS, DETECTORS AND FUSES
8.1
Motor List .................................................................................................................8-1
8.2
Detector List
8.3
Fuse List...................................................................................................................8-3
8.3.1
Fuse Arrangement ( AC/CD).......................................................................8-4
8.4
Motor and Detector Position.....................................................................................8-6
8.5
Sensor Logic ............................................................................................................8-7
......................................................................................................8-2
8-0
8. MOTORS, DETECTORS AND FUSES
8.1
No.
Motor List
Mechanism Name
Motor Type
Part No.
Controller
(EMOT200)
1
2
3
4
5
6
7
8
9
10
11
12
13
Reaction disk rotation
Sample disk rotation
Reagent disk rotation
Rinse up/down
Sample arm rotation
Sample arm up/down
Reagent arm rotation
Reagent arm up/down
Stirrer arm rotation
Stirrer arm up/down
ISE sipper arm up/down
Sample syringe
Reagent syringe
PH265M-31-A5
KP56KM1-014
↑
C6360-9212
PX245M-02A
KP56KM1-014
PX245M-02A
KP56KM1-014
PX243M-03A
C6470-9212
PX244M-02A
SM55-4802
↑
713-0266
707-0226
707-0226
707-0937
707-0298
707-0226
707-0298
707-0226
707-0300
707-0936
713-0326
713-0316
713-0316
GPCONT-6
GPCONT-1
GPCONT-2
GPCONT-2
GPCONT-3
GPCONT-3
GPCONT-4
GPCONT-4
GPCONT-5
GPCONT-5
GPCONT-6
GPCONT-7
GPCONT-7
14
15
ISE syringe
Stirring rod rotation
↑
LN12-M421N1B
713-0316
707-0285
GPCONT-8
GMCONT
8-1
Output Buffer (DRV)
SLA7021M
(constant-current drive)
MP4501
(constant-voltage
drive)
HD75452P
8.2
No.
Detector List
Class
1
2
3
4
5
6
7
8
9
10
11
12
13
14
15
16
17
18
19
PCP
PCP
PCP
PCP
PCP
PCP
PCP
PCP
PCP
PCP
Conduction
PCP
PCP
PCP
Conduction
PCP
PCP
PCP
PCP
20
PCP
21
22
23
24
25
26
27
28
29
30
PCP
PCP
PCP
PCP
Float SW
Vacuum SW
Conduction
Conduction
Conduction
Pt feeler
Application
Home position of reaction disk
For reaction disk count
For reaction disk ADC
Home position of S disk
For outer track of S disk
For inner track of S disk
Home position of R disk
For R disk count
Home position of S probe rotation
Upper dead point of S probe
Liquid level sensor for S probe
Abnormal descent of S probe
Home position of R probe rotation
Upper dead point of R probe
Liquid level sensor for R probe
Abnormal descent of R probe
Upper dead point of rinse mechanism
Upper dead point of stirring mechanism
Home position of stirring mechanism
rotation
Stop position of stirring mechanism
rotation
Upper dead point of S syringe
Upper dead point of R s yringe
Upper dead point of ISE syringe
Upper dead point of ISE arm
Water level in water tank
Negative pressure in vacuum chamber
Waste solution level in vacuum chamber
Water level in incubation bath
Waste solution full
For control of temperature in incubation
bath
8-2
Type
Detection
Part No.
P1144-03
(37365204)
(37365204)
GP1A34
↑
↑
↑
↑
P1144
GP1A34
EE-SX405
P1144
GP1A34
EE-SX405
GP1A34
↑
↑
Dark
Bright
Bright
Dark
Bright
Bright
Dark
Bright
Dark
Dark
Dark
Dark
Dark
Dark
Dark
Dark
Bright
713-4142
713-4143
713-4143
J339165
↑
↑
↑
↑
707-0426
J339165
707-5041
↑
707-0426
J339165
707-5041
↑
J339165
↑
↑
↑
Bright
↑
GP1A04
GP1A04
GP1A04
GP1A34
Dark
Dark
Dark
Dark
713-0315
713-0315
713-0315
J339165
713-0319
713-0312
713-0318
714-4043
714-0391
717-0242
8.3
Fuse List
Listed below are the fuses used in the instrument.
For replacement, insert a fuse having the specified rating.
(1)
(2)
Fuses on ACDIST Board (rear right side)
Fuse No.
Fuse Type
Rating (A)
F1
F2
F3
F4
F5
F6
P430H
P475H
P450H
P450H
P430H
P413H
3
7.5
5
5
3
1.3
Connected Load
Power source for power operation relay
Cooling unit
DC power unit (5 V, 24 V, 12 V)
Heater, pump
For BMC
For BM
Fuses on DRV Board (front right side)
• 5 V Power Circuit
Fuse No.
Fuse Type
Rating (A)
Connected Load
F1
F2
F3
LM 50
LM 50
LM 50
5
5
5
F4
LM 50
5
ECPU237 board
EMIO100 board, LOG AMP board, ISE AMP board
DI board, DRV board, EMOT100 board, PCP in
mechanism
FDD, printer, RSDIST board, LED board, ID reader
Fuse No.
Fuse Type
Rating (A)
Connected Load
F5
LM 32
3.2
F6
LM 32
3.2
F7
LM 32
3.2
F8
LM 32
3.2
F9
F10
LM 32
LM 32
3.2
3.2
Stepping motor for reaction/sample/reagent table
rotation and rinse up/down
Stepping motor for sample arm and reagent arm
up/down and rotation
Stepping motor for stirrer arm up/down and rotation
and ISE sipper arm up/down
Stepping motor for sample/reagent/ISE syringe
up/down, SV1 to 3, SV16
SV4 to 15, SV17 to 19
Display panel, printer, RSDIST board
8-3
8.3.1 Fuse Arrangement (AC/DC)
(1)
AC Fuses (on ACDIST board)
F2
F3
F4
(190)
F1
(150)
8-4
F5
(2)
DC Fuses (on DRV board)
F4
F3
F2
F1
(230)
F10
F5
F6
(390)
F7
F8
F9
8-5
8-6
8.5
Sensor Logic
Unit Name
Sample arm
up/down
Function
Sensor
Condition upon Detection
Output Signal
Inversion
on DI
Board
Detection of liquid
level
Resistor type
ON when liquid level is
detected
H
Inverted
Upper dead point
PC SHARP
Dark when at upper dead
point
H
Inverted
Abnormal descent
PC OMRON
Dark upon collision
H
Inverted
Sample arm
rotation
HP, cell position
PC HAMA
PHOTO
Dark when at HP
L
Reaction disk
rotation
HP
PC HAMA
PHOTO
Dark when at HP
L
Cell count
PC HAMA
PHOTO
Counting of dark → bright
H when counted
ADC start
PC HAMA
PHOTO
ADC start when dark →
bright
H when started
Inverted
HP
PC SHARP
Dark when at HP
H
Inverted
Stop position on
outer/
inner track
PC SHARP
Bright when at stop position
L
PC SHARP
Bright when at stop position
L
Sample disk
rotation
Stop position on
intermediate track
Reagent disk
rotation
HP
PC SHARP
Dark when at HP
H
Inverted
Stop position count
PC SHARP
Counting of dark → bright
L when counted
Syringe
Upper dead point
PC HAMA
PHOTO
Dark when at upper dead
point
L
Stirrer
up/down
Upper dead point
PC SHARP
Dark when at upper dead
point
H
Inverted
Stirrer arm
rotation
HP
PC SHARP
Dark when at HP
L
Stop position count
PC SHARP
Counting of dark → bright
L when counted
Rinse
up/down
Upper dead point
PC SHARP
Dark when at upper dead
point
H
Inverted
ISE sipper
arm
Lower dead point
PC SHARP
Dark when at lower dead
point
H
Inverted
Fuse
Detection of blowout
ON → OFF
ON when blown out
L
+5 V
Detection of
abnormality in voltage
Comparator
L upon voltage drop
L
×
+12 V
Detection of
abnormality in voltage
Comparator
L upon voltage drop
L
×
-15 V
Detection of
abnormality in voltage
Comparator
H upon voltage drop
L
×
+15 V
Detection of
abnormality in voltage
Comparator
L upon voltage drop
L
×
+24 V
Detection of
abnormality in voltage
Comparator
L upon voltage drop
L
×
Float SW
Upper limit
Lead SW
OFF when full
H
Inverted
Lower limit
Lead SW
ON when lowered
L
Inverted
Vacuum
Vacuum degree
ON - OFF
ON when deteriorated
L
Water level in
vacuum
chamber
Presence/absence of
water
ON - OFF
ON when present
L
8-7
(cont’d)
Unit Name
Function
Sensor
Condition upon Detection
Output Signal
Inversion
on DI
Board
Water level in
incubation
bath
Presence/absence of
water
ON - OFF
OFF when absent
H
Inverted
Waste
solution level
Detection of filled
condition
ON - OFF
ON when full
L
Operation
SW
ON-OFF detection
ON when energized
L
Inverted
8-8
9. Analytical Methods
9.1
Analytical Method Table ...........................................................................................9-1
9.2
Types of Calibration .................................................................................................9-4
9.2.1
Description of Model 902 Polygonal Line Calibration .................................9-7
9.3
Photometry Assay Concentration Calculation ..........................................................9-9
9.3.1
Dual-Wavelength Compensation................................................................9-10
9.3.2
Cell Blank Compensation ...........................................................................9-11
9.4
Electrolyte Concentration Calculation.......................................................................9-12
9-0
9. ANALYTICAL MEHOTDS
9.1 Analytical Method Table
Table 9-1 lists the analytical methods.
No.
(1)
Analytical Method
1-POINT
Photometric Point Setting Condition
on Chemistry Parameters Screen
l -0 -0 -0
Table 9-1 Analytical Methods of Model 902
Minimum Necessary Total
Liquid Volume (mL)
Cell Blank Value
C 1 + C2 + C 3 + C 4
(S + V) ≥ 180
1 ≤ l ≤ 35
(2)
(3)
1-POINT (with
prozone check)
l -m -0 -0
2-POINT RATE
l -m -0 -0
4
C 1 + C2 + C 3 + C 4
(S + V) ≥ 180
1 ≤ l < m≤35
4
C 1 + C2 + C 3 + C 4
(S + V) ≥ 180
1 ≤ l < m≤35
(4)
2-POINT END (with
prozone check)
l -m -n -p
4
C 1 + C2 + C 3 + C 4
(S + V) ≥ 180
1 ≤ l < n < p < m≤35
4
p < m ≤ 35
(5)
(6)
3POINT
1POINT
RATE
First-half
test A
l -0 -0 -0
Secondhalf test B
m -n -0 -0
First-half
test A
l -0 -0 -0
Secondhalf test B
m -n -p -q
1 ≤ l ≤ m < n≤35
2
1 ≤ l ≤ m < n≤35
(S + V1) ≥ 180
1 ≤ m < n < l < p < q≤35
A l + A l− 1
2
A l + A l− 1
2
PC =
Am + Am− 1 Al + Al− 1
−k
2
2
A m + A m − 1 A l + A l− 1
−
2
2
t
A m + A m− 1
A + A l− 1
− k l
2
2
C 3 + C4
2
A n + A n− 1
A + A m− 1
− k m
2
2
C1 + C2
A l + A l− 1
2
2
1 ≤ m < n < l < p < q≤35
Remarks
A
m' + A n
P C = m '− n
Ap − An
p − n
A l + A l− 1
2
C1 + C2
(S + V1) ≥ 180
Calculated Absorbance
C 3 + C4
2
∆A p•q − k∆A m•n
C 1 + C2 + C 3 + C 4
∆A l•m
Sample blank
compensable
∆A l•m
Sample blank
compensable
m + 2 < n, p + 2 < q
(7)
RATE-A
l-m-0-0
(S + V1) ≥ 180
1 ≤ l < m≤ 35; l + 2 < m
(8)
RATE-A (with serum
index measurement)
l-m-0-0
4
(S + V1) ≥ 180
C1 : For routine
analysis
5 ≤ l < m≤ 35; l + 2 < m
9-1
C2 :
For 660/700 nm
C3 :
For 570/600 nm
C4 :
For 480/505 nm
× 100
Analytical Method
No.
(9)
RATEB
(a)
Mode
1
First-half test A
Photometric Point Setting Condition
on Chemistry Parameters Screen
Minimum Necessary
Total Liquid Volume (µ
µ L)
(S + V1) ≥ 180
l -m -0 -0
3 ≤ l < m < n < p≤35
Cell Blank Value
C1 + C2
Calculated
Absorbance
Remarks
∆A l•m
2
l+2<m
Second-half
test B
C 3 + C4
2
n -p -0 -0
3 ≤ l < m < n < p≤35
∆A n•p
When wavelength is
different from that in
first-half test
∆A n•p − k∆A l•m When wavelength is
n+2<p
different from that in
first-half test
(b)
Mode
2
First-half test A
(S + V1) ≥ 180
l -m -0 -0
3 ≤ l < m < n < p < q < r≤35
C1 + C2
∆A l•m
2
l+2<m
Second-half
test B
n -p -q -r
3 ≤ l < m < n < p < q < r≤35
C 3 + C4
2
∆A q•r − k∆A n•p
n + 2 < p, p + 2 < q
(Legend)
l, m, n, p, q, r
S
V1, V2, V3
V
C1 to C4
Ax
∆A x•y
t
k
:
:
:
:
:
:
:
Photometric points
Sample volume
Each set volume of reagents 1, 2 and 3
Total volume of reagents added
Passed cell blanks
Absorbance at photometric point x (*)
Absorbance change rate per minute between photometric points x and y as obtained by least squares method
: Time (minute) between photometric points l and m
: Liquid volume compensation factor
S + Va
k=
S + Vb
Va, Vb : Total volume of reagent added up to photometric point a or b
4
NOTE* : The absorbance value indicated or output by the instrument is the one obtained by multiplication with 10 and
compensation
with
the
cell
blank
value
corresponding
to
each
analytical
method.
For calculation, the indicated or output value should be multiplied by 10-4.
9-2
Examples of Reaction Time Course
2-point assay (with prozone check)
1-point assay (with prozone check)
3-point twin test assay
2-point rate assay
1-point rate twin test assay
Rate assay (with serum index measurement)
Rate-B twin test assay (mode 1)
Rate-B twin test assay (mode 2)
Fig. 9-1 Examples of Reaction Time Course
9-3
1
9-4
1
9-5
1
9-6
9.2.1 Description of Model 902 Polygonal Line Calibration
[Formula of calibration curve]
Cx = K(X - B) + C1
(1)
When CALIB. POINT = 1
(a)
(2)
R. B. (Reagent Blank)
Updating of S1ABS: S1ABS = (X1(1) + X1(2))/2 (unit: 10-4 Abs)
When CALIB. POINT = 3 to 6
(a)
R. B. (Reagent Blank)
Same as in 1-point polygonal line calibration
(b)
Full
Updating of S1ABS: Same as in R.B.
Updating of K factor (unit: 10-4 Abs)
K1 =
K2 =
K3 =
K4 =
K5 =
C2−
X2−
C3−
X3−
C4 −
X4 −
C5−
X5−
C6−
X6−
C1
× 10-4
X1
C2
× 10-4
X2
C3
× 10-4
X3
C4
× 10-4
X4
C5
× 10-4
X5
For output, K1 to K5 values in the above equations are multiplied by the correction
factor which is obtained from the number of digits below the decimal point of STD
(1) concentration (set on the chemistry parameter screen).
Number of Fractional
Digits of STD (1)
Correction Factor
0
1
1
10-1
2
10-2
3
10-3
For X1, the previous X1 value (S1ABS of CALIBRATION LIST) is used.
9-7
[Alarm check]
1.
Checks of S1ABS, Dup, STD, SENS and CALIB. ??? are performed.
2.
If the result of calibration is not monotone increasing or monotone decreasing (in the case
shown in Fig. 1), the alarm "calculation disabled" is indicated.
This alarm is also indicated if absorbance is the same between different standard numbers
(see Fig. 2).
Fig. 1
Fig. 2
Concentration Calculation in Polygonal-Line Calibration
1.
Concentration is calculated in the test whose CALIB. TYPE on the chemistry parameter
screen is polygonal line.
2.
Processing flow
Chemistry
parameters
Absorbance or
absorbance
change rate
(2)
S1ABS
Instrument
constant
STD (1) CONC
K
Concentration
(1)
(1)
K value is calculated.
Among the data of calibration K1 to K5, the relevant K value is calculated.
9-8
9.3
Photometry Assay Concentration Calculation
This calculation is exemplified below on ALB.
Assume that standard solution 1 (reagent blank) and standard solution 2 have concentrations of
0.0 g/dL and 5.3 g/dL, respectively.
Calculation of S1ABS (absorbance of standard solution 1 × 10⁴)
S1ABS =
448 + 445
= 446.5
2
Rounding off
447
"447" is indicated on the monitor menu 2 screen.
Calculation of K factor
K=
C 2 − C1
A2 − B
C2
C1
A2
B
:
:
:
:
Concentration of standard solution 2
Concentration of standard solution 1
Printed absorbance of standard solution 2 × 10⁻⁴
Printed absorbance of standard solution 1 × 10⁻⁴
In the calculation of K value, each concentration value is rewritten into the integral part and
exponential part, and calculation is carried out while ignoring the fractional digits (and the
exponential part). The number of fractional digits is counted with reference to the concentration
value of standard solution 1. Therefore, 0.0 is rewritten into 0 × 10-1, and 5.3 into 53 × 10-1, and
values 0 and 53 are used for calculation.
The value 202 obtained by calculation is indicated on the monitor menu 2 screen.
K=
53 − 0
3050 + 3097 448 + 445
−4
×10
−
2
2
=
53
= 202
(3074 − 447)×10 − 4
9-9
Calculation of Sample Concentration
Given below is an example where the measured absorbance of a sample is 0.1637.
Cx = {K •(Ax - B) + C1} •1FA + IFB
Cx :
Concentration of sample
K :
Calibration factor
Ax :
Absorbance of sample
C1 :
Concentration of standard solution 1
B :
Absorbance of standard solution 1 (S1ABS)
IFA :
Instrument constant A (assumed to be 1.0)
IFB :
Instrument constant B (assumed to be 0.0)
Cx = [ {202 •(0.1637 - 0.0447) + 0.0 } •1.0 + 0 ] × 10-1 = 2.39 → 2.4
In the above formula, the result of calculation is multiplied by the exponential part (10-1), which
was ignored in the calculation of K value and the product is rounded off to match scaling. Thus,
the final Cx value is 2.4.
9 - 10
1
9 - 11
9.3.2 Cell Blank Compensation
Raw absorbance
at main
wavelength
Raw absorbance
at sub wavelength
1 to 35 max.
1 to 35 max.
Cell blank
compensation
Calculation of
cell blank value
Raw absorbance of
cell blank at main
wavelength
1 to 4
Cell blank
compensation
Calculation of
cell blank value
Raw absorbance of
cell blank at sub
wavelength
1 to 4
Raw absorbance at
main wavelength
after cell blank
compensation
1 to 35 max.
Raw abosrbance at
sub wavelength
after cell blank
compensation
1 to 35 max.
<Supplementary explanation>
The cell blank calculation method (Note) and compensated points vary with analytical method.
For details, refer to the classification of analytical methods.
NOTE: If an alarm is indicated for any of cell blanks 1 to 4, the following table will be used.
Number of
Alarms
1
2
Cell Blank Value
Mean value of 2 data without alarm
(C
1
+ C 2 + C 3 + C4 )
Data Alarm
(cell blank abnormal)
Not indicated
Indicated
4
3
(C
1
+ C 2 + C 3 + C4 )
4
9 - 12
Indicated
9.4
Electrolyte Concentration Calculation
An example of Na calculation with use of the printout example on the previous page is
described here.
Calculation of SL (slope value)
E H − EL
C
log H
CL
− 32.0 − (39.6)
=
160
log
120
= 60.8
SL =
SL
EH
EL
CH
CL
:
:
:
:
:
Slope value
Electromotive force of HIGH solution (32.0)
Electromotive force of LOW solution (-39.6)
Concentration of HIGH solution (160.0)
Concentration of LOW solution (120.0)
Concentration calculation of internal standard solution
EIS − E L
CIS = CL ×10
SL
= 120.0 ×10
− 35. 4 − ( − 39. 6 )
60. 8
= 140.7
CIS :
EIS :
Concentration of internal standard solution
Electromotive force of internal standard solution (-35.4)
Calculation of compensation value (C.VALUE)
The difference between the input value and measured value is obtained through measurement
of the Hitachi calibrator having the known concentration.
C.VALUE = Cc - Cx
= 139.0 - 138.9
= 0.1
Cc :
Cx :
Input value (139.0)
Measured value (138.9)
9 - 13
Calculation of sample concentration
An example of calculation is presented here with the electric potential of sample at -35.5 mV.
Cs = C IS ×10
ES − EIS
SL
= 140.7 ×10
− 35. 5 − ( 35. 4 )
60.8
= 140.2
Cs :
Es :
Concentration of sample
Electromotive force of sample
To the Cs value, the compensation value is added and the sum is printed.
C's = Cs + compensation value
= 140.2 + 0.1
= 140.3
C's: Sample concentration after compensation
9 - 14
10. CIRCUIT DIAGRAMS
10.1
Overall Wiring Diagram........................................................................................10-2
10.2
ECPU237 Board (271-3724) ................................................................................10-3
10.3
EMIO100 Board (271-3786).................................................................................10-10
10.4
EMOT200 Board (271-3832) ...............................................................................10-14
10.5
MVSB100 Board (271-3789) ...............................................................................10-17
10.6
DI Board (713-5000) ............................................................................................10-24
10.7
DRV Board (713-5001) ........................................................................................10-31
10.8
ACDIST Board (713-5002)...................................................................................10-43
10.9
RSDIST Board (713-5003)...................................................................................10-45
10.10
LOG AMP Board (707-5009) ...............................................................................10-50
10.11
ISE AMP Board (707-0725) .................................................................................10-52
10.12
E. SENSOR Board (707-5041) ............................................................................10-54
10.13
LED Board (713-5004).........................................................................................10-56
10 - 0
10. CIRCUIT DIAGRAMS
10 - 1
10 - 2
10.2
(1)
ECPU237 Board
Parts Mounting Diagram
Given below is the parts mounting diagram of the ECPU237 board.
P ABORT SW
LED
indication
RESET
SW
RSCN
(for debugging)
MBSICN
(RS232C × 4ch)
AUICN
(for Ethernet)
Self-diagnosis indicator LED
SW1
(boot I/O setting)
Connector for battery
10 - 3
(2)
Explanation of Front Panel
LED
No.
Normal
1
2
Lit
Dimly lit
Name Color
Meaning
RUN Green CPU is running. (in any other state than HALT)
DMA Green I/O assumes bus right according to DMA transfer procedure.
(BBSY on VEM is in assert state.)
INT Green Request for interrupt is made to MPU.
Acces → Lit MBSY Green Memory bus is busy. (Main memory is accessed.)
Lit
FAIL Red CPU double bus halt or WDT time up
Extinguished DIAG Red Flickering : Self-diagnosis error
Lit
: Boot error, self-diagnosis under execution
Extinguished MERR Red Parity error (SRAM or main memory on CPU board)
3
4
5
6
7
Miscellaneous
No.
Name
1
2
3
4
5
RESET
ABORT
RSCN
MBSICN
AUICN
Meaning
Resetting of CPU board and system
NMI to MPU
Debugging monitor port
4-channel serial communication port
Insert AUI connector
10 - 4
(3)
Setting of DIP Switch
The DIP switch on the front panel is divided into operation mode setting part (SW1, 2, 3,
4) which determines operation at startup of the CPU board and program boot I/O setting
part (SW5, 6, 7, 8). This switch setting is reflected on the system status register on the
CPU board and can be read via software.
Explanation of SW1 Bits
Switch No./Bit
SW1 SW2 SW3 SW4
D7
D6
D5
D4
0
0
0
0
0
0
0
0
0
1
0
0
1
1
0
0
1
0
1
0
0
1
0
1
0
0
1
1
1
1
1
1
1
1
1
1
0
0
0
0
1
1
1
1
1
1
0
0
1
1
0
0
1
1
0
1
0
1
0
1
0
1
0
1
Switch No./Bit
SW5 SW6 SW7 SW8
D3
D2
D1
D0
0
0
0
0
0
1
0
1
0
0
1
1
1
0
0
1
0
1
1
1
0
1
1
1
0
1
Operation Mode
Normal processing mode
Reserve
Reserve
Reserve
Continuous processing mode
(memory BRAM)
Continuous processing mode
(EEPROM)
Reserve
Reserve
Reserve
Reserve
Reserve
Reserve
T/M mode 1
T/M mode 2
T/M mode 3
T/M mode 4
Boot I/O
SCSI device (H/D, etc.)
F/D
Reserve
Reserve
Reserve
I/O file ROM
EEPROM
Ethernet
Memory dump with boot I/O
Memory dump with any other
than boot I/O
10 - 5
External View of DIP Switch
10 - 6
RS-232C (1 channel) Connector Signal Table
Ethernet (AUI) Connector Signal Table
RSCN (8850-20)
No.
1
2
3
4
5
6
7
8
A
AUICN
B
No.
TXD
RTS
RXD
CTS
GND
9
10
DTR-N
RS-232C (4 channels) Connector Signal Table
MBCN (8850-34)
No.
A
1
2
3
4
5
6
7
8
9
10
11
12
13
14
15
16
17
TXD 1
RXD 1
RTS 1
CTS 1
TXD2
RXD 2
RTS 2
CTS 2
TXD 3
RXD 3
RTS 3
CTS 3
TXD 4
RXD 4
RTS 4
CTS 4
B
GND
GND
GND
GND
10 - 7
Signal Name
No.
Signal Name
1
2
3
4
5
GND
CI +
DO +
GND
DI +
9
10
11
12
13
CI DO GND
DI + 12 V
6
7
8
GND
GND
GND
14
15
GND
GND
Connector Table
VME Bus Connector Signal Table (J1)
J1/P1 (VME BUS)
No.
A
B
C
1
2
3
4
VD0 - P
VD1 - P
VD2 - P
VD3 - P
BBSY - N
BCLR - N
VACFAIL - N
(BG0 IN - N)
VD8 - P
VD9 - P
VD10 - P
VD11 -P
5
6
7
8
9
VD4 - P
VD5 - P
VD6 - P
VD7 - P
GND
(BG0 OUT - N)
(BG1 IN - N)
(BG1 OUT - N)
(BG2 IN - N)
(BG2 OUT - N)
VD12 - P
VD13 - P
VD14 - P
VD15 - P
GND
10
11
12
13
SYSCLK
GND
DS1 - N
DS0 - N
(BG3 IN - N)
BGOUT 3 - N
(BREQ0 - N)
(BREQ1 - N)
VSYSFAIL - N
BERRON
SYSRESET - N
LWORD - N
14
15
16
17
18
19
20
21
WRITE - N
GND
DTACK - N
GND
AS - N
GND
IACK - N
IACKIN - N
(BREQ2 - N)
BREQ3 - N
AM0 - P
AM1 - P
AM2 - P
AM3 - P
GND
(SERCLK (1))
AM5 - P
VA23 - P
VA22 - P
VA21 - P
VA20 - P
VA19 - P
VA18 - P
VA17 - P
22
23
24
IACKOUT - N
AM4 - P
VA7 - P
(SERDAT (1))
GND
(IRQ7 *)
VA16 - P
VA15 - P
VA14 - P
25
VA6 - P
IRQ6 *
VA13 - P
26
VA5 - P
(IRQ5 *)
VA12 - P
27
VA4 - P
IRQ4 *
VA11 - P
28
VA3 - P
IRQ3 *
VA10 - P
29
VA2-P
(IRQ2 *)
VA9 -P
30
VA1-P
(IRQ1 *)
VA8 - P
31
32
-12 V
+5 V
+5 V STDBY
+5 V
+12 V
+5 V
( ) : VME standard, not used on this board, NC
* : Negative polarity
10 - 8
VME Bus Connector Signal Table (J2)
J2/P2 (VME BUS & F/D)
No.
A
B
C
1
2
3
4
5
6
MODESELECT - N
DS3 - N
DS0 - N
DS2 - N
DIR - N
GND
+5 V
GND
RESERVED
(VA 24)
(VA 25)
(VA 26)
HOLD - N
INDEX - N
DS1 - N
EM0 -N
STEP - N
GND
7
8
9
10
11
WRITEDATA - N
GND
TRK0 - N
READDATA - N
GND
(VA 27)
(VA 28)
(VA 29)
(VA 30)
(VA 31)
WE - N
GND
WPRT - N
SIDE - N
GND
12
13
14
15
16
17
18
READY - N
GND
GND
+5 V
VD16 - P
VD17 - P
VD18 - P
VD19 - P
VD20 - P
19
20
21
22
23
24
25
26
27
28
29
30
31
32
GND
GND
+5 V
+5 V
GND
GND
GND
VD21 - P
VD22 - P
VD23 - P
GND
VD24 - P
VD25 - P
VD26 - P
VD27 - P
VD28 - P
VD29 - P
GND
GND
VD30 - P
VD31 - P
GND
+5 V
+5 V
+5 V
GND
GND
10 - 9
10.3
(1)
EMIO100 Board
Explanation of Circuit Board
This circuit board is connected to the VME bus and has the following functions.
• EEPROM (4 Mbytes)
• 16-bit ADC (4 channels for photometry (main/sub), ISE, temperature)
• Temperature control
• Serial communication (RS-232C × 4 channels)
• Printer control (IPRNT95)
• Buzzer control (programmable oscillator)
(2)
External View
EEPROM
LED
Programmable
oscillator
IPRNT95
VR2
VR1
VR3
VR4
AD converting section
10 - 10
(3)
LED and VR
LED
No.
Name
1
2
INT
BSY1
3
BSY2
4
ERR
5
LED1
6
LED2
7
LED3
Function
Lit upon interrupt request from EMIO100 board.
Extinguished during operation of ADC (channel 1, 3, 4).
Extinguished during operation of ADC (channel 2).
Extinguished when HB command is abnormal.
Not mounted.
Not mounted.
Not mounted.
VR
No.
1
2
3
4
*)
Name
VR1
VR2
VR3
VR4
Function
For ADC (ADS7807) span correction*
For ADC (ADS7807) offset correction*
For adjustment of indicated temperature value
For adjustment of actual temperature in incubation bath
VR1 and VR2 are not adjusted after shipment from the factory.
(already adjusted with exclusive tool)
< Differences from Conventional AD System >
Described below are the differences between the ADC mounted on the EMIO100 board and
the conventional one by comparing with the ADC-V board.
ADC - V
A/D System
Number of ADCs
Number of channels
Data averaging
Double integral type
2 pcs
2 ch
Analog averaging with
integration circuit
10 - 11
EMIO100
Sequential comparison type
1 pc
4 ch (switching type)
Averaging through continuous
measurements and calculation
Conventional
Type
Double integral type A/D ×
6809
Main
wavelength
Analog
part
ROM RAM
Peripheral
circuit
Exclusive
controller
Main
CPU
DPRAM
Sub
wavelength
Operational waveform
Charge Discharge
Reset
10 ms
3.6 ms
Counting of discharge time with counter
EMIO 100
MPX
Main wavelength
Sub wavelength
ISE
Sequential
compariso
n type ADC
Exclusive
controller
(H8/330)
DPRAM
Main
CPU
Temperature
Operational waveform
ADC operation
25 µs
400 µs
Approx. 13 msec (32 times)
The ADC whose conversion rate is 25 µsec is operated at intervals of 400 µsec 32 times and
from the data thus obtained, the maximum and minimum values are deleted.
After that, the average value is calculated and output to the main CPU as a 16-bit A/D value.
In case of simultaneous measurement at two wavelengths, the above operation is conducted
while changing the MPX at intervals of 200 µsec and two 16-bit A/D values separately
calculated in H8 for the main and sub wavelengths are output.
10 - 12
10 - 13
10.4
(1)
EMOT200 Board
Explanation of Circuit Board
The EMOT200 board is a mechanism control board mounting one GMCONT and eight
GPCONTs which are one-chip motor controllers (hereafter referred to as MCU) and
conforming to the VME bus standard. By mounting the MCU to the specified position on
the EMOT200 board, the MODE pin of MCU is set for function selection. Each GPCONT
controls two stepping motors.
The circuit board is provided with the watchdog timer function and when the CPU is
abnormal, all controllers are reset to prevent the mechanism from running out of control.
(2)
Number of Controls
Each GPCONT can control two two-phase stepping motors and accept four interrupt
inputs (limiter inputs) for each motor. Eight MCUs (for 16 motors) are assigned to the
EMOT200 board as exclusive controllers for two-phase stepping motors.
One GMCONT is equal to two conventional MTCONTs. Namely, each GMCONT can
control sixteen D/I's and D/O's. And eight D/O's for which the timer is unprogrammable
are available.
One GMCONT is assigned to the EMOT200 board.
The following table shows the number of controls by the EMOT200 board.
Number of Controls by EMOT200 Board
Designation
Q'ty
GPCONT
2-phase stepping motor output *1
Limiter input
GMCONT
D/O (timer programmable)
D/I
D/O
D/O
CPUDI × 8
DI for DIP SW × 2 *2
Other
*1 Phase output and power save signal
*2 Switch for software setting
10 - 14
16
16 × 4
16
16
8
8 bits
8 × 8 bits
16 bits
(3)
External View
DIP SW2
DIP SW1
LED
GMCONT
GPCONT5
GPCONT1
GPCONT6
GPCONT2
GPCONT7
GPCONT3
GPCONT8
GPCONT4
Explanation of LED
No.
Name
1
LED1 (green)
2
LED2 (green)
Description
Lit upon generation of interrupt from any of GPCONT1 to GPCONT4 and
GMCONT to master CPU.
Lit upon generation of interrupt from any of GPCONT5 to GPCONT8 to
master CPU.
10 - 15
Block Diagram of EMOT200 Board
VME bus
A23-A01
AM5-AM0
IACK_N, LWORD_N
AMCD buffer
Address latch
DS0_N, DS1_N, AS_N,
IACK IN N, WRITE_N,
IACKOUT_N
Control signal
buffer
Reset buffer
Decorder
Reset buffer
Access
controlle
r
H8/Resister/
Flash memory/
Address decoder
D07-D00
RESET_N
Data buffer
SYSRESET
RESET
W.D.T.
Reset
register
W.D.T.
register
Interrupt
controller
Read/write
controller
Vector
register
WE_N OE_N
CPUDI_N
CPUDI
register
GPCNT (H8/330) × 8
GMCNT (H8/330) ×
DI
signal
Motor control
signal
Local bus
10 - 16
Internal
data
bus
10.5 MVSB100 Board
(1)
Explanation of Circuit Board
This circuit board is a mother board which is compatible with the VME bus and has six
slots.
(2)
Arrangement of Circuit Boards
Slot No.
1
2
3
4
5
6
Circuit Board
ECPU 237
Unused
Unused
EMIO100
EMOT200
DI
NOTE: Slot no. 1 is located at the left as
viewed from the front.
10 - 17
(3)
External View
(263)
Connector for FDD
DS supply
connector
(144)
10 - 18
VRT - 250 MVSB100 (1/5)
10 - 19
VRT - 250 MVSB100 (2/5)
10 - 20
VRT - 250 MVSB100 (3/5)
10 - 21
VRT - 250 MVSB100 (4/5)
10 - 22
VRT - 250 MVSB100 (5/5)
10 - 23
10.6 DI Board
(1)
Explanation of Circuit Board
This circuit board is a buffer board for waveform shaping of input signals of sensors
(photo-interrupter, water level sensor, etc.) and has the following functions.
• Reset circuit (SYSRESET/ACFAIL signal supply to VME bus)
• Generation of ADC timing signal for photometry hardware trigger
• DC voltage monitoring (±15 V, 12 V)
• Generation of ±15 V voltage for analog use (DC-DC converter)
(2)
External View
Reset circuit
LED
5V
12 V
+15
V
-15 V
DC-DC
converter
VR1
(for adjustment
of ADC timing)
VR1
(for confirmation
of ADC start signal)
(233.35)
(160)
10 - 24
(3) Reset Circuit
This board supervises the Vcc (+5 V) voltage with the power monitoring IC and generates
a reset sequence signal (ACFAIL/SYSRESET) for the main CPU at power on/off.
Approx. 4.8 V
Approx. 4.65 V
Approx. 4.8 V
Approx. 4.65 V
+5 V
ACFAIL
2 msec min.
23 msec
270 msec
SYSRESET
(4)
Generation of ADC Timing Signal
The output from the photo-interrupter for ADC start set to the reaction disk is connected to
the ADC controller on the EMIO100 board via the delay circuit on this board.
For adjustment of the ADC timing, use the VR1 arranged at the front.
10 - 25
DI Circuit 27135200 (1/5)
10 - 26
DI Circuit 27135200 (2/5)
10 - 27
DI Circuit 27135200 (3/5)
10 - 28
Circuit 271352000 (4/5).
10 - 29
DI Circuit 27135200 (5/5)
10 - 30
10.7
(1)
DRV Board
Explanation of Circuit Board
The DRV board drives the stepping motor at a constant current/voltage and the solenoid
valve. The SSR control signal from the EMOT100 board is connected to the ACDIST
board via this board.
5 V and 24 V DC voltages are supplied to each unit in the instrument from the power unit
via this board.
10 - 31
(2)
External View
10 - 32
10 - 33
10 - 34
10 - 35
10 - 36
10 - 37
10 - 38
10 - 39
10 - 40
10 - 41
10 - 42
10.8
(1)
ACDIST Board (BM, BMC)
Explanation of Circuit Board
This circuit board adapts the AC circuit part at the secondary side of the transformer and
mounts alarm fuses and SSRs.
The board also mounts an AC-DC converter for relay operation because the relay on the
board is used in place of the breaker for operation (turning on/off power supply to other
than cooling unit) which was formerly arranged at the front of the instrument.
(2)
External View
Relay for power on/off
AC-DC converter
(190)
(150)
SSR
10 - 43
10 - 44
10.9
(1)
RSDIST Board
Explanation of Circuit Board
This circuit board interrupts/distributes RS-232C signals of the ECPU237 and EMIO100
boards. The board is provided with the current loop function for the host and permits
changeover through DIP switch setting.
The board is also provided with an alarm buzzer, whose volume can be adjusted with
VR1.
(2)
External View
(115)
(270)
Buzzer volume adjustment
Buzzer
Setting of SW1
No. 1
No. 2 to 4
FG
terminal
OFF: RS-232C
Normally OFF
10 - 45
ON: Current loop
10 - 46
10 - 47
10 - 48
10 - 49
10.10 LOG AMP Board
(1)
Explanation of Circuit Board
This circuit board consists of a multiplexer, output buffer and 12-channel circuit for LOG
conversion of photoelectric current from the detector.
(2)
External View
(110)
(190)
10 - 50
10 - 51
10.11 ISE AMP Board
(1)
Explanation of Circuit Board
This amplifier is intended to amplify the ion selective electrode (ISE) signal. The input
signal includes Na, K, Cl, Ref.
(2)
External View
(75)
(130)
(3)
ISE AMP Board Signal Address
Signal Name
Multiplexer address
SW1 address
ENa
EK
ECI
ERef
E2
E8
7
7
6
6
5
5
4
4
3
3
2
2
< Confirmation of ISE AMP Voltage >
Confirm the voltage between TP1 and TP2.
(a) Select ERef (SW no. 4) with the multiplexer and confirm that the output is 4.69 <
ERef < 5.05.
(b) Select E2 (SW no. 3) with the multiplexer and confirm that the output is 2.00 ±
0.005 V. [adjustment of VR1]
(c) Select E8 (SW no. 2) with the multiplexer and confirm that the output is 8.00 ±
0.005 V. [adjustment of VR2]
10 - 52
10 - 53
10.12 E. SENSOR Board
(1)
Explanation of Circuit Board
This circuit board is a resistor type liquid level sensor which is incorporated in the
sampling arm.
(2)
External View
(100)
Black
(20)
White
Photo-interrupter
(detection of abnormal descent)
10 - 54
E. SENSOR Circuit Diagram
10 - 55
10.13 LED Board
(1)
Explanation of Circuit Board
This circuit board is for alarm indication before S. disk rotation.
(2)
External View
(55)
P/N 713-5004 LED
R1
R2
R3
R4
LED
(20)
CN1 21
(18.6)
(3)
LED Circuit Diagram
LED
8
5
4
1
HLMP 2855
CN1
7
R1
6
R2
3
R3
2
R4
150×4
10 - 56
1
2
11. CROSS WIRING REFERENC
11.1 Overall Wiring Diagramm.........................................................................................11-2
11.2 Cross Wiring Reference ...........................................................................................11-3
11 - 0
11. CROSS WIRING REFERENCE
11 - 1
11 - 2
11 - 3
11 - 4
11 - 5
11 - 6
11 - 7
11 - 8
11 - 9
11 - 10
11 - 11
11 - 12
11 - 13
11 - 14
11 - 15
11 - 16
11 - 17
11 - 18
11 - 19
11 - 20
11 - 21
11 - 22
11 - 23
11 - 24
11 - 25
11 - 26
11 - 27
11 - 28
12. INSTALLATION
12.0
Analyser unit unpack manual.................................................................................12-1
12.1
902 Layout and Installation Conditions ..................................................................12-3
12.2
Check for Quantity .................................................................................................12-6
12.3
Unpacking..............................................................................................................12-6
12.4
Setting of Instrument..............................................................................................12-7
12.5
Wiring and Piping...................................................................................................12-7
12.6
Fixing of Instruments..............................................................................................12-8
12.7
Preparation for Analysis.........................................................................................12-8
12.8
Operation after Turning On Power.........................................................................12-8
12.9
Adjustment and Check of Each Part ......................................................................12-9
12.10 Operation for Completion and Others ....................................................................12-11
12.11 Installation Manual .................................................................................................12-12
12.11.1 Configuration..........................................................................................12-12
12.11.2 Procedure for Installation of Product Program .......................................12-13
12.11.3 Check Items ...........................................................................................12-16
12.11.4 Procedure for Installation of Screen Information (initialization) ..............12-17
12.11.5 Procedure for Initial Setting of LCD Module ...........................................12-18
12 - 0
12. INSTALLATION
12.0
Analyzer unit unpack manual
12 - 1
12 - 2
12.
12.1
INSTALLATION
902 Layout and Installation Conditions
3P receptacle
* Deionized water supply unit
Water drain port
Piping, 5 m long or less
3P grounded receptacle
500 or more
Power cable,
5 m long
720
100 or more
720
1000 or more
300 or more
Fig. 12-1 Instrument Layout
* Available optionally
• Installation Conditions
(1)
(2)
(3)
(4)
(5)
(6)
(7)
(8)
(9)
Instrument size 720 (W) × 720 (D) × 1085 (H)
Approx. 190 kg
100 V AC, 50/60 Hz, 1.5 kVA
3P grounded receptacle
If the receptacle is not grounded, there must be a grounding
terminal near it.
Ambient temperature : 18 to 30°C (within ±2°C variation during measurement)
Ambient humidity
: 20 to 80% RH (non-condensing)
Deionized water
supply unit
: Water pressure 50 - 340 Kpa; 0.5 to 3.5 kgf/cm2
Water drain port
: 50 mm or more in opening diameter, 100 mm or less above floor
Heat dissipation
: 1.3 kcal max.
Space
Weight
Power requirements
Power receptacle
:
:
:
:
12 - 3
Table 12-1
Items to Be Prepared by Customer
Item
Power source
Specifications
Remarks
2P grounded receptacle
For BM
230 V AC, 1.5 kVA, 1.3 kcal
For BMC
3P grounded receptacle
115 V AC, 1.5 kVA, 1.3 kcal
Grounding
3rd class grounding terminal (100 Ω or less with
reference to earth)
Distilled water or
deionized water
Approx. 15 L/hr during operation
Refrigerator
Prepare a refrigerator having the necessary capacity to
store reagents and samples.
Tap water
(a)Water quality
(b)Water pressure
Conductivity
: Dionized / destilled water
2
: 0.5 to 3.5 kgf/cm ; 50 to 340 Kpa
(c)Water temperature : 30°C or less
: Chemical faucet, 1/2"
(approx. 12 mm) in diameter
Drain port
φ10
Faucet size
φ12
(d)Faucet diameter
Prepare a port having a diameter of 50 mm or more
within 5 m of drain port at the rear of the main unit and at
a height of 100 mm or less above the floor.
12 - 4
< 1 µs/cm or
less, germ-free
NOTE: Specifications of Deionized Water Supply Unit for Model 902
Described below are the specifications for connection of the deionized water supply
unit to the Model 902.
Water quality
: Neutral water containing no substances that adversely affect
measurement, such as deionized water and distilled water
Water supply capacity : 20 L/hr
Water pressure :
50-340 Kpa; 0.5-3.5 kgf/cm2; Conductivity < 1 µs/cm or less
Main unit intake
Control signal
Deionized
water supply
unit
germ-free
: Connectable to nipple of 16 mm in diameter and 28 mm in
length
: Water aspiration via 100 V AC contact signal
1
5
100 V AC
902 main unit
Connector (Hirose RM15QPH-8-P)
Wiring/piping
: Within 5 m long
12 - 5
12.2
Check for Quantity
Check each component for quantity referring to the packing list contained in the shipping crate.
12.3
Unpacking
= Cushion
Lower part of reagent dispensing mechanism
Lower part of sampling mechanism
Lower part of stirring mechanism
Fig. 12-2 Analyzer Packed in Shipping Crate
(1)
Unpack the shipping crate, and carefully take out the main unit.
(2)
Remove tapes, ropes and cushions from the main unit as shown in Fig. 12-2.
12 - 6
12.4
Setting of Instrument
(1)
Set the S. disk.
(2)
Set the R. disk.
(3)
Set a bottle (50 mL) containing undiluted Hitergent solution to channel 40 of the R. disk.
(4)
Set the roll paper to the printer.
(5)
Set the FD. (drive 1: Parameter Disk, drive 2: Data Disk)
(6)
Connect the signal cable leading from the deionized water supply unit.
12.5
Wiring and Piping
(1)
Measure the voltage of the power equipment prepared by the customer.
(2)
Plug the power cable into the main unit, and fasten the cable with the cable fixture.
(3)
Connect the power plug to the power equipment prepared by the customer.
(4)
Attach the filter case to the water supply port and push in the water supply tube. Cut the
tube according to the distance to the deionized water supply unit, and push the tube into
the water supply port of the deionized water supply unit. Fasten the tube with hose
bands.
(5)
Connect the pipe joint to the low-concentration water drain port. Cut the drain tube
according to the distance between the instrument and the drain port prepared by the
customer, and connect the tube. The tube should be fastened with hose bands and the
pipe joint with the pipe retainer.
(6)
Attach the nipple to the high-concentration water drain port, push in the waste solution
tube and fasten it with the binder. Put the waste solution tube and waste solution sensor
in the waste solution tank.
12 - 7
12.6
Fixing of Instrument
(1)
Determine the installation place of the main unit through arrangement with the customer,
and fix the main unit by turning the adjuster screws.
(2)
Wipe out contaminants from the incubator by use of gauze soaked with 2% Hitergent
solution or the like, and inject deionized water into the incubator.
(3)
Check if the incubator is at a level by measuring the water level at 3 check points, and
adjust the height by turning the adjuster screws.
Check point
(Incubator)
(Main unit adjuster)
Fig. 12-3 Adjustment of Water Level in Incubator
12.7
(1)
Preparation for Analysis
Prepare 2% Hitergent solution in a container, and immerse the reaction cells (6 sets) in
the solution. Before turning on power, set all reaction cells.
(2) Fill at least the deionized water tank at least 3/4 full with deionized water.
(3) Take of the water-return tube (from pump to tank) at the tank-side to de-activate the pump.
(4) When the water raised up in this tube, fix the tube again.
12.8
Operation after Turning On Power
(1)
Turn on the main switch.
(2)
Turn on the power switch.
(3)
The initial screen (copyright notice) appears.
(4)
Enter the date.
(5)
Execute "Reset" to eliminate air bubbles from each syringe.
(6)
Execute "Incubator Water Exchange" 2 or 3 times. Check if Hitergent is injected in the
incubator with the R. probe at water exchange.
12 - 8
12.9
(1)
Adjustment and Check of Each Part
Adjustment of Sample Probe Position
(a)
Place the sample cups at Pos. 1 and W1 on the S. disk, and execute "Probe Adjust
[S. Probe (Horiz)]".
(b)
Check the respective positions of the probe, sample cup and rinsing bath each time
the Execute key is pressed.
(c)
Adjust the probe position by hand if deviated above the cell and through pulse
adjustment if deviated above the sample cup.
(d)
Place the sample cups at Pos. 1, 2 and W1 on the S. disk, and execute "Probe
Adjust [S. Probe (Vert)]". The S. probe moves down and the height of the sample
cup bottom at each position is measured.
Cell (reaction cuvette)
Liquid level sensor
Probe end
Fig. 12-4 Sample Probe Position
(2)
Adjustment of Reagent Probe and Stirring Rod
(a)
Place the 50 mL reagent bottle at channel 1 of the reagent disk, and execute "Probe
Adjust [R. Probe (Horiz)]".
(b)
Check the respective positions of the probe, rinsing bath and reagent bottle each
time the EXECUTE key is pressed.
(c)
Adjust the probe position by hand if deviated above the cell and through pulse
adjustment if deviated above the reagent bottle.
(d)
Remove the reagent bottle from the reagent disk, and adjust "Probe Adjust [R.
Probe (Vert)]". The R. probe moves down and the height of the reagent bottle
bottom is measured.
(e)
Adjust the distance between the cell holder assy and stirring rod end by use of the
furnished spacer.
(f)
Press the Execute key and check the position with reference to the rinsing bath.
12 - 9
Stirring mechanism
Stirring rod
Height adjusting screw
M2 screw
Put the spacer here.
7.5 mm
Upper end of spacer
Cell holder
Spacer
Fig. 12-5 Position of Reagent Probe and Stirring Rod
(3)
Check of Rinse Mechanism
(a)
Check the distance between the cell and nozzle tip.
(b)
Execute "Mechanism Check".
(c)
Check the amount of cushion when the nozzles (6 pcs) are moved down.
(d)
Check if the bottom of the nozzle tip is oblique to the cell. If so, the nozzle position
should be adjusted by hand.
Rinse nozzle
Nozzle tip
Reaction cuvette
Fig. 12-6 Position of Nozzle of Rinse Mechanism
(4)
Check of Rinse Water Volume
(a)
Execute "Mechanism Check".
(b)
Make sure that no water drops adhere to the top surface of the cell at the time of cell
and nozzle wash with the rinse mechanism.
12 - 10
12.10 Operation for Completion and Others
(1)
Turn off the power switch, and remove the right cover and circuit board stopper from the
inside of the front door of the main unit. Pull out the EMOT200 board and turn off DIP SW
1, no. 6. Return the board to its original condition and turn on the power switch.
(2)
Output and analyze accumulated alarm information in Alarm Log Print. Delete alarm
information.
(3)
Delete the contents of request on the Calibration Registration screen.
(4)
Delete all data for routine samples on the Monitor screen.
(5)
Make final check of the instrument (attachment of covers, tightening of screws, etc.).
(6)
Turn off the power switch of the instrument and the deionized water supply unit. Also turn
off the tap water.
(7)
Write the date of takeover on the date label and attach it to the 902 main unit (side for
example).
12 - 11
12.11 Install Program
12.11.1
Configuration
Three floppy disks (hereafter referred to as FD) are available .
Detailed below is the file configuration of each FD.
(1)
Explanation of File (name and contents of file)
• Installation FD (no. 1)
VOL: None
Y
ECPU230L.TXT
SCRENXXX.M2S
SCRENXXX.M2T
SCRENXXX.M2G
SCRENXXX.M2M
VXWORKS
Contents of file
Name of file to be installed
Screen information 1
Screen information 2
Screen information 3
Screen information 4
Installation program
• Installation FD (no. 2)
VOL: None
Y
VXWORKX1.XXX
VXWORKX2.XXX
Contents of file
Model 902 product program 1
Model 902 product program 2
• Installation FD (no. 3)
VOL: None
Y
VXWORKX3.XXX
TBL_6801.XXX
TMCLOAD1.XXX
Contents of file
Model 902 product program 3
Model 902 product program 4
Model 902 product program 5
12 - 12
12.11.2
Procedure for Installation of Product Program
(1)
Load the installation FD (no. 1) into drive 1 (left FDD), and turn on the main switch of the
instrument.
(2)
The screen given below then appears.
(If the screen given below does not appear (if the space screen is displayed), it is
necessary to execute installation of screen information (initialization) with reference to
12.12.4.
(If the message "Screen data is destroyed." is displayed, it is necessary to initialize the
image memory. Execute initialization of the LCD module memory.)
Wait for 7 min.
XXX
The program is loaded and the next screen is displayed.
(3)
Display of Installation Menu Screen
[Installation Menu]
[1. System File Only]
[2. Screen Information (+ System File)]
[3. End]
Waiting for Selection of Installation Function
[1. System File Only]
: Updating of product program alone
[2. Screen Information (+ System File)]: Updating of screen information and product
program
[3. End]
: End (suspension of installation)
Press the [2. Screen Information (+ System File)] key.
The next screen is displayed.
(4)
Installation Instruction Screen
1. Touch both ends of "screen" to display System Menu screen.
2. Press "Transfer Mode" key.
Simultaneously press 2 touch switches at the corners of the screen.
The system menu is displayed. (The next screen appears.)
12 - 13
(5)
System Menu Screen
[System Menu]
[Menu End]
[Transfer Mode]
[Maintenance Mode]
Press [Transfer Mode] key to enter transfer mode.
The next screen is displayed.
(6)
Screen Information Transfer Screen
[Transfer Mode]
Tool –> PT
Screen data
XX kbyte
[Stop]
During transfer, the indication of memory capacity changes.
When the memory indication (XX kbyte) is cleared, press [Stop] key.
Note:
Do not press the [STOP] key before, or the full installation procedure
inclusive 12.11.4 and 12.11.5 will have to be carried out !
The next screen is displayed.
(7)
Waiting for Request to Initialize Flash Memory
Flash memory will be initialized.
Are you sure?
[Yes]
[No]
Waiting for Request to Initialize Flash Memory
[Yes]
: Execution of flash memory initialization
[No]
: End (suspension of installation)
Press [Yes].
The next screen is displayed.
12 - 14
(8)
Display of Flash Memory Initialization
Flash memory is under initialization.
Display of flash memory initialization
Upon completion of initialization, the next screen appears.
(approx. 30 seconds required for initialization)
(9)
Display of Installation Start
Load FD into drive 2 and press
"Start" key.
[Start]
Load the installation FD (no. 2) into FD drive 2 (right FDD), and press [Start] key.
The next screen is displayed.
(10) Installation Display Screen (indicates that product program is under installation)
Installation is under execution.
FD –> EEPROM
FILE NAME xxxxxxxx. xxx
The name of file being installed (xxxxxxxx. xxx) is displayed.
Upon completion of installing all files in the installation FD (no. 2), the following screen is
displayed again.
(11) Display of Installation Start
Load FD into drive 2 and press
"Start" key.
[Start]
Pull out installation FD (no. 2) from drive 2 (right FDD), load the installation FD (no. 3) into
drive 2 (right FDD) and press [Start] key.
12 - 15
(12) Installation Display Screen (indicates that time chart data and program is under
installation)
Installation is under execution.
FD –> EEPROM
FILE NAME xxxxxxxx. xxx
The name of file being installed (xxxxxxxx. xxx) is displayed.
Upon completion of installing all files in the installation FD (no. 3), the following screen is
displayed.
(13) Installation End Display Screen
Installation has been completed
normally.
Pull out FD from drive 1/2.
Turn on power again and
check operation.
xxxx
Warning indication (W)
SUM value indication (XXXX)
: Displayed if the number of accesses to EEPROM
exceeds 50,000.
: Display of SUM value for area installed to EEPROM
(Make sure that the displayed SUM value is correct.)
Pull out the FD from drive 1 and drive 2, turn on power again and check operation.
12.11.3
Check Items
After installation, check the following items.
(1)
The SUM value on the installation end display screen is as follows.
xxxx
OK
NG
(2)
Upon powering on the instrument, the version of screen information (at lower right of
screen) is displayed as follows.
xxx
OK
NG
12 - 16
12.11.4
Procedure for Installation of Screen Information (initialization)
(1)
Load the installation FD (no. 1) into drive 1 (left FDD), and turn on the main switch of the
instrument.
(2)
The space screen is presented.
When the program is loaded, "buzzer" sounds.
Simultaneously press 2 touch switches at the corners of the screen. The system menu is
displayed. (The next screen is displayed.)
(3)
System Menu Screen
[System Menu]
[Menu End]
[Transfer Mode]
[Maintenance Mode]
Press [Transfer Mode] key to enter transfer mode.
The next screen is displayed.
(4)
Screen Information Transfer Screen
[Transfer Mode]
Tool –> PT
Screen data
XX kbyte
[Stop]
The indication of memory capacity changes during transfer.
When the memory indication (XX kbyte) is cleared, press [Stop] key.
After that, perform step no. 7 and subsequent of the procedure for installation of the
product program.
In case of a failure in screen information transfer, the next screen is displayed.
12 - 17
(5)
Screen Displayed in Case of Failure in Screen Information Transfer
Screen data is destroyed.
Screen information transfer has failed. (Execute installation again.)
After initialization of the LCD module memory (refer to 12.12.5), carry out "Procedure for
Installation of Screen Information (installation)" again.
12.11.5
Procedure for Initial Setting of LCD Module
Explained below is initialization of the LCD module memory.
(1)
Display of System Menu
Power on the 902 main unit.
When there is no image data, "System Menu" is displayed.
When the operation mode (RUN lamp lit) is set, press the touch switch to display "System
Menu".
(2)
Initial Screen
Display immediately after turning on power when image data is not registered (space
display)
Display immediately after turning on power when image data is destroyed
[System Menu]
[Menu End]
[Transfer Mode]
[Maintenance Mode]
Screen data is destroyed.
12 - 18
(3)
How to Display System Menu
Upon simultaneously pressing 2 touch switches at the corners of the screen (positions
marked " " below), the system menu is displayed.
(4)
System Menu Screen (Execute operation for display of "System Menu" when image data
is not registered.)
[System Menu]
[Menu End]
[Transfer Mode]
[Maintenance Mode]
Press [Maintenance Mode] from the system menu to display "Maintenance Mode Menu".
The next screen is displayed.
How to Return to Operation Mode
a) Press [Menu End].
b) Avoid touching the screen for 10 seconds or more (avoid pressing the touch
switch).
(5)
Maintenance Mode Menu Screen
[Maintenance Mode Menu]
[Menu End] [DIP SW Setting Status]
[PT Setting Status]
[I/O Check]
[Memory Initialization]
[Memory Switch]
[Memory Switch]
: Setting of memory switch
[DIP SW Setting Status] : Confirmation of DIP SW setting status
[Memory Initialization]
: Initialization of image data memory
Press [Memory Initialization] key.
The next screen is displayed.
12 - 19
(6)
Memory Initialization
[Memory Initialization Menu]
[Menu End]
[Image Data Initialization]
Select [Image Data Initialization].
Is it desired to initialize image data
memory?
[Yes]
[No]
Select [Yes].
The image data memory is initialized.
"Initialization is under execution." is displayed during initialization.
Upon completion of initializing the image data memory, execute installation according to
"Procedure for Installation of Product Program".
(7)
Memory Switch Setting 1
(NOTE: Each switch is set as shown below. Setting change may disable startup of the
instrument. So avoid changing the setting.)
[Keying Sound]
OFF
[Buzzer Sound]
ON
[Back Light Off Time] 10 Min
[Automatic Communication Recovery] No
Stop
Next
Screen
Write
Check
Press [Write Check] key.
(8)
Memory Switch Setting 2
(NOTE: Each switch is set as shown below. Setting change may disable startup of the
instrument. So avoid changing the setting.)
[Data Bit Length] 8 Bits
[Stop Bit Length] 2 Bits
[Parity]
Even
[Flow Control]
RS/CS
[Baud Rate]
9600 bps
[Lamp Bit Control] Invalid
Stop
Previous
Screen
Write
Check
Press [Write Check] key.
12 - 20
(9)
DIP SW Setting Status Display
[DIP SW Setting Status]
1. Forced Data Initialization
2. System Message Mode
3. System Menu Display
4. Unused
[End]
No
English
Enable
OFF
Press [End] key.
12 - 21
13. MAINTENANCE AND INSPECTION
13.
Maintenance and Inspection .................................................................................. 13-1
13 - 0
13. MAINTENANCE AND INSPECTION
Periodic Cleaning/Inspection and Periodic Parts Replacement List for Model 902 Automatic Analyzer
:
No.
Item
1
2
3
4
5
Sample cup
Sample probe
Reagent probe
Nozzle seal
Reaction cuvette
(18 pcs contained)
Incubation bath and incubation
bath discharge filter
Light source lamp (20 W)
Printer paper
Stirring rod
Seal piece (for sample pipetter)
Seal piece (for reagent pipetter)
O-ring (for pipetter)
Water supply filter
Radiator filter
HITERGENT
HIALKALI D
Diaphragm
Floppy disk (MF2-250HD)
Light source lamp (30 W)
Taper syringe
Nozzle 1 (for rinsing)
Nozzle 2 (for blank water)
Nozzle 3 (for aspiration)
Nozzle 4 (with tip, for aspiration)
Nozzle 5 (rinsing bath)
Nozzle 6 (with tip, for aspiration)
Nozzle tip (with tip, for aspiration)
NYLATCH G
NYLATCH P
Spring
Spring stopper
Cleaning wire (1 to 6)
Taper Syringe
6
7
8
9
10
11
12
13
14
15
16
17
18
19
20
21
22
23
24
25
26
27
28
29
30
31
32
33
Part No.
F611049
713-0201
713-0202
F729051
713-0282
Q’ty
Required
Every Time
Q’ty
Required
Every Year
6
72
Every
Day
On
Occasion
l
*
Every
Week
l
Frequency
Every
Every
Month
3 Months
G825045
707-0204
707-0205
707-0206
713-0290
713-1078
713-1081
F729050
707-1337
707-1336
L913590
707-1088
705-0516
713-1331
Periodic replacement part
Every
6 Months
Every
Year
Consumable
Part
: Consumable part
Maintenance
Part
: Maintenance part
Remarks
l
707-0433
705-0840
16F-6042
713-1264
714-0853
714
704-0409
305-2626
713-1316
986-8010
987-0126
707-1803
R629134
l:
Periodic inspection/cleaning
1
2
1
2
4
8
*
l
l
l
l
l
714-1360, 714-1282, 714-1361
714-1362, 714-1291, 714-1363
For reagent pipetter
For sample pipetter
13 -1
14. ADJUSTMENT SPECIFICATIONS
14.1 Electrical Adjustments ..............................................................................................14-1
14.1.1 DC Power Supply Adjustment and Checks.................................................14-1
14.1.2 LOG AMP Board Adjustment......................................................................14-2
14.1.3 ADC Timing Adjustment .............................................................................14-3
14.1.4 Reaction Bath Temperature Adjustment.....................................................14-3
14.1.5 Barcode Reader Switch Setting..................................................................14-4
14.1.6 Barcode Reader Positioning .......................................................................14-5
14.2 Adjustment/Disassembly/Reassembly of Mechanisms.............................................14-6
14.2.1 CD Touch PAnel.........................................................................................14-8
14.2.2 How to Remove Main Unit Top Cover.........................................................14-8
14.2.3 Sample Arm Unit.........................................................................................14-8
14.2.4 Reagent Arm Unit .......................................................................................14-9
14.2.5 Stirring Mechanism .....................................................................................14-9
14.2.6 Sample Disk ...............................................................................................14-9
14.2.7 Reagent Disk (cooling unit).........................................................................14-10
14.2.8 Reaction Bath .............................................................................................14-10
14.2.9 Rinse Mechanism .......................................................................................14-11
14.2.10 FDD ............................................................................................................14-11
14.2.11 DC Power Unit ............................................................................................14-11
14.2.12 Probe Adjustment .......................................................................................14-12
14 - 0
14. ADJUSTMENT SPECIFICATIONS
14.1
Electrical Adjustments
14.1.1
DC Power Supply Adjustment and Checks
Carry out adjustment and checks of the power voltages shown in Table 14-1.
Table 14-1 Analyzer DC Power Supply Adjustment/Check Specifications
Voltage(V)
Adjustment/Check
Voltage Measuring Position
5
Adjust to 5.35 ± 0.05 V
5 V power output terminal
5 V power trimmer
12 (lamp)
Adjust to 12.3 ± 0.05 V
12 V power output terminal
12 V power trimmer
15
Check -15 ± 0.8 V
TP6-TP5 on DIP board
−
-15
Check -15 ± 0.8 V
TP7-TP5 on DIP board
−
24
Adjust to 24.3 ± 0.1 V
24 V power output terminal
14 - 1
Adjusting Trimmer
24 V power trimmer
14.1.2
LOG AMP Board Adjustment
Adjust the LOG AMP board at the rear of instrument in the procedure below. The standard
lamp should be used for this.
< Adjusting procedure >
(1)
After turning on the instrument, wait for at least 30 minutes (for the lamp to stabilize).
(2)
Make sure there is water in the reaction bath, and carry out the following adjustments.
(3)
Check if voltage is 2.00 ± 0.005 V across check pins TP20-TP15 (G). If not, adjust it with
trimmer VR14.
(4)
Check if voltage is 6.00 ± 0.005 V across check pins TP21-TP15 (G). If not, adjust it with
trimmer VR13.
(5)
Flip toggle switch SW3 upward, and adjust trimmers VR1 to VR12 to obtain 1.81 ± 0.05 V
across check pins TP14-TP15 (G) at positions 0 to B of rotary code switch SW1.
Table 14-2 shows the settings of rotary code switches SW1 and SW2 and the trimmers to
be used for adjustment.
(6)
When adjustment with trimmers is finished, set rotary switches SW1 and SW2 to "F" and
flip the toggle switch SW3 downward.
Table 14-2 SW1/SW2 Settings and Corresponding Trimmers
Wavelength No.
SW1 Setting
SW2 Setting
Adjusting Trimmer
1
2
3
4
5
6
7
8
9
10
11
12
0
1
2
3
4
5
6
7
8
9
A
B
0
1
2
3
4
5
6
7
8
9
A
B
VR1
VR2
VR3
VR4
VR5
VR6
VR7
VR8
VR9
VR10
VR11
VR12
14 - 2
14.1.3
ADC Timing Adjustment
Adjust the ADC timing in the following procedure.
< Adjusting procedure >
The board to be adjusted is the DI board (1st board from the right in circuit board rack).
(1)
Measure voltage across check pins TP1-TP2 (G) (DI board) and across TP14-GND (LOG
AMP board) using a synchroscope.
(2)
Rotate the reaction disk using the mechanism check operation of the instrument check
program, and adjust the measured waveform using trimmer VR1 to obtain the timing
shown in Fig. 14-1.
NOTE: It may take 1 or 2 minutes until the LOG AMP output waveform appears.
-4 +4
±4 ms
LOG output:
Across LOG AMP board TP14-GND
LOG output
* Terminals:
Between TP14 and AG
One shot in DI
* Terminals:
Between TP1 and DG
Across DI board TP1-TP2
(adjust with VR1)
26 ms
15 ms or more (flat section)
13 ms
A/D
In AD converting operation, a time period of 13 ms is
taken from the rise of ADC start signal. This period of
time should correspond to the flat section of LOG
output.
Fig. 14-1 ADC Timing Waveform Specification
14.1.4
Reaction Bath Temperature Adjustment
Adjust reaction bath temperature in the following procedure.
< Adjusting procedure >
(1)
Connect a tester across CP5 and SG of EMIO100 board.
(2)
Turn power on and put the instrument in standby.
14 - 3
(3)
Adjust VR4 on EMIO100 board so reaction bath water temperature is 37 ± 0.1°C. (Since
the heater is turned ON/OFF at around 6.0 V, the tester output should be about 6.0 V
when reaction bath water temperature is 37°C.)
(4)
Adjust the reaction bath temperature indication with VR3.
NOTE:
A YSI thermometer should be used to measure the reaction bath water
temperature.
NOTE:
The measuring position for the YSI thermometer is midway between the sample
discharge position and reagent discharge position.
14.1.5
Barcode Reader Switch Setting
Set and/or check the DIP switches of the barcode reader in the following procedure.
In case of sample barcode reader: Use the settings made by the manufacturer.
Details of setting are given in Table 14-3.
SW1
SW2
EMOT200 board
< Settings of each SW at shipment >
SW1
SW2
1 2 3 4 5 6 7 8
1 2 3 4 5 6 7 8
ON
ON
Fig. 14-2 Barcode Reader DIP Switch Settings
14 - 4
Table 14-3 Barcode Settings
Readable Barcodes
Check digit
NW-7
with/without
CODE 39
ITF
Code 128
No. of digits read
Signal line monitoring
INZONE signal
Communication speed
Frame configuration
Data format
Readout system
14.1.6
ITF, CODE 39, NW-7 (Modulas 10, Modulas 16), CODE 128
MOD10/MOD16/Without
With/Without
With/Without
With
Variable length
Yes
Yes
9600 bps
7 bits, even parity, 1 stop bit
ETX
CCD
Barcode Reader Positioning
Position the barcode reader in the following procedure.
< Positioning procedure >
• Check of disk stopping position
Make sure the sample disk stopping position is aligned with the cutout in the jacket.
NOTE:
Do not shift the disk stopping position when positioning the sample probe.
And absolutely avoid changing the disk stopping position. Make sure the cutout
in the jacket comes to the center of the test tube.
Test tube
Barcode reader
Sample disk
Jacket
14 - 5
14 - 6
.
14 - 7
14.2.1
LCD Touch Panel
(1)
Open the front covers L and R and remove the concealing plate at the top front.
(2)
Reaching through the opening provided by removing the above plate, apply a bladeedged screwdriver to the claw holding the LCD touch panel from the rear of the main unit
cover, and lift up to remove the LCD touch panel.
(3)
Detach the power terminal and signal cable connectors from the rear of the LCD touch
panel, and remove the touch panel.
< Replacement of backlight on LCD touch panel >
(1)
Remove the LCD touch panel.
(2)
Open the screw-fastened lid on the 24 V DC terminals at the rear of LCD touch panel.
(3)
Detach connector CN2 at the rear of the opening in the lid, remove the backlight and
replace it.
14.2.2
How to Remove Main Unit Top Cover
(1)
Remove arm covers A, B, C, D and E and the protective plate.
(2)
Remove LCD touch panel and the printer unit.
(3)
Detach the LED board wiring connector from the main unit cover.
(4)
Lift up and remove the main unit cover.
14.2.3
Sample Arm Unit
(1)
Remove the main unit cover.
(2)
Detach the sample arm tube from the joint of the seesaw mechanism.
(3)
Detach connectors J540 and J541.
(4)
Remove the grounding wire.
(5)
Remove the retaining screws and detach the unit.
14 - 8
14.2.4
Reagent Arm Unit
(1)
Remove the main unit cover.
(2)
Detach the reagent arm unit tube (passing beneath the reaction bath) from the joint of the
seesaw mechanism.
(3)
Detach connectors J550 and J551.
(4)
Remove the grounding wire.
(5)
Remove the retaining screws and detach the unit.
14.2.5
Stirring Mechanism
(1)
Remove the main unit cover.
(2)
Remove the reagent arm unit.
(3)
Detach the stirring mechanism retaining screws and pull out the mechanism, then remove
connectors J560 and J561.
14.2.6
Sample Disk
(1)
Remove the main unit cover.
(2)
Remove the sample disk support ( a round plate).
(3)
Remove the S jacket.
(4)
Remove connectors J510 and J511.
(5)
Detach the retaining screws and remove the disk.
14 - 9
14.2.7
Reagent Disk (cooling unit)
(1)
Open the side panel L, and drain water manually from the circulating pump intake header.
(2)
Remove the main unit cover.
(3)
Remove the table support R1.
(4)
Remove the reagent jacket retaining screws.
(5)
Open rear plates A, B and side panel R, and remove cooling unit retaining screws and
connectors.
(6)
While lifting the reagent jacket, remove tubes L and R from the reaction bath, then detach
the cooling unit.
(7)
Remove connectors J520 and J521.
(8)
Detach the retaining screws and remove the disk.
Drain tube
Circulating pump
14.2.8
Reaction Bath
(1)
Open side panel L, and drain water manually from the circulating pump intake header.
(2)
Remove the main unit cover.
(3)
Remove the rinse mechanism for sample, reagent and stirrer.
(4)
Remove the reaction bath water level sensor.
(5)
Detach retaining screws and remove the bath.
14 - 10
14.2.9
Rinse Mechanism
(1)
Remove the main unit cover.
(2)
Detach the thumbscrew and remove the rinse mechanism arm section.
(3)
Remove connectors J530 and J531.
(4)
Detach retaining screws and remove the mechanism.
14.2.10 FDD
(1)
Detach retaining screws on the FDD front panel and pull out the FDD carefully.
(2)
Detach the connector at the rear of FDD, remove the FDD and replace it.
14.2.11 DC Power Unit
(1)
Remove the front right-side cover.
(2)
Open side panel R, and remove connector J300 on DRV board.
(3)
Reaching through the opening in the right side, remove two connectors at the rear of DC
power unit.
(4)
Detach retaining screws at the front of DC power unit, and pull the unit forward.
Removing the front connector wiring of FDD and circuit board rack will make it easier to
pull out the unit.
14 - 11
14.2.12 Probe Adjustment
START
1)
Operator
judgement
Reference
value change
required?
Required
(EMOT 200 PCB)
Circuit board
DIP SW ON
SW 6
Required
2)
Maintenance
screen
Operator
judgement
4)
Select from
functions 1 to 4 for
execution and display
Alarm display
3)
5)
"STOP" input
FD
(alarm logging)
Operation
check
Data entry for
reference
value change
END
14 - 12
(1)
Functions
1.
2.
3.
4.
5.
Adjust stopping position of S.probe rotation.
Adjust cup height for S.probe descent.
Adjust stopping position of R.probe rotation.
Adjust stopping position for stirring rod rotation.
Adjust R.probe descent to bottle position.
Required time: Unlimited
Process
No.
1)
2)
3)
4)
5)
Details
Reference Document
Turn ON circuit board DIP SW, and reference value
change data area will appear on Probe Adjust screen.
Start from Maintenance screen.
PROBE ADJUST:1 = S.probe rotation adjustment
2 = Adjustment of cup height for
S.probe descent
3 = R.probe rotation adjustment
4 = Stirring rod rotation adjustment
5 = Adjustment of R.probe descent
to bottle position
Refer to next page.
Check operation at probe adjustment. If operation is
not normal, alarm will appear on Alarm Monitor
screen.
Save the above alarm in FD.
14 - 13
Screen spec., circuit board
DIP SW spec.
Screen spec.
Screen spec., alarm code
table
(2)
Details of Probe Adjusting Process
For the probe adjustment, first reset the mechanisms, then carry out the following
procedures.
Adjustment of stopping position of S.probe rotation:
(a)
Details of operation
Above cell
START
Rinse bath
* Rack sampler
Sample disk
(outer row)
Sample disk
(inner row)
(b)
Conditions for stopping:
1) When abnormal descent of probe is detected.
2) When STOP key is pressed.
3) When mechanism STOP level alarm occurs.
In case of 1), press STOP key, then probe returns to rinse
bath and operation stops.
In case of 2), probe returns to rinse bath and operation stops.
Extent of operation
1)
2)
Rotation angle:
Reference value (no. of pulses) is subjected to no. of
correction pulses set on System Parameters screen, and
corrected pulse count shall be used.
Descent amount: Sample disk (inner/outer rows); H1 - 5 mm
H1 is no. of descent pulses given in 2-2.
* When rack sampler is provided.
Explanation of symbols in operation diagram
: mechanism operating direction
• : temporary stop
O
: proceed to S.STOP
: connecting position for repeat
14 - 14
Adjustment of cup height for S.probe descent:
(a)
Details of operation
End
Cell stop
Start
(rinse bath)
Acceleration/
deceleration: Ascent
Descent at
constant speed: Descent
S2
S3
Stops when abnormal
descent is detected,
and recorded as S1, S2, S3.
S1
Conditions for stopping:
1) When STOP key is pressed.
2) When mechanism STOP level alarm occurs.
In case of 1), probe returns to rinse bath and
operation stops.
NOTE: Does not advance when S.STOP key pressed.
Probe descent position:
S1 -- sample disk outer row No. 1 position (empty sample cup)
S2 -- sample disk outer row No. 2 position (empty sample cup set on ø16 mm × 100 mm
test tube)
S3 -- sample disk inner row W1 position (empty sample cup)
(valid only for pos. 58, 59, 60)
Above positions are predetermined. Operator must set cups at 3 positions before the
adjustment.
(b)
Extent of operation
1)
Rotation angle
2)
: Reference value (pulse count) is subjected to no. of
correction pulses set on System Parameters screen, and
corrected pulse count shall be used.
Descent amount : Should descend to lowermost point (117 mm) at constant
speed.
14 - 15
(3)
Stroke Identification for Sample Container
S1:
S2:
S3:
Height identification of standard cup on sample
disk outer row (No. 1 position)
Sample containers *1
Height identification of cup on test tube/
same as for S1 (No. 2 position)
Height identification of standard cup on
sample disk inner row (W1 position) ................... STD/CONT
*1 Test tubes are settable only on the outer row. Model 902 allows height identification
for two kinds of sample containers.
(4)
Setting of Sample Containers at S.probe Adjustment *2
Container
Used
Cup-on-tube
Standard
Cup
S1
Standard cup
Standard cup
S2
Cup-on-tube
S3 (W1)
Standard cup
Set
Position
Standard
Cup/Test
Tube
Standard Cup/
Cup-on-tube
Test Tube/
Cup-on-tube
Standard cup
Standard cup
Test tube
Standard cup/ Test tube
cup-on-tube
Test tube
Cup-on-tube
Cup-on-tube
Standard cup
Standard cup
Standard cup
Standard cup
Test Tube
Test tube
Standard cup
*2 After S.probe readjustment, check if the stroke down to the sample container has
changed.
14 - 16
(5)
R.probe Rotation Adjustment
(a)
Details of operation
Above cell
Above reagent bottle (outer row)
Repeat
Above reagent bottle (inner row)
Rinse bath
Probe is not moved vertically.
(b)
Extent of operation
1) Rotation angle: Reference value (pulse count) is subjected to no. of correction
pulses set on System Parameters screen, and corrected pulse
count shall be used.
Conditions for stopping
1) When STOP key is pressed.
2) When mechanism STOP level alarm occurs.
In case of 1), probe returns to rinse bath and stops.
(6)
Stirring Rod Rotation Adjustment
(a)
Details of operation
Above cell
Rinse bath
Repeat
Stirring mechanism is not moved vertically.
(b)
Extent of operation
1) Rotation angle: Same as in operation.
Conditions for stopping:
1) When STOP key is pressed.
2) When mechanism STOP level alarm occurs.
In case of 1), rod returns to rinse bath and stops.
14 - 17
(7)
Adjustment of R.probe Descent to Bottle Position
(a)
Details of operation
End
Above cell
Start
(rinse bath)
Conditions for stopping:
When mechanism STOP
level alarm occurs.
Descends at
constant speed.
R1
R1 disk outer row
Stop operation at abnormal descent, and record height of R1.
(Produce a STOP level alarm. And display it on Maintenance screen.)
Displayed height is value (descent pulses +7) converted to mm (0.07501
mm/pulse).
Probe descent position is predetermined at No. 1 position on outer row.
Operator must pull out bottle.
(b)
Extent of operation
1) Rotation angle
2)
: Reference value (pulse count) is subjected to no. of
correction pulses set on System Parameters screen, and
corrected pulse count shall be used.
Descent amount : Should descend to lowermost point (114.0 mm) at constant
speed.
14 - 18
15. OEM
15.1
DC Power Supply................................................................................................15-1
15.1.1
5 V DC Power Supply ......................................................................... 15-1
15.1.2
24 V DC Power Supply ....................................................................... 15-2
15.1.3
12 V Power Supply ............................................................................. 15-3
15.2
Reagent Refrigerator ..........................................................................................15-4
15.2.1
Function ..............................................................................................15-4
15.2.2
Specifications of Cooling Unit .............................................................15-4
15.2.3
Specifications of Electrical Components ............................................. 15-4
15.2.4
Refrigerator Wiring Diagramm ............................................................15-5
15.2.5
Circuit Diagramm of Refrigerator Control Circuit................................. 15-6
15.3
FDD (YD702D-6037D-021051) ........................................................................... 15-7
15.3.1
Specifications......................................................................................15-7
15.3.2
Interface ..............................................................................................15-8
15.3.3
Electrical Specifications (FD interface signal) ..................................... 15-9
15.4
Printer (FTP-020UCS530-#01A) ......................................................................... 15-10
15.4.1
Configuration.......................................................................................15-10
15.4.2
Specifications......................................................................................15-11
15.4.3
Interface ..............................................................................................15-12
15.4.4
Connectors..........................................................................................15-13
15.5
Barcode Reader (CCD system) ........................................................................... 15-14
15.5.1
Specifications......................................................................................15-14
15.6
LCD Touch Panel................................................................................................15-15
15.6.1
Specifications......................................................................................15-15
15.7
Mark Card Reader.........................................................(Described on separate sheet)
15 - 0
15.
OEM
15.1
DC Power Supply
15.1.1
5 V DC Power Supply
< Specifications >
(1)
Type: EWS50-5
(2)
Input conditions
(a) Voltage
(b) Current
(c) Efficiency
(d) Rush current
(e) Frequency
(3)
: 85 to 265 V AC or 110 to 330 V DC
: 1.2 A (100 V AC input, under full load),
0.6 A (200 V AC input, under full load)
: 75% (at maximum output power)
: 6.8 A (100 V AC input), 13.5 A (200 V AC input)
: 47 to 440 Hz
Output characteristics
(a) Rated voltage
:
(b) Maximum output current:
(c) Maximum output power :
(d) Input fluctuation
:
(e) Load fluctuation
:
(f) Voltage variable range :
5V
10.0 A
50.0 W
20 mV
40 mV
±10%
(4)
Protection circuit
(a) Overcurrent protection : Activated at 10.5 A, and auto resetting
(b) Overvoltage protection : Activated at 5.75 to 6.75 V
(5)
Environment
(a) Operating temperature
and humidity
: 0 to 50°C, 30 to 90% RH (without condensation)
(b) Storage temperature
and humidity
: -30 to 85°C, 10 to 95% RH (without condensation)
(c) Vibration resistance
: 2 G or less (10 to 55 Hz, 2 G constant, in each of X, Y and
Z directions for 1 hour)
(d) Shock resistance
: 20 G or less
15 - 1
15.1.2
24 V DC Power Supply
< Specifications >
(1)
Type
(2)
Input conditions
(a) Voltage
(b) Current
(c) Efficiency
(d) Rush current
(e) Frequency
(3)
: EWS300-24
: 85 to 132 V AC or 170 to 265 V DC
: 7.0 A (100 V AC input, under full load),
3.5 A (200 V AC input, under full load)
: 82% (at maximum output power)
: 25 A (100 V AC input), 50 A (200 V AC input)
: 47 to 440 Hz
Output characteristics
(a) Rated voltage
:
(b) Maximum output current:
(c) Maximum output power :
(d) Input fluctuation
:
(e) Load fluctuation
:
(f) Voltage variable range :
24 V
14 A
336 W
96 mV (maximum input to minimum input)
144 mV (no load to full load)
±20%
(4)
Protection circuit
(a) Overcurrent protection : Activated at 14.7 to 18.2 A, and auto resetting
(b) Overvoltage protection : Activated at 30.0 to 34.8 V
(5)
Environment
(a) Operating temperature
and humidity
: 0 to 50°C, 30 to 90% RH (without condensation)
(b) Storage temperature
and humidity
: -30 to 85°C, 10 to 95% RH (without condensation)
(c) Vibration resistance
: 2 G or less (10 to 55 Hz, 2 G constant, in each of X, Y and
Z directions for 1 hour)
(d) Shock resistance
: 20 G or less
15 - 2
15.1.3
12 V Power Supply
< Specifications >
(1)
Type
(2)
Input conditions
(a) Voltage
(b) Current
(c) Efficiency
(d) Rush current
(e) Frequency
(3)
: EWS50-12
: 85 to 165 V AC (continuous input system)
: 1.2 A (100 V AC input, under full load),
0.6 A (200 V AC input, under full load)
: 74% (at maximum output power)
: 6.8 A (100 V AC input), 13.5 A (200 V AC input)
: 47 to 440 Hz
Output characteristics
(a) Rated voltage
:
(b) Maximum output current:
(c) Maximum output power :
(d) Input fluctuation
:
(e) Load fluctuation
:
(f) Voltage variable range :
12 V
4.4 A
52.8 W
48 mV (maximum input to minimum input)
100 mV (no load to full load)
±10%
(4)
Protection circuit
(a) Overcurrent protection : Activated at 4.6 A or more and auto resetting
(b) Overvoltage protection : Activated at 13.8 to 16.2 V
(5)
Environment
(a) Operating temperature
and humidity
: 0 to 50°C, 30 to 90% RH (without condensation)
(b) Storage temperature
and humidity
: -30 to 85°C, 10 to 95% RH (without condensation)
(c) Vibration resistance
: 2 G or less (10 to 55 Hz, 2 G constant, in each of X, Y and
Z directions for 1 hour)
(d) Shock resistance
: 20 G or less
15 - 3
15.2
Reagent Refrigerator
15.2.1
Function
This unit is used for the Model 902 automatic analyzer and has the following functions.
(a) Keeping analytical reagents cool
(b) Cooling of water circulated in incubation bath
15.2.2
Specifications of Cooling Unit
(1)
Refrigerating system
Refrigeration cycle with enclosed type air compressor
The air compressor 2T2B3R126A-1A made by Matsushita is employed.
(2)
Dimensions and shape
External dimensions:
Depth (563) × width (346) × height (336) mm (including coolant bath)
Depth (250) × width (225) × height (270) mm (excluding coolant bath)
15.2.3
(1)
Specifications of Electrical Components
Power relay
Type
Rated voltage
Rated current
: G7L-1A-TJ
: 12 V DC
: 158 mA
(2)
Operation capacitor
Electrolytic capacitor
(3)
Overload relay
Type
: MRA98929
Minimum operation current : 8 A
(4)
Fan motor for capacitor
Type
: PA2H3
AC fan, 115 V AC, 15 W, 2 poles, class E
: 210 V/20 µF
JSU21 × 206AQC
15 - 4
15.2.4
Refrigerator Wiring Diagram
100 V AC (L)
Cooling unit
100 V AC (N)
Symbol
Part Name
CM
Refrigerator
FM
Fan motor
PM
Pump
PTC
PTC starter
OLR
Overload relay
TH
TC
TC
Temperature regulator
TH
Thermistor
SK
Noise killer
CN
Connector
100 V TH
AC
GND
L
OLR
SK
C3
C
1
2
CM
M
FM
FM
3
4
S
M
PTC
CN
15 - 5
15 - 6
15.3
15.3.1
FDD (YD-702D-6539D-021051)
Specifications
Item
2.0 MB Mode
Recording capacity
• When unformatted
2.0 Mbytes
• When formatted
Capacity:
Number of
sectors
256 bytes/Sector
512 bytes/Sector
1474.6
kbytes
:
18
1024 bytes/Sector
Recording density
17434 bits/inch
Track density
135 tracks/inch
Total number of
cylinders
80 cylinders
Total number of tracks
160 tracks
Recording method
MFM
Recording medium
2HD
Rotational speed
300 r/min
Data transfer speed
500 kbits/s
Mean rotation wait time
100 ms
Access time
• Mean access time
94 ms
•Track-to-track
transition time
3 ms
• Settling time
15 ms
• Turnaround time
4 ms
Motor start time (max.)
0.5 s
15 - 7
15.3.2
Interface
Connector Pin Arrangement for Interface
Return Pin No.
Signal Pin No.
Signal Name
1
2
MODE SELECT
(3)
4
N.C.
5
6
N.C.
7
8
INDEX
9
10
DRIVE SELECT 0
11
12
DRIVE SELECT 1
13
14
N.C.
15
16
MOTOR ON
17
18
DIRECTION SELECT
19
20
STEP
21
22
WRITE DATA
23
24
WRITE GATE
25
26
TRACK 00
27
28
WRITE PROTECT
29
30
READ DATA
31
32
SIDE ONE SELECT
33
34
READY
NOTE: (3) indicates a key pin.
Connector Pin Arrangement for Interface
(FDA)
(Connector for
interface)
Pin 2
Pin 34
Pin 1
Pin 33
Connector Pin Arrangement for DC Power Supply
Pin No.
Power Supply Specification
1
+5 V
2
+5 V RETURN
3
+5 V RETURN
4
NON CONNECTION
15 - 8
15.3.3
Electrical Specifications (F/D interface signal)
F/D Interface Driver/receiver
Host system
Drive 0
Final drive
+5 V
+5 V
1 kΩ
1 kΩ
7438 or equivalent
+5 V
(150 to) 1 kΩ
74LS14 or
equivalent
+5 V
+5 V
5.6 kΩ
5.6 kΩ
Open drain
Cable length 1.5 m (max.)
15 - 9
15.4
15.4.1
Printer (FTP-020UCS530-#01A)
Configuration
This printer consists of mechanical section and driver.
15 - 10
15.4.2
Specifications
(1)
Printing system
: Thermal line-dot system
(2)
Dot formation
: 140 line-dots
(3)
Dot pitch
: 2.8 dots/mm (70 dots/inch, in column direction)
(4)
Number of printing columns : 20 columns (in character mode)
(5)
Character size
: 1.8 (W) × 3 (H) mm......... Normal size (character mode)
3.6 (W) × 3 (H) mm......... Enlarged size (character mode)
(6)
Printing position
: See Fig. 10.
(7)
Printing speed
: 4 lines/sec
(80 characters/sec); Normal size
(40 characters/sec); Enlarged size
46-dot line/sec
(8)
Character composition
: 5 × 7 dots
8 × 17 dots/line
(9)
Character type
: JIS C II (160 types)
Character mode
Graphic mode
Character mode
Graphic mode
(10) Printing lifetime
: 2 million lines (20 million-dot lines) or more
(11) Printing density
: OD level 0.8 or more (when printing on specified paper at
room temperature and drive input voltage 24.7 V)
15 - 11
15.4.3
Interface
(1)
System
: Conforming with Centronics standards (8-bit parallel)
(2)
Transmission speed
(3)
Sync system
: Externally fed strobe pulse
(4)
Handshaking
: ACK/BUSY signal
(5)
Input/output level
: TTL level
(6)
Input/output conditions
: 1000 cps
2000 bps (bytes/second)
Character mode
Graphic mode
• DATA 1 to 8, FEED, INIT
Vcc
4.7 kΩ
• STB
Vcc
4.7 kΩ
1000 PF
• BUSY, ACK, PE, ERROR
Vcc
4.7 kΩ
NOTE: Both Fanin and Fanout are set to "1", 74LS or equivalent is connected on the
host side and a pull-up resistor (4.7 k Ω) is provided in the final stage.
15 - 12
15.4.4
Connectors
Pin No.
Signal Name
Pin No.
Signal Name
1
STB
2
GND
3
DATA 1
4
GND
5
DATA 2
6
GND
7
DATA 3
8
GND
9
DATA 4
10
GND
11
DATA 5
12
GND
13
DATA 6
14
GND
15
DATA 7
16
GND
17
DATA 8
18
GND
19
ACK
20
GND
21
BUSY
22
GND
23
PE
24
GND
25
+5 V
26
INIT
27
NC
28
ERROR
29
FEED
30
GND
Connector (type 700 made by Fujitsu)
PC board
• Power Connector
Pin No.
1
2
3
4
Connector (type 810)
PC board
15 - 13
Description
5 (V)
GND
GND
24 (V)
Cable Color
Red
Black
Black
Orange
15.5
Barcode Reader (CCD system)
15.5.1
Specifications
Type
Reading direction
Light source and light receiving element
Reading distance
Reading bar width
Maximum readable label width
PCS value
Scan frequency
Compatible code
Number of reading digits
Timing input
OK/NG output
Output form
Rated load
Leakage current at
OFF
Residual voltage at ON
Serial interface Standard
Synchronizing method
Transmission code
Baudrate
Data length
Parity check
Stop bit length
Environmental Operating illuminance
conditions
Operating temperature
Operating humidity
Operating atmosphere
Vibration resistance
Insulation resistance
Ratings
Dielectric strength
Power voltage
Current dissipation
Weight
BL-180
Front type
LED and CCD image sensors
33 mm ± 10 mm (for narrow width 0.19 mm or more)
0.125 to 1.0 mm
80 mm (for narrow width 0.19 mm or more)
0.45 or more (reflectance of white 75% or more)
500 scans/sec
CODE 39, ITF, INDUSTRIAL 2 OF 5, COOP 2 OF 5, NW-7,
CODE 128, JAN/EAN/UPC (A·E)
32 digits max.
No-voltage input (with/without contact) * TTL input allowed
NPN open collector
24 V DC, 100 mA
0.1 mA or less
0.5 V or less
Conformity with EIA RS-232C
Asynchronous
ASCII
600 to 38,400 bits/s
7 or 8 bits
No, even or odd
1 or 2 bits
Daylight or incandescent lamp: 10,000 lx,
Fluorescent lamp: 3,000 lx
0 to 40°C
35 to 85% RH (without condensation)
Excessive dust and corrosive gas unallowable
10 to 55 Hz, double amplitude 1.5 mm, in each of X, Y and Z
directions for 2 hours
100 MΩ or more between power terminal and case (when
measured with 500 V DC megger)
1,000 V AC for 1 minute between power terminal and case
5 V DC ± 5%
300 mA
Approx. 165 g
Name of Each Part
OK/NG LED
• For OK output ........... Lit in green
• For NG output ........... Lit in red
STABILITY LED
• Indicates stability of reading.
Cable (2 m long)
15 - 14
Light projection/reception block
LED for light source
• Lights in reading status.
15.6
LCD Touch Panel
15.6.1
Specifications
Item
Rated power supply voltage
Permissible power supply voltage range
Power consumption
Operating temperature
Operating humidity
Operating atmosphere
External dimensions
Weight
Specifications
24 V DC
20.4 to 26.4 V DC (24 V DC -15%, +10%)
10 W or less
0 to 50°C
35 to 85% RH or less, without condensation
Corrosive gas unallowable
190 (W) × 110 (H) × 58 (D) mm
0.7 kg or less
• Specifications of Display Section
Item
STN dot matrix liquid
crystal display panel
Back light (white cold
cathode ray tube)
Indication LED
Number of dots (resolution)
Effective display area
Angle of visibility
Service life
Service life
Automatic turn-off function
POWER (green)
RUN (green)
Specifications
128 × 256 dots (0.407 mm square)
56 × 112 mm
±35° in left-right direction
50,000 hours or longer
Guaranteed for 10,000 hours (average
20,000 hours)
10 min, 1 hr or none
Lit with power supply turned on
Lit during operation
• Specifications of Operating Section
Item
Touch panel
Number of switches :
Input
Activation force
Service life
:
:
:
15 - 15
Specifications
Max. 72 switches registrable on one panel
(Y6 × X12 switches)
Impact system
100 gf or less
1 million times or more
• Specifications of Communication
Item
Communication standard
Communication parameters
Connector
Number of connectable
units
Transmission distance
Specification
EIA RS-232C
Start-stop synchronization
Transmission speed : 2400, 4800, 9600 or 19200 (in bps)
Data length
: 7 or 8 bits
Stop bit
: 1 or 2 bits
Parity
: Even, odd or none
Flow control
: RS/CS control
XON/XOFF control
None
9-pin D-SUB connector (female)
One to one
Max. 15 m
• Setting of DIP Switch
The operational status of NT20S is settable by the DIP switch at the bottom right on the rear face of
main frame.
Switch No.
SW2-1
SW2-2
SW2-3
SW2-4
Function
Factory Setting
Validity or invalidity of forced panel data initialization
NT20S starts in a special operation mode where only the
initialization of panel data memory is carried out. At
ON
startup, the memory initialize menu is displayed.
[OFF] NT20S starts in the usual operation mode.
O
Panel display language mode
ON
Messages are indicated in English.
[OFF] Messages are indicated in Japanese.
O
Permission or prohibition of transition to system menu
System menu cannot be indicated. If an error has occurred
at start, the system menu is automatically indicated, but
ON
O
transition to "transmission mode" cannot be made.
[OFF] System menu can be indicated.
Unused
ON
[OFF]
O
Brackets [ ] indicate the factory setting.
15 - 16
• Wiring
Wire Color
Shield
Purple
Brown
Pink
Blue
Black
Yellow
White
Gray
Red
Symbol
FG
SD (TXD)
RD (RXD)
RS (RTS)
CS (CTS)
GND (SG)
TIM
OK
NG
+5 V
Description
Frame ground
RS-232C data transmission
RS-232C data reception
RS-232C request to send
RS-232C clear to send
Ground (common ground with each signal)
Timing input
OK output
NG output
+5 V power input
Signal Direction
Output
Input
Output
Input
Input
Output
Output
Input
BL-180
+5 V
Red
+
5 V DC
GND Black
• Pin Arrangement
5 4 3 2 1
D-sub 9 pins (female)
DTE specifications (terminal definition)
#4-40 screw (male)
9 8 7 6
Pin No.
Connector
case
1
2
3
4
5
6
7
8
9
Symbol
FG
TIM
RD (RXD)
SD (TXD)
OK
GND (SG)
NG
RS (RTS)
CS (CTS)
+5 V
Description
Signal Direction
Frame ground
Timing input
RS-232C data reception
RS-232C data transmission
OK
Ground (common ground with each signal)
NG
RS-232C request to send
RS-232C clear to send
+5 V power supply
15 - 17
Input
Input
Output
Output
Output
Output
Input
Input
• Connecting Procedure
Described below is the method of connecting NT20S and host with RS-232C.
< Connector Pin Arrangement of NT20S >
The connector has the following specifications.
• Electrical characteristics : Conform with EIA RS-232C.
• Connection signals
: Signal direction is as seen from the host side.
6
1
9
5
Connector
Pin No.
1
2
3
4
5
9
NOTES:
Signal Name
Symbol
Protective ground or ground
Transmitted data
Received data
Request to send
Clear to send
Signal ground
1.
2.
FG (Note 1)
SD (TXD)
RD (RXD)
RS (RTS)
CS (CTS)
SG (GND)
FG is not connected inside NT.
The pin without entry is not used.
15 - 18
Signal Direction
Input
Output
—
—
O
O
O
O
—
—
16.
SYSTEM INTERFACE
16.1
Overview................................................................................................................16-1
16.2
Communications Functions....................................................................................16-4
16.3
Frames...................................................................................................................16-7
16.4
Data Transmission Control Procedure ...................................................................16-9
16.4.1
Establishment of Data Link ....................................................................16-9
16.4.2
Response to Information ........................................................................16-9
16.4.3
Response to Information Message .........................................................16-10
16.4.4
Termination and Restart of Communication...........................................16-16
16.4.5
Priority....................................................................................................16-17
16.4.6
RESULT ONLY Mode ............................................................................16-17
16.4.7
Retry of Communication.........................................................................16-18
16.5
Status Transition ....................................................................................................16-19
16.5.1
Status Transition Matrix (only in mon-transfer of analytical data alone).16-19
16.5.2
Status Transition Matrix (in transfer of analytical data alone).................16-21
16.5.3
Status Transition Diagramm (analytical data).........................................16-23
16.6
Text Configuration Table........................................................................................16-24
16.6.1
Composition of Each Text......................................................................16-25
16.6.2
Contents of Text.....................................................................................16-38
16.7 Error Check Function ................................................................................................16-42
16.8
Specification of Communication Trace...................................................................16-43
16.8.1
Overview ................................................................................................16-43
16.8.2
Trace Data .............................................................................................16-43
16.8.3
Trace Data Storage Timing ....................................................................16-43
16.8.4
Resetting of Trace Data .........................................................................16-44
16.8.5
Trace Data Storage Capacity .................................................................16-44
16.8.6
Other ......................................................................................................16-44
16.9
Hardware Specifications ........................................................................................16-44
16.9.1
Overview................................................................................................16-44
16.9.2
RSDIST PC Board .................................................................................16-45
16.9.3
Interface Signal ......................................................................................16-47
16.9.4
RS-232C Comunication .........................................................................16-48
16.9.5
Current Loop ..........................................................................................16-50
16.9.6
Communicator Monitor ...........................................................................16-50
16.9.7
Data Alarm Code List .............................................................................16-51
16 - 0
16.10 Cautions on Connection with External System ......................................................16-53
16.11 Operation Flow Diagramm .....................................................................................16-54
16.12 Supplementation ....................................................................................................16-55
16.12.1 Glossary .................................................................................................16-55
16.12.2 Differences in Communication Specification between Conventional
Analyzers and Model 902 .......................................................................16-57
16.12.3 Processing Flow Diagramm of System Interface....................................16-59
16.12.4 ASCII Code Tables ................................................................................16-60
16 - 0
16. SYSTEM INTERFACE
16.1
Overview
Provided here are the signal form and protocol (communication rules) in case of connection
between the Model 902 and an external system (hereafter referred to as a host) via
asynchronous serial signal.
(1)
Specifications of Communication
The following table lists the specifications of RS-232C communication.
Table 16-1 Specifications of Communication
No.
Item
1
Interface
2
Communication
method
Data bit
Stop bit
Parity check
Baud rate (bit/sec)
Max. volume of
transferred data
End-of-data code
3
4
5
6
7
8
9 Code
10 Synchronization
system
11 Transmission
control procedure
12 Number of ports
13 Text mode
14 Cable length
(2)
Specifications
RS-232C or 20 mA current
loop
Half duplex
7 or 8 bits
1 bit/2 bits
Even/odd/no parity
4800/9600 NOTE
256/512 bytes
ETX + BCC/CR + LF +
ETX/ETX
ETX + CR + LF
ETX + CKSH + CKSL + CR
JIS 7 bits, JIS 8 bits or ASCII
Asynchronous system
(Start-stop transmission)
Determined by host
1 max.
Nontransparent mode (ASCII)
15 m max. (RS-232C)
Remarks
Default Value
(standard value)
Communication
parameter screen
7 bits
2 bits
Even parity
9600
256
ETX + BCC
Features
(a) The communication cycle is not synchronized with the analysis cycle. So the
analyzer replies upon receiving a response from the host.
(b) The data bit, stop bit, parity check, baud rate, maximum volume of transferred data
and end-of-data code are selectable by the user.
16 - 1
(3)
Outline of Text
The format of communication text is shown below.
Transfer sequence
End-of-data code (1 to 4 characters)
Data field (variable)
Frame character (1 character)
Start-of-data code (1 character)
Each block of text is detailed below.
(a)
(b)
(c)
(d)
Start-of-data code (1 character)
STX code (ASCII code $02)
Frame character (1 character)
Refer to Table 16-3.
Data field (variable)
(i)
When there is no data field (non-specific request text)
There is no data field because MOR, ANY, REP, SUS and REC are control
frames.
(ii) When there is a data field (specific request text)
Frames other than in (i) above. The data field includes a function character.
End-of-data code (1 to 4 characters)
Any of the following five combinations is selectable on the host setting screen.
(i)
ETX + BCC (NOTE 1) ....................................(ASCII code $03 + BCC)
(ii) CR + LF + ETX................................................(ASCII code $0D + $0A + $03)
(iii) ETX ................................................................. (ASCII code $03)
(iv) ETX + CR + LF................................................(ASCII code $03 + $0D + $0A)
(v) ETX + CKSH + CKSL (NOTE 2) + CR ............(ASCII code $03 + h + l + $0D)
The text length from (a) to (d) is selectable on the communication parameter screen. (256
or 512 bytes)
16 - 2
NOTES:
1. BCC (Block Check Character)
The RS-232C communication program is provided with a function to add BCC to
the send text and support BCC check of the receive text for detection of an
improper message.
• Condition (1):
The start-of-text character is STX (02)16 and the end-oftext character is ETX (03)16.
• Condition (2):
The text data consists of characters (nontransparent
mode).
At this time, BCC accumulation is started from the character following STX and
carried out until ETX appears.
[Calculation Method]
Dn = n-th character in hexadecimal notation (1 byte)
BCC = Block check character (1 byte)
BCC = D1 + D2 + D3 + Dj + ...Dn + (ETX)16
(+: Exclusive OR)
2.
CKSH (checksum high) and CKSL (checksum low)
The checksum is calculated by adding all characters between the frame
character and the final character in the data field (one character before end-ofdata code), and the lower two digits of the calculated checksum are converted
to the ASCII code.
Example:
16 - 3
16.2 Communication Functions
(1)
Tables 16-2 and 16-3 list the host communication functions provided with the Model 902
Automatic Analyzer.
Table 16-2 Communication Function List for Test Selecting Information
(A): Analyzer side (H): Host side
Inquiry from Instruction from
Conditions
(A) to (H)
(H) to (A)
Function
Test selecting
With ID
information inquiry
communication on
routine sample
Stat sample
O
O
Without ID
With ID
O
O
O
×
Without ID
×
×
Valid when [NO] is specified
for the transfer of analytical
data alone on the
communication parameter
screen.
Same as above
Valid when [NO] is specified
for the transfer of analytical
data alone and [YES] is
specified for stat sample test
selection.
Table 16-3 Communication Function List for Measurement Result Data
16 - 4
Supplementary Explanation
(a) The above real-time communication indicates a communication carried out while the
instrument is engaged in analysis, and the batch communication indicates a
communication when specified through the screen.
(Note, however, that test selecting information inquiry is not specifiable through the
screen but specifiable only from the host.)
(b) To stop communication between the analyzer and host, change [RUN] (highlighted)
to [CANCEL] for host communication on the start condition screen. In this case,
however, remember that the entire communication processing will be suspended.
(c) Stat sample test selecting information is specifiable from the host, in response to
inquiry from the analyzer during real-time communication. However, an
independent specification from the host is invalid.
16 - 5
16 - 6
16 - 7
16 - 8
16.4 Data Transmission Control Procedure
16.4.1 Establishment of Data Link
(1)
Upon input of [YES] for host communication on the start condition screen, the analyzer
side transfers ANY frame to the host. This marks the start of communication.
(2)
Once a text has been sent, the direction of transmission is reversed and the receiver can
send the next response or text. In subsequent steps, the analyzer and host continue
transmission alternately.
Communication cycle
T: Text (contents of message)
Transfer sequence
Analyzer
HOST
Conversation
T
T
T
T
T
Cluster
16.4.2 Response to Information
(1)
Upon receiving information, the receiver sends a response or text (see Table 16-4) to
inform the sender of the receiver status and the validity of received information.
(2)
Used for response is a text in which a character identifying its purpose (frame character) is
put between STX and ETX. When the 256-byte mode is selected for the transferred byte
count, the analytical data text may exceed 256 bytes (including STX and end-of-data
code) depending on sample. In this case, the text is analyzed, the analyzed text is put
between STX and ETX and a frame character to identify the number of transmissions is
added in the text.
(3)
After sending a text, sending should be avoided until reception of a response or request
to/for the text in a normal condition. If sending is attempted, the analyzer side ignores it.
(Trace will not be made either.)
If no response is returned or an invalid response is received, the recovery procedure is
executed. In case of sending from the host, it must always be kept ready for receiving.
(4)
If the host did not return a response in the communication cycle (NOTE) on
communication from the analyzer, alarm is displayed on the screen of analyzer.
NOTE:
Time period is changeable on the communication parameter screen. It is defaulted to
2 sec.
16 - 9
16.4.3 Response to Information Message
Described below are the typical procedure for returning a response to the information message
and the procedure upon receiving the response.
(1)
(2)
(3)
(4)
(5)
(1)
When there is no information to be sent (analyzer ↔ host)
Transfer of communication control message (analyzer ↔ host)
Transfer of test selecting information (analyzer ↔ host)
Transfer of analytical data (analyzer → host)
Resending request (analyzer ↔ host)
When there is no Information to be Sent (analyzer ↔ host)
Communication
cycle or longer
(NOTE 2)
Within communication
cycle (NOTE 2)
Transfer sequence
Analyzer
MOR
HOST
ANY
ANY
ANY
MOR
The analyzer continues returning the ANY frame in response to the MOR frame from the
host so as to respond to the request from the host at any time even when the analyzer
and host have no information to be sent (NOTE 1).
In this case, the analyzer sends the ANY frame at one communication cycle or longer
(NOTE 2) after receiving the MOR frame from the host (at time point when the final endof-data code is recognized).
NOTES:
1.
When the following conditions are satisfied:
(a) There is no test selecting information to be sent to the host.
(b) Analytical data is not output in the real-time mode.
(c) There is no request for the RES frame.
(d) Specification through the screen is not made.
2.
This time period is changeable on the communication parameter screen.
Default value is 2 sec.
16 - 10
(2)
Transfer of Communication Control Message (analyzer ↔ host)
Analytical data request
Analyzer
FR1
ANY
ANY
Analytical
data transfer
RES
HOST
MOR
MOR
Positive response
The RES, ANY, MOR, REP, SUS and REC frames are available for the communication
control messages.
For details, refer to Table 16-4.
(a) RES frame
The host can make a request to the analyzer side (just called "analyzer" hereafter)
for analytical data of a specific sample by use of the RES frame. However, the
analyzer sends the ANY frame in the following cases.
(i) The analyzer has no relevant data.
(ii) FD error occurs during access to the relevant sample data.
Data is transferred in the received sequence, starting from completion of
transmitting the measurement result data in real-time mode.
The analyzer is capable of storing data of up to 10 routine samples in each of ID
mode and sample No. mode. That is, data of more than 11 samples is ignored.
The analyzer does not transfer measurement data in case of sending from the host
in the sample No. mode (without ID) though ID is provided.
If transferring the RES frame from the host when FD is occupied by a factor, the
presence or absence of an FD error is checked with the relevant factor terminated.
The result of FD error check is described below. During this process,
communication is in the event occurrence status.
1) If FD error is absent ................................... RES frame is transferred.
2) If FD error is present ................................. RES frame is not transferred.
When interruption is cased by RES frame during batch transfer, a batch-specified
sample may be transferred before one sample because FD access time is allowed.
In this case, after the text for one batch-specified sample is transferred, the RES
frame will be transferred.
(3)
Transfer of Test Selecting Information (analyzer ↔ host)
Analyzer
HOST
SPE
A
Response from host
Frame A
Description
SPE
MOR
To return test selecting information for a sample sent from analyzer
To indicate that host cannot respond to test selecting information inquiry but is
ready to receive analytical data
To suspend communication with analyzer for the specified period of time because
host cannot respond to test selecting information inquiry nor receive analytical
data
REC
16 - 11
Difference in Transfer between SUS and REC Frames
(a)
In sending from host
Same text
Analyzer
Transfer sequence
FC=2
ANY
FC=2
SUS
HOST
MOR
Analyzer
(b)
ANY
MOR
FC=END
REC
HOST
FC=END
Same text is transferred after
the first MOR reception.
Sample No. = 1
Sample No. = 1
FC=2
(FC: Frame
character)
MOR
After MOR reception, not the same text
but the next analytical data text is
transferred. If text FC = 2 is the same
as FC = END, the analytical data text
of the next sample is transferred.
In sending SUS frame from analyzer
Example 1:
REP frame is returned for ANY frame from the analyzer.
Transfer sequence
Analyzer
SUS
ANY
REP
REP
HOST
SPE
Other than REP
(Example 1)
Example 2: An error occurred on response to ANY frame from the analyzer.
Transfer sequence
Analyzer
ANY
SPE
SUS
HOST
Text not followed
(occurrence of error)
Other than REP
(including occurrence of error)
(Example 2)
16 - 12
(4)
Transfer of Analytical Data (analyzer → host)
The analyzer can send analytical data to the host only when the host has transferred the
MOR frame to the analyzer.
(a)
Transmission procedure in normal case
Transfer sequence
Analyzer
ANY
A
B
MOR
HOST
Positive response
Response from analyzer
Frame A
FR1 to END
Description
Analytical data (including calibration result and absorbance data in entire
reaction process)
Response from host
Frame B
REP
MOR
REC
SUS
SPE
RES
(b)
Description
When text in A is abnormal
To receive analytical data next time as well
To avoid reception of analytical data next time
To suspend communication
To specify test selection
To request a specific sample
Transmission procedure in special case
Even if the host sends any other frame than MOR while the analyzer is transferring
a sample having 2 or more tests to the host, the analyzer responds to the relevant
frame and resumes sending from a succeeding text upon receiving the MOR frame.
Transfer sequence
FR1
Analyzer
HOST
Same sample
MOR
Effect of this system: (1)
(2)
ANY
SPE
FR2
MO
R
END
MOR
No delay for SPE
Identifiable by host because sample identifying
information is provided for each text
16 - 13
(5)
Resending Request (analyzer ↔ host)
Resending is requested if there is any abnormality in the contents of the text received
from the opposite side or to request the same text again for some reason.
(a)
From analyzer to host
Occurrence
of error
Analyzer
Resending request
REP
ANY
Positive
response
SPE
SPE
HOST
Same text
(b)
From host to analyzer
Resending request
Analyzer
SPE
SPE
Test selection
directive
Occurrence
of error
(c)
SPE
REP
HOST
Test selection
inquiry
For resending with other than REP
Suspection
request
Analyzer
Same text
ANY
END
END
Analytical data
transfer
HOST
A
Analytical data
transfer
MOR
Positive response
Frame A
Description
SUS
Sent from host when it wants analyzer to suspend communication for the
specified time. In this case, the analyzer judges that host could not receive
the text for some reason, and when communication is restored (MOR frame
is sent from host), the finally sent text, if it is an analytical data text, is resent
to restart communication.
Sent from host when it wants analyzer to suspend communication for the
specified time. In this case, the analyzer judges that host could receive the
analytical data text normally and the analytical data text is not resent after
reception of MOR frame.
REC
16 - 14
Basic Control Procedure
HOST
Analyzer
[Events on analyzer side]
[RUN] (highlighted) →
[CANCEL] for host
communication
parameter on start
condition screen
[Events on host side] [State of communication]
ANY
MOR
Communication start
ANY
MOR
SPE
SPE
SPE
SPE
TS request
SPE
SPE
ANY
MOR
First data transfer for
sample No. 1
Final data transfer for
sample No. 1
FR1
MOR
Analytical
data request
END
MOR
ANY
Analytical
data transfer
MOR
ANY
RES
ANY
Analytical data transfer for
sample No. 5
MOR
END
REP
END
MOR
Analytical data
request for
sample No. 5
Resending
request
ANY
MOR
ANY
MOR
[RUN] (highlighted) →
[CANCEL] for host
communication
parameter on start
condition screen
Neither analyzer
nor host has data
to be transferred.
Communication stop
Contents of Each Frame
Contents
SPE
SPE
FR1, END
RES
REP
16 - 15
TS request for one specific sample
TS response for one specific sample
Analytical data transfer
Analytical data request for specific sample
Resending request
16.4.4 Termination and Restart of Communication
Table 16-5 shows the conditions for termination and restart of this protocol.
Table 16-5 Termination and Restart of Communication
O: Communication stopped
×: Communication continued
Real-time
Communication
Batch
Communication
Change from [YES] to [NO] or
in [NO] for host communication
parameter on start condition
screen
×
×
Occurrence of send/receive
time-out error
Occurrence of hardware error
alarm related to communication
Occurrence of FD read error
during sending of analytical
data to host
O
O
Change from [NO] to [YES] for
host communication
parameter. Restart is made
with previous contents of
communication all canceled.
Same as above (NOTE 2)
O
O
Same as above (NOTE 2)
O
×
Specification of stop through
screen during batch sending of
analytical data to host
Occurrence of FD read error
during transfer of analytical
data for specific sample
request to host
Detection of error in text such
as BCC error or discrepancy in
end-of-data code between
analyzer and host
Occurrence of E.STOP-level
alarm on analyzer side
O
Remaining samples in
specified range are not sent.
On restart, samples in newly
specified range are sent.
Same as above
Conditions for Termination
NOTES:
1.
2.
×
Restart of Communication
(NOTE 1)
Relevant sample alone is
canceled.
O
O
O
O
O
O
Transfer of measurement result data is stopped regardless of the kind of sample (routine
or control).
Retry processing is executed up to the specified number of retry times. In excess of the
specified number, communication is stopped.
16 - 16
16.4.5 Priority
When multiple processings concur in response to a request from the host, the analyzer assigns
priority to them for returning its response to the host.
However, batch communication is suspended in units of text for transferring to the host the text
which has a higher priority than batch communication when it interrupts batch communication
under execution (restricted to the cases where analytical data in the real-time mode is output
from analyzer and analytical data alone is transferred in response to RES frame).
(Discrimination between real-time communication data and batch communication data depends
on the function frame.)
Then, batch communication is restarted.
Table 16-6 gives the details of each frame and the priority.
Table 16-6 Details of Each Frame and Priority
Priority
1
2
3
4
5
6
Item
Sending of SPE (stat sample)
Sending of SPE (routine sample) frame
Sending of REP (resending request) frame
Sending of analytical data in response to RES from host (transfer of data read from FD)
Sending of higher-priority analytical data (transfer of data read from FD)
Sending of lower-priority analytical data (analytical data in real-time communication)
16.4.6 RESULT ONLY Mode
In this mode, only the measurement result data is transferred to the host. This mode does not
accept a resending request (REP frame) from the analyzer or host and a specific sample data
request. When [YES] is set for "transfer of analytical data alone" on the communication
parameter screen, the analyzer returns response to neither test selecting inquiry for routine/stat
samples nor specification of test selection from the host.
The analyzer waits for 1 sec or more after sending ETX in the analytical data text and proceeds
to transfer to the host regardless of the communication procedure.
Transfer
sequence
STX
Text
ETX
1 sec or more
Text: Analytical data text
BCC
STX
16 - 17
Text
ETX
BCC
16.4.7 Retry of Communication
Retry is a function for resending the text sent from the analyzer to the host immediately before
occurrence of any communication error.
(1)
Retry Due to Time-Out
(a)
Reception time-out
If response is not received beyond the response wait time limit (NOTE 1) after
sending a text from the analyzer, reception time-out occurs and retry is made.
When the number of retries (NOTE 2) exceeds the maximum number of retries
allowed for time-out (NOTE 3), communication will be suspended.
(b)
Transmission time-out
If a text cannot be sent from the analyzer, transmission time-out occurs and retry is
made after one communication cycle or longer. When the number of retries (NOTE
2) exceeds the maximum number of retires allowed for time-out (NOTE 3),
communication will be suspended.
NOTES: 1.
2.
3.
(2)
Time period is changeable by retry time entry on the communication
parameter screen.
The number of retries made consecutively
Retry time is changeable by entry for the number of retries on the
communication parameter screen.
Retry Due to Communication Error
If a communication error (NOTE 4) occurs, retry is made immediately before the end of
current communication cycle. When the number of retries (NOTE 5) exceeds the
maximum number of retries allowed before communication error (NOTE 6), the relevant
resent data will be canceled and the next text will be sent.
NOTES: 4.
5.
6.
Hardware error or text error
The number of retries made consecutively
Same as in (NOTE 3) of (1) above
16 - 18
16.5 Status Transition
16.5.1 Status Transition Matrix (only in non-transfer for analytical data alone )
Table 16-7
Event from Analyzer
Event
No.
Status
in Analyzer
Host
comm.
Param.
[N] → [Y]
Event from Host
Host
comm.
Param.
[Y] → [N]
TS Inquiry
Req. (TS
managem’t
task
Real-time
Data Out
from 902
Transfer
Req. for
Specific
Sample
Batch
Transfer
Req. from
Screen
Cancel
or FD
Error
MOR (analytical data req.)
Data of 2 or
More Samples
Final Data
REP
(resending
req.)
SUS
(suspension
req.)
REC
(suspension
req.)
SPE
(TS
specification)
RES (specific
sample req.)
Time-out/
Hardware
Error
Error in
Text
ANY
transfer/2
1
Initial status ([NO]
for host
communication
parameter)
2
Idling (no data to
be transferred on
analyzer and host
sides)
1
6
3
4
4
ANY transfer/2
Previous
frame/2
ANY transfer/2
ANY transfer
after SPE
save/2
ANY transfer
after RES
save/4
17
REP
transfer/18
3
LPR transfer wait
(before LPR
tansfer)
1
7
3
5
5
LPR transfer/10
Previous
frame/3
ANY transfer/3
ANY transfer
after SPE
save/3
ANY transfer
after RES
save/5
17
REP
transfer/18
4
HPR transfer wait
(before HPR
transfer)
1
8
5
4
4
2
HPR transfer/11
Previous
frame/4
ANY transfer/4
ANY transfer
after SPE
save/4
ANY transfer
after RES
save/4
17
REP
transfer/18
5
HPR/LPR transfer
wait (before
HPR/LPR
transfer)
1
9
5
5
5
3
HPR transfer/12
Previous
frame/5
ANY transfer/5
ANY transfer
after SPE
save/5
ANY transfer
after SPE
save/5
17
REP
transfer/18
6
SPE transfer wait
(before SPE
transfer)
1
SPE (current
TS)/13
7
8
8
SPE transfer/13
SPE
transfer/13
SPE transfer/13
SPE transfer
after SPE
save/13
SPE transfer
after RES
save/15
17
REP
transfer/18
7
SPE/LPR transfer
wait (before
SPE/LPR transfer)
1
SPE (current
TS)/14
7
9
9
6
SPE transfer/14
SPE
transfer/14
SPE transfer/14
SPE transfer
after SPE
save/14
SPE transfer
after RES
save/16
17
REP
transfer/18
8
SPE/HPR transfer
wait (before SPE/
HPR transfer)
1
SPE (current
TS)/15
9
8
8
6
SPE transfer/15
SPE
transfer/15
SPE transfer/15
SPE transfer
after SPE
save/15
SPE transfer
after RES
save/15
17
REP
transfer/18
9
SPE/HPR/LPR
transfer wait
(before SPE/HPR/
LPR transfer)
1
SPE (current
TS)/16
8
9
9
7
SPE transfer 16
SPE
transfer/16
SPE transfer/16
SPE transfer
after SPE
save/16
SPE transfer
after RES
save/16
17
REP
transfer/18
10
Ready for LPR
transfer
1
7
10
12
12
11
Ready for HPR
transfer
1
8
12
11
11
12
Ready for HPR
transfer
LPR transfer wait
1
9
12
12
12
13
Ready for SPE
transfer
1
SPE (current
TS)/13
14
15
15
LPR transfer/10
LPR
transfer
(final)/2
Previous
frame/10
ANY transfer/10
ANY transfer
after SPE
save/10
ANY transfer
after RES
save/12
17
REP
transfer/18
2
HPR transfer/11
HPR
transfer
(final)/4
Previous
frame/11
ANY transfer/11
ANY transfer
after SPE
save/11
ANY transfer
after RES
save/11
17
REP
transfer/18
10
HPR transfer/12
HPR
transfer
(final)/10
Previous
frame/12
ANY transfer/12
ANY transfer
after SPE
save/12
ANY transfer
after RES
save/12
17
REP
transfer/18
ANY transfer
after SPE
save/6
ANY transfer
after RES
save/15
17
REP
transfer/18
SPE transfer/6
16 - 19
(cont’d)
Event from Analyzer
Event
No.
Status
in Analyzer
Host
comm.
Param.
[N] → [Y]
Host
comm.
Param.
[Y] → [N]
TS Inquiry
Req. (TS
managem’t
task
Real-time
Data Out
from 902
Event from Host
Transfer
Req. for
Specific
Sample
Batch
Transfer
Req. from
Screen
Cancel
or FD
Error
RES (specific
sample req.)
SPE transfer/3
ANY transfer
after SPE
save/3
ANY transfer
after RES
save/16
17
REP
transfer/18
Da ta of 2 or
M ore Sa m ples
Fina lDa ta
REP
(resending
req.)
SUS
(suspension
req.)
REC
(suspension
req.)
Time-out/
Hardware
Error
Error in Text
SPE
(TS
specification)
M OR (a na lytica lda ta req.)
14
Ready for SPE
transfer
LPR transfer wait
1
SPE (current
TS)/14
14
16
16
15
Ready for SPE
transfer
HPR transfer wait
1
SPE (current
TS)/15
16
15
15
13
SPE transfer/4
ANY transfer
after SPE
save/4
ANY transfer
after RES
save/15
17
REP
transfer/18
16
Ready for SPE
transfer
HPR/LPR transfer
wait
1
SPE (current
TS)/16
16
16
16
14
SPE transfer/5
ANY transfer
after SPE
save/5
ANY transfer
after RES
save/16
17
REP
transfer/18
17
Alarm registration
(communication
stopped)
Alarm display/registration
Communication parameter [RUN] (highlighted) → [CANCEL] To No. 1
Alarm registration
(communication
continued)
Alarm display/registration
18
FR/Value FR
Value
LPR
HPR
:
:
:
:
:
NOTE: Upon reception of the SUS or REC frame, each frame is sent after waiting for the specified time.
To previous status
Ignored
Processing or contents of text to be sent to host
Number of status to which transition is made
Analytical data transfer in real-time communication
Analytical data transfer in response to specific sample request (RES), batch transfer specified through screen
16 - 20
16.5.2 Status Transition Matrix (in transfer of analytical data alone)
Table 16-8
Event from Analyzer
Event
No.
1
Status
in Analyzer
Initial status ([NO]
for host
communication
parameter
Host
comm.
Param.
[N] → [Y]
Host
comm.
Param.
[Y] → [N]
TS Inquiry
Req. (TS
managem’t
task
Real-time
Data Out
from 902
Event from Host
Transfer
Req. for
Specific
Sample
Batch
Transfer
Req. from
Screen
11
11
Cancel
or FD
Error
To 2
(status)
2
Idling (no data to
be transferred on
analyzer and host
sides)
3
LPR transfer wait
(before LPR
transfer)
4
HPR transfer wait
(before HPR
transfer)
5
HPR/LPR transfer
wait (before HPR/
LPR transfer)
6
SPE transfer wait
(before SPE
transfer)
7
SPE/LPR transfer
wait (before
SPE/LPR transfer)
8
SPE/HPR transfer
wait (before
SPE/HPR transfer)
9
SPE/HPR/LPR
transfer wait
(before SPE/HPR/
LPR transfer)
10
Ready for LPR
transfer
To 1
To 10
after HPR
transfer
To 12
after
HPR
transfer
To 12
after HPR
transfer
11
Ready for HPR
transfer
To 1
To 12
after HPR
transfer
To 11
after
HPR
transfer
To 11
after HPR
transfer
To 2
immediately
12
Ready for HPR
transfer
LPR transfer wait
To 1
To 12
after HPR
transfer
To 12
after
HPR
transfer
To 12
after HPR
transfer
To 10
after
HPR
transfer
13
Ready for SPE
transfer
14
Ready for SPE
transfer
LPR transfer wait
1
10
16 - 21
M OR (a na lytica lda ta req.)
Da ta of 2 or
M ore Sa m ples
Fina lDa ta
REP
(resending
req.)
SUS
(suspension
req.)
REC
(suspension
req.)
SPE
(TS
specification)
RES (specific
sample req.)
Time-out/
Hardware
Error
Error in Text
(cont’d)
Event from Analyzer
Event
No
15
Status
in Analyzer
Host
Comm.
Param.
[N] → [Y]
Host
Comm.
Param.
[Y] → [N]
TS Inquiry
Req. (TS
managem’t
task)
Real-time
Data Out
from 902
Event from Host
Transfer
Req. for
Specific
Sample
Cancel
or FD
Error
M OR (a na lytica lda ta req.)
Da ta of 2 or
M ore Sa m ples
Fina lDa ta
REP
(resending
req.)
Ready for SPE
transfer
HPR transfer wait
16
Ready for SPE
transfer
HPR/LPR transfer
wait
17
Alarm registration
(communication
stopped)
Alarm display/registration
Communication parameter [RUN] (highlighted) → [CANCEL] To No. 1
Alarm registration
(communication
continued)
Alarm display/registration
18
Batch
Transfer
Req. from
Screen
NOTE: Ignore the blank boxes in this table.
To previous status
16 - 22
SUS
(suspension
req.)
REC
(suspension
req.)
SPE
(TS
specification)
RES (specific
sample req.)
Time-out/
Hardware
Error
Error in
Text
(NOTE)
16 - 23
16.6 Text Configuration Table
Table 16-9 shows the text configuration corresponding to the contents of each frame.
Table 16-9 Text Configuration Corresponding to Contents of Each Frame
Text Type
Text to indicate
feature of
communication
Text Item
Positive response
Relevant
Frame
ANY
Maximum Number
of Characters
4
MOR
Sender
Contents of Text (Fu: Function character)
Reference
Page
Analyzer
Holder
STX
>
ETX
BCC
Negative response
(resending request)
REP
4
Analyzer
HOST
STX
?
ETX
BCC
Suspension
request
SUS
4
Analyzer
HOST
STX
@
ETX
BCC
REC
4
HOST
STX
A
ETX
BCC
Analytical data
request for specific
sample
RES
40
HOST
STX
<
Fu
Sample information
ETX
BCC
Test selection
inquiry text
Inquiry request
SPE
40
Analyzer
STX
:
Fu
Sample information
ETX
BCC
Test selection
specifying test
Specification
request
SPE
Variable
HOST
STX
:
Fu
Sample information
Channel count
Analytical data
text
Routine, stat and
control samples
FR1 to END
Variable
Analyzer
STX
:
Fu
Sample information
Channel count
Absorbance data
inentire reaction
process
FR1 to END
Variable
Analyzer
STX
:
Fu
Sample information Analytical data 1 ... analytical data 4 BLANK1 ... BLANK4 Point count ABS1 ... ABS35 ETX BCC
Photometry-assay
calibration
END
Variable
Analyzer
STX
:
G
Text No. STD count
ISE calibration
END
Variable
Analyzer
STX
:
H
ISE type Total alarms ISE calibration data ETX BCC
Comment presence
information
Analytical data of 50 tests
Calibration alarm STD data 1 ... STD data 6
Supplementary Explanation
1.
Table 16-9 shows the text configuration when text size is 512 bytes.
When a text size of 256 bytes is specified for analytical data text, two or more texts may be constituted. So refer to the description concerned.
2.
Since there are 4 end-of-data codes besides ETX alone, attention should be paid when setting or referring to a text.
16 - 24
Test selecting
information
EXT
BCC
EXT
BCC
SD value information ETX BCC
16.6.1 Composition of Each Text
(1)
Text for Non-Specific Request (text having no data area)
(a)
Composition of text
STX
(b)
FR
ETX
(FR: Frame character)
Table 16-10 shows the frame name and frame character according to the sending
direction.
Table 16-10
Frame
Name
Frame Character
From Analyzer to Host
>
O
×
×
O
?
O
O
@
O
O
A
×
O
ANY
MOR
REP
SUS
REC
O: Sent
(2)
From Host to Analyzer
×: Not sent
RES: Text of analytical data request for specific sample (from host to analyzer)
(a)
Composition of text
STX
(b)
<
Fu
Sample information
ETX
(Fu: Function character)
Table 16-11 shows the contents of the text. Note that alarm is issued on the
analyzer side if any other than routine and stat sample information (control sample
or calibration information) is sent from the host to analyzer.
"Ignored" in the table means that the analyzer ignores relevant sample information
even if it is specified by the host.
Table 16-11
Function Character
From
Sampl With/
Without ID Analyz
e
er to
Sample Information
From Host to Analyzer (For "from analyzer
From
to host," refer to (5) below.)
Host to
Position
ID No.
Analyz Sample No.
No.
Routine
sample
With
a
a
Routine
sample
Stat
sample
Without
n
n
With
d
d
Stat
sample
Without
g
g
16 - 25
Ignored
Sample No.
set (1 to 400)
Sample No.
set (1 to 50)
ID No. set
(blank
unallowable)
Ignored
ID No. set
(blank
unallowable)
Ignored
(3)
SPE: Text for test selecting information inquiry (from analyzer to host)
(a) Composition of text
STX
;
Fu
Sample information
ETX
(Fu: Function character)
(b)
(c)
(d)
(e)
(f)
(g)
(h)
(4)
Contents of text
For the contents of text, refer to "16.6.2 Contents of Text."
Text type
Text for a routine or stat sample alone is sent.
Condition for inquiry to host
1) When test selection on the analyzer side includes a sample for which no test is
requested (provided [YES] is specified for full-time inquiry)
2) When an ID read error has occurred with the barcode reader is provided. At
this time, ID No. becomes blank.
Condition for rejecting inquiry to host
[YES] is specified for the transfer of analytical data alone on the communication
parameter screen.
Whether test selection inquiry is made to the host for every sample or only when no
test is selected on the analyzer side is selectable by the full-time inquiry parameter
on the communication parameter screen.
1) When [YES] is specified for full-time inquiry, inquiry is made regardless of test
selecting registration on the analyzer side.
2) When [NO] is specified for full-time inquiry, inquiry is made only when test
selection on the analyzer side includes a sample for which no test is requested.
When [YES] is specified for the original Abs., test selection inquiry is not made to
the host.
At inquiry in the real-time mode with or without ID, a sample No. is added. (Sample
information is detailed below.)
1) Items to be set with ID ..............Sample No., position No., ID No.
2) Items to be set without ID ........Sample No., position No., ID No. (treated as
comment) (allowed even if inquiry ID is different)
SPE: Specification of test selection (from host to analyzer)
(a) The composition of SPE text is shown below. For the contents of text, refer to
"16.6.2 Contents of Text."
STX
(b)
(c)
(d)
(e)
(f)
;
Fu
Sample information
Channel
count
Test selecting
information
Space (5)
ETX
BCC
Test selecting information request from the host will correspond to sample
information sent upon test selection inquiry. If not, however, it is taken into the
analyzer and inquiry is not made again.
If a time-out error, hardware error or any other error occurs, the relevant sample is
considered to have not been received and is ignored after occurrence of the alarm.
When no request is made for all of the test selecting information received on the
host side, it is registered that none is requested.
When the barcode reader is provided, the analyzer ignores the sample No. of
routine sample even if it is sent from the host.
Even when the same ID No. is transferred to the analyzer multiple times with the
barcode reader provided, registration will be made in response to position No.
16 - 26
(g)
(h)
(i)
(j)
Where the barcode reader is not provided, a test selection response from the host to
the real-time inquiry should be made within two cycles (= 36 seconds). If this period
of time is exceeded, the analyzer does not accept the test selection request.
Unless the barcode reader is provided, the same position No. as on the analyzer
side is set and transferred.
Specification of test selection made from the host is ignored if the analyzer is set in
the original Abs. mode. In test selection, priority is given to the analyzer side.
Sample No., position No. and ID No. sent from the host may become invalid
depending on the mode of analyzer.
O: Host's specification followed
Sample
Routine
sample
Stat
sample
With or
Without ID
Sample
No.
Position
No.
ID No.
With (ID mode)
×
×
O
Without (sample
No. mode)
With (ID mode)
O
O
O
×
O
O
Without (sample
No. mode)
×
×
×
16 - 27
×: Invalid
Remarks
As disk position No., send
the same No. as the
inquiry No. from analyzer.
Inquiry is not made in this
mode.
Table 16-12 Detailed Information about "SPE: Text for test selecting information inquiry (from analyzer to host)"
TS: Test selecting information
Operation
Instrument
Sample
Mode
Mode
Name
Simple
analysis
mode
ID mode
Routine
sample
2 Characters
Inquiry Condition
[RUN] (highlighted) is specified for host
communication on start condition screen, [NO] is
specified for the transfer of analytical data alone on
the [communication parameter screen and [NO] is
specified for original Abs.
Press the registration key on the
screen by the same times as the
sample count for inquiry.
Function
Character
Sample
unregistered
A
Sample Information
5 Characters
1 Character
3 Characters
13 Characters
15 Characters
Sample No.
Unassigned
Position No.
ID No.
Unassigned
1 to 400
Space
1 to 35
Sample registered
Sample No.
mode
Stat
sample
When [RUN] (highlighted) is specified for stat sample
test selection, inquiry is made while reading barcode
from the position specified for stat sample position
setting parameter.
Routine
sample
Press the registration key on the
screen by the same times as the
sample count for inquiry.
Sample
unregistered
Routine
analysis
mode
ID mode
Inquiry is not made.
Routine
sample
Inquiry is made by reading
barcodes sequentially from
position No. 1.
Sample
unregistered
Sample No.
mode
Routine
sample
Stat
sample
Space
2 to 35
Same as
above
Space
Same as above
N
1 to 400
Space
1 to 35
ID registered
on screen
[handled as
Space
Same as above
Space
Inquiry is not made when an
unregistered sample causes barcode
read error.
comment]
Space
Space
1 to 35
ID read with
barcode reader
Same as
above
When [RUN] (highlighted) is specified for stat sample
test selection, inquiry is made while reading barcode
from the position specified for stat sample position
setting parameter.
D
Inquiry is made for the specified
number of samples sequentially
starting from the sample
specified in the analysis start
No. on start condition screen.
N
Sample registered
Space
1 to 400
Space
Space
2 to35
(position Nos.
read by
barcode
reader)
ID registered
on screen
1 to 35
ID registered
on screen
[handled as
comment]
1 to 400
Inquiry is not made.
Supplementary Explanation
1.
Inquiry is not made when [NO] is
specified for full-time inquiry and TS
request lasts 1 channel or more.
1 to 50
A
Sample
unregistered
Even if a barcode read error occurs due
to an unregistered sample, inquiry is
made with position No. assigned.
D
Sample registered
Stat
sample
Space
Same as
above
Sample registered
Stat
sample
ID read with
barcode reader
Remarks
If no response is available from the host within 2 cycles (36 sec) after inquiry to the host, analysis is carried out according to the TS of main frame.
If the main frame has no TS request, the relevant sample will not be analyzed.
16 - 28
Inquiry is not made when [NO] is
specified for full-time inquiry and TS
request lasts 1 channel or more.
Space
Same as above
When barcode reading is
successful, inquiry is
made via the read ID.
When unsuccessful,
inquiry is made via the ID
specified on screen
Space
Same as above
Table 16-13 Detailed Information about "SPE: Specification of test slection (from host to anal yzer)"
Operation
Instrument
Sample
Mode
Mode
Name
Simple
analysis
mode
ID mode
Routine
sample
Routine
analysis
mode
ID mode
Sample No.
mode
2 Characters
Function
Character
Sample Information, Recommended Character in Parens
5 Characters
1 Character
3 Characters
13 Characters
15 Characters
Sample No.
Unassigned
Position No.
ID No.
Unassigned
New sample (Press the registration key on
screen by the number of samples to be
analyzed.)
Sample registered for stat TS through
screen
A
(Space)
Ignored
(Space)
Ignored
1 to 35
D
(Space)
Ignored
(Space)
Ignored
2 to 35
[Caution 1]
Routine
sample
New sample (Press the registration key on
screen by the number of samples to be
analyzed.)
N
1 to 400
(Space)
Ignored
Stat
sample
Sending is unallowable.
Routine
sample
New sample (Specify the analysis start
No. and the number of samples to be
analyzed through screen.)
A
(Space)
Ignored
Stat
sample
Sample registered for stat TS through
screen
D
Routine
sample
1.
New sample
N
2.
Registered sample
Stat
sample
Sending is unallowable.
Stat
sample
Sample No.
mode
Basic Condition for TS Specification
[RUN] (highlighted) is specified for host
communication on start condition screen,
[CANCEL] is specified for the transfer of
analytical data alone on the
[communication parameter screen and
[CANCEL] is specified for original Abs.
Desired ID No.
(blank
unallowable)
Sample and ID
No. registered
on screen (blank
unallowable)
(Space)
Ignored
1 to 35
Desired 13
characters
(blank
unallowable)
(Space)
Ignored
(Space)
Ignored
1 to 35
Desired ID No.
(blank
unallowable)
(Space)
Ignored
Unallowable
(Space)
Ignored
(Space)
Ignored
2 to 35
[Caution 1]
Sample and ID
No. registered
on screen (blank
unallowable)
(Space)
Ignored
Unallowable
1 to 400
(Space)
Ignored
1 to 35
Desired 13
characters
(blank
unallowable)
(Space)
Ignored
Supplementary Explanation
1.
Basically, text should be transferred with TS and comment presence/absence information added to the same sample information (excluding ID No.) as for inquiry from the analyzer.
16 - 29
Stop
Specification
from HOST
Unallowable
Remarks
[Caution 1]
The position No. specified from
the host must be within the
range specified on the stat
sample position setting screen.
If the position No. is outside the
range or 0 is specified, sample
information error occurs.
(5)
Analytical Data Transfer (from analyzer to host)
Shown below are the contents of each text.
(a) Analytical data transfer for routine, stat and control samples
The text size (number of transferred words between STX code and end code) is selectable tetween the two given below.
Table 16-14 Text Size and Composition
Text Size
256
512
Mode
Real time or
batch
Text Composition (B: Byte count)
1b
1b
2b
1st
STX
1
Fu
Final
STX
:
Fu
1st
STX
1
2nd
STX
Final
Real time or
1st
batch
Final
37b
Sample information
3b
10b × test count n 1b 1b
Channel count
Analytical data
ETX BCC
(1ch to 20ch)
↑
↑
↑
ETX BCC
(21ch to 40ch)
Fu
↑
↑
↑
ETX BCC
(1ch to 20ch)
2
Fu
↑
↑
↑
ETX BCC
(21ch to 40ch)
STX
:
Fu
↑
↑
↑
ETX BCC
(41ch to 51ch)
STX
1
Fu
↑
↑
↑
ETX
BCC
(1ch to 46ch)
STX
:
Fu
↑
↑
↑
ETX
BCC
(47ch to 51ch)
16 - 30
Max. Test Count/text
Max. Text Count
20
2
40 or less
3
Within 41 to 51
2
51 or less
46
Channel Count
Remarks
Max. text count is 1 when
channel count is 20 or less.
The text size (number of transferred words between STX code and end code) is
selectable between the two given below.
NOTES: 1.
The end code character is settable up to four characters. So
calculate the maximum number of transferable channels according to
the expression shown below. (Fractions are rounded down and a
numerical value '48' indicates the total byte count of fixed length n in
Table 6-4.) Text size: 256 or 512 bytes
Maximum number of transferable channels <
2.
3.
4.
5.
Text size − 48
10
In batch communication in the 256-byte mode, data is sent in up to
five texts for each sample.
In this case, the analyzer sends the first text and then the next one
soon after reception of the MOR frame from the host.
The total number of analytical data to be transferred is variable
according to the number of specified channels.
When ISE data or serum indexes extend into the next text, they are
set in it for transfer.
When the absence of ISE unit is set on the system setting screen or
by the DIP switch, the analytical data of ISE tests will not be sent.
1) Channel count (3 characters)
The number of channels to be transferred in one text is sent.
102 101 100
Transfer sequence
Example: "bb1" or "001"
"b10"
Channel count (right-justified)
NOTE: The analyzer transfers data for up to 36 channels in both
real-time communication and batch communication.
When including serum indexes (three tests of lipemia,
hemolysis and icterus), electrolytes (three tests of Na, K
and Cl) and calculation tests (8 tests), data for up to 50
channels is transferable.
2)
Analytical data 1 to n (10 characters each)
2
1
0
5
0
10 10 10 10 ...........................10 10
0
Data alarm (1 character)
Measured value (6 characters)
Channel No. (3 characters),
right-justified
16 - 31
(i)
Channel No.
Table 16-15
Channel No.
Description
" bb1 " to " b36 "
" b38 " to " b40 "
" b41 " to " b43 "
" b44 " to " b51 "
Remarks
Photometry assay
Electrolyte
Serum index
Calculation test
1 to 36 without ISE
(ii) Measured value
Table 16-16
Positive/negative
Decimal Point
Max. Digit Count
Positive
Absent
Present
Absent
6
5
5
Present
4
Negative
Example
123456
123.45
-12345
bb-123
-12.34
b-12.3
(b: Space)
Table 16-17
Channel
No.
Description
Form
Position of Decimal Point
Decimal point position in
concentration value of
standard 1 on chemistry
parameter screen
Same as above Decimal point position in
concentration value of LOW
solution on ISE parameter
screen
41 to 43 Measured value 6-digit integer
Zero at any time
for serum index with sign
44 to 51 Calculated
6 digits with
Decimal point position in
value in
sign and
standard value range (lower
calculation test decimal point
limit) on calculation test
screen
1 to 36
Concentration
value in
photometry
assay
38 to 40 Concentration
value of
electrolyte
6 digits with
sign and
decimal point
(iii) Data alarm
For details, refer to the data alarm code list.
16 - 32
Remarks
(b)
Transfer of absorbance data in entire reaction process (from analyzer to host)
1)
Specification of size
The size of text is specifiable on the communication parameter screen.
Select either 256 or 512 bytes. On selection of 256 or 512 bytes, text is
transferred divided as shown below.
(i) When 256-byte mode is specified for text size
First
1B
1B
2B
37B
10B × 4
STX
1
Fu
Sample information
Analytical data 1
6B × 4
Analytical data 4 BLANK1
ABS24
1B
Final
:
Fu
BLANK4 Point count
1B
1B
ETX
BCC
ABS1
(Variable)
37B
3B
6B × point count
Sample information
Point count
ABS25
1B 2B
STX
6B × point count
3B
ABS35
ETX
BCC
(ii) When 512-byte mode is specified for text size
Final
1B
1B
2B
37B
10B × 4
STX
:
Fu
Sample information
Analytical data 1
6B × 4
Analytical data 4 BLANK1
ABS35
2)
3)
BLANK4
1B
1B
ETX
BCC
3B
6B × point count
Point count
ABS1
(Variable)
Transfer unit
This text is transferred in units of channel. Even when the text size is 256
bytes, transfer is completed in a single text if the point count is 24 or less.
The frame character at that time is not '1' but ':'.
Sample information
Refer to "sample information" in (2) of 16.6.2.
16 - 33
4)
Analytical data 1 to 4 (10 characters each)
(i)
For transfer format, refer to (2) of 16.6.1.
(ii) Table 16-18 is followed when there is no relevant test for analytical data
1 to 4.
(iii) When two-channel simultaneous measurement is specified, data for two
channels is transferred, and data for up to four channels (1 channel + L,
H, I) is transferred when serum index measurement is specified.
Table 16-18
Setting
Channel No.
Measured value
Data alarm
5)
" bbb "
" bbbbbb "
"b"
BLANK 1 to 4 (6 characters each)
The transfer format of each cell blank data is shown below.
Transfer sequence
5
10 10
4
100
-4
Cell blank data (unit: 1 × 10 Abs)
(Example) bbb-50
6)
Point count (3 characters)
The number of photometric points to be transferred in one text is transferred.
102 101 100
Transfer sequence
Point count
Table 16-19
7)
Reaction Time
3 min
4 min
5 min
10 min
Point Count
11
14
17
35
ABS 1 to 35
Absorbance data in the entire reaction process (difference data between two
wavelengths at each photometric point) is transferred in the same format as of
the above cell blank data. When the point count is less than 35, data is
closely transferred in sequence starting from ABS 1.
16 - 34
(c)
Transfer of photometry-assay calibration data (from analyzer to host)
Composition of text
STX
(1)
:
(1)
G
(2)
Channel No.
(3)
STD count
(1)
Calibration alarm
(1)
STD data 1
(32)
Each parenthesized numeral indicates the byte count.
STD data 6
(32)
1)
2)
3)
SD value information
(8)
102 101 100
5)
BCC
(1)
(Variable)
Frame character (1 character)
':' is transferred.
Function character (2 characters)
'G
' is transferred.
Channel No. (3 characters)
Transfer sequence
4)
ETX
(1)
A test code in photometry-assay calibration is
indicated in a three-digit integer. Test numbers
are "bb1" to "b36" which correspond to test
codes in the analyzer.
STD count (1 character)
STD count is any of '1' to '6' and variable according to the calibration method.
When STD count is '1,' STD data is followed immediately by SD value
information.
STD data 1 to 6 (32 characters each)
The data for each STD has the composition below.
Transfer sequence
105
100
100
105
Prozone value (6 bytes)
Data alarm (1 byte)
2nd initial absorbance data (6 bytes)
2nd absorbance data (6 bytes)
1st initial absorbance data (6 bytes)
1st absorbance data (6 bytes)
STD type (any of STD 1 to 6)(1 byte)
Each absorbance data is right-justified and preceded by one more spaces.
6)
Calibration alarm (1 character)
Refer to the data alarm code list.
16 - 35
7)
SD value information (8 characters)
10
Transfer sequence
0
10
5
SD decimal point position
SD value (right-justified and preceded by space)
"Y":
"N":
8)
SD value present
SD value absent (Spaces remain blank for information on
SD value and decimal point position.)
Data composition
Table 16-20
Data Item
Unit
Form
Decimal Point Position
-4
Absorbance data
Initial absorbance
data
SD value
10 ABS 6-digit integer with sign
10-4 ABS 6-digit integer with sign
No
6 digits with decimal
point (positive)
No decimal point
No decimal point
Decimal point position of
SD limit on chemistry
parameter screen
9)
(d)
Transfer unit
Transfer in units of channel
Transfer of ISE calibration data (from analyzer to host)
Composition of text
Type A
1B
STX
1B
:
1B
K data alarm
Type B
STX
:
(B: Byte count)
2B
H
1B
ISE type
72B
K calibration data
H
ISE type
1B
K
K
Cl
data alarm calibration data alarm
data
1)
2)
Frame character (1 character)
':' is transferred.
Function character (2 characters)
'H_' is transferred.
16 - 36
1B
Na data alarm
1B
ETX
1B
BCC
Na data alarm
72B
Na calibration data
(Unused)
(153 bytes)
Na calibration data
72B
Cl
calibration ETX BCC
data
(226 bytes)
3)
ISE (electrolyte) type (1 character)
Table 16-21
ISE Type
'A'
'B'
4)
5)
Test
Na, K
Na, K, Cl
(Unused)
Data alarm for each channel (1 character)
A data alarm corresponding to each channel is transferred.
For details of data alarm, refer to the data alarm code list.
ISE calibration data (72 characters)
This data area has eight data items; electromotive force of internal standard
solution, electromotive force of LOW solution, electromotive force of HIGH
solution, electromotive force of calibrator, slope level for display, concentration
of internal standard solution, concentration of calibrator and compensation
factor. Each data item is composed as shown below. Space remains blank
when there is no relevant data.
Transfer sequence
Data alarm (1 byte)
Measured value (6 bytes)
Data identification (2 bytes)
("bb" when there is no data)
Table 16-22
Data
Identification
Unit
Form
Electromotive force
of internal standard
solution
Electromotive force
of LOW solution
Electromotive force
of HIGH solution
Electromotive force
of calibrator
Slope level for
display
Concentration of
internal standard
solution
" b1 "
mV
6 digits with sign and
decimal point
" b2 "
mV
Concentration of
calibrator
Compensation factor
" b7 "
Item
" b3 "
" b4 "
" b5 "
" b6 "
“ b8 ”
Decimal Point
Position
1 digit
6 digits with sign and
1 digit
decimal point
mV
6 digits with sign and
1 digit
decimal point
mV
6 digits with sign and
1 digit
decimal point
mV
6 digits with sign and
1 digit
decimal point
mEg/L 6 digits with sign and Same position as for
decimal point
LOW solution on
ISE parameter
screen
mEg/L 6 digits with sign and Decimal point
decimal point
position in calibrator
mEg/L 6 digits with sign and concentration on ISE
parameter screen
decimal point
16 - 37
6)
7)
Data for up to three tests is collectively transferred to the host.
This text is transferred only when the ISE unit is provided at option.
16.6.2 Contents of Text
(1)
Details of Function Character (Fu)
Transfer sequence
Space
Character in table below
Table 16-23 Function Characters for Test Selecting Information Inquiry and
Analytical Data
Test Selecting
Information Inquiry
Analyzer
Analyzer
Direction of
Communica↑
↑
↓
tion
Host
Host
Batch
Real-time
With/without Communica- CommunicaID
tion
tion
Form
Sample Name
Routine sample
Stat sample
Control sample
Calibration sample
(photometry assay)
Calibration sample
(ISE)
Routine sample
Stat sample
Absorbance in entire
reaction process
(routine)
Absorbance in entire
reaction process (stat)
With
D
With or without
Both
Analytical Data
Analyzer → Host
Batch
Real-time
Communica- Communication
tion
A
D
F
G
a
d
f
H
Without
N
Both
N
Q
I
n
q
K
Supplementary Explanation
1.
In the function character form for analytical data, the upper-case letters are used for realtime communication and the lower-case letters for batch communication.
2.
In transfer from the analyzer to the host, batch communication for test selecting information
inquiry is not carried out. (Only in simple analysis mode setting)
3.
Batch communication for analytical data transfer indicates a communication when specified
through the screen.
16 - 38
(2)
Sample Information
(a) Composition of sample information
Transfer sequence
Sample No. (5 characters)
Unassigned (1 character)
Position No. (3 characters)
sssss
(b)
p p p
ID No. (13 characters)
i
i
i
i
i
i
i
i
i
i
Unassigned (15 characters)
i
i
Unassigned (6 characters)
Unassigned (4 characters)
i
Details of sample information
Table 16-24 shows the details of sample information.
Table 16-24 Details of Sample Information
Item
Sample Name
Routine Sample
Sample No.
(5 characters)
Stat Sample
Transfer sequence
4
Remarks
Transfer sequence
0
4
10
10
s s s s s
0
Control Sample
2
10
10
s s s s s
< From analyzer to host >
TS inquiry in the ID mode is made in space (for
routine sample).
Transfer sequence
0
1
10 • 10 10 10
c c c s s
0
Sequence No. (b1 to 30)
Sequence No. (bbbb1 to bb400)
Unassigned
(1 character)
Position No.
(3 characters)
Space
2
4
0
Space
< From analyzer to host >
Blank space for control sample
< From host to analyzer >
(1) For space, the analyzer side is followed.
(2) Position No. is ignored for TS indication
in the ID mode.
0
10 10
p p p
Position No. (bb1 to b35)
Position No. (bb2 to b35)
Space
< ID mode and sample No. mode >
Transfer sequence
12
Control No. (bb1 to bb5)
Space
Transfer sequence
Transfer sequence
10 • 10
p p p
ID No.
(13 characters)
Sequence No. (bbb1 to bbb50)
< From host to analyzer >
Sample No. is ignored for TS specification in
the ID mode.
0
10
10
i i i i i i i i i i i i i
ID No.
16 - 39
(1) When ID No. is within 13 digits, it is rightjustified and preceded by one or more
space.
(2) In the NO ID mode, the analyzer treats ID
No. as a comment.
(3) In transferring the analytical data of control
sample in the ID mode, the ID No. of this
sample is sent in space from the analyzer to
host.
(3) Test Selecting Information (from host to analyzer)
Send test selecting information corresponding to sample information.
Transfer sequence
1 2
3
4
5 ... 36 37
ISE channel
Photometry-assay channel
Channel count
Details of Request for Each Channel
(b: Space)
Function Character
Initial measurement
NOTES:
1.
Details of Request
" Ab "
"b"
" Db "
0:
1:
2:
3:
4:
No request
Normal sample volume
Unused
Unused
Volume determined by analyzer side
(left to analyzer)
The above channel count ("bb0" to "b37") is the number of effective
channels from photometry-assay channel 1. If "bb3" is specified,
channels 1 to 3 are reflected on the analyzer with channels 4 to 37
ignored.
When there is at least one requested test, it is desirable to set "37."
Example:
b
1 2
b 3 1
3
4
5
36 37
1 1
1
1 .…
0
0 1
Not reflected on analyzer (analyzer side is followed)
Reflected on analyzer
Channel count
The analyzer side is obeyed if test request is made in a channel number
beyond the specified channel count. To avoid analysis for an
unnecessary test, set channel count "37" and request for only a test to be
specified.
2.
Request for ISE is specifiable in the 37th channel.
(i) Specification of any other than "0" ... Select Na, K and Cl on the
screen.
(ii) Specification of "0" ... No request
Note that it is impossible to select a request for any of Na, K and Cl from
the host.
16 - 40
3.
In request for the isozyme test or compensation test, the other test
necessary for isozyme calculation or test-to-test calculation is
automatically supplied for analysis, and tests added for serum indexes are
transferred as well.
4.
When request for the calculation test is made, judge and request the
channel for the test necessary for the calculation. When request for the
A/G ratio is made for example, send test selecting information considering
the channels for TP (total protein) and ALB (albumin).
5. TS request for serum indexes cannot be made for each sample.
For request, specify serum index test on the parameter screen and serum
indexes on the start condition screen.
(4)
Comment Information (from host to analyzer)
Transfer sequence
Presence/absence of comment 5
Presence/absence of comment 4
Presence/absence of comment 3
Presence/absence of comment 2
Presence/absence of comment 1
Set "0" for all comment presence/absence information items.
16 - 41
16.7 Error Check Function
If the contents of the received text fall under any condition shown in Table 16-25, the analyzer
judges that there is an abnormal character and outputs an alarm.
Table 16-25
Attribute
Text
information
Item
Frame
character
Function
character
Details of Check
An irrelevant frame character is received.
(For details, refer to Table 16-3.)
Function character does not correspond to sample.
(For details, refer to the contents of text in 16.2.)
Example
Analyzer
"A"
Sample
information
HOST
Analyzer HOST
"n"
(alarm not output)
(alarm output)
" A " : Routine sample
(1) An irrelevant frame character is received.
(2) In test selecting information inquiry, a function
character differing from the contents sent from
the analyzer to host is received.
(3) Character check in the unassigned area of text
is not made on the analyzer side and alarm is
not output.
Sample No. Each number is outside the specified range excluding
Position No. the following cases.
Routine Sample
Disk No. 1 to 400 or space
Position 1 to 35 or space
No.
Stat Sample
1 to 50 or space
2 to 35 or space
ID No.
ID Mode
$20 to $7E (right-justified)
NO ID Mode Same as above
Inquiry
information
Test
selecting
information
Remarks
Error occurs when the control code of each test is any
of $00 to $1F.
If any test is outside the specified range, error occurs.
(1) Test selecting information for a routine/stat
sample is any other than '0' to '4.'
(2) Channel count is outside the specified range.
16 - 42
Error occurs when
the position No. of
a stat sample is
outside the
specified range or 0
on the stat sample
position setting
screen.
16.8 Specifications of Communication Trace
16.8.1 Overview
This is an auxiliary function for outputting the stored data onto the printer as a logging in order
to check the contents of communication between the analyzer and host. This function is
selectable on the communication parameter screen.
16.8.2 Trace Data
The time point of communication execution, the direction of communication and the contents of
message are stored.
The data to be stored differs between the cases below.
(1)
In Normal Communication
Frame character, function character and sample information are stored. However, only
frame character and function character are stored for the text without sample information
(NOTE).
NOTE:
(2)
Storage is made according to the following rule.
1) Text without function character
Frame character and one character after it (2 characters in total)
2) Photometry-assay calibration text
Frame character, function character, channel No., STD count and
calibration alarm (8 characters in total)
3) ISE calibration text
Frame character, function character and ISE type (4 characters in total)
Upon Occurrence of Any Error During Communication
The details of the error and all characters up to occurrence of the error are stored.
However, if send time-out occurs during sending from the analyzer to host, only frame
character, function character and sample information are stored the same as in normal
communication (in (1) above).
16.8.3 Trace Data Storage Timing
(1)
In any other than Transfer of Analytical Data Alone
(a) The trace function is activated after sending a text from the analyzer and receiving a
corresponding text from the host (after receiving the end-of-data code).
(b) The trace function is activated upon change from [YES] to [NO] for communication
trace on the communication parameter screen.
(2)
Transfer of Analytical Data Alone
The trace function is activated on completion of transferring the text sent from the
analyzer (after sending the end-of-data code).
16 - 43
16.8.4 Resetting of Trace Data
Trace data is reset when [CLEAR] is specified for "communication trace printout" on the
mechanism check screen.
16.8.5 Trace Data Storage Capacity
Data of 1200 cycles max. (conversation) can be stored.
16.8.6 Other
Communication trace data is not stored under the following conditions.
(1)
During printout of communication trace data
(2)
During deletion of communication trace data
16.9 Hardware Specifications
16.9.1 Overview
The Model 902 can select the RS-232C interface or 20 mA current loop interface and can
monitor the sent data via each interface.
(1)
RS-232C
Use the connector J402 on the RSDIST circuit board provided on the rear panel of Model
902.
(2)
20 mA Current Loop
Use the same connector J402 as for RS-232C. (Either RS-232C or 20 mA current loop is
selectable by switch No. 1 on the RSDIST board.)
(3)
Communication Monitor
The data sent from the Model 902 can be monitored by using the connector J405 on the
RSDIST board.
16 - 44
16.9.2 RSDIST PC Board
(1)
External View
J405
(communication monitor)
J409
(to EMIO100 circuit board)
SW 1
J402
(RS-232C/current loop)
(2)
Switch Setting
1
4
OFF
2
3
ON
No. 1
No. 2
No. 3
No. 4
OFF
16 - 45
ON :
OFF :
Current loop
RS-232C
Always OFF
(3)
Pin Arrangement
Table 16-26 Signal Assignment
Pin No.
1
2
3
4
5
6
7
8
9
10
11
12
13
14
15
(4)
J402 (RDAD-15P female side)
SG
TXD
RXD
RTS
CTS
TXD +
TXD RTS +
RTS CTS +
CTS RXD +
RXD -
RS-232C (from host)
Current loop (from host)
Unused
Unused
J405 (RDBB-25S female side)
Unused
TXD
Unused
RTS
Unused
Unused
SG
TXD +
TXD RTS +
RTS DTR +
DTR 14, 15
Communication monitor
(RS 232C)
Communication monitor
(current loop)
Unused
Connection Diagram
RSDIST board
Current loop
data monitor output
J402
J405
RTS +
RTS TXD +
TXD -
150 Ω
150 Ω
SG
150 Ω
TXD
RS-232C
data monitor output
SG
RTS
TXD
TXD
RXD
RTS
CTS
RS-232C/
current loop
RXD
selection
TXD
EMIO100 board
Host side
(for RS-232C)
RXD
TXD
RTS
CTS
CTS
RTS
150 Ω
150 Ω
RXD +
RXD TXD +
TXD CTS +
CTS RTS +
RTS -
J409
SG
TXD
RXD
RTS
CTS
RXD +
RXD TXD +
TXD CTS +
CTS RTS +
RTS -
Host side
(for current loop)
Fig. 1-16 Connection Diagram
16 - 46
16.9.3 Interface Signal
Table 16-27 lists the meanings of interface signals, and Tables 16-28 and 16-29 list signal
levels and their meanings.
Table 16-27 Meaning of Interface Signal
Abbreviation
Signal Name
FG
TXD
RXD
RTS
CTS
SG
Frame Ground
Trans Data
Receive Data
Request To Send
Clear To Send
Signal Ground
Meaning of Signal
Direction of Signal
(902 side) (Host side)
Frame ground
Transmission data
Reception data
Request to send
Clear to send
Signal ground
→
←
→
←
Table 16-28 RS-232C Interface Signal Level and Meaning
Signal Level
Positive (NOTE 1)
Signal Name
TXD
RXD
RTS
DTS
CTS
NOTES:
1.
2.
•
•
•
•
•
•
•
•
SPACE
Start bit
Data "0" (NOTE 2)
ON
Data "1"
ON
Data "1"
Data communication allowed
Negative (NOTE 1)
•
•
•
•
•
•
•
•
MARK (no signal)
Stop bit
Data "1" (NOTE 2)
OFF
Data "0"
OFF
Data "0"
Data communication prohibited
Positive ..........................Output +12 V, input +3 V to 15 V
Negative .......................Output -12 V, input -3 V to 15 V
Data "0" and data "1" correspond to decimal numbers for the CPU to read/write data or
status, respectively.
16 - 47
Table 16-29 20 mA Current Loop Interface Signal Level and Meaning
Signal
Signal Name
TXD
RXD
CTS
RTS
NOTE:
Current ON (20 mA)
•
•
•
•
•
•
•
•
Current OFF (0 mA)
•
•
•
•
•
•
•
•
MARK
Stop bit
Data 1
OFF
Data 0
Data transfer prohibited
OFF
Data 0
SPACE
Stop bit
Data 0
ON
Data 1
Data transfer allowed
ON
Data 1
Data 0 and data 1 correspond to decimal numbers for the CPU to read/write data, respectively.
16.9.4 RS-232C Communication
(1)
Connector Position
Use the connector J402 on the rear panel of Model 902.
(2)
Connecting Cable and Cable Length
J402 uses a 15-pin interface connector (female).
On the cable side, use the following.
HDAB-15P (made by Hirose Denki)
Cable length is limited to 15 m at maximum.
(3)
Pin Arrangement
Refer to (3) of 16.9.2.
16 - 48
(4)
Example of Connection
Host side
Model 902 side
TXD
TXD
RXD
RXD
RTS
RTS
CTS
CTS
DTS
SG
SG
DCD
DTR
FG
Solderless terminal
(screwed to the cubicle of operation block)
NOTE: For solderless terminal, refer to (5) below.
Fig. 16-2 Example Connection for RS-232C Communication
(5)
Measure for FG
FG is not assigned to the J402 connector. So attach a solderless terminal to the FG cable
of host computer and screw it on the cubicle of operation block as detailed below.
Requirements for FG cable (See Fig. 16-3.)
• Cable length: 100 mm or longer
• Solderless terminal: For M4 screw
100
FG cable
(with solderless terminal)
Host side
Model 902 side
HDAB-15S (made by Hirose Denki) or equivalent
Fig. 16-3
Requirements for FG Cable
• Fixing position
Fix in the screw hole under J402.
16 - 49
16.9.5 Current Loop
Current loop is selected by turning on the switch No. 1 on the PC board. In the current loop
mode, the J402 connector is used as in the RS-232C mode.
(1)
Connection Diagram
Refer to (4) in 16.9.2.
(2)
Connecting Cable
The J402 connector side uses a 15-pin interface connector (female) of type RDAD-15S.
The cable side should use the following.
HDAB-15P (made by Hirose Denki) or equivalent
(3)
Pin Arrangement
Refer to (3) in 16.9.2.
(4)
Signal Input Circuit
Model 902 side
+5 V
+5 V
Host side
150 Ω
75452
470 Ω
33 Ω
16.9.6 Communication Monitor
Data transferred between the Model 902 and host can be monitored by connecting a personal
computer or other monitor to J405 on the RSDIST board.
For monitoring, turn off the switch No. 1 on the PC board.
(1)
Connection Diagram
Refer to (4) in 16.9.2.
(2)
Connecting Cable
The J405 connector side of RSDIST board is a 25-pin interface connector (female) of type
SDBB-25S. The cable side should use the following.
HDBB-25P (made by Hirose Denki) or equivalent
16 - 50
16 - 51
16 - 52
16.10 Cautions on Connection with External System
(1)
For connection with this protocol, adopt the point-to-point system.
(2)
Although the end-of-data code is changeable on the system setting screen, the host must
send the same end-of-data code as on the analyzer side. If the code does not match
between them, alarm is issued.
(3)
EXT is always added to the end-of-data code in each text. Whenever data beyond 256
bytes is transferred, therefore, the analyzer adds not ETB but ETX.
For the host, a frame character ':' is the final message when the data for one sample is
sent in more than one text. So pay attention when taking in the data.
(4)
As a rule, the analyzer sends the ANY frame to the host in response to a request from it in
the following cases.
(a) On request for analytical data transfer from the host, the relevant sample is not
stored on the FD.
(b) Analytical data cannot be read from the FD due to occurrence of an error in it during
batch transfer of analytical data.
(5)
The communication controller in the analyzer is initialized in the following cases.
(a) Power supply is turned on.
(b) [RUN] (highlighted) is specified for host communication parameter (any of baud rate,
parity data bit, stop bit, end-of-data code and text length is changed through the
screen). At this time, the first event request (RES, SPE) from the host is ignored.
After changing a communication parameter, attention should be paid to event.
(6)
If an error is detected on a text transferred from the host, the analyzer sends REP
(resending request) until the normal text is received.
(7)
Secure at least 100 msec before transfer from the host to analyzer.
16 - 53
16 - 54
16.12 Supplementation
16.12.1 Glossary
(1)
Conversation
:
An exchange of texts between the analyzer and host
computer.
(2)
Cluster
:
A group of conversations between the analyzer and host
computer.
(3)
Text
:
A message transferred between the analyzer and host
computer.
(4)
Framing of text
:
To provide a start character and end character at the
beginning and end of a text for receiving it without fail and
facilitating its check.
(5)
Length of text
:
The total number of characters constituting a text.
(6)
Test selection
(7)
Point-to-point system
:
A system in which two instruments for data sending,
receiving or processing are connected via the
communication line, any other instrument is not connected
between them and there is no instrument for control of data
transmission for the whole system.
(8)
Response
:
Sending to one of the instruments which communicate with
each other whether the other is ready for reception or not
and whether the received data is normal or not, and a
character to be transmitted for that purpose.
(9)
Recovery
:
To escape from a deadlock which is caused by abnormality
in the sender, receiver or line.
(10) Frame character
:
Identifies the purpose of text and functions like a command
No.
(11) Data link
:
A general term for the physical transmission path from the
sender to receiver via data transmission line and the
logically set data transfer path.
(12) Data field
:
An area for the contents of a message excluding the control
code, frame character and end-of-data code in a text.
(13) Specific sample
:
An optional sample requested to the analyzer from the host.
(14) Specific request text
:
A text which makes a request to the other side for a text
having a data field. (Example: SPE, FR4, FR2, END, RES)
:
Analysis by multi-test analyzer not for all tests but for the
tests selected through external instruction.
16 - 55
(15) Non-specific request test :
A text which makes a request to the other side for a text
having no data field. (Example: ANY, MOR, REP, SUS,
REC)
(16) ID mode
:
[RUN] (highlighted) is specified for barcode reader test on
the SYSTEM PARAMETERS screen and [CANCEL] is
specified for barcode T/S test.
(17) Sample No. Mode
:
[CANCEL] is specified for barcode reader test on the
SYSTEM PARAMETERS screen. Or, [RUN] (highlighted) is
specified for both barcode reader test and barcode T/S test
on the SYSTEM PARAMETER screen.
16 - 56
16.12.2 Differences in Communication Specification between Conventional Analyzers and Model 902
Conventional Analyzers (Model 7250, 7150, 7050, etc.)
Communication
timing chart
Host Manual Drive System (Model 7170/902)
Communication
cycle (sec)
Communication cycle (sec)
Analyzer
TS
inquiry
Analyzer
HOST
HOST
Conversation
Cluster
Composition of
message
(1)
Test selecting information
D :
Analytical data
With less than 255 bytes (TS inquiry, analytical data transfer)
STX
(2)
TS :
FN Data filed ETX BCC
(1)
(FN: Function No.)
With 255 bytes or more (analytical data transfer)
STX
FN Data filed ETX BCC
STX
(2)
FN Data filed ETX BCC
With less than 254 bytes (TS inquiry, analytical data transfer, other)
STX
FN Data filed ETX BCC
1st
STX
Final
Frame character Data filed ETX BCC
FR ..... Frame character
‘:’....... Frame character indicating the fianl frame in analytical data transfer
With 254 bytes or more (only transfer of analytical data)
1 sec or more
STX
:
Data filed ETX BCC
(NOTE 1)
NOTES: 1. Usually on receiving response from hos (within 5 sec)
2. 2 sec or more in RESULT ONLY mode
1 sec or more
Characteristics
(1)
A communication cycle is divided into the first and second halves where TS inquiry
and analytical data transfer are made, respectively.
(1)
As a rule, response is made to each request.
(2)
Text has a frame No. corresponding to command No. and control code (ACK, NAK) in it for communication control.
(2)
Function is simple due to discrimination with real-time transfer and batch transfer.
(3)
Applicable to multiple jobs because there is basically no discrimination between real-time communication (communication
under analysis) and batch communication (specified through screen).
(4)
Because protocol need not be changed among instruments, a high maintainability is ensured.
(5)
Reducing the burden of host can be expected.
16 - 57
Comparison between Conventional Analyzer and Model 902 in Host Communication
Test
inquiry
S. No.
Host inquiry
information
T/S batch transfer
Sample
registration to
analyzer
Handling when
analyzer has T/S
Analysis
prohibitive
specification
S. Stop
specification from
host
Host-priority
function
Request for serum
indexes
Sample volume
increase/decrease,
kind and age
ID (basically
Host inquiry
same as S. No. information
mode)
ID read error
support
Data
S. No. ID
Reaction process
transfer
data
Retrieval via ID
Data
review Addition/change of ID, comment
and data
Handling of identical sample
NOTE:
Model 7170 (7070)
Model 902
Sample No., disk position,
ID (can be input through
screen)
Possible
Sample No., disk position,
ID (can be input through
screen)
Possible (in routine mode
only)
Routine mode unnecessary
Simple analysis necessary
Unnecessary
Same as right
T/S all zero
Mode selectable by system
parameter
1) Full-time inquiry (priority
given to host)
2) Inquiry when without
T/S (same as before)
←
Possible (POS = 0)
Impossible
Possible
Possible
None, time-out in 2 cycles
(36 sec)
Impossible
Possible
Impossible
ID, disk position
ID, sample No. (space)
• No inquiry to host
• Inquiry allowed
through manual ID
input
Batch transfer
Routine analysis:
No inquiry to host
Simple analysis:
Inquiry made via ID
space and position No.
Real-time transfer
Available
Possible
Unavailable
Impossible
Routine sample:
Handled in units of
test (overlay)
Stat sample:
Overwrite (NOTE)
Routine sample:
Handled in units of
test (overlay)
Stat sample:
Same as above
Condition: Previous data, TP 8.0, GOT 30
Over lay
Over write
Current Data
Stored Data
TP 5.0
TP 5.0
TP 5.0 GOT 30
TP 5.0
16 - 58
16 - 59
16.12.4
ASCII Code Tables
Table 16-31 7-Bit Roman Character Code Set
Column
Row
0
1
2
3
4
5
6
7
8
9
10
11
12
13
14
15
0
1
2
3
4
5
NUL
TC1 (SOH)
TC2 (STX)
TC3 (ETX)
TC4 (EOT)
TC5 (ENQ)
TC6 (ACK)
BDL
FE0 (BS)
FE1 (HT)
FE2 (LF)
FE3 (VT)
FE4 (FF)
FE5 (CR)
S0
S1
TC7 (DLE)
DC1
DC2
DC3
DC4
TC8 (NAK)
TC9 (SYN)
TC10 (ETB)
CAN
EM
SUB
ESC
IS4 (FS)
IS3 (GS)
IS2 (RS)
IS1 (US)
(SP)(NOTE)
1
99
#
$
%
&
"
(
)
*
+
,
.
0
1
2
3
4
5
6
7
8
9
:
;
<
>
?
@
A
B
C
D
E
F
G
H
I
J
K
L
M
N
O
P
Q
R
S
T
U
V
W
X
Y
Z
[
NOTE: (SP) is not printed actually.
16 - 60
/
Y
]
ˆ
–
6
a
b
c
d
e
f
g
h
i
j
k
l
m
n
o
7
p
q
r
s
t
u
v
w
x
y
z
{
|
}
–
DEL