1
SmartRadar Flexline
Service manual professional
(For internal use only)
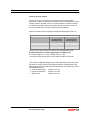
Copyright 2010 - 2013 Enraf BV All rights reserved.
Reproduction in any form without the prior consent of Enraf BV is not allowed. This manual is for
information only. The contents, descriptions and specifications are subject to change without notice.
Enraf BV accepts no responsibility for any errors that may appear in this manual.
The warranty terms and conditions applicable in the country of purchase in respect to Enraf BV
products are available from the supplier. Please retain them with your proof of purchase.
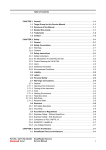
Table of Contents
GENERAL .................................................................................................. 1
COMMISSIONING .................................................................................. 2
Level start-up (Tab sheet: Product level) …………………………………. 2
Level check (Tab sheet: Product level) …………………………………… 2
Alarm settings (Tab sheet: Product level) ………………………………… 6
Alarm loop checking (Tab sheet: Product level) …………………………. 6
Manual overwrite (Tab sheet: Product level) …………………………….. 6
COMPENSATIONS (TAB SHEET: COMPENSATION) ............................. 7
Output filters …………………………………………………………………. 7
Verification pin compensation …………………………………………….. 10
Linear compensation ………………………………………………………. 10
Tank shell compensation (Gauge reference compensation) ………….. 10
Hydrostatic deformation compensation ………………………………….. 13
Level end switch ……………………………………………………………. 17
Ullage Correction Table ……………………………………………………. 17
Maximum safe fill …………………………………………………………… 18
DIAGNOSTICS ...................................................................................... 19
Peak selection (Tab sheets Peak Selection, Obstructions and zones,
Advanced) …………………………………………………………………… 19
Zones and threshold settings …………………………………………… 20
Differential spectrum …………………………………………………….. 22
Additional settings ……………………………………………………….. 23
Diagnostic entities ……………………………………………………….. 24
Classification info ………………………………………………………… 25
Phase guarding (Tab sheet Heimdall) …………………………………… 26
[phase guarding state] is <Guarding> ………………………………… 26
[phase guarding state] is <Turbulence> ………………………………. 26
[phase guarding state] is <Recovery> ………………………………… 27
Heimdall table ……………………………………………………………. 27
Changes to the heimdall table …………………………………………. 29
Heimdall diagram as a diagnostics tool …………………………………. 30
Heimdall diagram on a stilling well …………………………………….. 30
Heimdall diagram on stilling well sections with different diameter …. 32
Raw data diagram ................................................................................. 33
SCALE ERROR ON STILLING WELL ...................................................... 34
ERRORS AND WARNINGS ..................................................................... 37
Part No.: 4417764 Revision 2
SmartRadar FlexLine Professional
For internal use only!
iii
Table of Contents
GENERAL Average temperature & Water level measurement ............... 39
COMMISSIONING Average temperature ................................................ 40
Water awareness …………………………………………………………… 40
Gauge temperature scale …………………………………………………. 40
Median filter for each calculated spot temperature ............................... 41
Averaging filter for product temperature and vapour temperature ……. 41
Averaging temperature calculation method for product and vapour
temperature …………………………………………………………………. 42
Range checking and element skipping ................................................. 45
Element wiring ....................................................................................... 46
Low level behaviour .............................................................................. 47
Low element usage ............................................................................... 47
MRT type .............................................................................................. 49
MPT element position mode ................................................................. 50
Element offset ....................................................................................... 50
MEASURED DATA Average product temperature ................................. 51
MEASURED DATA Average vapour temperature .................................. 52
COMMISSIONING Water level ............................................................... 53
MEASURED DATA Water level .............................................................. 54
CALIBRATION Water bottom probe ....................................................... 55
ADDITIONAL SETTINGS for 365 temperature and water probe ............. 59
iv
SmartRadar FlexLine Professional
For internal use only!
Part No.: 4417764 Revision 2
GENERAL
The SmartRadar FlexLine implements, amongst others, the function
product level. Because of complexity functionality is accommodated by
several tab sheets in Engauge. Next to the standard available tab sheet
‘Product level’ the following tab sheets also belong to the function product
level: ‘Compensations’, ‘Obstructions and zones’, ‘Antenna Exchange’,
‘Peak Selection’, ‘Heimdall’, ‘Advanced’ and ‘Miscellaneous’
Part No.: 4417764 Revision 2
SmartRadar FlexLine Professional
For internal use only!
1
COMMISSIONING
Level start-up (Tab sheet: Product level)
Similar to basic. In addition:
Installation on oversized (double sized) stilling well
The SmartRadar FlexLine is configured for the antenna in the factory and
the settings for the antenna generally don’t have to be adjusted. There’s
one exception however: if an S-antenna is positioned in a stilling well and
the stilling well diameter is twice the antenna size (e.g. a S06 antenna in a
12" stilling well) the [Antenna mode] should be changed from TE01 to
TE02 (Tab sheet ‘Antenna Exchange’).
Note: This only applies if the antenna is positioned in the part where the
diameter is twice the antenna size!
So when for instance an S06 antenna is positioned in the 6" part of a 6" to
12" reducer, the antenna mode should not be changed. When for example
an S10 antenna is placed on a 12" stilling well the antenna mode should
also not be changed.
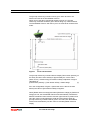
Level check (Tab sheet: Product level)
Use the [Accept Reference] command to initialize the level value of the
SmartRadar FlexLine to the given reference level. With this procedure, the
SmartRadar FlexLine now measures the reference level and the
instrument will follow all relative level changes.
This command will only be accepted when the product level status is
<GOOD> and the phase guarding state is unequal to <Turbulence>. This
command also puts the SmartRadar FlexLine in accurate level
measurement mode, so this command MUST be given!
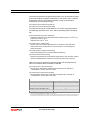
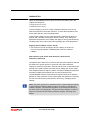
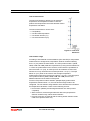
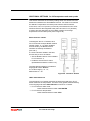
The [Accept Reference] command can handle either a reference innage or
a reference ullage level. To adjust to an innage level fill in entity
[Reference innage], to adjust to an ullage level fill in entity [Reference
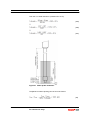
ullage] (see figure 1). In case the initial level of the SmartRadar FlexLine is
expected to have a serious deviation, for instance because the
SmartRadar FlexLine is situated near the tank wall*) and the product level
is close to the bottom, it is highly recommended to perform an ullage dip
with respect to radar reference at the position of the SmartRadar FlexLine.
This value should then be filled in entity [Radar reference ullage].
*) Near to the tank wall is when distance: antenna – tank wall is:
< 0.2 x [Tank Bottom Position] for F06 antenna
< 0.15 x [Tank Bottom Position] for F08 antenna
2
SmartRadar FlexLine Professional
For internal use only!
Part No.: 4417764 Revision 2
Commissioning
The [Accept reference] command can be given when all values are
entered and sent to the SmartRadar FlexLine.
When none of the above mentioned entities is known, the [Accept
reference] command should be given without filling any of these entities.
The SmartRadar FlexLine will now be put in accurate level measurement
mode.
Figure 1
Level check entities
The [Accept reference] command doesn’t adjust [Tank bottom position], so
this entity should be set manually to approximately the correct value
(within ±0.1m). Instead entity [Tank bottom offset] is adjusted. Innage is
calculated as:
[Tank bottom position] + [Tank bottom offset] – Radar Ullage
(1)
So in the configuration of figure 1 (where tank zero is above the tank
bottom) the value of [Tank bottom offset] is negative.
When [Radar reference ullage] and either [Reference ullage] or [Reference
innage] are set, the SmartRadar FlexLine will automatically calculate the
difference between radar reference and the upper reference position and
store this value in entity [Difference radar and user ullage]. When an
[Accept reference] command will be given in the future, the SmartRadar
FlexLine will automatically use this value to calculate [Radar reference
ullage].
Part No.: 4417764 Revision 2
SmartRadar FlexLine Professional
For internal use only!
3
Commissioning
So when [Difference radar and user ullage] is available, there is no need to
perform an additional ullage dip at the position of the SmartRadar
FlexLine. [Difference radar and user ullage] is the difference between
radar and user reference. So in the configuration of figure 1 (where upper
reference is above radar reference) the value of [Difference radar and user
ullage] is negative.
Figure 2
Overview [Accept reference] command
Finally, check [Accept reference status] to see if the command has been
accepted. If the status is <Accept reference failed>, the SmartRadar
FlexLine has probably an <UNCERTAIN> or <BAD> health status. If the
status is <Accept reference not accepted>, the SmartRadar FlexLine is in
the <Turbulence> state (see diagnostics ‘Phase guarding’).
4
SmartRadar FlexLine Professional
For internal use only!
Part No.: 4417764 Revision 2
Commissioning
When the tank is (almost) empty, there’s a good chance the gauge will get
in the <Turbulence> state when the product is pumped into the tank for the
first time. In that case the Heimdall table won’t be build up and a new
[Accept reference] command has to be given when there’s product in the
tank.
Note: Entities [Tank bottom position] and [Upper reference position] must
be set to the correct value before an [Accept reference] command is given.
Note: When the SmartRadar is moved to another location entity
[Difference radar and user ullage] must be cleared as well as the Heimdall
table. The Heimdall table can be cleared by the [Clear Heimdall Table]
command. [Difference radar and user ullage] can be cleared by the [Clear
difference] command. Don’t set [Difference radar and user ullage] to 0,
because this is a valid value!
Engauge
To make sure the [Accept reference] command works fine all entities
must have been sent to the gauge (no yellow backgrounds may be
visible) prior to giving the command.
To read the [Accept reference status] push the [Read] button (is not
automatically displayed).
To clear entity [Difference radar and user ullage] use [Clear difference]
command.
SmartView
When the [Accept reference] command has failed, an “error” message
will appear behind the command. When no message is visible, the
command has succeeded.
Because of the limited space on the SmartView display, some entities
and statuses are abbreviated:
o [Radar reference ullage] is shown as [Reference radar] or [Ref. Radar
ull.] (from software version A1120).
o [Accept reference status] is shown as [Reference status] and can be
found in the commissioning menu.
o [Difference radar and user ullage] is shown as [Dif usr radr ull].
o [Clear difference] command to clear entity [Difference radar and user
ullage] is shown as [Clr usr radr ull] in the command menu.
o Status <Accept reference failed> is shown as <Fail NOK>.
o Status <Accept reference not accepted> is shown as <Not accp>.
Part No.: 4417764 Revision 2
SmartRadar FlexLine Professional
For internal use only!
5
Commissioning
Alarm settings (Tab sheet: Product level)
Similar to basic.
Alarm loop checking (Tab sheet: Product level)
Similar to basic.
Manual overwrite (Tab sheet: Product level)
With a manual overwrite the primary value (innage) can be overwritten by
a manual value.
To get a manual value:
Give [Kill measurement] command
Fill in [Manual overwrite] and send it to the gauge.
To return to instrument level press [Resurrect].
Note: Manual value is only applied to the primary value (innage). The
secondary value (ullage) is still an instrument value!
6
SmartRadar FlexLine Professional
For internal use only!
Part No.: 4417764 Revision 2
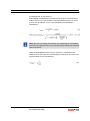
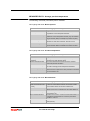
COMPENSATIONS (TAB SHEET: COMPENSATION)
Compensations can be enabled or disabled by setting the appropriate
switches in entity [Compensations and features].
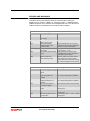
Table 1 Compensation switches
Position
Compensation or feature
Default
1
-
False (Disabled)
2
Compensation by verification pins
False (Disabled)
3
Linear compensation
False (Disabled)
4
Tank shell expansion compensation
False (Disabled)
5
Compensation for hydrostatic deformation
False (Disabled)
6
Moving averaging filter
True (Enabled)
7
Predictive moving averaging filter
False (Disabled)
8
Level end switch
False (Disabled)
9
Maximum safe fill
True (Enabled)
Output filters
The SmartRadar FlexLine can activate an output filter for both radar
innage and radar ullage to reduce level noise. The higher the value of the
[filter averaging constant], the more damping on the radar innage and
radar ullage values. The minimum value of the [filter averaging constant] is
0 (no filtering), the maximum value is 99.95 (99 up to software version
A1110).
There’s a choice between two types of filters: a ‘moving averaging filter’
and a ‘predictive moving averaging filter’.
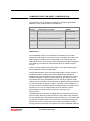
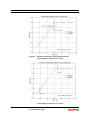
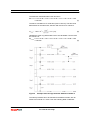
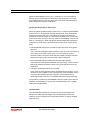
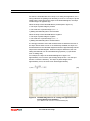
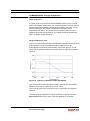
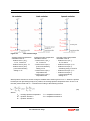
The general behaviour of the moving averaging filter is shown in figure 3.
The filter introduces a lag between actual ullage/innage and filtered
ullage/innage when the product level is changing. The higher the value of
the [filter averaging constant], the larger the lag is. Because of the high
level update rate of the SmartRadar FlexLine, the lag is relatively small.
Table 2 gives an indication of the behaviour for different filtering constants.
E.g. when the [filter averaging constant] = 95 and the level change is 0.5
mm per second, the maximum lag will be approximately 2 seconds in time
and thus 2*0.5=1 mm in distance while the noise reduction will be
approximately 4.5 (level change is 0.02”/sec; maximum lag is
2*0.02”=0.04”).
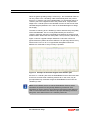
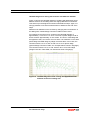
A disadvantage of the moving averaging filter is the lag when the product
level is moving. When the product level is moving uniformly the predictive
moving averaging filter will eliminate the lag (see figure 4). This means that
the output level will be equal to the actual level. The output level will now
however have some overshoot when the product level starts and stops
moving. Because of the high level update rate of the SmartRadar FlexLine,
Part No.: 4417764 Revision 2
SmartRadar FlexLine Professional
For internal use only!
7
Compensations
8
Figure 3
Example of moving average filter behaviour
3
(level change = 5 mm/sec ( /16”/sec))
Figure 4
Example of predictive moving average filter behaviour
3
(level change = 5 mm/sec ( /16”/sec))
SmartRadar FlexLine Professional
For internal use only!
Part No.: 4417764 Revision 2
Compensations
the overshoot is relatively small. Table 3 gives an indication of the
behaviour for different filtering constants. E.g. when the [filter averaging
constant] = 98 and the level change is 0.7 mm/sec (0.03”/sec), the
overshoot will be approximately 2.9 *0.7 = 2 mm (2.9*0.03” ≈ 0.09”) while
the noise reduction will be approximately 7. The output of the filter will
return to within 0.1 mm (5% of 2 mm) (0.004” (5% of 0.09”)) of the actual
level in approximately 30 seconds, both at the start and end of the
pumping.
Only one of both filters can be selected as output filter. When both filters
are enabled (both switch 6 and 7 are true) only the ‘moving averaging filter’
is activated.
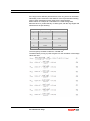
Table 2 Filter characteristics of moving averaging filter
(dL = actual displacement per second)
Filter
averaging
constant
Approximate
noise
reduction factor
Maximum lag
during
pumping [sec]
Maximum lag
during
pumping (distance)
50
1.4
0.1
0.1 * dL/sec
70
1.8
0.25
0.25 * dL/sec
90
3
1
1 * dL/sec
95
4.5
2
2 * dL/sec
98
7
5.5
5.5 * dL/sec
99
10
11
11 * dL/sec
99.5
14
22
22 * dL/sec
99.8
22
55
55 * dL/sec
99.9
32
110
110 * dL/sec
99.95
45
220
220 * dL/sec
Table 3 Filter characteristics of predictive moving averaging filter
(dL = actual displacement per second)
Filter averaging Approximate noise
constant
reduction factor
Part No.: 4417764 Revision 2
Maximum
overshoot
Time to return within
5% of overshoot [sec]
50
1.4
0.1 * dL/sec
1.8
70
1.8
0.2 * dL/sec
3.3
90
3
0.7 * dL/sec
8.3
95
4.5
1.3 * dL/sec
14
98
7
2.9 * dL/sec
29
99
10
4.9 * dL/sec
50
99.5
14
8.2 * dL/sec
90
99.8
22
15.5 * dL/sec
200
99.9
32
25 * dL/sec
400
99.95
45
38 * dL/sec
750
SmartRadar FlexLine Professional
For internal use only!
9
Compensations
Verification pin compensation
Similar to basic.
Linear compensation
With the linear compensation, ullage can be adjusted by a gain factor and
an offset:
CompensatedUllage = [Gain]*Ullage +Offset
(2)
rd
To enable the linear compensation the 3 switch of [Compensations and
features] should be set to ‘True’ and the following entities should be set:
[Primary value gain] and [Primary value offset].
Note: Despite their names, [Primary value gain] and [Primary value offset]
are NOT affecting innage (primary value) directly. The compensation is
applied to ullage!
Engauge
Primary value gain] and [Primary value offset] are to be found
on the tab sheet ‘Product level’. The switch is to be found on
tab sheet ‘Compensations’
Tank shell compensation (Gauge reference compensation)
Thermal expansion of the tank shell or stilling well influences the reference
position of the SmartRadar. A compensation method shall be applied so
that the total deviation for a temperature change of 10°C falls within the
maximum permissible error for the installed SmartRadar (according to
OIML R85).
Radar ullage is influenced by thermal expansion of the tank shell, but this
distance is a ‘true’ measured value. Hence, the compensation is applied to
radar innage. The compensation only takes expansion of the vapour space
area of the tank shell into account. The tank shell temperature is not a
direct measured parameter. It will therefore be calculated from vapour and
ambient temperature.
If the SmartRadar FlexLine is equipped with the average temperature
option, the vapour temperature is measured and used in the gauge
reference correction calculations. If this temperature value is not available,
then a manual value is used. So for the vapour temperature the following
quantity is used (in decreasing priority):
Distributed vapour temperature
[Tank Shell manual vapor temperature]
[Tank shell last valid vapor temperature]
10
SmartRadar FlexLine Professional
For internal use only!
Part No.: 4417764 Revision 2
Compensations
As ambient temperature the [Board temperature] can be selected by entity
[Tank shell ambient temperature selection]. If this entity is set to ‘Ambient
temperature manual’, the following quantity is used for the ambient
temperature (in decreasing priority):
[Tank Shell manual ambient temperature]
[Tank Shell last valid ambient temperature]
th
To enable the tank shell compensation the 4 switch of [Compensations
and features] should be set to ‘True’ and the following entities should be
set:
[Tank shell thermal expansion coefficient]
-6
Expansion coefficient of the tank shell material. (default value is: 10x10 m/°C).
-6
Carbon steel: 12x10 m/°C
-6
Stainless steel: 16x10 m/°C
[Tank shell vapour ambient ratio]
Ratio of vapour and ambient temperatures for calculation of the tank shell
temperature. Refer to table below for more information on the settings in a
particular situation.
[Tank shell ambient temperature selection]
Select board temperature or manual ambient temperature.
[Tank shell reference temperature]
Reference temperature for the tank shell compensation. This should be equal to
the tank shell temperature at the time of the [Accept reference] command.
Next to the previous entities the following entities can be programmed
when no measured data is available or selected.
[Tank shell manual vapor temperature]
Manual vapour temperature. Health status should be set to <GOOD> or
< UNCERTAIN > for this value to be used.
[Tank shell manual ambient temperature]
Manual ambient temperature. Health status should be set to <GOOD> or
< UNCERTAIN > for this value to be used.
Table 4 Standard values for [Tank shell vapour ambient ratio]
Tank type
[Tank shell vapour ambient ratio]
Fixed roof tank
0.5
Fixed roof tank with stilling well *)
1
Insulated fixed roof tank
1
Floating roof tank with stilling well *)
0
Floating roof tank without stilling well
0
*) Here is meant that the SmartRadar is installed on the stilling well.
The stilling well must be fixed at the tank bottom or at the first ring of the tank shell. If the stilling well is fixed at the top of
the tank, then select the values for entity items [Tank shell vapour ambient ratio] from the tank type without stilling well.
Part No.: 4417764 Revision 2
SmartRadar FlexLine Professional
For internal use only!
11
Compensations
[Tank shell temperature] is calculated as:
{[Tank shell vapor ambient ratio] x [Tank shell used vapor temperature]} +
{1 – [Tank shell vapor ambient ratio]} x [Tank shell used ambient temperature]
(3)
[Tank shell compensation] is calculated as follows:
{[Tank bottom position] – Primary Value} x [Tank shell thermal expansion
coefficient] x {[Tank shell temperature] – [Tank shell reference temperature]}
(4)
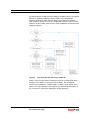
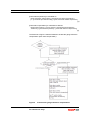
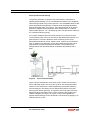
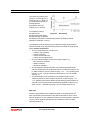
The flowchart in figure 5 shall be followed to enable the gauge reference
compensation (tank shell compensation).
Figure 5
12
Flowchart for gauge reference compensation
SmartRadar FlexLine Professional
For internal use only!
Part No.: 4417764 Revision 2
Compensations
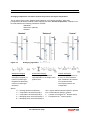
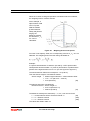
Hydrostatic deformation compensation
Due to the liquid pressure on the tank shell, the tank shell will bulge. As a
result of this tank shell deformation the tank roof moves downwards. Level
gauges, which are installed on roof nozzles of fixed roof tanks, are
influenced by this movement. The SmartRadar FlexLine provides an
innage compensation for this deformation. This compensation is
dependent on the innage level.
th
To enable the hydrostatic deformation compensation the 5 switch of
[Compensations and features] should be set to ‘True’ and the following
entities should be set:
[Hydrostatic deformation factor]
This entity contains the compensation factor in [mm]/m.
[Hydrostatic deformation minimum innage]
This entity contains the innage above which the compensation becomes
effective. Below this innage no compensation is applied.
First, the upper reference movement must be found. Then with linear
regression, a best fit line can be found as compensation. The outcome of
that calculation is used for the [Hydrostatic deformation factor] and
[Hydrostatic deformation minimum innage] values.
Calculation of upper reference movement:
With the following formula (according to OIML R 85) the tank shell
deformation can be calculated:
(5)
where
δh :
D :
ρ :
g :
μ :
E :
t
:
h :
tank shell deformation [m]
tank diameter [m]
3
product density [kg/m ]
2
local gravity constant [m/s ]
Poisson’s constant (for steel μ=3.3)
9
modulus of elasticity (for steel E=206.1 x 10 )
tank shell (ring) thickness [m]
distance of the liquid surface with respect to a level below the
liquid surface
a and b are e.g. the distances of the liquid surface with respect to the top
and bottom of the shell segment under investigation.
If the tank shell thickness and internal diameter remains constant over the
total height, a=0 and b equals the innage level.
Part No.: 4417764 Revision 2
SmartRadar FlexLine Professional
For internal use only!
13
Compensations
If the rings have a different plate thickness, each ring has to be calculated
individually, where a and b are the distance of the top and bottom welding
seam of each individual ring with respect to the liquid surface.
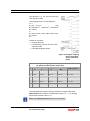
Below follows an example of a calculation for a steel storage tank,
diameter 83.82 m, product density of 1000 kg/m3, with the ring heights and
wall thickness as per following:
Table 5 Example of tank ring measures
Ring no.
Ring height [m]
Wall thickness [mm]
1
2.743
38.1
2
2.390
36.2
3
2.393
28.9
4
2.390
24.7
5
2.390
20.5
6
2.393
16.3
7
2.390
12.2
8
2.390
11.8
9
2.466
9.5
2
The local gravity constant is taken as: 9.81288 m/s
The deformation per ring is (refer to figure 6 for the calculation of the ullage
values per ring):
14
SmartRadar FlexLine Professional
For internal use only!
Part No.: 4417764 Revision 2
Compensations
The total tank shell deformation then becomes:
δh21.945 = 0.19 + 0.45 + 0.72 + 0.75 + 0.76 + 0.77 + 0.78 + 0.72 + 0.90
= 6.04 mm.
(7)
The above calculation is for a full tank (level 21.945 m). The tank shell
deformation for the same tank, but then with a level of 21 metres is:
(8)
Likewise the other ring deformations are to be calculated. If that is done
the outcome is:
δh21.000 = 0.07 + 0.33 + 0.61 + 0.67 + 0.70 + 0.72 + 0.73 + 0.68 + 0.85
= 5.36 mm
(9)
Figure 6
Example steel storage tank with diameter of 83.82 m
The same procedure has to be followed for all different levels, with for
instance an interval of 1 meter. Then the following table is obtained:
Part No.: 4417764 Revision 2
SmartRadar FlexLine Professional
For internal use only!
15
Compensations
Table 6 Example of hydrostatic deformation figures
Level
[m]
Deformation
[mm]
Level
[m]
Deformation
[mm]
Level
[m]
Deformation
[mm]
0
0
8
0.54
16
2.64
1
0.01
9
0.69
17
3.08
2
0.03
10
0.88
18
3.57
3
0.07
11
1.09
19
4.17
4
0.13
12
1.32
20
4.71
5
0.20
13
1.59
21
5.36
6
0.29
14
1.90
21.945
6.04
7
0.40
15
2.25
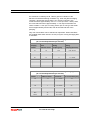
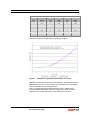
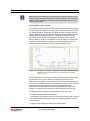
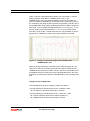
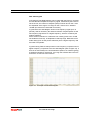
The values in table 6 are the basis for the graph in figure 7.
Figure 7
Example of hydrostatic deformation correction
Calculate a regression line from the level where the tank shell deviation is
approximately 0.5 mm. In this example, the regression line is calculated
from 8 meters level till the maximum level.
Then, the [Hydrostatic deformation factor] becomes: 0.3869 mm/m.
The [Hydrostatic deformation minimum innage] is the point where the
regression line crosses the X-axis; in this example at 8.1435 m.
16
SmartRadar FlexLine Professional
For internal use only!
Part No.: 4417764 Revision 2
Compensations
Level end switch
When the level end switch is enabled innage is limited to a minimum value.
E.g. default, innage will not be lower than 0.0 when the switch is enabled.
When innage is truncated, the weights and measures status is turned off.
A hysteresis is implemented to prevent frequent toggling of the weights
and measures status.
th
To enable the level end switch the 8 switch of [Compensations and
features] should be set to ‘True’ and the following entities should be set:
[Level end switch]
This entity determines the level threshold. When innage is lower than -[Level end
switch], innage is truncated.
For example, when [Level end switch] = -0.10 m innage will be truncated when it
gets below 0.1 m.
[Level end switch hysteresis limit]
Hysteresis limit for the weights and measures status.
When innage is truncated, ullage will be truncated as well to the
corresponding ullage value.
Ullage Correction Table
The SmartRadar FlexLine provides ullage dependant compensation on
ullage. The ullage correction table is specifically intended for different
sections of stilling wells that have different diameters, but is generally
usable.
To enable the ullage correction table corresponding ‘Distance’ and
‘Correction’ fields must be filled, so no switch has to be enabled. The
‘Correction’ field contains an offset value that will be applied at the ullage
that’s entered in the corresponding ‘Distance’ field. When the ullage
correction table has 2 or more entries filled, the compensation at ullages in
between will be linearly interpolated (see figure 8).
As soon as a ‘Distance’ element is found to be zero, it is assumed to be
the end of the ullage correction table.
Figure 8
Part No.: 4417764 Revision 2
Graphical view of ullage correction table compensation
SmartRadar FlexLine Professional
For internal use only!
17
Compensations
Note: Actually, the SmartRadar FlexLine has two ullage correction tables,
one for phase ullage and another for PSD ullage (see ‘DiagnosticsHeimdall table’). The one for phase ullage is the most important since this
one is used when the SmartRadar FlexLine is in accurate level
measurement mode. It can be found on the ‘Compensation’ sheet. The
one for PSD ullage can be found on the ‘Advanced’ sheet. It is advised to
use the PSD ullage when a stilling well has sections with different
diameters (refer to “Heimdall diagram on stilling well sections with different
diameter”).
Maximum safe fill
th
When the 9 switch of [Compensations and features] is set to ‘True’ to the
SmartRadar FlexLine checks whether innage exceeds [Maximum safe fill],
the maximum height the tank can safely be filled. At initial commissioning,
[Maximum safe fill] is 0 and must be filled in by the user.
Up to software version A1110
th
When the 9 switch of [Compensations and features] is set to ‘True’ the
status of the product level will be <UNCERTAIN> when innage exceeds
[Maximum safe fill].
From software version A1120
th
When the 9 switch of [Compensations and features] is set to ‘True’ the
status of the product level will be <BAD> when innage exceeds [Maximum
safe fill]. The status will return to <GOOD> when the product level will get
below [Maximum safe fill] without exceeding minimum ullage. When
minimum ullage is exceeded the status will permanently be set to <BAD>
until the user explicitly resets the gauge by giving a [CLEAR_OVERFILL]
command when the level is below minimum ullage.
Engauge
Maximum safe fill is found in the ‘Product level’ tab.
The software version can be found in the ‘Generic’ tab.
SmartView
Maximum safe fill is found in the commissioning menu as max. safe fill.
The software version can be found in the identification menu.
18
SmartRadar FlexLine Professional
For internal use only!
Part No.: 4417764 Revision 2
DIAGNOSTICS
When the SmartRadar FlexLine gives an inaccurate reading, there are
roughly two categories:
Large errors (>0.15 m)
Small errors (<0.10 m)
The first category of errors is usually caused by selection of the wrong
peak as level peak in the power spectrum. To solve these problems refer
to the ‘peak selection’ part of the diagnostics.
In the second category of errors the right peak is selected, but there’s a
problem with calculating the product level accurately. On a stilling well
application the diameter of the stilling well might be wrong (see Measuring
on stilling well). Else, refer to the ‘phase guarding part’ of the diagnostics.
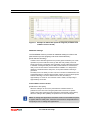
Engauge (from software version A1130)
The ‘Product level’ tab in Engauge shows a history of the last 10
occurred warning statuses (<UNCERTAIN>) and error statuses
(<BAD>).
Peak selection (Tab sheets Peak Selection, Obstructions
and zones, Advanced)
All objects that are within the microwave path will cause reflections that will
be visible in the power spectrum. Apart from the product reflection,
reflections caused by the bottom, antenna and all kinds of obstructions like
heating coils, welding seams from tank shell or stilling well can be visible.
Also multiple reflections might be visible, for instance additional reflections
that travel multiple times between the roof and the product level.
The SmartRadar FlexLine automatically recognizes all kinds of reflection
patterns in order to find the correct product peak. But whenever necessary
the user can influence the peak selection process by changing certain
settings.
Note: The power spectrum is visualized in the so-called reflection diagram
or high resolution reflection diagram. Figure 10 shows an example of a
reflection diagram. The reflection diagrams can be made and viewed by
the Enraf service tool (Engauge). The high resolution diagram contains 4
times as much data as the ordinary reflection diagram, providing more
details.
Part No.: 4417764 Revision 2
SmartRadar FlexLine Professional
For internal use only!
19
Diagnostics
Zones and threshold settings
The primary parameter to influence the peak selection is [Relative to
highest peak threshold]. This is a threshold that’s relative to the amplitude
of the strongest peak in the power spectrum. The SmartRadar FlexLine will
ignore all peaks that are [Relative to highest peak threshold] dB weaker
than the strongest peak. For instance, if the strongest peak is 42 dB and
[Relative to highest peak threshold] is at the default value of 16 dB, all
peaks weaker than 42 - 16 = 26 dB are ignored. The threshold is valid over
the complete measuring range.
For complex situations where the peak selection is not able to find the
correct product peak, zones can be used to add additional thresholds. For
peak selection, the tank is divided in three measuring zones where
individual thresholds can be set: antenna zone, product zone and bottom
zone. In addition ten obstruction zones with individual thresholds can be
programmed. All these thresholds are absolute. Only peaks that are
stronger than these thresholds will be considered as possible product
peak.
Figure 9
Zones and thresholds
Figure 9 shows the definition of the three zones. Please note that the Xaxis is indicating ullage. The zero point on the X-axis represents Radar
reference. The antenna zone starts at [Minimum measurable distance]
from the antenna. The bottom zone is defined with respect to the tank
bottom ([Tank bottom position]). The product zone is the part of the tank
between antenna and bottom zone. These zones are also visible in the
reflection diagram (see figure 10). Figure 10 also shows [Relative to
highest peak threshold], but this threshold is not shown by Engauge up to
software version A1122.
20
SmartRadar FlexLine Professional
For internal use only!
Part No.: 4417764 Revision 2
Diagnostics
Note: Don’t use the [Bottom zone threshold] to mask the reflection of the
bottom, unless absolutely necessary. The peak selection uses the bottom
reflection (when present) to locate the product peak when the product is
near the tank bottom.
From software version A1130:
The relative threshold is always valid over the complete measuring range,
but the actual value depends on the position of the strongest peak. When
the strongest peak is positioned in the antenna zone or product zone the
value is determined by entity [Relative to highest peak threshold] (default:
16 dB); when the strongest peak is in or beyond the bottom zone the
threshold is determined by entity [Relative to highest peak threshold
BZone] (default: 16 dB). In case there is a strong reflection from the tank
bottom, the entity [Relative to highest peak threshold BZone] can be
adapted in order to select the product peak in the bottom zone.
Figure 10 Example of reflection diagram with zones and thresholds
(Relative to highest peak threshold is shown by Engauge from software
version A1130)
In case obstructions (e g heating coils) are located in the microwave path,
an obstruction zone can be defined to mask the reflection from the
obstruction. The position of the obstruction zone and its threshold can be
found from the reflection diagram. The ullage and position of the maximum
15 strongest detected peaks can be read in entity [Radar peak
diagnostics]. An obstruction zone must be enabled before it becomes
effective. The length of the obstruction zone should be at least 0.45m.
An obstruction zones influences the peak selection in two ways:
It masks reflections below the threshold.
Peaks below the threshold will not be selected as product peak, except if
the peak is identified as product peak in the differential spectrum (see
next section).
It enlarges the margins for tracking the product peak.
Part No.: 4417764 Revision 2
SmartRadar FlexLine Professional
For internal use only!
21
Diagnostics
The SmartRadar FlexLine keeps track of the product peak with respect
to previous measurements. When the product passes an obstruction,
wild fluctuations can occur in the location of both product peak and
obstruction peak. Using an obstruction zone can enhance peak tracking,
especially when the obstruction is strong compared to the product peak.
Note: When the obstruction peak is stronger than the product peak it will
be impossible to measure accurately in the neighbourhood of the
obstruction.
Differential spectrum
The peak selection is not entirely based on the peaks in the power
spectrum. The SmartRadar FlexLine also calculates a so-called differential
spectrum. In this spectrum, only peaks that change over time will be
visible. This is especially useful when the product level is changing or
turbulent. Information about the maximum 15 strongest detected peaks in
the differential spectrum can be read in entity [Radar peak diagnostics diff].
The differential spectrum has one fixed threshold [Differential spectrum
threshold] (default: 30 dB) and a relative threshold which is relative to the
highest peak in the differential spectrum [Diff. rel. to highest peak
threshold] (default: 20 dB). See also the chapter about “Zones and
thresholds” for a description of relative thresholds.
From software version A1130:
The relative threshold is always valid over the complete measuring range,
but the actual value depends on the position of the strongest peak. When
the strongest peak is positioned in the antenna zone or product zone the
value is determined by entity [Diff. rel. to highest peak threshold]; when the
strongest peak is in or beyond the bottom zone the threshold is determined
by entity [Diff. rel. to highest peak threshold BZone] (default: 20 dB).
Note: The differential spectrum is visualized in the so-called differential
spectrum diagram or high resolution differential spectrum diagram. Figure
11 shows an example of a differential spectrum diagram. The differential
spectrum diagrams can be made and viewed by the Enraf service tool
(Engauge). The differential diagram shows only one threshold which is the
highest of the absolute threshold and the relative threshold that is used.
The high resolution diagram contains 4 times as much data as the ordinary
diagram, providing more details.
22
SmartRadar FlexLine Professional
For internal use only!
Part No.: 4417764 Revision 2
Diagnostics
Figure 11 Example of differential spectrum diagram (available from
software version A1130)
Additional settings
The SmartRadar FlexLine provides an additional setting to influence the
peak selection process (Engauge: tab sheet ‘Peak selection’):
[Peak selection fail delay]
Variations in the reflected signal from the product (product reflection) can cause
repetitive low product reflection warnings. With this entity a delay can be set
before this warning is generated. During the delay, the last valid measured level
is available. If during the delay time a valid product reflection is measured, the
delay counter is reset and the measured data is available. If no valid product
reflection is obtained after the delay time, a low product reflection warning is
generated.
The delay time is not directly in a time unit, but in number of measurements. The
SmartRadar FlexLine measures approximately 9 times per second. When [Peak
selection fail delay] is set to the default value of 1000, time delay is
approximately 110 seconds. The maximum value is 10000, corresponding to
approximately 18 minutes.
From software version A1120:
[Preference to first peak]
When this setting is set to true, the peak selection software will have a
preference for the first of two strongest peaks when more than one peak is
visible in the power spectrum (the first peak is the peak closest to the antenna).
When this setting is false (default), the preference is for the furthest peak.
Note: On stilling well applications unwanted modes cause additional peaks
to appear after the main peak. Therefore it is advised to set [Preference to
first peak] to true on stilling well applications.
Part No.: 4417764 Revision 2
SmartRadar FlexLine Professional
For internal use only!
23
Diagnostics
Diagnostic entities
The SmartRadar FlexLine provides additional information on the peak
selection process by the entities described below (Engauge: tab blad ‘Peak
selection’). These entities are all ‘freeze’ entities, so the freeze command
should be given to get recent data. The freeze command can be omitted if
a reflection diagram is recently retrieved, because the freeze command is
automatically issued. The peak selection data will then correspond to the
latest reflection diagram.
[Selected peak index]
Index of the selected peak in the high resolution power spectrum.
[Confidence level]
Probability of the selected peak. Confidence level varies between 0 and 100.
A confidence level of 100 means the selected peak is definitely the right peak.
A confidence level lower than 100 means there are other candidates as well.
[Number of detected peaks]
Number of peaks in the high resolution power spectrum above the thresholds.
[Detected peaks]
A list containing the indices of the detected peaks in the power spectrum. The list
is ordered by strength. The strongest peak is the first, the weakest the last. For
more information on the peaks check [Radar peak diagnostics].
[Radar peak diagnostics]
Information on the detected peaks in the power spectrum. Of special interest is
the ‘Classification’ field. This will show information on how the SmartRadar
FlexLine evaluates the detected peaks. The Information consists of three parts
separated by spaces: {Knowledge source} {Peak classification} {Confidence
level}. See classification info for an explanation.
[Detected peaks diff]
A list containing the indices of the detected peaks in the differential spectrum.
The list is ordered by strength. The strongest peak is the first, the weakest the
last. For more information on the peaks check [Radar peak diagnostics diff].
[Radar peak diagnostics diff]
Information on the detected peaks in the differential spectrum. As with the
diagnostics of the power spectrum, the ‘Classification’ field shows information on
how the SmartRadar FlexLine evaluates the detected peaks. PSD ullage is not
available for peaks in the differential spectrum.
From software version A1130:
[Tracked peak info]
Information on the tracked peak. Suppress counter and suppress state are
related to the peak selection fail delay mechanism. Suppress counter shows how
many times the tracked peak has not been seen.
24
SmartRadar FlexLine Professional
For internal use only!
Part No.: 4417764 Revision 2
Diagnostics
Classification info
The classification information consists of three parts separated by spaces:
{Knowledge source} {Peak classification} {Confidence level}
{Knowledge source}: The knowledge source indicates the type of pattern
the peak may be part of. The SmartRadar FlexLine has the following
knowledge sources:
RFL
BOT
OBS
ANT
BSP
CLS
The peak is part of a multiple reflection pattern (product or echo). In
this case, a pattern of reflections is present that satisfy the conditions
(amplitude and distance) of multiple reflections caused by the roof.
The peak is part of a product and bottom pattern.
The peak is part of an obstruction.
The peak is part of an antenna pattern (antenna reflection or antenna
echo).
The peak is not related to another peak.
The peak is closest to the antenna. This classification info is only
possible for peaks in the differential spectrum.
{Peak classification}: The peak classification indicates the type of peak.
The SmartRadar FlexLine knows the following types:
PRD
ANT
AE
BOT
OBS
ECH
The peak is a possible product reflection.
The peak is the antenna.
The peak is an antenna echo.
The peak is the bottom reflection.
The peak is an obstruction.
The peak is an echo (multiple reflection).
{Confidence level}: The probability of that particular assumption.
Some examples:
RFL ECH 100
RFL PRD 100
BSP PRD 082
BOT PRD 100
BOT BOT 100
OBS OBS 100
OBS OBS 050 - BSP PRD 009
Part No.: 4417764 Revision 2
This peak is part of a multiple reflection. It is
identified as an echo of the product peak with
a 100% probability.
This peak is part of a multiple reflection. It is
identified as the first of a series of peaks with a
100% probability.
This peak has no relation to other peaks. It is
identified as a possible product peak with an
82% probability.
This peak is part of a product and bottom
pattern. It is identified as the product reflection
with a 100% probability.
This peak is part of a product and bottom
pattern. It is identified as the bottom reflection
with a 100% probability.
This peak is in an obstruction zone and is
below the threshold of the obstruction zone.
This peak is in an obstruction zone, but is
above the threshold. It is also identified as a
possible product peak with a 9% probability.
SmartRadar FlexLine Professional
For internal use only!
25
Diagnostics
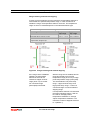
Phase guarding (Tab sheet Heimdall)
The SmartRadar FlexLine is able to measure level accurately, even under
difficult circumstances like close to the tank wall, near obstructions such as
heating coils or in stilling well with the wrong diameter. But the SmartRadar
FlexLine needs to be in the proper ‘phase guarding state’.
Apart from initialization, the [phase guarding state] is <Guarding>,
<Turbulence> or <Recovery>.
[phase guarding state] is <Guarding>
When the [phase guarding state] is <Guarding> it means the SmartRadar
FlexLine is in accurate level measurement mode. Product level should be
accurate. Check commissioning parameters such as [Stilling well
diameter], radar application and Compensations. If these are correct check
the Heimdall table for irregularities (see Heimdall table).
[phase guarding state] is <Turbulence>
When the [phase guarding state] is <Turbulence> it means the product
level is too turbulent to measure accurately. This can be caused by fast
pumping actions or bad weather conditions such as heavy winds on
floating roof tanks, especially when the level is low. It can also be caused
by unstable peak selection. While the [phase guarding state] is in
<Turbulence> it is important to find the cause. There can be three:
The SmartRadar FlexLine is not able to locate any peaks in the power
spectrum.
In this case the entity [No peaks counter] is increasing steadily. This can
be caused by heavy turbulence of the product level or by poor settings of
peak selection entities. Check the peak selection entities for high
thresholds (Obstructions and zones), check the reflection diagram and
check for large variations of the [Product peak amplitude] (Advanced).
The SmartRadar FlexLine switches to another peak regularly.
In this case the entity [Peaks switched counter] is increasing slowly.
There are most likely peak selection problems. Refer to the peak
selection part of the diagnostics.
The phase guarding threshold is exceeded.
In this case the entity [Δphase above threshold counter] is increasing
steadily. This is caused by heavy turbulence of the product level. From
software version A1140 it is also possible that the entity [Nr. of sum
Δphase above threshold] is increasing. This entity is located at the
bottom of the tab sheet.
26
SmartRadar FlexLine Professional
For internal use only!
Part No.: 4417764 Revision 2
Diagnostics
When the SmartRadar FlexLine is in <Turbulence> it is not possible to
perform an [Accept Reference] command or get the gauge in accurate
level measurement mode in any other way. Check the Heimdall table for
further diagnostics (see Heimdall table).
[phase guarding state] is <Recovery>
When the [phase guarding state] is <Recovery> it means the SmartRadar
FlexLine is not in accurate level measurement mode. If the SmartRadar
FlexLine has once been put in <Guarding> by the [Accept reference]
command, it must have been in <Turbulence> at least once. Check entity
[Turbulence state counter] to see how often the SmartRadar FlexLine has
been in <Turbulence>. When the [phase guarding state] has entered the
<Turbulence> state often, it is important to find the cause. There can be
three:
The SmartRadar FlexLine is not able to locate any peaks in the power
spectrum.
In this case the entity [No peaks counter] is large. This can be caused by
heavy turbulence of the product level or by poor settings of peak
selection entities. Check the peak selection entities for high thresholds
(Obstructions and zones) and check the reflection diagram.
The SmartRadar FlexLine switches to another peak regularly.
In this case the entity [Peaks switched counter] is large. There are most
likely peak selection problems. Refer to the peak selection part of the
diagnostics.
The phase guarding threshold is exceeded.
In this case the entity [Δphase above threshold counter] is large. This is
caused by heavy turbulence of the product level. From software version
A1140 it is also possible that the entity [Nr. of sum Δphase above
threshold] is large. This entity is located at the bottom of the tab sheet.
The question is whether the SmartRadar FlexLine is able to get back into
guarding. This depends on the amount of valuable data in the Heimdall
Table (see Heimdall table).
Heimdall table
The Heimdall table contains the minimum and maximum differences
between accurate and PSD ullage. The Heimdall table provides the
reference for the accurate level measurement mode. It’s also a valuable
diagnostic tool.
Part No.: 4417764 Revision 2
SmartRadar FlexLine Professional
For internal use only!
27
Diagnostics
When the [phase guarding state] is <Recovery>, the SmartRadar FlexLine
can only return to the <Guarding> state automatically when the product
level is in a <VALID> part of the Heimdall table. To see whether there’s a
<VALID> part in the neighbourhood of the present level, compare PSD
ullage to the <VALID> parts in the Heimdall overview or take a look at the
Heimdall Diagram (Attention: the x-axis of the Heimdall diagram is ullage,
not innage).
The ease of returning to the <Guarding> state is determined by the quality
of the Heimdall table. This is not only determined by the amount of
<VALID> segments, but also by the difference between the minimum and
maximum lines. When both are close (within 15 mm) recovery will be easy.
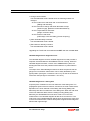
Figure 12 shows a typical example. Between 5.5 and 6.5 m there’s a
typical obstruction pattern where the difference is quite large and recovery
will be hard. From 7 to 16 m is a typical tank wall pattern where the
difference is small and an easy recovery is possible.
Figure 12 Example of Heimdall diagram with <VALID> part
If there is no <VALID> part at all, the SmartRadar FlexLine will not be able
to return to accurate level measuring mode at all. In this case, only an
[Accept Reference] command will get the SmartRadar FlexLine into the
<Guarding> state.
Note: From software version A1140 the SmartRadar FlexLine stores
information acquired from the [Accept Reference] command. This
information is used to return to accurate level measuring mode when the
radar is around the same level where the [Accept Reference] command
was given, even when there are no <VALID> parts at all.
28
SmartRadar FlexLine Professional
For internal use only!
Part No.: 4417764 Revision 2
Diagnostics
Figure 13 shows a Heimdall diagram where part of the table is <VALID>
(green) and part of the table is <AMBIGUOUS> (red). In the
<AMBIGUOUS> part of the table the differences are still recorded, but
there’s no reference available for the accurate level. To be able to get into
the <Guarding> the ullage needs to get into a high quality <VALID> part of
the Heimdall table. High quality means that the lines are within 15mm from
each other. In this example the parts between 5.0 - 5.3 m and 6.7 - 7.0 m
are high quality and the part between 5.3 - 6.7 m is poor quality. When
there are no high quality <VALID> elements, the only possibility to get the
gauge into the <Guarding> state is an [Accept reference] command.
Figure 13 Example of Heimdall diagram with <VALID> and
<AMBIGUOUS> part
When an [Accept reference] command is given while the gauge is in the
<Recovery> state, all <VALID> parts of the table will be cleared and all
<AMBIGUOUS> parts will be made <VALID>. When it’s impossible for the
SmartRadar FlexLine to build up a proper Heimdall table due to too much
turbulence it is advised to build up a Heimdall table by slowly emptying the
tank.
Changes to the heimdall table
The Heimdall table can be changed by certain user actions:
[Accept reference] command when in the <Guarding> state.
All non-<EMPTY> elements will be set to <VALID>.
[Accept reference] command when in the < Recovery > state.
All <VALID> elements will be set to cleared (<EMPTY>).
All <AMBIGUOUS> elements will be set to <VALID>.
Part No.: 4417764 Revision 2
SmartRadar FlexLine Professional
For internal use only!
29
Diagnostics
Change certain entities.
The Heimdall table will be cleared when the following entities are
changed:
At the ‘Product level’ tab sheet and on the SmartView:
[Stilling well diameter]
At the ‘Antenna Exchange’ tab sheet all entities except:
[Antenna type], [Minimum measurable distance]
At the ‘Compensations’ tab sheet:
[Ullage correction table]
At the ‘Advanced’ tab sheet:
[PSD ullage correction table], [Center frequency]
[Clear Heimdall table] command.
The Heimdall table will be cleared.
[Set entities to default] command.
The Heimdall table will be cleared.
Upgrading the TII-XR with new software will NOT clear the Heimdall table.
Heimdall diagram as a diagnostics tool
The Heimdall diagram can be a valuable diagnostic tool and provides a
snapshot of all difficulties the SmartRadar FlexLine is facing. When the
Heimdall diagram has both <VALID> and <AMBIGUOUS> parts, the
dividing line tells where the problems with turbulence or peak selection
occur.
The shape of the Heimdall diagram tells a lot about the phenomena the
gauge has encountered. Obstructions can be easily identified by their
typical pattern (see figure 12 between 5 and 7 m) as well as the influence
of the tank wall (see figure 12 between 7 and 16 m).
Heimdall diagram on a stilling well
A special point of attention is the inner diameter of the stilling well. The
propagation speed of the microwaves, and hence the level measurement,
depends on the inner diameter of the stilling well. Entity [Stilling well
diameter] holds the inner diameter of the stilling well. When the real value
of the inner diameter differs from the setting in entity [Stilling well
diameter], the SmartRadar FlexLine has a scale error in the level
measurement. The Heimdall diagram will also show a scale error. The
scale error in the Heimdall diagram will be twice as large as the scale error
in the level measurement, because both phase ullage and PSD ullage are
affected with opposite sign.
30
SmartRadar FlexLine Professional
For internal use only!
Part No.: 4417764 Revision 2
Diagnostics
So when the Heimdall table has a slope on a stilling well application, it’s a
strong indication the [Stilling well diameter] is incorrect. The slope of phase
ullage has the same sign as the slope of the Heimdall diagram, the slope
of PSD ullage has opposite sign
When the slope of the Heimdall table is positive (like in figure 14):
The slope of phase ullage is positive
The scale error of phase ullage εphase > 1
[Stilling well diameter] has to be increased
When the slope of the Heimdall table is negative:
The slope of phase ullage is negative
The scale error of phase ullage εphase < 1
[Stilling well diameter] has to be decreased
It is strongly advised to use hand measurements to determine the size of
the slope. When these are not or not sufficiently available, the slope can
be estimated from the Heimdall diagram and will be approximately half the
slope of the Heimdall diagram. When this slope is determined, the new
stilling well diameter can be calculated using equation (11) (see Scale
error on stilling well).
For example, the slope in the Heimdall diagram of figure 14 is
approximately 4 mm on 20 m (the average slope of line 1 over the tops
and line 2 under the bottoms). The slope of phase ullage is then
approximately 2 mm, the scale error will be approximately
(10)
Figure 14 Heimdall diagram of a 12” stilling well application with
wrong [Stilling well diameter]
(line 1 and line 2 are not shown on the Heimdall diagram)
Part No.: 4417764 Revision 2
SmartRadar FlexLine Professional
For internal use only!
31
Diagnostics
Heimdall diagram on stilling well sections with different diameter
Figure 15 shows the Heimdall diagram of a stilling well application where
different sections of the stilling well have slightly different inner diameter.
This shows up in the diagram as sections with different slope. Again, it is
strongly advised to use hand measurements to determine the size of the
slope.
Different inner diameters can’t be fixed by changing the inner diameter of
the stilling well. Instead Ullage Correction Tables must be used.
For example, there seems to be a slope in the Heimdall diagram of
approximately -4 mm from 11 to 22 m. The error in phase ullage is half of
that so it will be approximately -2 mm at 22m. The error in PSD ullage will
be opposite to that, so it will be +2 mm at 22m. It is advised to correct both
phase ullage and PSD ullage by ullage correction table. In this case, the
correction will be 0 at 11 m and +0.002 m at 21 m for phase ullage
(general Ullage Correction Table, see ‘Compensations’ sheet in Engauge).
The correction will be 0 at 11 m and -0.002 m at 21 m for PSD ullage
(Ullage Correction Table PSD, see ‘Advanced’ sheet in Engauge).
Figure 15 Heimdall diagram of an 8” stilling well application with
different sections of stilling well
32
SmartRadar FlexLine Professional
For internal use only!
Part No.: 4417764 Revision 2
Diagnostics
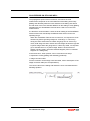
Raw data diagram
In Engauge a Raw Data Diagram can be made with the FlexLine. It shows
the time domain sampled low frequency signal, measured by the FlexLine.
On the X-axis, the number of samples (1024) is shown and on the Y-axis
the amplitude of the signal. The range on the Y-axis is from -32768 to
+32768 (the result from 16 bits AD conversion).
In general the raw data diagram shows a low frequency signal (6 to 12
periods), what is caused by the antenna reflection. Superimposed on that
low frequency signal there is a higher frequency, which is caused by the
product reflection.
As the antenna reflection is a reflection from nearby (close to the TII-XR
unit inside the FlexLine), its amplitude is relatively large. Reflections from
further away (such as the product reflection) have a higher frequency and
are lower in amplitude.
A good working FlexLine always shows a low frequency component and a
higher frequency component in the raw data diagram (refer to figure 16). If
there is an abnormality in the sinusoidal wave pattern, for instance (partly)
a straight horizontal or vertical line, it is a sign the antenna fails or there is
a fail in the TII-XR unit of the FlexLine.
Figure 16
Part No.: 4417764 Revision 2
Example of Raw Data Diagram
SmartRadar FlexLine Professional
For internal use only!
33
SCALE ERROR ON STILLING WELL
The propagation speed of the microwaves, and hence the level
measurement, depends on the inner diameter of the stilling well. Entity
[Stilling well diameter] holds the inner diameter of the stilling well. When
the real value of the inner diameter differs from the setting in entity [Stilling
well diameter], the SmartRadar FlexLine has a scale error in the level
measurement.
It is therefore recommended to check the level reading of the SmartRadar
FlexLine with some manual dips at different static levels over the full
operating range.
When the SmartRadar FlexLine has a scale error, it’s important to know
whether the [Phase guarding state] was <Guarding> or <Recovery>
during the hand measurements. When the gauge was in <Recovery>
mode, PSD ullage has been shown and PSD ullage will behave opposite
to phase ullage. When the gauge was in <Recovery>state, use equation
(2) to calculate the error of phase ullage. When in doubt about the
[Phase guarding state], check the Heimdall diagram (refer to ‘Heimdall
diagram on a stilling well’).
A level scale error, when present, can be corrected in two ways:
Adjustment of entity [Stilling well diameter] (preferred)
Ullage correction table
For the correction via the ullage correction table, refer to description of the
ullage correction table (see Compensations).
The correct value for the stilling well diameter can be calculated with the
following equation:
34
SmartRadar FlexLine Professional
For internal use only!
Part No.: 4417764 Revision 2
Scale Error on Stilling Well
Where
[Stilling well diameter]new
[Stilling well diameter]org.
recalculated stilling well diameter [m]
original stilling well diameter [m] a value
dependent on antenna mode (see table 7).
Engauge: The antenna mode can be found on
tab sheet ‘Antenna Exchange’
Table 7 Antenna mode value
a
εphase
TE01
TE11
TE02
0.036568
0.017568
0.066952
scale error of phase ullage. Examples:
a +10 mm error on 20 m range will give a
scale error of (20 + 0.010)/20 = 1.0005;
a -15 mm error on 15m range will give a scale
error of (15 - 0.015)/15 = 0.999.
Refer to figure 17. It doesn’t matter whether
innage or ullage levels are used. When
(Radar - Reference) is at the Y-axis, scale
error εphase should be larger than 1 when
there’s a positive slope. The newly calculated
[Stilling well diameter] will be larger than the
original one. Scale error εphase should be
smaller than 1 when there’s a negative slope.
The newly calculated [Stilling well diameter]
will be smaller than the original one.
Figure 17 Relation between error and
scale error
If radar innage is used on the Y-axis, then the
X-axis represents innage. Hence, if radar
ullage is used on the Y-axis, then the X-axis
represents ullage.
Part No.: 4417764 Revision 2
SmartRadar FlexLine Professional
For internal use only!
35
Scale Error on Stilling Well
An example with an S10 antenna:
Entity [Stilling well diameter] is programmed as 0.254 m and the antenna
mode is TE01. At 2 m the deviation of the SmartRadar FlexLine is -3 mm.
At 19 m, the deviation is +2 mm. The new [Stilling well diameter] is
calculated as:
Note: After the new stilling well diameter is programmed, the SmartRadar
FlexLine must (again) be set to level with the [Accept reference] command
(see Level check).
When the SmartRadar FlexLine was in <Recovery> mode during the
measurements, the scale error of PSD ullage is measured. The scale error
of phase ullage can be calculated by:
(14)
36
SmartRadar FlexLine Professional
For internal use only!
Part No.: 4417764 Revision 2
ERRORS AND WARNINGS
The status code of the [Primary value] or the [Secondary value] can
display an error (status = <BAD>) or a warning (status = <UNCERTAIN>).
Table 8 shows the error numbers and messages that can occur at start-up.
Table 9 shows the operational error numbers and messages.
Table 8 Initial error messages
Error number Error message
Description
1297
Maximum safe fill not set
1311
EPS centre frequency
out of range
1315
EPS double entries in
ullage correction table
1334
EPS conflict between
[Radar application] and
[Antenna mode]
Stilling well application but no antenna
mode selected or free space application
and TE01 or TE02 mode selected.
1335
EPS stilling well diameter
out of range
Stilling well diameter out of allowed
range (0.04572 – 1.0 m).
1355
Temperature calibration table
empty
Empty temperature calibration table.
SmartRadar has not been calibrated or
NOVRAM has been cleared.
1356
Maximum safe fill not
within measuring range
Maximum safe fill is too large. Must be
within measuring range of the radar:
between [Minimum measurable distance]
from antenna and [Tank bottom position].
Table 9 Operational error and warning messages
Error number Error/Warning message
Description
1298
Level exceeds maximum
safe fill
1299
Tank shell compensation
vapour temperature not
available
Tank shell compensation is switched on,
but no vapour temperature is available.
1300
Tank shell compensation
ambient temperature not
available
Tank shell compensation is switched on,
but no ambient temperature is available.
1316
EPS no peaks detected in
the reflection diagram
Check reflection diagram and thresholds.
1321
EPS raw data clipping at the
bottom
Set [Automatic gain] to < True > or adjust
[Manual gain].
1322
EPS raw data clipping at the
top
Set [Automatic gain] to < True > or adjust
[Manual gain].
1323
EPS raw data clipping at the
top and bottom
Set [Automatic gain] to < True > or adjust
[Manual gain].
Part No.: 4417764 Revision 2
SmartRadar FlexLine Professional
For internal use only!
37
Errors and warnings
1324
EPS raw data is almost DC
signal
Set [Automatic gain] to < True > or adjust
[Manual gain]. When [Actual gain] is
maximal (7) there is probably a hardware
failure.
1326
EPS too many peaks
Weakest peaks are ignored.
detected in reflection diagram
1327
EPS raw data clipping at the
top
Set [Automatic gain] to < True > or adjust
[Manual gain].
1328
EPS raw data clipping at the
bottom
Set [Automatic gain] to < True > or adjust
[Manual gain].
1329
EPS raw data clipping at the
top and bottom
Set [Automatic gain] to < True > or adjust
[Manual gain].
1336
EPS no product peak found
in reflection diagram
Check thresholds.
1338
EPS too many peaks
detected in differential
spectrum
Weakest peaks are ignored.
1349
Radar level end switch
exceeded
1357
Level exceeds maximum
measuring range
Minimum ullage has been exceeded.
< BAD > health status can only be reset
by [CLEAR_OVERFILL] command when
level is below minimum ullage.
Engauge
The error/warning message can be found in the health / status code of
the primary and secondary value on the product level tab sheet.
From software version A1130:
The ‘Product level’ tab shows a history of the last 10 occurred warning
statuses (<UNCERTAIN>) and error statuses (<BAD>).
SmartView
On the SmartView the error number can be found in the commissioning
menu by selecting the TII-XR board. The error number is found behind
the product level entry.
38
SmartRadar FlexLine Professional
For internal use only!
Part No.: 4417764 Revision 2
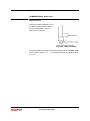
GENERAL Average temperature & Water level measurement
This section describes the ‘advanced’ settings which can only be made by
the Engauge Professional service tool for the commissioning of the
average temperature and water level measurement on the FII-VT board.
VITO Interface and probe types
762 VITO MTT Interface connects:
764C VITO temperature probe (16 spots, equally spaced from 1 m
(39”) above probe bottom end)
764D VITO temperature probe (15 spots, equally spaced from 1 m
(39”) above probe bottom end with additional spot at 0.065 m from
probe bottom end)
766C VITO combi probe (16 spots, equally spaced from 0.5 m (20”)
above water probe)
766D VITO combi probe (15 spots, equally spaced from 0.5 m (20”)
above water probe with additional spot at 0.065 m (2.6”) from probe
bottom end)
765 VITO water probe
864 MTT
762 VITO LT Interface connects:
767C VITO temperature probe (9 spots, equally spaced from 1 m (39”)
above probe bottom end)
767D VITO temperature probe (8 spots, equally spaced from 1 m (39”)
above probe bottom end with additional spot at 0.065 m from probe
bottom end)
768C VITO combi probe (9 spots, equally spaced from 0.5 m (20”)
above water probe)
768D VITO combi probe (8 spots, equally spaced from 0.5 m (20”)
above water probe with additional spot at 0.065 m (2.6”) from probe
bottom end)
765 VITO water probe
762 VITO MRT Interface connects:
MRT (Multiple Resistance Thermometer) up to 13 temperature
elements with one spot element
MPT (Multiple Pt100 spot elements) up to 14 elements with 2 common
wires
RTD (Resistance Temperature Detector) up to 3 RTD’s in 3-wire
configuration
Part No.: 4417764 Revision 2
SmartRadar FlexLine Professional
For internal use only!
39
COMMISSIONING Average temperature
Water awareness
If a water probe is connected to the SmartRadar FlexLine (from a combi
probe or a separate water probe), the measured water level will be used to
check if individual temperature elements are located in the water. If such
elements are found, they will be excluded from average product
temperature calculation. This is valid for VITO probes, 864 MTT, MPT
(Multiple Spot) elements and RTD’s. This check cannot be realized with
MRT’s (Variable Length Elements).
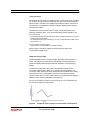
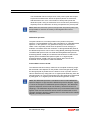
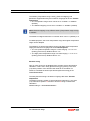
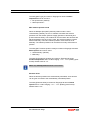
Gauge temperature scale
The FII-VT module supports both international temperature scales IPTS-68
(International Practical Temperature Scale of 1968) and ITS-90
(International Temperature Scale of 1990). The scales apply to °C and
Kelvin. The temperature difference between the two scales is illustrated in
figure 18.
Figure 18 Differences between ITS-90 and IPTS-68
The current element formulas with IPTS-68 coefficients are used and an
additional correction is applied to convert to ITS-90.
As the ITS-90 scale is the most recent one, it is therefore the preferred
selection.
The entity [Gauge temperature scale] is located on Engauge tab sheet:
Board specific and can be set to <ITS-90> (default) or <IPTS-68>.
40
SmartRadar FlexLine Professional
For internal use only!
Part No.: 4417764 Revision 2
Commissioning Average temperature
Median filter for each calculated spot temperature
The function of the Median filter is to avoid strong fluctuations in the
temperature reading. With the window size of 5, the actual temperature
value and the 4 previous values are sorted on ascending value. The actual
value will be the middle sorted value. After this, the values are shifted for
the next cycle.
The entity [Median filter] is located on Engauge tab sheet: Product
temperature and can be set to <enable> (default) or <disable>.
Averaging filter for product temperature and vapour temperature
To avoid strong fluctuations in the average product and average vapour
temperature values, an averaging filter is implemented. The filter constant
can be adapted. The filter constant relation is as follows
Tnew = [Averaging constant] * Told + (1 – [Averaging constant]) * Tnew (15)
The entities [Average constant filter] and [Average constant] are located on
Engauge tab sheet: Product temperature.
The Average constant filter can be set to <enable> (default) or
<disable>.
The Average constant is a value ranging <0 .. x.x> (floating point
format). Default value is <0.9>.
Part No.: 4417764 Revision 2
SmartRadar FlexLine Professional
For internal use only!
41
Commissioning Average temperature
Averaging temperature calculation method for product and vapour temperature
This is valid for RTD’s, MPT (Multiple Spot) elements, VITO probes and MTT. With entity
[Temperature calculation method], under Engauge tab sheet: Product temperature, a selection can
be made between the following calculation methods:
<Standard>
<Enhanced> (default)
<Custom>
Figure 19
Averaging algorithms
Standard averaging:
A straight forward
averaging is applied (i.e
number of submerged
temperatures divided by
number of submerged
elements).
Enhanced averaging:
The weighing of the individual
spots depends on the height of the
product level.
Custom averaging:
Includes weighing factors (A,
B, etc.) for each individual
spot. Intended to be used for
non-cylindrical tanks.
The weighing factors are
configurable.
Where:
Tap = Average product temperature
T1 = Temperature of element (RTD) 1
T2 = Temperature of element (RTD) 2
A = Weighing factor of element (RTD) 1
B = Weighing factor of element (RTD) 2
42
hse = highest selected element (RTD) in product
low = lowest element (RTD) in product
th
Li = position from bottom of i element (RTD)
th
Ti = temperature of i element (RTD)
SmartRadar FlexLine Professional
For internal use only!
Part No.: 4417764 Revision 2
Commissioning Average temperature
When the ‘Custom’ average temperature calculation method is selected,
the ‘weighing factors’ must be entered.
As an example, a
sphere with a 767C
VITO LT probe.
With the entities
[Lowest element
offset] and [Sensor
length], the
distances midway
the elements L1, L2,
etc. can be
calculated.
Figure 20
Weighing factors with sphere
From the Tank Capacity Table, the corresponding volumes V1, V2, etc. are
obtained. The weighing factors are then being calculated as:
(19)
Example:
In a sphere with diameter of 18.620 m (61.089 ft), a VITO probe model
767C (lowest element located 1 m (3.281 ft) from bottom of probe and the
position of the highest element is at 17 m (55.774 ft) (refer to figure 21).
The lowest element offset in this example is 1 m (3.281 ft).
Then the Sensor length is calculated as follows:
Sensor length = Position highest element – lowest element offset
= 17 m – 1 m (55.774 ft – 3.281 ft)
= 16 m (52.493 ft)
(20)
The element interval is calculated as:
Element interval = Sensor length / 8
= 16 m / 8 (52.493 ft / 8)
= 2.000 m (6.562 ft)
(21)
The distances midways the elements (L1, L2, etc.) can now be found:
L1 = Lowest element offset + Element interval / 2
(22)
L2 = L1 + Element interval
(22a)
L3 = L2 + Element interval
(22b)
The values are listed in table 10.
Part No.: 4417764 Revision 2
SmartRadar FlexLine Professional
For internal use only!
43
Commissioning Average temperature
The volumes V1, V2, etc. are found from the
Tank Capacity Table.
The weighing factors are calculated as:
A=1
B = (V2 – V1) / V1
(19)
3
3
3
B = (400.951 m - 108.615 m ) / 108.615 m
B = 2.6915
or
B = (2521.91 bbl – 683.17 bbl) / 683.17 bbl
B = 2.6915
etc.
In table 10 are listed:
midway distances
corresponding volumes from the Tank
Capacity Table
calculated weighing factors.
Figure 21 Example weighing
factor calculation
sphere with VITO
probe
Table 10 Example of weighing factors with sphere D = 18.62 m
(61.089 ft) and VITO probe model 767C
n
Level
m
ft
m
3
Volume
bbl
Weighing factors
1
2.000
6.562
108.615
683.17
2
4.000
13.123
400.951
2521.91
A=1
B = 2.6915
3
6.000
19.685
826.742
5200.05
C = 3.9202
4
8.000
26.247
1335.721
8401.44
D = 4.6861
5
10.000
32.808
1877.625
11809.91
E = 4.9892
6
12.000
39.370
2402.187
15109.30
F = 4.8295
7
14.000
45.932
2859.143
17983.47
G = 4.2071
8
16.000
52.493
3198.225
20116.23
H = 3.1219
9
18.620
61.089
3380.163
21260.59
I = 1.6751
The entity [Element weighing factor] is located on Engauge tab sheet:
Board specific and contains 16 data fields ranging: <0 .. +x.x> (floating
point format). Default value is <1>.
Note: Only actually used elements are to be entered
44
SmartRadar FlexLine Professional
For internal use only!
Part No.: 4417764 Revision 2
Commissioning Average temperature
Range checking and element skipping
A range check mechanism is built in to detect if a temperature element is
used outside the specified temperature range. In case the element is
outside the range, the temperature status is set to fail. The temperature
range on which is checked depends on the selected element type.
Table 11 Temperature element range
Element type
Low probe
temp. range
Pt100 large, VITO probes
-200 °C (-328 °F)
Pt100 small, Ni191, PtCu100, Cu100
-20 °C
Cu90 Enraf, Cu90 Beacon, Cu90 Nulectrohm
Sangamo MRT, Sangamo spot
High probe
temp. range
250 °C (482 °F)
(-4 °F)
120 °C (248 °F)
-100 °C (-148 °F)
280 °C (536 °F)
Figure 22 Range checking and element skipping
If the range check is disabled
(default), the temperature
element is set to fail if a
resistance ≤Upper shortcut
range (short cut) or ≥Lower
not connected range
(interrupted) is detected.
Part No.: 4417764 Revision 2
With the range check enabled, this fail
range decreased to ≤Low probe
temperature range (short cut) or ≥High
probe temperature range (interrupted).
The area between Low probe temp.
range – Upper shortcut range and
High probe temp. range – Lower not
connected range is used as element
skipping range.
If a temperature element is found within
the element skipping range, it will not
be used for average product
temperature calculation or average
vapour temperature calculation. The
maximum number of skipped elements
is: 2 (default 1).
SmartRadar FlexLine Professional
For internal use only!
45
Commissioning Average temperature
The entities [Temperature range check] , [Element skipping] and
[Maximum skipped elements] are located on Engauge tab sheet: Product
temperature.
The Temperature range check can be set to <enable> or <disable>
(default).
The Element skipping can be set to <enable> or <disable> (default).
Note: Element skipping is only effective when [Temperature range check]
is enabled.
The Maximum skipped elements is a number which can be 1 (default) or 2.
For W&M purposes, the Lower temperature range and Higher temperature
range can be adapted.
The entities [Low probe temperature range] and [High probe temperature
range] are located on Engauge tab sheet: Board specific.
The Low probe temperature range is a value ranging: <-x.x to +x.x>
(floating point format). Default value is <0>.
The High probe temperature range is a value ranging: <-x.x to +x.x>
(floating point format). Default value is <0>.
Element wiring
One (or more) spots can be disabled from average product temperature
calculation. This is set in entity [Element wiring], by placing a non-zero
(≠ 0) at the position of the element that needs to be excluded. For
instance, to disable the lowest spot element [Element wiring] is set:
F000000000000000
The entity Element wiring is located on Engauge tab sheet: Product
temperature.
The Element wiring is a field of 16 hexa-decimal characters. A non-zero
(≠ 0) character at position x results in element x being excluded from
calculation.
Default setting is: <0000000000000000>.
46
SmartRadar FlexLine Professional
For internal use only!
Part No.: 4417764 Revision 2
Commissioning Average temperature
Low level behaviour
The low level behaviour defines how to determine
temperature and temperature status in case the
product level drops below the lowest element used in
temperature calculation.
The low level behaviour can be set to:
Fail (default)
Use last valid temperature
Use lowest element (T1)
Use second element (T2)
Figure 23 Low level
behaviour
Low element usage
According to international recommendations (API and ISO) for temperature
measurement in storage tanks, temperature shall be measured starting
from 1 m (3 ft) above the tank bottom. The VITO probes model C (764C,
766C, 767C and 768C) fulfill this requirement by having the first element at
1 m from the probes bottom end. However, when tanks are operated at a
lower level than 1 m (3 ft), an extra spot can be located at a lower level,
which then is only used when the level drops below 1 m (3 ft.). The spot
below 1m (3 ft.) shall not be used for the average temperature
measurement when the product level is above 1 m (3 ft.). For that purpose
VITO probes model D (764D, 766D, 767D and 768D) do have one
additional element at the bottom of the probe.
For the VITO probes model D and MPT (Multiple Spot) probes with a
temperature element below 1 m, the low element usage needs to be
configured. The low element usage defines which elements are included in
the temperature calculation. There are the following choices:
No exclusion (default); all submerged elements are used (not API
compliant)
Static exclusion; all submerged elements above the [temperature
element exclude zone]; without lowest element.
Dynamic exclusion; dynamical with smoothing lowest element will be
used at low product levels only.
Part No.: 4417764 Revision 2
SmartRadar FlexLine Professional
For internal use only!
47
Commissioning Average temperature
Figure 24
Low element usage
Average product temperature
calculation uses at
- Product level 1 (PL1):
T1, T2, T3 and T4
- Product level 2 (PL2): T1
- Product level 3 (PL3):
[Low level behavior]
setting on T1
Average product temperature
calculation uses at
- Product level 1 (PL1):
T2, T3 and T4
- Product level 2 (PL2):
[Low level behavior]
setting on T2
- Product level 3 (PL3):
temperature fail
- Product level 4 (PL4):
temperature fail
Average product temperature
calculation uses at
- Product level 1 (PL1):
T2, T3 and T4
- Product level 2 (PL2): T2
- Product level 3 (PL3):
smoothing using T1 and T2
- Product level 4 (PL4): T1
- Product level 5 (PL5):
[Low level behavior]
setting on T1
With Dynamic exclusion a smooth change is realized when switching from T2 to T1. When the product
level drops from [smoothing level] to T2 position, the average product temperature uses T2 and T1 to
the ratio product level and T2 – T3 distance according to the following formula:
(23)
Where:
Tap = average product temperature
E2 = position element 2
E3 = position element 3
48
T1 = temperature element 1
T2 = temperature element 2
SmartRadar FlexLine Professional
For internal use only!
Part No.: 4417764 Revision 2
Commissioning Average temperature
The closer the product level
comes to T2, the higher the
influence from T1. When T2
is not selected anymore for
average product
temperature, then the
change to T1 is smooth.
For simplicity reasons,
the effect of the
Figure 25 Smoothing
[Product immersion depth]
and [Hysteresis] are ignored.
Smoothing overrules the selected temperature calculation method
(standard, enhanced, custom).
The entities [Low level behaviour], [Low element usage], [Temperature
element exclude zone] and [Smoothing level] are located on Engauge tab
sheet: Product temperature.
The Low level behaviour can be set to :
o <Temp to fail> (default)
o <Temp to last fail>
o <Temp use first element>
o <Temp use second element>
The Low element usage can be set to (refer to figure 17):
o <No exclusion> (default)
o <Static exclusion>
o <Dynamic exclusion>
The Temperature element exclude zone sets the threshold below
which a ’temperature fail’ is generated when Low element usage is set
to ‘Static exclusion’ and is a value ranging: <-x.x .. +x.x> (floating point
format). T1 pos. < [Temp. Element exclude zone] < T2 pos. Default
value is <1>.
The Smoothing level is used when Low element usage is set to
‘Dynamic exclusion’ (refer to figure 25) and is a value ranging: <-x.x ..
+x.x> (floating point format). Below the Smoothing level till Position of
element 2, the average product temperature gradually changes to T1
value. T2 pos. < [Smoothing level] < T3 pos. Default value is <0>.
MRT type
Variable Length Elements (or Multiple Resistance Thermometers) can
have a spot element at the bottom part (will be switched on from 0.25 m
element length). If no spot element is present, the first element is switched
on from 0.65 m. Without spot element, the maximum number of MRT
elements remains 13.
Part No.: 4417764 Revision 2
SmartRadar FlexLine Professional
For internal use only!
49
Commissioning Average temperature
The entity [MRT type] is located on Engauge tab sheet: Product
temperature and can be set to:
<No spot below> (default)
<With spot below>
MPT element position mode
When the Multiple Spot (MPT) element position mode is set to
‘Automatically’ (default), the FII-VT software calculates the element
positions from the entities: [Sensor length], [Number of elements] and
[Lowest element offset]. This method can be used when the elements are
placed equidistant. If that is not the case, the element positions must be
entered manually. Then MPT element position mode must be set to:
Manually. The element positions can be entered in entity: RTD element
position.
The entity [MPT element position mode] is located on Engauge tab sheet:
Board specific and can be set to:
<Automatically> (default)
<Manually>
The entity [RTD element position] is located on Engauge tab sheet:
Product temperature and is a value ranging: <-x.x .. +x.x> (floating point
format). Default value is <0>.
Note: Only actually used elements to be entered.
Element offset
When the element positions are automatically calculated, each element
can be given an offset to this automatically calculated position.
The entity [Element offset] is located on Engauge tab sheet: Board
specific and is a value ranging: <-x.x .. +x.x> (floating point format).
Default value is <0>.
50
SmartRadar FlexLine Professional
For internal use only!
Part No.: 4417764 Revision 2
MEASURED DATA Average product temperature
The following measured (calculated) date is available:
On Engauge tab sheet: Board specific:
Table 12 Measured data average product temperature - 1
Name
Explanation
[Raw temperature elements] An array of 16 data fields with the raw (unfiltered)
temperatures of each temperature element.
[Raw resistance elements]
An array of 16 data fields with the raw (measured)
resistances of each temperature element (only with Variable
Length elements (MRT) and Multiple Spot elements (MPT).
[Test resistance]
The measured value of the test resistance in the VITO
Interface unit. This value should be: 166.5 Ω ± 0.03%.
[Cable resistance]
The measured cable resistance (black wires) of Variable
Length elements (MRT) and Multiple Spot elements (MPT).
On Engauge tab sheet: Product temperature:
Table 13 Measured data average product temperature - 2
Name
Explanation
[Element position for
calculation]
An array of 16 data fields containing the element positions,
including the [Lowest element offset].
[Highest selected element]
The highest selected temperature element for average
product temperature calculation.
[Element in calculation]
An array of 16 data fields with information which elements
are used for average product temperature calculation.
[Element wiring request]
16 Hexa-decimal characters, showing the sequence in which
order the thermo-couples of the VITO probe are connected to
the VITO Interface unit.
On Engauge tab sheet: Miscellaneous:
Table 14 Measured data average product temperature - 3
Name
Explanation
[HART communication retry
counter]
An array of 16 data fields containing the number of HART
communication retries with the VITO Interface unit.
[HART detected addresses]
The VITO MTT and VITO MRT Interface unit have HART
address 5; the VITO LT Interface unit has HART address 6.
[HART detected device]
The detected type of temperature probe, connected to the
VITO Interface unit.
[VITO standard deviation]
A floating point number, containing the standard deviation on
20 resistance measurements on one of the probe wires.
Should be < 0.5E-10.
[VITO MTT resistance PT100] The measured Pt100 resistance of the VITO MTT of VITO LT
probe (units: Ω).
Part No.: 4417764 Revision 2
SmartRadar FlexLine Professional
For internal use only!
51
MEASURED DATA Average vapour temperature
The following measured (calculated) date is available:
On Engauge tab sheet: Vapour temperature:
Table 15 Measured data average vapour temperature
52
Name
Explanation
[Lowest selected element]
The lowest selected temperature element for average
vapour temperature calculation.
[Element in calculation]
An array of 16 data fields with information which elements
are used for average vapour temperature calculation.
SmartRadar FlexLine Professional
For internal use only!
Part No.: 4417764 Revision 2
COMMISSIONING Water level
Water threshold
The water threshold (default 0.01 m)
is a distance that minimal needs to
be covered with water, before a
water level is indicated.
Figure 26
Water threshold
The entity [Water threshold] is located on Engauge tab sheet: Water level
and is a value ranging: <-x.x .. +x.x> (floating point format). Default value
is <0.01>.
Part No.: 4417764 Revision 2
SmartRadar FlexLine Professional
For internal use only!
53
MEASURED DATA Water level
The following measured (calculated) date is available:
On Engauge tab sheet: Water level:
Table 16 Measured data water level
Name
Explanation
[Measured water capacitance] Indicates the measured capacitance of the water probe.
The value must be in range between [Minimum water
capacity] and [Maximum water capacity] (units: pF).
54
SmartRadar FlexLine Professional
For internal use only!
Part No.: 4417764 Revision 2
CALIBRATION Water bottom probe
Make sure the VITO water (and temperature) probe is installed properly
(refer to installation guide VITO). Factory calibration values for the
Maximum water capacity and Minimum water capacity are listed on the
“Checklist 765/766/768 Final Assembly”, delivered with every VITO probe.
The factory calibration value for the Minimum water capacity is obtained by
a measurement in air. The measured capacitance depends on the
dielectric properties of the product. The dielectric constant for air is 1.
A general value for dielectric constant of oil products is in the area of 1.8 –
11
2.5. For a 0.5 m (1’ 7” /16) long water probe that results in a change in
3
6
minimum capacitance of 3 – 6 pF, which will cause 5 – 9 mm ( /16 – /16)
water level deviation. Therefore, the minimum water capacitance must be
determined when the probe is installed and completely, or partly, covered
by product.
In the following 3 situations the water probe can be calibrated:
Situation 1:
Probe fully covered by product
Situation 2:
Probe partly covered by water and for the remaining
part covered by product
Situation 3:
Probe partly covered by product and for the remaining
part covered by air.
In all other situations, no calibration can be made.
Situation 1 (probe fully covered by product)
Read the entity [Measured water capacitance] and enter that value into
entity: [Minimum water capacity].
Situation 2 (probe partly covered by water and for the remaining part
covered by product)
Check by means of a manual dip, the water level.
An interpolation is applied on the [Measured water capacitance] to find the
[Minimum water capacity]. Refer to figure 27.
The interpolation is done as follows:
(24)
If we assume the following numbers as an example:
[Waterprobe bottom position] = 25 mm (or 0.98 inch or 0.082 ft)
[Waterprobe length] = 485 mm (or 19.09 inch or 1.591 ft)
Water level = 122 mm (or 4.80 inch or 0.400 ft)
Part No.: 4417764 Revision 2
SmartRadar FlexLine Professional
For internal use only!
55
Calibration water bottom probe
Then the % of water becomes (rounded off to 0.1%):
(24a)
(24b)
(24c)
Figure 27 Water probe calibration
The [Minimum water capacity] can be found as follows:
(25)
56
SmartRadar FlexLine Professional
For internal use only!
Part No.: 4417764 Revision 2
Calibration water bottom probe
Where:
Cmin = [Minimum water capacity]
Cmax = [Maximum water capacity]
Cmeas = [Measured water capacitance]
If we assume the following numbers as an example:
[Measured water capacitance] = 185.224 pF
[Maximum water capacity] = 430.4 pF (obtained from “Checklist
765/766/768 Final Assembly”)
Then the [Minimum water capacity] becomes:
(25a)
Situation 3 (Probe partly covered by product and for the remaining part
covered by air)
Refer to the figure 27, but read for the water level: product level and read
for the product: air. The values from the “Checklist 765/766/768 Final
Assembly” for minimum and maximum capacitance must be entered in the
entities: [Minimum water capacity] and [Maximum water capacity].
Measure the product level and calculate the immersed part;
Read the measured capacitance from entity: [Measured water
capacitance];
Calculate new value for [Minimum water capacity] as follows:
(26)
Where:
Cmin (new) = new calculated value for [Minimum water capacity]
Cmin = [Minimum water capacity] (obtained from “Checklist 765/766/768
Final Assembly”)
Cmeas. = [Measured water capacitance] (obtained from “Checklist
765/766/768 Final Assembly”)
For example:
[Minimum water capacity] = 120.0 pF (obtained from “Checklist
765/766/768 Final Assembly”)
[Maximum water capacity] = 430.4 pF (obtained from “Checklist
765/766/768 Final Assembly”)
[Measured water capacitance] = 120.786 pF
[Waterprobe bottom position] = 25 mm (or 0.98 inch or 0.082 ft)
[Waterprobe length] = 485 mm (or 19.09 inch or 1.591 ft)
Part No.: 4417764 Revision 2
SmartRadar FlexLine Professional
For internal use only!
57
Calibration water bottom probe
1) Product level (measured by manual dip) = 122 mm (or 4.80 inch or
0.400 ft)
Immersed part becomes:
122 – 25 = 97 mm (or 4.80 – 0.90 = 3.82 inch or 0.400 – 0.082 =
0.318 ft)
(27)
2) [Measured water capacitance] = 120.786 pF
3) Calculate new value for [Minimum water capacity]:
(26a)
(26b)
(26c)
The entities [Minimum water capacity], [Maximum water capacity] and
[Measured water capacitance] are located on Engauge tab sheet: Water
level.
[Minimum water capacity] is the capacity when the probe is not
submerged in water (in pF). Value obtained from “Checklist
765/766/768 Final Assembly”, or from above described
measurements and calculations. The value range is: <0.0 .. +x.x>
(floating point format). Default value is <20000>.
[Maximum water capacity] is the capacity when the probe is fully
submerged in water (in pF). Value obtained from “Checklist
765/766/768 Final Assembly”. The value range is: <0.0 .. +x.x>
(floating point format). Default value is <20000>.
[Measured water capacitance] indicates the measured capacitance of
the water probe (in pF). The value must be in range between
[Minimum water capacity] and [Maximum water capacity]. Default
value is <0>
58
SmartRadar FlexLine Professional
For internal use only!
Part No.: 4417764 Revision 2
ADDITIONAL SETTINGS for 365 temperature and water probe
This section describes the necessary settings when two similar FlexConn
boards are installed in the SmartRadar FlexLine. For instance to interface
the 365 MPT temperature and water probe with the CEPS Interface.
In this case, one FII-VT (board 1) is used to process data from the VITO
Interface board for the integrated water probe and one FII-VT (board 2)
is used to process data from the VITO MRT Interface for average
temperature from the MPT probe (refer to figure 28).
Board instance number
To distinguish the FII-VT boards, each
FII-VT board has a unique Board instance
number (range: 0 – 9). When installed
from the factory, the Board instance
numbers are already set different
(to 0 and 1).
If a second board is added in the field,
the best way to act is as follows:
Set the Board instance of the installed
FII-VT board to: 1;
Install the second FII-VT board
(default Board instance number is: 0).
The entity [Board instance] is located on
Engauge tab sheet: Generic.
It is a value ranging < 0 .. 9>;
default value is : <0>
Figure 28 Two FII-VT boards
HART detected device
To know which FII-VT board measures the water level and which FII-VT
board measures the temperature, check the entity [HART detected device]
on the Engauge tab sheet: Miscellaneous of each FII-VT board.
FII-VT board for water level:
HART detected devices reads: 765 WATER
FII-VT board for temperature:
HART detected devices reads: RTD
Part No.: 4417764 Revision 2
SmartRadar FlexLine Professional
For internal use only!
59
Additional settings for 365 temperature and water probe
Function priority number
As each of the FII-VT boards can measure the same data (product
temperature, vapour temperature and water level), the temperature priority
function must be set lower on the FII-VT board which is used to measure
the water level and the water level priority function must be set lower on
the FII-VT board which is used to measure the temperature.
Enter the Function priority entities according the table below (table 17):
Table 17 Function priority
Engauge Tab sheet
Function priority
for FII-VT board
measuring water
Function priority
for FII-VT board
measuring temp.
Product temperature
126
127
Vapour temperature
126
127
Water level
127
126
The entity [Function priority] is located on the Engauge tab sheets:
Product temperature, Vapour temperature and Water level.
It is a value ranging < 0 .. 255>; default value is: <127>.
To set the function priority lower, any number less than 127 will do.
This ends the additional settings for the 365 temperature and water probe.
Continue the other(normal) commissioning settings for temperature and
water measurement according the following section in the Service manual
SmartRadar FlexLine:
Product temperature: section 6.10.3.2.1
Vapour temperature:
section 6.10.3.2.2
Water level:
section 6.10.3.1.3
60
SmartRadar FlexLine Professional
For internal use only!
Part No.: 4417764 Revision 2
For More Information
To learn more about Honeywell Enraf’s
solutions, contact your Honeywell Enraf
account manager or visit
www.honeywellenraf.com.
Americas
Honeywell Enraf Americas, Inc.
2000 Northfield Ct.
Roswell, GA 30076
USA
Phone: +1 770 475 1900
Email: [email protected]
Europe, Middle East and Africa
Honeywell Enraf
Delftechpark 39
2628 XJ Delft
The Netherlands
Phone: +31 (0)15 2701 100
Email: [email protected]
Asia pacific
Honeywell Pte Ltd.
17 Changi Business Park Central 1
Singapore 486073
Phone: +65 6355 2828
Email: [email protected]