1
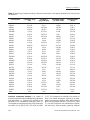
Evaluating the Fruit Production and Quality of Cherry Tomato
(Solanum lycopersicum var. cerasiforme)
Evaluación de la Producción y Calidad del Fruto del Tomate Cereza
Solanum lycopersicum var. cerasiforme
Nelson Ceballos Aguirre1 and Franco Alirio Vallejo Cabrera2
Abstract. The greatest genetic diversity of tomato (Solanum
lycopersicum L.) in terms of fruit quality characteristics such
as flavor, aroma, color, and lycopene and β-carotene contents
is found in wild species. This study evaluated the agronomic
characteristics and fruit quality of 30 cherry tomato introductions
of the germplasm bank of the Universidad Nacional de
Colombia - Sede Palmira in trials conducted at the Montelindo
experimental farm of the Universidad de Caldas (1010 m above
sea level, average temperature 22.8 °C, average annual rainfall
2200 mm, 76% relative humidity). A 5 x 6 rectangular lattice
experimental design was used with 30 treatments (introductions)
and a commercial control (Sweet Million), 4 replicates/treatment,
and 5 plants/replicate as experimental unit. The descriptors
used were those suggested by the former International Plant
Genetic Resources Institute, now Bioversity International. Data
were statistically analyzed by ANOVA and Duncan’s means
test using the SAS program. In addition, principal component
and cluster dendrogram analyses using the SAS Princom and
Cluster procedure (SAS Institute, Cary, NC) were performed. Six
principal components accounted for 80.39% of the morphological
variability of the introductions evaluated. The most promising
materials in terms of average fruit weight, yield per plant and
per hectare, and soluble solids, vitamin C and lycopene contents
were IAC1624, IAC391, IAC3652, LA2131, IAC424, IAC1621,
IAC426, LA1480 and IAC1688. The broad phenotypic variability
observed in the evaluated introductions favors the potential
selection and breeding of tomato for traits associated with fruit
production and quality.
Key words: Solanum lycopersicum var. cerasiforme, lycopene,
phenotypic variability, Colombia.
Tomato (Solanum lycopersicum L.) is the most
important vegetable in Colombia and worldwide,
accounting for 30% of global vegetable production,
with about 4.4 million hectares planted and
145,751,507 t of fruit harvested in 2010 (FAOSTAT,
2010). This vegetable is a major source of vitamins,
minerals and fiber, important for nutrition and
human health (Razdan and Mattoo, 2007); also,
contains various nutrients, ascorbic acid, vitamin E,
flavonoids, phenolic acids and carotenoids (Kuti and
Resumen. La mayor diversidad genética del tomate (Solanum
lycopersicum L.) en términos de características de calidad del
fruto como sabor, aroma, coloración y contenidos de licopeno y
β-caroteno se encuentra en especies silvestres. Este estudio
evaluó las características agronómicas y de calidad del fruto de
30 introducciones de tomate cereza provenientes del banco de
germoplasma de la Universidad Nacional de Colombia –Sede Palmira
en ensayos realizados en la granja Montelindo de la Universidad de
Caldas (1010 m sobre el nivel del mar; temperatura media, 22,8°C;
precipitación promedio anual, 2200 mm; humedad relativa, 76%).
Se usó un diseño experimental de látice rectangular 5 x 6, con 30
tratamientos (introducciones) y un testigo comercial (Sweet Million),
4 repeticiones/tratamiento y 5 plantas/repetición como unidad
experimental. Se utilizaron descriptores sugeridos por el antiguo
Instituto Internacional de Recursos Fitogenéticos, ahora Bioversity
International. Los datos fueron analizados estadísticamente
utilizando análisis de varianza y la prueba de promedios de Duncan
a través del programa SAS. Adicionalmente se realizaron análisis
de componentes principales y agrupamiento por dendrograma por
medio del procedimiento Princom y Cluster de SAS (SAS Institute,
Cary, NC). Seis componentes principales explicaron el 80,39% de
la variabilidad morfológica de las introducciones evaluadas. Los
materiales más promisorios en términos de peso promedio de
fruto, producción por planta, rendimiento y contenidos de sólidos
solubles, vitamina C y licopeno fueron IAC1624, IAC391, IAC3652,
LA2131, IAC424, IAC1621, IAC426, LA1480 y IAC1688. La amplia
variabilidad fenotípica de las introducciones evaluadas favorece la
posibilidad de selección y mejoramiento genético en tomate por
caracteres asociados a la producción y calidad del fruto.
Palabras clave: Solanum lycopersicum var. cerasiforme,
licopeno, variabilidad fenotípica, Colombia.
Konuru, 2005), and is the main source of lycopene for
humans (Candelas et al., 2008). In 2010, production
of tomato in Colombia was 546,322 t, with a planted
area of 16,227 ha and an average yield of 33.66 t/ha
(FAOSTAT, 2010).
According to Miller and Tanksley (1990), most genetic
diversity is found in the wild relatives of tomato,
which show variability for fruit quality characteristics
such as flavor, aroma, color, and texture as well as a
Assistant Professor. Universidad de Caldas - Faculty of Agricultural Sciences - Department of Agricultural Production. P.O. Box 275,
Manizales, Caldas, Colombia. <[email protected]>
2
Full Professor. Universidad Nacional de Colombia, Sede Palmira - Faculty of Agricultural Sciences. Carrera 32 No. 12-00, Palmira, Valle,
Colombia. <[email protected]>
1
Received: October 12, 2011; accepted: August 26, 2012.
Rev.Fac.Nal.Agr.Medellín 65(2): 6593-6604. 2012
Ceballos , N.; Vallejo, F.A.
high vitamin C content (> 57 mg/100 g fresh weight).
Several authors have also been reported as having
market potential because of their high content of
antioxidants such as lycopene (>10 mg/100 g fresh
weight) (Nuez, 1999). Current breeding efforts in
tomato focus on incorporating qualities such as color,
firmness, flavor, and high carotenoid content into
new commercial cultivars. It is more common to find
these fruit quality traits in traditional cultivars than
in modern cultivars, whose improvement efforts
have focused more on productivity and agronomic
characteristics of the plant (Valcárcel, 2009). For
example, including cherry tomatoes (S. lycopersicum
var. cerasiforme), one of two promising wild types of
Solanum, in breeding programs offers great potential
because of their valuable characteristics in terms of
genetic diversity for selection of parental material
and their broad geographic range (Medina and Lobo,
2001). Desirable traits found in cherry tomatoes
include disease resistance, fruit abscission, soluble
solids content, fruit size, flavor, texture, pigmentation,
and post-harvest quality (Kwon et al., 2009).
The characterization of the biodiversity of plant genetic
resources -a global strategic research line- lies the
groundwork for solving problems currently affecting
crops such as the adaptation to climate change as
well as for the development of new alternatives that
improve crop productivity and quality (Virk et al., 1995).
According to Abadie and Berretta (2001), the value of
collections of plant genetic resources lies in its use.
Collections should provide plant breeders with genetic
variants, genes, or genotypes, allowing them to tackle
the new challenges posed by production systems. To
do so, it is essential to know the characteristics of the
conserved germplasm.
Wild tomato species originate from the Andes of Chile,
Bolivia, Peru, Ecuador and Colombia (Nuez, 1999).
According to Vallejo (1999), the most promising wild
types of Solanum are S. lycopersicum var. cerasiforme
and S. pimpinellifolium. Several studies have shown
that some tomatoes, known as ‘cerasiforms’, are not
ancestors of modern cultivars, but have resulted from
the hybridization of wild and cultivated tomatoes
(Peralta et al., 2006).
Some commercial cherry tomato varieties such as
Brillantino, Marasca, Ovalino, Tamburino, To1251, and
Sweet Million are more representative of the market,
reporting yields between 54.27 and 87.73 t/ha (Macua
et al., 2008). Results of a study conducted by Nuez
6594
(1999) indicate that cherry tomatoes are generally
of determinate, semi-determinate, or indeterminate
growth habit; present long racemes with many fruits
of intense color and flavor, generally round in shape
and weighing between 10 and 30 g; are resistant
to diseases and tolerant to high relative humidity
(> 80%); have a high nutritional value because of
their high vitamin C content (> 57 mg/100gfw); and
present a highly variable number of fruits per cluster
(15–50). Cherry tomato lycopene content exceeds
10 mg/100 g fresh weight (Medina and Lobo, 2001),
which is considered as high. S. lycopersicum var.
cerasiforme and S. pimpinellifolium may be used as a
source of genes to increase the lycopene content of
species with low content (Nuez, 1999).
Medina and Lobo (2001) studied the morphological
variability of 39 qualitative and 11 quantitative traits
in 82 cherry tomato introductions in the department
of Antioquia, Colombia. Results indicated a broad
qualitative and quantitative variability, indicating
great potential for improving this type of tomato or
for introgressing genes for materials with large fruits.
Restrepo and Vallejo (2003) evaluated 25 tomato
introductions from the departments of Cauca, Valle
del Cauca, Antioquia, Santander, and Huila as well as
the country’s coffee-growing region, and formed three
groups: (1) those of var. cerasiforme; (2) all types of
tomato introductions and (3) ‘chonto’-type tomato var.
Rio Grande. Garzon (2011) evaluated 36 cherry tomato
introductions of the germplasm bank of the Universidad
Nacional de Colombia, Sede Palmira (UNAPAL), finding
that introductions IAC426, LA1314, LA1480, LA1307,
and LA1311-1 formed a group that was high yielding
with optimal average fruit weight for use in breeding
programs for this type of tomato. The introductions
that presented low average fruit weight showed the
highest lycopene and vitamin C contents, particularly
LA2841, LA4133, LA1461, LA3842, and Roldanillo.
The search for internal quality (nutritional and
organoleptic) is one of the main objectives of improved
fresh tomato market (Rosello et al., 2000). The fruits
of wild tomato species such as S. pimpinellifolium
have an excellent balance of flavor, 7.0 to 8.0 °Brix,
an attractive red color (Cestoni et al., 2001), and high
vitamin C content, all key components for the internal
quality of tomato (Rosello et al., 2000).
In Colombia, there are cherry tomato introductions
and collections that can be used in breeding programs.
The use of this resource, however, is subject to
Rev.Fac.Nal.Agr.Medellín 65(2):6593-6604. 2012
Evaluating the fruit production and ....
characterization and agronomic evaluation. This
research aims to evaluate the agronomic performance
and fruit quality of 30 cherry tomato introductions
from the UNAPAL germplasm bank to select promising
genotypes that could serve to improve cultivated
tomato and commercial cherry tomato.
MATERIALS AND METHODOS
Introductions were evaluated at the Montelindo
experimental farm of the University of Caldas, located
in the tropical rainforest region of Santágueda on the
eastern bank of the Cauca river, in the municipality of
Palestina, department of Caldas, Colombia (1.030 masl;
average temperature, 23 °C; 75% relative humidity;
annual precipitation, 2,000–2,225 mm; annual solar
radiation, 2,049 h). Plant material consisted of 30
introductions of the UNAPAL germplasm bank with
no previous characterization report that could be
included in breeding programs of cultivated tomato.
Sweet Million was selected as commercial check from
among the commercial materials of cherry tomato
best positioned in the market and capable of adapting
to the study area (Table 1). Soils were sandy loam,
pH 5.4, rich in organic matter (7.91%), deep (60 cm),
and well-drained (Boada et al., 2010).
Introductions were sown on 1 July 2010 in trays of 72
grids with grade 3 peat substrate and seedlings were
transplanted to the field on 28 July 2010 when they
reached the fourth true leaf stage (Jaramillo et al.,
2007). A 5 x 6 rectangular lattice experimental design
was used with 30 introductions and two replicates/
main block. The experimental unit consisted of five
plants per introduction, planted at 1.5 m between
rows, 0.8 m between plants, and 2 m between
blocks. Agronomic management was that defined by
Jaramillo et al. (2007) for commercial tomato crops
but modified to leave 3 axis/plant when defining plant
architecture to allow these wild tomato introductions
to express their potential regarding the production
variables being evaluated. A black-and-white padded
plastic 0.8 m wide, 1.2 caliber, was used to control
weeds. After reaching full maturity at 65 days after
transplanting, fruits were harvested according to
the performance of each introduction until plants
completed 10 harvests on 10 December 2010 (1
harvest/week).
Table 1. Cherry tomato introductions evaluated for fruit production and quality in the department of Caldas,
Colombia.
No. Introduction
Description
No.
Introduction
Description
1
IAC391*
Red cherry tomato
16
LA1546
Cherry tomato
2
IAC420
Cherry tomato
17
LA1705
Cherry tomato
3
IAC421
Cherry tomato ‘Alemão Vermelho’
18
LA2076
Cherry tomato
4
IAC424
Cherry tomato
19
LA1334
Cherry tomato
5
IAC426
Cherry tomato ‘Juliet’
20
LA2131
Cherry tomato
6
IAC445
Cherry tomato ‘Jundiai’
21
LA168
Cherry tomato
7
IAC1621
Cherry tomato ‘Aleman 12’
22
LA2640
Cherry tomato
8
IAC1624
Cherry tomato
23
LA2692
Cherry tomato
9
IAC1685
Cherry tomato ‘11B’
24
LA2710
Cherry tomato
10
IAC1688
Cherry tomato ‘Lili’
25
LA2845
Cherry tomato
11
IAC1622
Cherry tomato
26
LA3139
Cherry tomato
12
IAC1686
Cherry tomato
27
LA3652
Cherry tomato
13
IAC412
Cherry tomato
28
LA1455
Cherry tomato
14
IAC416
Cherry tomato
29
LA1428
Solanum pimpinelifollium
15
LA1480**
Cherry tomato
30
LA3158
Solanum pimpinelifollium
31
Check
Commercial cherry tomato Sweet Million
*
IAC: Introductions proceeding from the Instituto Agronómico de Campinas, Campinas, Brazil.
** LA: Introductions proceeding from the Tomato Genetics Resources Center (TGRC), University of California–Davis.
Rev.Fac.Nal.Agr.Medellín 65(2):6593-6604. 2012
6595
Ceballos , N.; Vallejo, F.A.
Characters were measured using the methodology
suggested by the former International Plant
Genetics Resources Institute (1996), now Bioversity
International. All observations about the fruit were
made in the second raceme per introduction per
replicate in the stage of full maturity. Characters
evaluated were the number of flowers/raceme
(NFLR), number of fruits/raceme (NFR), number of
racemes/plant (NRP), total number of fruits (TNF),
average fruit weight (AFW), production/plant (g/pL)
(PDN), lycopene content (mg/mL) (LYC), vitamin C
content (g/100 gfw) (VITC), fruit acidity (FA) and
soluble solids content (°Brix) (SSC); additionally to
the principal component analysis were measured the
number of good fruit (NGF), weight of damaged fruit
(WDF), good fruit weight (GFW), external color of
fruit (ECF), fruit shape (FS), number seeds per fruit
(NSF), fruit firmness (FF) and number of locules/fruit
(NLF).
Lycopene was extracted in a mixture of acetone:nhexane (4:6) and centrifuged at 5,000 rpm for 5
min at 4 °C. Subsequently, the optical density of the
supernatant was measured spectrophotometrically at
wavelengths of 663, 645, 505 and 453 nm, using the
acetone/n-hexane mixture as blank (Rosales, 2008).
The lycopene concentration was quantified using the
equation proposed by Nagata and Yamashita (1992)
cited by Rosales (2008) as follows:
[lycopene] (mg/mL) = - 0.0458 A663 + 0.204 A645 +
0.372 A505 - 0.0806 A453
Fruit acidity and vitamin C content were measured
from juice samples, obtained from 10 fruits of the
second raceme per introduction per replicate. Juice
samples (10 mL) were diluted in 100 mL distilled
water and the total acidity was determined by means
of a potenciometric titration with a solution of 0.1 M
NaOH up to pH 8.2, the results were expressed as
citric acid (%). The vitamin C content was determined
by a redox titration with a standardized solution of
0.1 N iodine (IPGRI, 1996). Finally, the soluble solids
content was measured using a Hanna® Instruments
refractometer at a scale of 0.2 °Brix.
Analysis of variance was performed using the SAS
GLM procedure (SAS Institute, Cary, NC) to determine
the occurrence of significant differences between
introductions for all the quantitative variables
evaluated. Means were compared by Duncan’s means
test (P<0.05), principal component analysis was
6596
performed, and qualitative and quantitative descriptors
assigned based on the matrix of 30 introductions with
the averages of previously obtained variables. The
SAS Princom and Cluster procedure was used (SAS
Institute, Cary, NC). Ward’s criterion was used to
prepare the dendrogram.
RESULTS AND DISCUSSION
Number of flowers per raceme (NFLR) and
number of fruits per raceme (NFR). Significant
differences
(P<0.05)
were
found
between
introductions for the variables NFLR and NFR. In
80% of the introductions, a direct relationship was
observed between these two variables—the higher
the number of flowers, the higher the number of
fruits. However, fruit set percentage was higher (70–
85%) in introductions presenting the lowest number
of flowers and fruits such as LA2710, LA2845, LA168
and LA3139 (Table 2). Average values yielded by
introductions IAC421, IAC1688, IAC424, and IAC1621
surpassed 20 flowers and 10 fruits/raceme (P<0.05).
Eight introductions yielded values above the overall
average of 7.40 fruits/raceme, while introductions
LA2710, IAC1686, IAC1622 and IAC2640 presented
values below 4.50 fruits/raceme (Table 2).
Lobo and Medina (1994) evaluated the morphological
variability of cherry tomato Solanum lycopersicon var.
cerasiforme and found that the NFLR ranged from 4
to 20. Estimated raceme weight (g) per introduction
indicated that the highest values depended primarily
on average fruit weight and secondly on the NFR
(Ceballos and Vallejo, unpublished data). Therefore, a
plant offering a balance between these two variables
can be competitive in terms of production as compared
with commercial materials.
Number of racemes per plant (NRP). In a five
month period, from transplanting to harvest, the
NRP with three axis presented significant differences
(P<0.05). Introduction LA1428 presented the highest
value (40.90 racemes/plant) with a confidence level of
95%, followed by LA3139, LA2710, LA2692, IAC420,
LA3158 and IAC445 with values ranging between 32
and 34 racemes with no statistical difference among
them. Lowest average values were found in IAC416
(13.10 racemes/plant), LA2131 (12.80), IAC1686
(8.70) and IAC1622 (5.60), with no statistical
difference among them. Rodríguez et al. (2005)
found 11 racemes/plant in materials of wild tomato
var. cerasiforme, which is significantly lower than the
Rev.Fac.Nal.Agr.Medellín 65(2):6593-6604. 2012
Evaluating the fruit production and ....
average found in this study (23.25 racemes/plant).
Rodríguez (2007) evaluated cherry tomato (S.l. var.
cerasiforme) and found 5.47 racemes in treatment
TI (bran and straw), followed by 5.14 racemes in T3
(plastic) and 4.89 in T2 (straw), with no significant
differences.
Total number of fruits (TNF) and average
fruit weight (AFW). Significant differences were
found between TNF and AFW (P<0.05) (Table 2).
Fourteen introductions presented values above the
overall average (96.1 fruits/plant), even though the
commercial check presented one of the highest values
of TNF per plant (119.8) while reporting the highest
percentage of losses (77%) (P<0.05). Introductions
LA1428, IAC1480, IAC424, LA1546, LA1455, IAC420
and IAC426 showed a direct relationship between
large amount of good fruit and total number of fruit
harvested per plant, while the percentage of losses or
discarded fruit were below 30% (P<0.05).
Table 2. Partitioning of means according to Duncan’s means test for production variables in 30 cherry tomato
introductions.
Introduction
NFLR*
NFR*
NRP*
TNF*
AFW*
(g)
PPR*
(g/pl)
Yield
(t/ha)
Check
IAC426
IAC1624
LA1480
IAC391
IAC1688
LA3652
IAC1621
IAC424
LA2692
LA2131
IAC421
LA2076
LA2845
LA1705
LA1428
IAC445
IAC420
IAC1686
LA2640
LA168
IAC412
IAC1685
LA2710
LA3139
IAC1622
LA1546
LA1455
LA1334
IAC416
LA3158
Means
54.10 a**
21.30 d
8.20 e
10.90 e
8.10 e
32.60 b
8.70 e
23.70 c
35.00 b
7.90 e
8.70 e
35.40 b
7.20 e
6.40 e
9.60 e
7.50 e
7.60 e
10.90 e
27.30 c
6.50 e
6.40 e
8.20 e
9.80 e
5.60 e
6.40 e
8.90 e
7.30 e
8.10 e
11.00 e
8.80 e
9.10 e
13.80
34.00 a
7.50 ef
5.50 fh
8.30 de
5.90 eh
12.50 c
5.30 fh
9.80 d
9.90 d
5.20 fh
5.80 eh
16.40 b
5.40 fh
4.70 gh
5.90 eh
6.40 eg
5.30 fh
7.50 ef
3.70 h
3.60 h
5.10 fh
6.00 eh
7.00 eg
4.50 gh
5.20 fh
0.70 i
6.20 eh
7.00 eg
6.50 eg
5.70 fh
6.70 eg
7.40
21.30 e
27.70 d
30.80 c
17.50 fg
27.40 d
21.80 e
31.00 c
26.50 d
26.30 d
33.40 bc
12.80 i
26.30 d
17.30 fg
25.90 d
16.20 gh
40.90 a
31.90 bc
33.10 bc
8.70 j
19.70 ef
16.80 g
25.80 d
17.60 fg
33.50 bc
34.40 b
5.60 k
13.70 hi
16.20 gh
15.40 gi
13.10 i
33.00 bc
23.20
119.80 ei
141.60 cf
80.00 kj
157.90 bc
62.10 kl
133.40 cg
83.80 kj
108.20 gj
175.60 b
94.00 ij
82.50 kj
145.30 ce
103.90 hj
42.00 ln
81.40 kj
201.70 a
84.70 kj
161.30 bc
80.50 kj
22.20 mn
99.00 hj
34.70 ln
49.10 lm
59.60 kl
114.70 fi
26.00 mn
148.00 cd
123.20 dh
61.30 kl
20.00 n
83.20 kj
96.10
17.00 eg
16.00 eh
24.10 bc
10.80 ik
26.50 b
12.90 gj
18.80 df
13.60 gi
9.80 il
16.30 eh
22.40 cd
10.50 ik
12.70 hj
23.90 bc
12.60 hj
4.80 mo
12.20 hj
5.90 lo
12.70 hj
37.20 a
8.70 jm
21.60 cd
15.30 fh
10.60 ik
7.50 kn
19.60 de
3.70 on
4.10 on
7.10 kn
22.30 cd
3.00 o
14.30
2054.60 a
2039.90 a
1937.30 a
1704.90 b
1643.70 bc
1642.00 bc
1574.00 bd
1432.90 cd
1421.00 cd
1420.60 cd
1369.20 d
1348.70 d
1314.70 d
1032.30 e
1013.90 e
979.60 ef
958.70 ef
887.30 eg
878.00 eh
817.80 eh
814.20 eh
739.60 fi
629.20 gj
619.30 hj
551.90 ij
517.90 ik
512.20 ik
475.40 ik
418.50 jk
388.00 jk
277.40 k
1077.90
17.12 a
17.00 a
16.14 a
14.21 b
13.70 bc
13.68 bc
13.12 bd
11.94 cd
11.84 cd
11.84 cd
11.41 d
11.24 d
10.96 d
8.60 e
8.45 e
8.16 ef
7.99 ef
7.39 eg
7.32 eh
6.81 eh
6.78 eh
6.16 fi
5.24 gj
5.16 hj
4.60 ij
4.32 ik
4.27 ik
3.96 ik
3.49 jk
3.23 jk
2.31 k
8.98
* NFLR, number of flowers per raceme; NFR, number of fruits per raceme; NRP, number of racemes per plant; TFP, total
number of fruits per plant; ANF, average number of fruits; PRP, production per plant.
** Different letters in a column indicate significant differences (P<0.05) by Duncan’s means test.
Rev.Fac.Nal.Agr.Medellín 65(2):6593-6604. 2012
6597
Ceballos , N.; Vallejo, F.A.
The AFW was 14.3 g/fruit with a confidence level
of 95%. Macua et al. (2009) reported AFW values
of 17 g for cherry tomato variety Pizzaiolo, while
the other commercial varieties evaluated presented
values ranging between 6.5 and 13 g/fruit. Under
greenhouse conditions, Márquez and Cano (2005)
found AFW of 16.3 g/fruit; Trani et al. (2003) found,
on the other hand, AFW values of 13.3 g/fruit in
commercial tomato cherry. The commercial check
treatment (Sweet Million) obtained similar values and
ranked 10th with an AFW of 17 g/fruit (P<0.05). Of the
introductions, 42% presented values between 15.3
and 37.2 g/fruit (P<0.05), with the remaining 58%
presenting below-average values between 3 and 13.6
g/fruit (P<0.05). Cestoni et al. (2001) described fruits
of wild tomato species weighing 12–18 g/fruit, while
Macua et al. (2009), on the other hand, reported the
following AFW values for cultivated cherry varieties:
Pizzaiolo, 17 g; ISI-447655, 15 g; Tamburino, 6.5 g;
and Ovalino, 13 g. Introductions evaluated in this
study reporting the highest values were LA2640 (37.2
g), IAC391 (26.5 g), IAC1624 (24.1 g), LA2845 (23.9
g), LA2131 (22.4 g), IAC416 (22.3 g) and IAC412
(21.6 g) (P<0.05) as compared with introductions
LA1428, LA1455, LA1546 and LA3158 that presented
values below 5 g/fruit, with no statistical differences
(Table 2).
Production per plant (PDN). Regarding the PDN
variable, highest yields were obtained by introductions
LA426 (2039.90 g/plant, 17 t/ha) and IAC1624
(1937.30 g/plant, 16.14 t/ha), with no statistical
difference. The commercial check yielded 2,054.60
g/plant (17.12 t/ha), but also presented the highest
amount of damaged fruit (1,570 g, 13 t/ha (Ceballos
and Vallejo, unpublished data). Introduction LA3158
presented the lowest yield at 277.40 g/plant (2.31 t/
ha; P<0.05) (Table 2). Macua et al. (2006) evaluated
nine cherry tomato varieties in greenhouse conditions
and found average yields of 85.78 t/ha, whereas other
cherry tomato varieties yielded between 66 and 103.68
t/ha (Macua et al., 2008). In studies conducted by
Uresti et al. (2007) in hydroponic tomato, yields of 30.1
t/ha were obtained at a population density of 25,650
plants/ha. In experiments conducted by Márquez
and Cano (2005), involving the organic production of
cherry tomato under greenhouse conditions, yields of
95 t/ha were obtained in the check treatment (sandfertigation), whereas Márquez et al. (2006) reported
yields of 78 t/ha in the check treatment with inorganic
fertilizer when using different organic substrates in
cherry tomato. In studies conducted by Padua et al.
6598
(2002) in cherry tomato planted at a low density of
16,000 plants/ha, PDN values of 2,060 g/plant were
obtained, whereas Azevedo and Melo (2001) reported
yields of 1,500 g/plant. Similar values were achieved
in the control treatment and introductions IAC1624
and IAC426, with no statistical difference (Table 2).
In this study, highest yields were obtained by the
commercial check Sweet Million (17.12 t/ha), followed
by IAC1624 (17 t/ha) and IAC426 (16.14 t/ha), at a
population density of 8.333 plants/ha in field conditions
(Table 2). These results suggest that the use of
controlled systems (greenhouse and fertigation) and
commercial densities (between 16,000 and 26,650
plants/ha) could increase PDN (g) and yield (t/ha),
enabling more sustainable production.
Soluble solids contents (SSC). The SSC presented
statistical differences (P<0.05) (Table 3). The
commercial check Sweet Million presented a value of
4.91 °Brix, close to the overall average of 4.92 °Brix.
Twelve introductions, which corresponded to 39% of
the introductions evaluated, presented above-average
values ranging from 4.99 to 6.7 °Brix, with statistical
differences (P<0.05). Highest SSC values were found in
materials LA3158 (6.7 °Brix), IAC424 (6.18 °Brix) and
IAC420 (5.49 °Brix), differing statistically (P<0.05).
Macua et al. (2009) reported values between 5.47 and
8.71 °Brix in industrial cherry tomato varieties and
Marquez and Cano (2005) reported values between
7.23 and 7.93 °Brix in cherry tomato produced
organically under greenhouse conditions. Raffo et al.
(2003), on the other hand, reported fluctuating but
high SSC (6.1 °Brix) and sugar content (3.6 g/100
g) in cherry tomato grown in greenhouse conditions.
Although most of the previously reported values
exceed those reached by the introduction evaluated
in this study, 39% reported values higher than the
commercial check (Table 3) in field conditions. For
20 S. pimpinellifolium introductions collected in
Ecuador and Peru, Rosello et al. (2000) reported a
maximum SSC value of 13.6 °Brix. S. pimpinellifolium
introductions LA3158 and LA1428 presented aboveaverage values, also surpassing the commercial check
(Table 3). LA3158 reported the highest SSC value (6.7
°Brix) of all the introductions evaluated, presenting
statistical differences (P<0.05).
Fruit acidity (FA). Significant differences were found
for FA (P<0.05), expressed as % citric acid (g/100
g fresh weight). With a confidence level of 95%,
introductions IAC412, LA3652, IAC1686, LA2076,
Rev.Fac.Nal.Agr.Medellín 65(2):6593-6604. 2012
Evaluating the fruit production and ....
LA1428 and LA2710 presented values greater than 2
g/100 g fresh weight.
Twenty-four of the 30 introductions presented values
above that of the commercial check (1.39 g/100
g fresh weight). Introductions IAC445, LA1480,
LA1705, IAC426 and IAC424 presented the lowest
values of citric acid, ranging from 1.04 to 1.28 g/100
g fresh weight, with statistical differences (P<0.05)
(Table 3). In studies conducted by Rosales (2008),
cherry tomato harvested three times during the crop
production cycle and at the same stage of maturity
yielded values between 3.57 and 3.70 mg/g fresh
weight (citric acid). Urrestarazu (2004) reported
titratable acidity values for cherry tomato between
520 and 807 mg citric acid/mL, whereas values for
common tomato were between 370 and 550 mg citric
acid/mL. Murray et al. (2000) assessed fruits of cherry
tomato cultivar Super Sweet grown in greenhouse
conditions and found values between 1.01 and 0.81%
citric acid. Higher values were obtained in this study,
which ranged between 1.04% citric acid for IAC412
and 2.44% citric acid for IAC445, when harvested at
stage 3 when 90% of the crop has ripened fruit.
Vitamin C (VITC) content. Statistically significant
differences were found in VITC (P<0.05). The
commercial check presented the highest value (84.5
mg/100 g fresh weight) followed by introductions
IAC445 with 72.5 mg/100 g fresh weight) and LA2710
with 58.8 mg/100 g fresh weight, differing statistically
(P<0.05) (Table 3). At a confidence level of 95%, 14
introductions had above-average values (47.6 mg/100
g fresh weight) (Table 3). Raffo et al. (2003) found
that ascorbic acid varies significantly in greenhousegrown cherry tomato, but is within desirable range
of vitamin C (50–120% of the daily recommended
allowance of 60 mg), which makes it very appealing for
the market. Four of the evaluated materials (LA2710,
IAC445, IAC1624 and LA2076), together with the
commercial check, presented values equal to or above
the recommended daily intake of vitamin C (60 mg),
showing potential to be produced sustainably.
All the evaluated introductions presented VITC
higher than those reported by Lenucci et al. (2006)
in introductions LA2933, LA2656 and BGV009560
of var. cerasiforme and S. pimpinellifolium from the
germplasm bank of the Center for Conservation and
Improvement of Agro-Biodiversity of the Polytechnic
University of Valencia (COMAV), which reported
values of 37, 25 and 21 mg/100 g fresh weight.
Rev.Fac.Nal.Agr.Medellín 65(2):6593-6604. 2012
According to Galiana et al. (2000), vitamin C levels
vary considerably depending on the species —from
80 mg/kg fresh weight in cultivated varieties to 1.113
mg/kg fresh weight in S. pimpinellifolium L. The 30
introductions from the UNAPAL germplasm bank
yielded values that significantly exceed those reported
by COMAV, with LA2710 presenting 73 mg/100 g
fresh weight; IAC445, 61 mg/100 g fresh weight; and
IAC416, 29 mg/100 g fresh weight (the lowest of the
study).
Lycopene (LYC) content. Duncan’s means test
revealed significant differences (P<0.05) in LYC
among the different introductions evaluated.
Introductions with highest content were LA1455 and
LA2845, both with 0.32 mg/mL, followed by IAC426
with 0.30 mg/mL, with no statistical difference
between them but differing statistically with the
other materials (P<0.05) (Table 3). Materials with
lowest LYC were IAC412 (0.04 g/mL) and LA2640
(0.02 mg/mL), which differed statistically (P<0.05).
Hernandez et al. (2007) found LYC values ranging
from 1.89 to 2.56 mg/100 g fresh weight in
commercial cultivars Dunkan and Thomas. Stamova
et al. (1998) reported LYC concentrations of 2.10
to 6.95 mg/100 g fresh weight in 35 cherry tomato
lines.
Zambrano et al. (1995) concluded that LYC synthesis
in tomato var. Rio Grande and pear- type tomato
gradually increases with maturation, ranging from
0.233 mg/g for the stage of physiological maturity
(PM) to 28.72 mg/g in mature fruits on the plant (M)
in the case of the former and from 0.21 µg/g at PM
to 29.72 mg/g in detached mature fruit in the case
of the latter. In this study, fruits were harvested
at full maturity, reaching maximum LYC values of
0.32 mg/mL in LA1455 and minimum of 0.02 µg/
mL in LA2640. Lenucci et al. (2006) observed
large variations between different tomato cultivars,
with eight introductions of S. lycopersicum var.
cerasiforme presenting LYC values ranging from 0.2
to 17.4 mg/100 g fresh weight, while the highest
values were found in the species S. pimpinellifolium
with 18 and 25 mg/100 g fresh weight. Average LYC
content for introductions evaluated in this study was
0.18 µg/mL, with a confidence level of 95%; 55%
of the introductions evaluated scored above this
level, including the check (Sweet Million). One of
the introductions of the species S. pimpinellifolium
(LA1428) presented a LYC content of 0.21 µg/mL, at
a confidence level of 95%.
6599
Ceballos , N.; Vallejo, F.A.
Table 3. Partitioning of means according to Duncan’s means test for fruit quality variables in 30 cherry tomato
introductions.
Introduction
LA3158
IAC424
IAC420
IAC1621
IAC1688
IAC445
LA1455
IAC426
LA1546
IAC391
LA2076
LA1428
Testigo
IAC421
IAC412
IAC1624
LA168
IAC1685
LA2692
LA2710
LA1705
IAC1686
LA3139
IAC1622
LA2640
LA1480
LA2131
LA2845
LA1334
IAC416
LA3652
Mean
Lycopene (mg/
mL)
Vitamin C
(mg/100 gfw)
Titratable acidity
(% citric acid)
Soluble solids
(°Brix)
0.09 mn
0.22 df
0.12 km
0.24 ce
0.13 jl
0.16 hk
0.32 a
0.3 ab
0.25 ce
0.17 gj
0.09 mn
0.21 eg
0.18 fi
0.15 il
0.04 op
0.27 bc
0.23 ce
0.18 fi
0.12 km
0.2 eh
0.08 no
0.12 lm
0.15 il
0.18 fi
0.02 p
0.26 cd
0.24 ce
0.32 a
0.24 ce
0.05 op
0.23 ce
0.18
40 im
52 ci
46.75 ek
43.75 fl
47.75 ej
58.75 ce
54.75 cg
35 km
54 cg
41.25 hl
55.75 cf
35 lm
84.5 a
41 hl
38 jm
60.25 cd
52.25 ci
34.25 lm
33.25 lm
72.5 b
46.5 fk
41 hl
49 dj
51 ci
28.9 m
44.5 fl
43 gl
61.25 c
43.5 fl
32.75 lm
52.75 ch
47.6
1.9 cd
1.28 gi
1.87 cd
1.57 ef
1.9 cd
1.04 j
1.89 cd
1.21 hj
1.79 de
1.35 fi
2.07 bc
2.05 bd
1.39 fh
1.54 f
2.44 a
1.57 ef
1.47 fg
1.83 cd
1.94 cd
2.01 bd
1.2 hj
2.2 b
1.84 cd
1.92 cd
1.47 fg
1.14 ij
1.46 fg
1.55 f
1.91 cd
1.55 f
2.21 b
1.7
6.7 a
6.18 b
5.49 c
5.36 cd
5.31 cd
5.29 ce
5.24 cf
5.17 cg
5.16 cg
5.07 dh
5.04 dh
4.99 di
4.91 ej
4.89 fj
4.84 fk
4.84 fk
4.83 fk
4.81 gl
4.77 gl
4.7 hm
4.7 hm
4.63 im
4.59 im
4.57 jm
4.54 jm
4.51 jm
4.47 km
4.43 km
4.41 lm
4.33 mn
4.04 n
4.93
* Different letters indicate significant differences (P<0.05) by Duncan’s means test.
Principal component analysis. The results of
principal component analysis indicated six components
with eigenvalues > 1, accounting for 80.39% of the
variability of the introductions evaluated (Table 4).
The variables contributing most to the first component
were NFLR (0.31), NFR (0.28), TNF (0.28) and NGF
6600
(0.17). This component is referred to as number of
fruits. The second component, referred to as yield,
gathers the following variables: PDN, WDF, AFW and
GFW with eigenvalues between 0.35 and 0.23 (Table
5). The third component was called external quality
and the fourth, internal quality, gathering variables
Rev.Fac.Nal.Agr.Medellín 65(2):6593-6604. 2012
Evaluating the fruit production and ....
Table 4. Eigenvalues of the principal components of the correlation matrix for 30 cherry tomato introductions.
Principal
component
Eigenvalue
Difference between
Eigenvalue
% Variation explained
Cumulated
value
1
6.57
1.71
0.27
0.27
2
4.86
1.66
0.20
0.48
3
3.20
0.79
0.13
0.61
4
2.41
1.18
0.10
0.71
5
1.23
0.19
0.05
0.76
6
1.03
0.05
0.04
0.80
7
0.98
0.21
0.04
0.84
such as ECF, FS, NSF, NLF and internal aspects such
as FF, VITC, FA and LYC. The highest eigenvalues
corresponded to ECF, scoring 0.41 in terms of
external quality and FF scoring 0.27 in terms of
internal quality (Table 5).
The variability of the introductions is attributed to
principal components 1 and 2, with component
1 accounting for 27% and component 2, 20%.
Component 3 accounted for 13% and component
4, 10%. Together these four components account
for 71% of the variability of the introductions
evaluated. Components 5 accounted for 5% and
component 6 for 4% of the variability, together
accounting for only 9% of the variability of these
introductions.
Table 5. Variables with the highest weight in the principal component (PC) analysis for 30 cherry tomato
introductions: fruit number, yield, external quality, and internal quality.
Fruit number
PC 1
Yield
PC 2
External quality
PC 3 Internal quality
Flowers/raceme
0.31
g/plant
0.35
Fruit color
0.41
Fruits/raceme
0.28
Fruit weight loss
0.32
Fruit shape
-0.32 Vitamin C
-0.24
Fruits/plant
0.28
g/fruit
0.32
Number of locules
0.24
Titratable acidity
-0.21
Good fruit
0.17
Fruit weight
0.23
Number of seeds/fruit
0.22
Lycopene
0.17
Lobo and Medina (1994) assessed the phenotypic
variation of American tomato cultivars based on a
multivariate canonical discriminant procedure for 12
quantitative traits including number of petals/flower,
fruit size, number of locules/fruit, pericarp width,
number of flowers/inflorescence and SSC in fruit.
These variables accounted for 66% of the variability
of the cultivars evaluated.
Cluster dendrogram analysis. Cherry tomato
germplasm presented 81% phenotypic similarity,
generating two main groups: cluster 1 (with subclusters
1, 2 and 3) with materials from the IAC germplasm
bank of the Agronomic Institute of Campinas (IAC)
and coded accordingly and cluster 2 (subclusters 4
and 5) with materials from Tomato Genetics Resource
Center (TGRC) coded LA, indicating the genetic
Rev.Fac.Nal.Agr.Medellín 65(2):6593-6604. 2012
Firmness of fruit
PC 4
0.27
variation in the evaluated germplasm consisting of 30
introductions and the commercial check Sweet Million
(Figure 1). The cluster that disappears at a genetic
distance of 14.78% corresponds to the commercial
check (cluster 6), which merges with cluster 1 formed
by three materials and cluster 2 formed by four
materials; 86% of these materials are materials from
the IAC germplasm bank. These two clusters are the
first to merge when they reach 94% similarity, while
the other four remain separate until 86% similarity.
Clusters 3 and 4 are formed by seven introductions
each, which begin to form between 97% and 99%
similarity. In cluster 3, compound clustering is mostly
evidenced by IAC materials, whereas cluster 4 tends
to group materials from the coded LA. Finally, the
most distant cluster (cluster 5) groups the rest of
the LA materials (Figure 1), representing the largest
6601
Ceballos , N.; Vallejo, F.A.
of the clusters with nine introductions in total. Cluster
5 merges with clusters 3 and 4 when it reaches 85%
genetic similarity, showing the highest variability as
compared with the aforementioned four clusters.
Restrepo and Vallejo (2003) classified 25 introductions of
tomato, locally known as ‘chonto’, from the departments
of Cauca, Valle del Cauca, Antioquia, Santander and
Huila as well as the coffee-growing region of Colombia.
Three groups were formed: the first consisted of two
introductions of var. cerasiforme; the second of all tomato
‘chonto’ introductions from the departments of Cauca,
Valle del Cauca, Antioquia, and Huila as well as the coffeegrowing region of Colombia; and the third exclusively of
tomato ‘chonto’ variety Rio Grande from the department
of Santander. Garzón (2011) evaluated 36 cherry tomato
introductions using principal component analysis and
found that the variables yield, AFW, predominant shape
of fruit and pericarp thickness contributed most to the
expression of variability in introductions.
Figure 1. Cluster dendrogram of fruit production and quality of 30 cherry tomato introductions.
Rodríguez et al. (2003) evaluated 59 introductions from
North America that had been planted in Valencia, Spain,
under greenhouse conditions and discovered four attributes
of the fruit (AFW, predominant color of ripe fruit, fruit size,
predominant fruit shape) that could be used to characterize
and differentiate the germplasm evaluated, which showed
a high degree of variability for the traits under study.
CONCLUSIONS
Variables with the highest weight in the principal
component analysis indicate that the traits associated
with production and number of fruits, followed by
production/plant, account for 47.6% of the phenotypic
variability expressed in the introductions. Joining these
traits are the components of external and internal
quality, which account for 23.3% of the variability and
all together for 70.9% of germplasm variability.
Cherry tomato germplasm presented 81% phenotypic
similarity, generating two main groups: cluster 1 (with
subclusters 1, 2, and 3) with materials from the IAC germplasm
bank coded IAC and cluster 2 (subclusters 4 and 5) with
materials from TGRC coded LA, which favors the selection of
6602
contrasting materials and genetic improvement of tomato
for traits such as yield components and fruit quality.
Of the introductions evaluated in this study, the most
promising for selection for production and quality are
IAC1624, IAC391, IAC3652, LA2131, IAC424, IAC1621,
IAC426, LA1480 and IAC1688 in at least three of the
five main variables, such as AFW, yield per plant (g/
plant), SSC (°Brix), VITC (mg/100 g), and LYC (µg/mL).
ACKNOWLEDGEMENTS
Thanks to Productos Químicos Andinos (P.Q.A); Plant
Transformation Research Center (PTRC) at the University
of California; Institute of Agricultural Biotechnology at
the Universidad de Caldas; Laboratory of Engineering of
Food Quality.
BIBLIOGRAPHY
Abadie, T. and A. Berretta. 2001. Caracterización y
evaluación de recursos fitogenéticos. Estrategia en
recursos fitogenéticos para los países del cono sur.
PROCISUR, Uruguay. 8 p.
Rev.Fac.Nal.Agr.Medellín 65(2):6593-6604. 2012
Evaluating the fruit production and ....
Azevedo F.J. and A.M. Melo. 2001. Avaliação de tomate
silvestre do tipo cereja. Horticultura Brasileira 19(2):
289-290.
Boada, M., J. Mejía, N. Ceballos, and F. Orozco. 2010.
Evaluación agronómica de treinta introducciones de
tomate silvestre tipo cherry (Solanum lycopersicum L.).
Agronomía 18(2): 59–67.
Candelas, M.G., M.J. Alanis, M. Bautista, F. Del Rio
and D. García. 2008. Contenido de licopeno en jugo
de tomate secado por aspersión. Revista Mexicana de
Ingeniería Química 4(3): 299–307.
Cestoni, F., G. Jovel, and A. Urquilla. 2001. Perfil de
negocios del tomate cherry o cereza hacia el mercado de
los Estados Unidos. Dirección de Desarrollo Competitivo
de las Exportaciones, Subdirección de Inteligencia
Competitiva, Ministerio de Economía, El Salvador. 73 p.
FAOSTAT. 2010. Agriculture. Statistics on crops. Core
production data. In: http://faostat3.fao.org/home/
index.html#DOWNLOAD. accessed: August 2012.
Galiana, L., S. Roselló and F. Nuez. 2000. Sources of high
soluble solid and vitamin C content from Lycopersicon
pimpinellifolium are interesting in breeding for internal
quality of fresh market tomato. Tomato Genetics
Cooperative Report 50: 33–34.
Garzón, J.P. 2011. Caracterización y evaluación
morfoagronómica de la colección de tomate tipo
cherry de la Universidad Nacional de Colombia sede
Palmira. Tesis Magister en Ciencias Agrarias. Facultad
de Ciencias Agropecuarias. Universidad Nacional de
Colombia. Palmira. 56 p.
Hernández, M., H. Rodríguez, and C. Díaz. 2007.
Free hydroxycinnamic acids, lycopene, and
color parameters in tomato cultivars. Journal of
Agricultural and Food Chemistry 55(21): 8604–
8615.
International Plant Genetic Resources Institute
(IPGRI). 1996. Descriptores para el cultivo del tomate
(Lycopersicon spp.). IPGRI, Rome. 49 p.
Jaramillo, J., V.P. Rodríguez, M. Guzmán, M. Zapata,
and T. Rengifo. 2007. Manual técnico: buenas prácticas
agrícolas en la producción de tomate bajo condiciones
protegidas. FAO, Gobernación de Antioquia, FAO-MANA,
CORPOICA, Rionegro. 315 p.
Rev.Fac.Nal.Agr.Medellín 65(2):6593-6604. 2012
Kuti, J., and H. Konuru. 2005. Effects of genotype
and cultivation environment on lycopene content in
red-ripe tomatoes. Journal of the Science of Food and
Agriculture 85: 2021–2026.
Kwon, Y.S., S.G. Park, and S.I. Yi. 2009. Assessment of
genetic variation among commercial tomato (Solanum
Iycopersicum L) varieties using SSR markers and
morphological characteristics. Genes and Genomics
31(1):1–10.
Lenucci, M.S., D. Cadinu, M. Taurino, G. Piro, and
G. Dalessandro. 2006. Antioxidant composition in
cherry and high-pigment tomato cultivars. Journal
of Agricultural and Food Chemistry 54(7): 2606–
2613.
Lobo, M. and C.I. Medina. 1994. Phenotypic evaluation
of Latin American tomato cultivars. Tomato Genetics
Cooperative Report 44: 26.
Macua, J., I. Lahoz, J. Garnica, S. Calvillo, J. Zúñiga,
and A. Santos. 2006. Tomate de industria. Campaña
2006. Navarra Agraria 154: 21–31.
Macua, J., I. Lahoz, J. Garnica, S. Calvillo, J. Zúñiga,
and A. Santos. 2008. Otras variedades de tomate.
Campaña 2008. Navarra Agraria 166: 7–14.
Macua, J., I. Lahoz, A. Santos, J. Zabaleta, and C.F.
Calvillo. 2009. Tomate de industria: variedades de
tomate tipo cherry o cereza para cosecha única.
Navarra Agraria 172: 14–20.
Márquez, C. and P. Cano. 2005. Producción orgánica
de tomate cherry bajo invernadero. Actas Portuguesas
de Horticultura 5(1): 219–224.
Márquez, C., P. Cano, A. Moreno and N. Rodríguez.
2006. Sustratos en la producción orgánica de tomate
cherry bajo invernadero. Revista Chapingo (Serie
Horticultura) 12(2): 183–188.
Medina, C.I. and M. Lobo. 2001. Variabilidad
morfológica en el tomate pajarito (Lycopersicon
esculentum var. cerasiforme), precursor del tomate
cultivado. Revista Corpoica 3(2): 39–50.
Miller, J.C. and S.D. Tanksley. 1990. RFLP analysis
of phylogenetic relationships and genetic variation
in the genus Lycopersicon. Theoretical and Applied
Genetics 80(4): 437–448.
6603
Ceballos , N.; Vallejo, F.A.
Murray, R., C. Lucangeli, G. Polenta and C. Budde. 2000.
Calidad de tomate cereza cosechado en tres estados
de madurez. p. 47. In: XXIII Congreso Argentino
de Horticultura, X Congreso Latinoamericano y III
Congreso Iberoamericano de Horticultura. Mendoza –
Argentina.
Rosales, M. 2008. Producción y calidad nutricional en
frutos de tomate cereza cultivados en dos invernaderos
mediterráneos experimentales: Respuestas metabólicas
y fisiológicas. Tesis Doctoral. Facultad de Ciencias,
Universidad de Granada. Granada, España. 231 p.
Nagata, M. and I. Yamashita. 1992. Simple method
for simultaneous determination of chlorophyll and
carotenoids in tomato fruit. The Japanese Society of
Food Science and Technology 39(10): 925–928.
Roselló, S., L. Galiana and F. Nuez. 2000. Sources of high
soluble solid and vitamin C content from Lycopersicon
pimpinellifolium are interesting in breeding for internal
quality of fresh market tomato. Tomato Genetics
Cooperative Report 50: 30–33.
Nuez, F. 1999. Desarrollo de nuevos cultivares. pp.
625–669. In: F. Nuez (ed.). El cultivo del tomate.
Mundi-Prensa, Madrid. 793 p.
Stamova, L., H. Manuelyan and D. Ganeva. 1998.
Lycopene content in some Bulgarian tomato lines.
Tomato Genetics Cooperative Report 48: 18.
Padua, J.G., S.A. Gusmão, M.T. Gusmão, and L.T. Braz.
2002. Efeito da densidade de plantio e da cobertura do
solo na produção de duas cultivares de tomateiro tipo
“cereja”. Horticultura Brasileira 20(2): 386.
Trani, P, F. Passos, A. Melo and I. Riberiro. 2003.
Avaliação da produtividade e qualidade comercial de
quatro genótipos de tomate do tipo “cereja”. p.1-4. In:
Memorias Workshop tomate na Unicamp: Pesquisas e
tendencias. Campinas. Brazil.
Peralta, I.E., S. Knapp and D.M. Spooner. 2006.
Nomenclature for wild and cultivated tomatoes. Tomato
Genetics Cooperative Report (TGCR) 56: 6.
Raffo, A., M. Salucci, E. Azzini, A. Bertone, G. Quaglia, V.
Fogliano, G. Graziani, and G. La Malfa. 2003. Nutritional
characteristics of greenhouse cherry tomatoes. Acta
Horticulturae 614: 681-686.
Razdan, M. and A.K. Mattoo. 2007. Genetic
improvement of solanaceous crops. Vol. 2. Tomato.
Science Publishers, Enfield, NH, USA. 646 p.
Restrepo, E.F. and F.A. Vallejo. 2003. Diversidad genética
del tomate cultivado tipo “chonto”, Lycopersicon
esculentum Mill, en las zonas productoras de Colombia.
Acta Agronómica 52(1): 11–17.
Rodríguez, G., G. Pratta, R. Zorzoli and L.A. Picardi.
2005. Caracterización de la generación segregante de un
híbrido de tomate con genes nor y silvestres. Pesquisa
Agropecuária Brasileira (Brasília) 40(1): 41–46.
Uresti, R., M.A. García, Z. Resendiz, G. Bustos, R.
Basanta, E. Padron, H. Mata, and J. Cervantes. 2007.
Cultivo de tomate cereza en sistema hidropónico.
Universidad Autónoma de Tamaulipas. Revista Digital
Universitaria 2(3): 1–2.
Urrestarazu, G.M. 2004. Tratado del cultivo sin suelo.
Mundi-Prensa, Madrid, España. 914 p.
Valcárcel, G.M. 2009. Optimización del proceso de
evaluación y selección de germoplasma de tomate
por características de calidad organoléptica: Uso de la
tecnología NIR y sensores electrónicos. Tesis Doctoral.
Escola Superior de Tecnología i Ciènces Experimentals.
Departament de Ciènces Agràries i del Medi Natural.
Universitat Jaume I de Castellón. 201 p.
Vallejo, F.A. 1999. Mejoramiento genético y producción
de tomate en Colombia. Universidad Nacional de
Colombia. Sede Palmira. 216 p.
Rodríguez, R.G. 2007. Efecto de la cobertura del suelo
con cascarilla de arroz en el crecimiento y rendimiento
del tomate de ramillete. Ciencia e Investigación Agraria
34(3): 225–230.
Virk, P.S., B.V. Ford-Lloyd, M.T. Jackson, and H.J.
Newbury. 1995. The identification of duplicate
accessions within a rice germplasm collection using
RAPD analyses. Theoretical and Applied Genetics 90(78): 1049–1055.
Rodríguez, A., J. Prohens, E. Solbes, P. Fernández and F.
Nuez. 2003. Characterization of North American heirloom
tomatoes. Tomato Genetics Cooperative Report 53: 28.
Zambrano, J., J. Moyeja and L. Pacheco. 1995. Efecto
del estado de madurez en la composición y calidad de
frutos de tomate. Agronomía Tropical 46(1): 61–72.
6604
Rev.Fac.Nal.Agr.Medellín 65(2):6593-6604. 2012