1
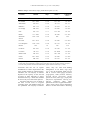
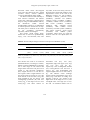
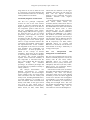
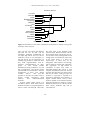
J. Soil Sci. Plant Nutr. 11 (1): 127 - 140 (2011)
SOIL FERTILITY EVALUATION OF COFFEE (Coffea spp.)
PRODUCTION SYSTEMS AND MANAGEMENT
RECOMMENDATIONS FOR THE BARAHONA
PROVINCE, DOMINICAN REPUBLIC
P.A. Núñez1*, A. Pimentel1, I. Almonte1, D. Sotomayor-Ramírez2, N. Martínez3,
A. Pérez1, and C.M. Céspedes1
1
Investigadores Instituto Dominicano de Investigaciones Agropecuarias y Forestales
(IDIAF), Avenida Imbert # 5, Las Carolinas, La Vega, República Dominicana.
2
Catedrático del Departamento de Ciencias Agroambientales, Colegio de Ciencias
Agrícolas, Universidad de Puerto Rico, Recinto Mayagüez, Puerto Rico. 3Magister
en Ecología y Medio Ambiente, Universidad Pedro Henríquez Ureña, Santo
Domingo, República Dominicana. *Corresponding author: [email protected]
ABSTRACT
Reported yields in most coffee farms of the Barahona province in the Dominican
Republic are relatively low (< 290 kg ha-1 parchment coffee). In general, coffee
producers do not use diagnostic techniques such as soil testing. This fact prevents them
from identifying the limiting factors (especially nutrients), complicates the work of
coffee cultural management practices, and potentially reduces productivity and coffee
quality. This study was designed to diagnose the fertility level of soils in coffee farms in
the area of Barahona in 96 farms within an area of 637 hectares and design a nutrient
management strategy. Soils from each farm were sampled and analyzed for soil fertility
parameters. A survey was provided to farmers that permitted the collection of
information regarding yields, management practices, and landscape features. Soils in the
area were predominantly clayey. Soil pH varied between 4.61 and 7.69 and soil organic
matter ranged between 3.29 and 10.9%. Exchangeable potassium levels were classified
as deficient in all areas. The clustering of results identified two main components,
which accounted for 76% of the variability of the data and the grouping into five
communities by similarity of features. The results show that soil testing of this coffee
coffee-growing region can be used as a tool to diagnose the soil fertility status and guide
them in implementing management and fertilization recommendations.
Keywords: soil fertility, yield coffee, fertility diagnostic, Dominican Republic.
INTRODUCTION
The production of coffee (Coffea spp.)
has of great economic and social
importance at local, regional and global
levels. In the Dominican Republic, coffee
is second most important agricultural
product for export, after cocoa. Bean
exports from Dominican Republic have
stabilized in the last 4 years (2006-2009)
with an average of 122,000 quintals (1
quintal = 45.5 kg) of market coffee per
127
Diagnosis of soil fertility coffee, Nuñez et al.
year, after averaging only 61,000 quintals
in the years 2004 and 2005. Said amount
represents an increase of about 100% in
the volume of these exports. For this same
period, the annual value of bean exports
has increased from US$ 6.8 to US$ 17
million, which represents an increase of
150% in export value (CODOCAFE,
2010). In the 2009, national coffee
production recorded an increase of 6.65%
compared to 2008, while the export value
of 137,580 quintals of green coffee
increased by 32.71% over that in 2009,
for a value of US$ 20.9 million. The
estimated production of parchment coffee
is between 600,000 and 700,000 quintals
(27,273 to 31,818 metric tons). The
Dominican Republic has a coffee
production area of 132,500 ha occupied
by 50,000 farmers (CODOCAFE, 2002).
A sustainable system of coffee
production should prevent soil erosion
and contribute to the preservation of
forests and their associated habitat
(Martinez, 2010). This system should also
produce environmental benefits, such as
conservation of flora and fauna (provides
protection and shelter for native and
migratory species of birds), increase the
scenic value of the field, and improve air
quality (Hergoualc’h et al., 2008). Coffee
is a crop that is produced under a variety
of growing conditions, and is widely
cultivated
in
tropical
climates
(CENICAFE,
1999)
with
similar
conditions to those in the Dominican
Republic (Vicente-Chandler et al., 1968).
The coffee production zone in the
Dominican Republic has average annual
temperatures between 17 and 30ºC,
rainfall ranging between 1000 and 2400
mm and altitudes between 200 and 1400
m.a.s.l. Although there are ecologically
suitable for coffee production, the yields
reported in the majority of farms are
relatively low (< 290 kg parchment coffee
ha-1). Soil is one of the most important
factors related to the productivity of
coffee (Almonte, 2008). Avelino et al.
(2002) reported that the acidity and soil
texture influence the quality of the grain
coffee. Escarramán et al. (2008) reported
that the planting altitude and variety are
the factors that have the greatest influence
on the granulometry and sensory
characteristics of coffee.
In the Barahona Province of the
Dominican Republic, coffee is planted
mainly under shade conditions. According
(Almonte, 2008), most coffee soil from
Barahona province belong to the order
Inceptisols and Entisols. The soils vary
from moderate to strongly acidic.
However, this information is not
conclusive and varies according to the
management. Farmers in the area
generally lack specific knowledge about
the properties associated with the fertility
of farm soils. The lack of quantitative
knowledge related to crop limiting
factors, prevents farmers from taking
proper corrective actions; hinders cultural
cropping practices, and reduces coffee
yield and quality. Proper diagnosis and
sustainable fertilizer recommendations
cannot be made without recent
information on the fertility characteristics
of soils. This research was conducted with
the goal of diagnosing the nutrient status
and other soil fertility limiting factors,
and to refine management options for
these agroforestry systems in the
Barahona Province.
MATERIALS AND METHODS
Experimental site and description area
The Barahona Province has an extension
of 1,639 km². It is located between
latitudes 18˚40’ and 18˚12’N and
longitudes 71˚17’ and 71˚21’ W,
southwest of the Dominican Republic.
The area has an altitude between 700 and
128
J. Soil Sci. Plant Nutr. 11 (1): 127 - 140 (2011)
1200 m.a.s.l., has a temperature annual
range of 17 and 221ºC with an annual
average of 26°C1. The annual rainfall
varies between 655 and 2296 mm (Pérez
et al., 2002). The coffee cultivated area in
the Barahona Province is 11,082 ha with
about 3,565 participating farmers
(CODOCAFE, 2002). Most of the area
(98.6% or 30,710 ha) is in arabica cofee
(C. arabica), whith the remainder (1790
ha) is planted to robusta coffee (C.
canephora).
Farm survey and soil sampling
The fifteen coffee production areas of the
Provice were identified from which 96
farms were selected. The farms were
identified based on the 2001 National
Coffee Census (CODOCAFE, 2001). The
sample size was computed using the
software InfoStat (2008), with an error of
10%, considering the total number of
coffee farms (3,565 farms), in an area of
11,082 ha. Specific location of each farm
was made using using topographic sheets
for the area. All farm visits were made
from April to July 2009.
The distribution of cases by
location was based on proportion of farms
and area occupied by location: Las
Guázaras (7), Santa Helena (9), Bahoruco
(6), Las Ciénaga (12), Polo (3), Bretón
(10), Monteada Nueva (1), La Lanza (7),
Los Charquitos (8), Platón (1), Leonardo
(7), Los Patos (7), María Teresa (5),
Chene (7) and El Pino (6). Each farm was
georeferenced with GPS model Garmin
GPS 76 (Garmin International Inc.,
Olathe, KS). A survey was prepared and
personally supplied to each farmer in
order to characterize current yields,
agronomic practices and other related
information, for example: weed control,
pest
management
practices,
soil
1
http://es.wikipedia.org/wiki/Barahona_(Rep%C3
%BAblica_Dominicana)
conservation practices, extent of shadetree pruning, coffee tree pruning and
fertilization or manure management
practices.
Soils were sampled to a depth of 30
cm with bore or cutting blade.
A
composite sample from each farm was
gatherd by taking six subsamples from
each of the three main geomorphologic
positions (shulder, backslope, foot-toe
slope) at the farm. Two subsamples were
gathered from each geomorphologic
position). All leaves and other surface
debris were removed by hand. The six
sub-samples were homogenized to obtain
a composite sample of 2 kg. Samples
were placed in previously identified
plastic bags and sent to the laboratory for
analisis within two weeks.
Soil characteristics
Soil samples were air-dried and sieved to
pass a 2-mm mesh sieve. Soils were
analyzed for soil fertility characteristics
following methodology outlined in Page
et al. (1982).
The pH was determined in a ratio 1:2
(soil:water) using a potentiometer. The
organic matter (OM) was measured by the
Walkey and Black method (potassium
dichromate oxidation). The electrical
conductivity was determined on the
supernatant obtained from a 1:2 (soil:
water) suspension using a conductivity
bridge. The total nitrogen (TN) was
measured using the Kjeldahl method.
Available P was extracted using the
Mehlich III extractant followed by
quantification
in
a
UV-Vis
spectrophotometer. The exchangeable
bases were measured by the extraction
with NH4OAC followed by quantification
using atomic absorption. Exchangeable
acidity was extracted with 1M KCl,
followed by the quantification of Al and
H by titration. The micronutrients iron
(Fe), copper (Cu), manganese (Mn) and
129
Diagnosis of soil fertility coffee, Nuñez et al.
zinc (Zn) were determined by the method
of digestion with nitric-perchloric acid by
followed by quantification by atomic
absorption.
We calculated the effective cation
exchange capacity (ECEC) based on the
sum of the bases and exchangeable
acidity. Aditional relations such as
Ca/Mg, Mg/K, Ca+Mg/K, sodium
saturation
percentage
(SSP)
and
aluminum saturation percentage (ASP)
were calculated. The texture was
measured in the laboratory using a
hydrometer Bouyucos (Page et al., 1982).
All tests were performed according to
the standard protocols of the CENTAIDIAF Soil Test Laboratory. Each sample
was tested the color (wet) with the
Munsell color chart.
Statistical analysis
The data were analyzed using descriptive
statistics, using the InfoStat software
(version 2008). Multivariate analysis was
applied to the data: principal component
analysis (PCA) and cluster analysis, with
clustering by Euclidean distance.
RESULTS AND DISCUSSION
Overview of the coffee farms
Most coffee production farms in the
Barahona province are small, as 64% had
an area less than 5 ha and 56% of were
between 2.1 and 5.0 ha. The median farm
area was 3.75 ha. The largest farms were
found in Chene and Las Cienagas
locations with a mean area of 56 ha and
the smallest were found in Polo and Los
Charquitos with a mean of 0.94 ha (Table
1). This information coincides with that
reported by Nuñez and Cuevas (2004) in
coffee plantations in the provinces of
Monseñor Nouel and La Vega. As the
130
farms were small, the farmers may lack
the resources to hire and/or perform
diagnostic techniques for soil nutrient
status and plant.
The coffee farms evaluated were in an
altitude range of 309 to 1279 m.a.s.l.
Most farms (64%) were within ranges
considered optimal for coffee production,
which is between 700 and 1,000 m.a.s.l
(Almonte, 2008; Almonte et al., 2010).
About 17% of the farms were located at
altitudes above 1,000 m.a.s.l. and the
remaining 19% were at or below 700
m.a.s.l. The average soil slope range was
between 0.5 and 20%. However, on
occasion, some slopes of over 50% or
more were identified, and predominated
in Guindadero and El Membrillo in
Bahoruco locations.
Most of the farms were planted to
Caturra and Typica variety. The highest
percentage (69%) of farms had Typica
coffee and a smaller percentage (31%)
had Caturra. The highest coffee
parchment yields were reported in Los
Patos (501 kg ha-1), Monteada Nueva
(464 kg ha-1) and Maria Teresa (315 kg
ha-1). These yields are slightly higher than
those reported nationally for parchment
coffee of 290 kg ha-1. The reported yields
in the remaining locations were lower
than the national average (< 200 kg ha-1
parchment coffee). A possible reason for
the low yields is that farmers do not
fertilize adequately, there is no structured
agronomic
management
program
(including pest management, pruning, replanting), lack of manpower, and
reduction in international prices coffee, all
of which discourage the farmers to use
available technology (Table 1).
Coffee plantation management and soil
description
The coffee farmers that were surveyed did
not use chemical fertilizers. About 16% of
farms carried out some type of practice
J. Soil Sci. Plant Nutr. 11 (1): 127 - 140 (2011)
Table 1. Ranges of elevation, slope, yields and crop area (n= 96).
Locations
Altitude
Slope
Yield***
Cultivated
area**
m.a.s.l.
%
kg ha-1
ha
La Guázara
641 - 1040
0 - 40
116 - 291
1.8 - 12.5
Santa Elena
674 - 837
0 - 45
58 - 175
2.0 - 3.1
Bahoruco
493 - 714
0 - 50
59 - 255
2.2 - 6.3
La Cienaga
448 - 855
0 - 30
80 - 400
1.9 - 56.3
Polo
703 - 721
0-5
112 - 416
1.0 - 4.4
Bretón
717 - 1063
0 - 30
48 - 280
2.5 - 12.5
Monteada
Nueva*
1161 - 1161
0 - 10
464
3.25
La Lanza
891 - 1139
0 - 20
96 - 400
2.5 - 25.0
Los Charquitos
1193 - 1279
0 - 40
64 - 176
1.9 - 4.4
309
10
120
3.16
Leonardo
563 - 893
0 - 30
96 - 320
3.1 - 9.4
Los Patos
710 - 937
0 - 30
48 - 2000
1.9 - 25.0
María Teresa
578 - 819
0 - 35
160 - 560
1.3 - 9.4
Chene
807 - 1035
0 - 25
96 - 400
1.3 - 52.8
El Pino
948 - 995
0 - 25
80 - 336
2.5 - 9.4
Platón*
* Only one sample was taken so it appears a single value and not the range.
** 69% of the area is dedicated to coffee Typica (8-80 years) and 31% of coffee Caturra (1-40 years).
*** None of the producers made chemical fertilizers, organic fertilizer made only 7 (7.29%).
associated with the use of organic
amendments in solid or liquid form in the
form of plant residues or animal manures.
Therefore, the vast majority of farmers
depend on the capacity of the soil and
recycling of plant materials to supply
nutrients to the crop. About 78% of farms
do not use any soil conservation practice.
All farms had some type of shade in
the form of fruit trees or evergreen
secondary forest. The shading extent was
not quantified. The majority of farmers
(92%) carry out some form shading
management. In all farms, inga (Inga
vera), was the dominant shade species
and to a lesser extent poppy (Erythina
poeppigiana), cedar (Cedrela odorata),
avocado (Persea americana), several
species of citrus (Citrus spp.), royal palm
(Roystonea hispaniolana, and fig tree
(Ricinus communis). Most coffee
plantations are inter-cropped with banana
(Musa AAA), and is used to supplement
farmer’s income when coffee is not being
131
Diagnosis of soil fertility coffee, Nuñez et al.
harvested. Other minor inter-cropped
crops were yam (Xantosoma spp.), squash
(Sechium edule), cassava (Manihot
esculenta) and plantain (Musa AAB).
All farmers control weeds manually or
with selective herbicide. All farmers
control the coffee borer (Hypothenemus
hampei) using recommendations made by
the
Dominican
Coffee
Council
(CODOCAFE), which are a combination
of cultural practices and the use of traps.
The other pests or diseases of the coffee
are
not
considered
economically
important, and are not managed.
Soil texture varied among farms.
About 52% of soils were predominantly
clayey, 21% were silt-loam, 16% were
clay-loam, 10.4% were loamy, and 1% of
the farms were sandy-loam (Table 2). The
representative colors of the soils in the
Barahona province are: red (2.5YR4/6,
2.5YR4/8, 7.5R4/6), yellowish brown
(10YR5/6), yellowish red (5YR4/6,
5YR5/6), brown (7.5YR4/2, 7.5YR4/3,
7.5YR4/4), reddish brown (2.5YR4/4),
dark brown (10YR3/3, 7.5YR5/6,
10YR3/3),
dark
yellowish
brown
(10YR4/4),
dark
reddish
brown
(2.5YR3/3), brownish yellow (10YR6/6),
pale yellow (2.5Y8/3), strong brown
(7.5YR5/6)
and
reddish
yellow
(7.5YR6/6). These colors vary with the
locations and the soil depth (data not
shown).
Table 2. Texture and percentage occurrence in the province Barahona (n=96).
Provinces
Barahona
Number and percentage of coffee farms/ texture type
Clay
Loamy
CL
SL
SaL
ClL
FCL
Total
50
10
15
20
1
0
0
96
(52.1)
(10.4)
(15.6)
(20.8)
(1.0)
(0.0)
(0.0)
(100.0)
Values in parentheses (%); Franco clay loam (FCL); Clay loam (CL); Silt loam (SL); Sandy loam
(SaL); Clayey loam (ClL).
Soil reaction was acid in six locations
(Monteada Nueva, La Cienega, Los Patos,
Platón, La Lanza and Bahoruco), but there
was a wide range of soil reaction that
ranged from with mean soil pH of 6.14
(Table 3). The electrical conductivity
(EC) ranged from 0.13 to 0.92 dS m-1.
Soil organic matter ranged between 3.0
and 10.8% with an average of 7.4%. The
mean total N in all soils was 0.53%. The
mean available P was 14.3 mg kg-1 and
exchangeable potassium (K) was 0.27
cmol(+) kg-1 in the range of 0.12 to 0.45
cmol(+) kg-1). The mean content of
132
extractable iron (Fe), zinc (Zn),
magnesium (Mg) and copper (Cu) were
215, 4.67, 46.6, 5.99 mg kg-1,
respectively. Soil exchangeable calcium
(Ca) varied between 2.26 and 43.4 4
cmol(+) kg-1, and exchangeable Mg
content ranged from 0.55 to 3.56 cmol(+)
kg-1. The effective cation exchange
capacity (ECEC) ranged from 4.67 to 46.3
cmol(+) kg-1 and ratios of Ca/Mg were
between 4 and 20, very similar to the
Mg/K ratios in the range of 6 to 17). The
Ca+Mg/K ratios were high (27 to 194).
Na and Al saturation indices were in
J. Soil Sci. Plant Nutr. 11 (1): 127 - 140 (2011)
Table 3. Mean values of soil chemical properties of the coffee by locations in Barahona (n=96).
pH 1:2
Locations
cmol(+) kg-1
EC
water
dS m
Monteada Nueva
4.79
La Ciénaga
-1
K
Na
mg kg-1
Mg
H, Al ECEC Ca/Mg Mg/K Ca+Mg/K ASP (Al) SSP (Na)
Fe
0.27
2.26
0.55 0.09 0.12
1.64
4.67
4.10
6.17
31.46
2.60
2.60
230.87
4.61
0.20
4.67
1.08 0.20 0.26
0.48
6.69
4.11
5.43
27.85
9.30
4.94
Los Patos
5.43
0.25
11.01 1.46 0.23 0.37
0.30
13.36
6.85
6.48
51.23
4.17
Platón
5.06
0.18
7.64
1.76 0.21 0.37
0.41
10.39
4.35
8.53
45.65
La Lanza
5.91
0.55
16.22 1.40 0.20 0.22
0.35
18.40
10.16
6.81
Bahoruco
4.53
0.13
2.90
0.90 0.12 0.28
0.81
5.00
2.90
Polo
7.93
0.51
35.39 3.56 0.21 0.24
0.00
39.40
Los Charquitos
7.69
0.92
43.43 2.23 0.45 0.28
0.00
Chene
6.06
0.43
26.50 2.70 0.33 0.42
El Pino
6.48
0.54
María Teresa
6.39
Los Leonardos
Mn
Cu
TN
Zn
P
%
%
131.01 17.51
5.88
23.00
3.29
0.35
768.00
73.60
6.14
13.34 40.31
5.99
0.34
3.73
485.30
55.28
5.50
3.80
24.23
7.71
0.47
3.98
3.57
182.56
82.69
3.52
4.82
11.03
9.70
0.47
82.52
5.27
1.60
165.87
32.55
9.52
3.56
20.14
4.68
0.52
7.64
30.98
20.40
6.65
435.09
52.03
3.91
3.16
13.49
5.24
0.28
11.17
17.25
194.44
0.00
0.61
10.01
1.20
1.33
1.11
15.00
4.84
0.34
46.39
20.24
5.54
113.68
0.00
0.60
7.42
6.20
13.23
3.84
6.38
9.52
0.73
0.10
30.05
10.50
8.20
84.78
0.57
1.73
132.60
92.36
4.66
8.09
14.41 10.85 0.70
32.17 2.94 0.39 0.37
0.00
35.87
11.50
7.96
91.66
0.00
1.14
41.64
49.67
2.59
3.68
4.70
10.24 0.74
0.48
24.74 2.43 0.39 0.48
0.00
28.03
10.19
6.65
75.84
0.00
1.84
176.36
44.88
4.63
5.32
7.30
8.87
0.54
6.61
0.50
32.07 3.03 0.27 0.45
0.08
35.90
11.91
12.30
139.03
0.38
1.62
291.38
7.15
5.94
2.80
12.78
7.02
0.52
Bretón
7.11
0.83
35.98 3.04 0.39 0.28
0.00
39.69
13.22
8.21
109.04
0.00
1.05
10.48
7.60
6.17
2.16
13.80
6.80
0.68
Santa Elena
6.73
0.62
40.29 2.34 0.26 0.27
0.00
43.17
16.88
8.71
157.31
0.00
1.03
239.24
28.05
2.75
3.63
4.60
7.44
0.63
La Guázara
6.77
0.57
37.37 2.48 0.32 0.27
0.00
40.45
14.92
7.99
121.23
0.00
0.76
51.15
35.01
2.56
4.88
4.51
8.81
0.66
EC, electrical conductivity; ECEC, effective cation exchange capacity; Ca, calcium; magnesium, Mg; K, potassium; Na, sodium; EA, exchangeable acidity; ASP,
aluminum saturation percentage; SSP, sodium saturation percentage; Fe, iron; Mn, manganese; Cu, copper; Zn, zinc; P, phosphorus; OM, organic matter; TN,
total nitrogen.
J. Soil Sci. Plant Nutr. 11 (1): 127 - 140 (2011)
133
Ca
OM
Diagnosis of soil fertility coffee, Nuñez et al.
range from 0.6 to 6.65 % and 0.38 to 20
%, respectively. We expect that these Na
and Al saturation indices are not limiting
coffee production in the farms.
Soil fertility diagnosis of coffee farms
The first two principal components
account for 76% of the total variance
(Table 4). The first component has the
higher explanatory power of the data. In
this component, positive values for soil
pH, EC, exchangeable bases, ECEC,
Ca/Mg, Mg/K, OM and total N (group 1)
are observed more or less in similar
proportions; other variables such as Na
saturation percentage, Al saturation
percentage, Fe, Mn, Zn and P are grouped
in opposing areas of the former group.
There is a high correlation between the
components and variables, which assures
the representativeness of the variables.
The magnitude of the values is associated
with desirable and un-desirable soil
characteristics. As these properties are
linked to the concept of nutrient
availability, high values in the variables
of the first group are linked to adequate
soil fertility. The second component
explains 14.0% of the total variability. If
this component is associated with the
first, it may indicate that the soils have
adequate
acidity,
Na
saturation
percentage, Al saturation percentage and
Cu and a few have problems of acidity or
salinity (Table 4).
The analysis discriminates two
different site-categories as opposite
positions (Figure 1). On the left figure
shows, related to CP1, sites with content
items associated with soil salinity and
acidity levels, including Monteada Nueva,
La Lanza, Bahoruco, La Cienega, Los
Patos and Platón. Items associated with
fertility rates differ on the right vertical
axis given by CP1, which relate to
locations such as Breton, Los Charquitos,
Maria Teresa, El Pino, Santa Elena,
Chene and Las Guázaras. In the upper
quadrants, with respect to CP2, there are
areas with the highest correlation
elements to this component and lower
quadrants elements with negative
relationship.
In the cluster analysis, the locations El
Pino, Chene, Maria Teresa, Los
Leonardos, Bretón, Santa Elena and Las
Guázaras are grouped together (Figure 2).
This differentiation is shown with a dotted
vertical line drawn from a value
representing 50% of the maximum
average euclidean distance (DEPmax),
according with Indeángelo et al. (2007).
The locations Las Lanzas, Polo and Los
Charquitos are grouped as sites having a
soil pH pattern that is different than the
other localities, forming the classes A, C
and D, respectively. Los Patos, Platón,
Monteada Nueva, La Ciénaga and
Bahoruco are located in class B and are
characterized as having a moderately to
strongly acid soil pH.
Soil
test
interpretation
management recommendations
and
The sites were segregated into five groups
based on chemical properties: class A (La
Lanza), class B (Los Patos, Platon,
Monteada Nueva, La Cienaga and
Bahoruco), class C, (Polo), class D (Los
Charquitos) and class E (El Pino, Chene,
Maria Teresa, Los Leonardos, Bretón,
Santa Elena and Las Guázaras).
Soils from La Lanza (class A) had near
favourable pH and OM, and adequate Ca
availability. The main soil fertility
constraint in these soils is low K and Mg
availability as these are below suggested
critical levels. Because the exchangeable
Ca availability is very high in relation to
Mg and K availability, as evidenced by
Ca/Mg and Ca+Mg/K ratios. The soils
may benefit from the addition of fertilizer
containing moderate Mg and K
concentrations. The soils had adequate P
134
J. Soil Sci. Plant Nutr. 11 (1): 127 - 140 (2011)
Table 4. Eigenvalues and proportion of explained variance calculated from the
correlation matrix.
Proportion of explained variance
Components (λ)
Eigenvalue
Absolute
Cumulative
1
12.33
0.62
0.62
2
2.82
0.14
0.76
3
1.68
0.08
0.84
4
1.23
0.06
0.90
5
0.73
0.04
0.94
6
0.51
0.03
0.96
7
0.27
0.01
0.98
8
0.18
0.01
0.99
9
0.12
0.01
0.99
10
0.09
4.7E-03
1.00
11
0.03
1.3E-03
1.00
12
0.01
4.7E-04
1.00
13
0.01
3.5E-04
1.00
14
0.00
0.00
1.00
15
0.00
0.00
1.00
16
0.00
0.00
1.00
17
0.00
0.00
1.00
18
0.00
0.00
1.00
19
0.00
0.00
1.00
20
0.00
0.00
1.00
21
0.00
0.00
1.00
and micronutrient availability, thus
supplementation with these may not be
needed.
Soils from class B, were generally
acid, with adequate soil OM and total N
contents. Coffee orchards in soils from
Monteada Nueva, La Cienaga, and Los
Patos may not need repeated P
applications, yet P deficiency may be
encountered in soils from Platón and
Bahoruco. These soils are adequately
balanced in terms of exchangeable basic
cations, but may need to be supplemented
with K and Mg. Monteada Nueva, La
Cienaga and Bahoruco locations have low
soil pH with values of 4.79, 4.51 and
4.53, respectively, and is in accord with
observations by Almonte (2008), for some
135
Diagnosis of soil fertility coffee, Nuñez et al.
7.00
Cu
Monteada Nueva
3.50
CP2 (14.1 %)
CP 2 (14.1%)
La Lanza
K
Bahoruco
La Cienaga
Ca/Mg
pH 1:2 Breton
Ca
CICE
Ca+Mg/K
Santa Elena
N-totalLa
Guazara
CaCO3
PMn
0.00
0.00
Los Charquitos
C.E.
PSAl
H, Al
El Pino
María Teresa
Mg
Mg/K
Los Patos
Zn
PS-Na
Fe
Platon
MO
-3.50
-7.00
-7.00
Na
-3.50
0.00
3.50
7.00
CP 1 (61.7%)
Biplotlocations
variable points
points
Biplot
Biplotvariable
locations
points
Biplot
points
CP1= Principal Component 1, CP2= Principal Component 2
Figure 1. Distribution of variables in relation to the main components.
coffee production of soils of Barahona.
These soils may require moderate lime (2
- 3 ton/ha) applications on a yearly basis.
The soils of the above-mentioned
locations are continually subjected to
intensive processes of weathering due to
steep slopes and rainfall greater than 2000
mm. Thus special soil conservation
practices need to be included in future
plantings and/or coffee tree replacement
programs.
Soils from Polo and Los Charquitos
localities were grouped together as a class
C and D, respectively. These groups had
similar soil fertility characteristics, yet
differed in the sense that Los Charquitos
had higher soil OM and total N contents.
Soil test P was in the medium category.
The main soil fertility constraint in these
soils appeared to be the high soil pH
which may influence micronutrient
availability. In fact these two groups of
136
J. Soil Sci. Plant Nutr. 11 (1): 127 - 140 (2011)
Euclidean distance
La Lanza
Los Patos
Platon
Monteada Nueva
La Cienaga
Bahoruco
Polo
Los Charquitos
El Pino
Chene
María Teresa
Los Leonardos
Breton
Santa Elena
La Guazara
0.00
1.37
2.74
4.10
5.47
Figure 2. Distribution of the coffee communities of Barahona in relation to the groups
formed by cluster analysis.
soils were the ones (along with Breton)
that had low soil Fe, Mn, and Zn
availability. Although, exchangeable Ca
was high, Mg and K were at or above
sufficiency levels in Los Charquitos, so
that Mg and K are not expected to be
limiting crop production. Soils from Polo
may need supplementation with K.
Fertilizer recommendations for these
groups of soils should include
formulations having moderate P, K, and
Mg concentrations, and should contain
special blends of micronutrients. Nutrient
management in these soils should
consider
sources
that
have the
potential to increase soil acidity such as
organic residue application, fresh
manures,
and
ammonium-based
fertilizers.
El Pino, Chene, Maria Teresa, Los
Leonardos, Breton, Santa Elena and La
Guázara localities are grouped together as
class E. These soils had pH values near
the upper limit of the desirable range
(mean of 6.59). Breton locations soils are
the exception having a mean soil pH 7.11.
In soils of this class, exchangeable Ca and
Ca/Mg ratios are outside the upper limit
of the target range (> 5 and 2-10,
respectively), so there may be an
antagonistic effect between Ca and Mg,
which could be limiting Mg utilization.
The application of Mg should be
considered in these soils either as
individual fertilizer Mg sources or with
complete formulations. The soils from all
locations had favorable soil OM content
and total N content. Coffe growing in all
locations is expected to respond to P
application originating from fertilizer or
organic residue sources. Soils in these
locations should not be limited, fertilizer
application should not contain or contain
minimum amounts of Ca, and may benefit
from having moderate Mg and K
concentrations.
137
Diagnosis of soil fertility coffee, Nuñez et al.
The main constraints to coffee production
in the Barahona province are low soil pH
and N availability. Soils with pH below
5.5 should be limed to reduce the
potential of Mn and Al toxicicity,
improve base saturation, and ECEC. The
application of lime can be used to provide
both Ca and improve soil pH in acid soils.
In areas were soil reaction does not need
to be correcterd but Ca supplementation is
needed, gypsum (CaSO4•xH2O) can be
used. Coffee cultivated soils in the
province of Barahona are not considered
saline, so it is expected that coffee yields
are not influenced by this condition
(Montico, 2006).
Most of the areas sampled had
relatively high accumulation of plant
material as mulch on the soil surface. As
the material decomposes it becomes part
of the soil OM, and most of the soils from
all locations had high soil OM contents.
In-spite of this fact, it is not expcted for
the organic matter to supply sufficient
nutrients (especially N) to sustain high
yields, due to the lack of synchronization
in N mineralization and plant uptake, and
the large amounts of N that are needed by
coffee to sustain high yields. Since since
total N is not a reliable indicator of N
availability, N management practices
should be based on expected yields and
site-specific
empirical
assessments
between fertilizer N application and
economic crop response. Research in
Puerto Rico has shown that yields of
about 1,500 kg/ha of coffee can be
obtained with 200 kg N/ha/ yr in years of
good rainfall, and application of 300 kg
N/ha/yr can maintain production of 3,000
kg ha-1 year of coffee (Abruña et al.,
1959; Abruña et al., 1965; VicenteChandler et al., 1968). These fertilizer N
recommendations need to be evaluated
based on current N fertilizer prices and
on-farm bean selling price.
Soil fertility depends on many factors,
among them the soil OM, because it
138
contributes to an increase in soil CEC
which can serve to retain and increase the
reserve of soil cations, improves soil
structure physics and soil water relations
(Torres et al., 2006). Soils with higher
OM content are associated with increased
population
and
diversity
of
microorganisms (Brechelt, 2008). A
practice that is beneficial to increase
levels of soil OM is the management of
shade trees by pruning. Although some
shade trees provide additional income by
harvesting fruit, N-fixing species are
those that will be most beneficial for
increasing soil OM (Marques et al.,
2003). The selection of the shade tree and
the management of it are important
factors to consider in the establishment of
sustainable coffee production of high
yields. Montenegro (2005) reported that
the association of inga (Inga vera) and
poppy (Erythina poeppigiana) are very
favorable for nitrogen fixation in the
coffee. The application of compost and
planting of vegetatative cover are other
alternatives to improve the supply of OM.
Although Perez et al. (2008), highlights
the difficulty of balancing a program
based solely on organic amendments
because the inability to match crop uptake
to nutrient supply. Organic amendments
have other positive soil functions such as
improving nutrient use efficiency and in
improving water availability Marques et
al. (2003).
CONCLUSIONS
Duicela (2002) has shown that knowledge
of the soil physical and chemical
characteristics under coffee production
can be used to identify potential
production
areas,
facilitates
the
interpretation of the nutritional status of
the crop and can be used to make specific
recommendations
about
nutrition
J. Soil Sci. Plant Nutr. 11 (1): 127 - 140 (2011)
management of coffee. We determined a
minimum set of soil variables that are
used as indicators of soil fertility. The
minimum set of indicators represent those
that should be taken into account in
management plans coffee nutrition. A
PCA permited the selection of variables
and the grouping of locations into five
class
coffee soil to facilitate
differentiated from managing crop
nutrition. This allowed for making broad
infererences as to the potential soil
fertility problems as well as general
recommendations.
This
process
contributes to the sustainability of the
coffee industry in the province of
Barahona and improving the productivity
of coffee farms.
ACKNOWLEDGMENTS
We acknowledge the technical staff of the
Dominican Coffee Council (Barahona,
Pedernales, Bahoruco and Independence),
the Spanish International Cooperation
Agency for financing the study through
project PROTESUR, Also, a staff of
IDIAF-PROTESUR with a presence in
Palo Alto Experimental Station South
Center IDIAF for your contributions.
Almonte, I. 2008. Caracterización físico
químicas de los suelos de las principales zonas
cafetaleras de la República Dominicana. Instituto
Dominicano de Investigaciones Agropecuarias y
Forestales IDIAF y Consejo Dominicano del
café. Foro Caf., 4 (1). Abril - septiembre 2008.
Santo Domingo, República Dominicana. 42 p.
Almonte, I., Batista, I., Jiménez, H., Céspedes,
C., Escarramán, A., Núñez, P. 2010. Efectos de
la fertilización química sobre el rendimiento y la
calidad del café. Foro caf. 6, 29-32.
Avelino, J., Perriot, J., Guyot, B., Pineda, C.,
Decazy, F., Cilas, C. 2002. Identifying terroir
coffees in Honduras. Plantations, Recherche,
Developpement. pp: 6-16.
Brechelt, A. 2008. Importancia de la materia
orgánica en
los
suelos.
Fundación
Agricultura y Medio Ambiente (FAMA).
Available
online
in:
http://www.rapal.org/articulos_files/organica.pdf
CODOCAFE. 2001. Consejo Dominicano del
Café. Censo Nacional Cafetalero. República
Dominicana.
CODOCAFE. 2002. Boletín estadístico Consejo
Dominicano del Café (CODOCAFE). No. V.
Santo Domingo, República Dominicana.
CODOCAFE. 2010. Consejo Dominicano del
Café. Evolución reciente de la caficultura
dominicana. Foro Caf. 6, 15 p.
CENICAFE. 1999. Fertilización. Almacigo.
CENICAFE (Centro Nacional de Investigaciones
del
Café).
Available
online
in:
http://www.cenicafe.org
Duicela, L. 2002. Caracterización Edafológica
de las Zonas de Producción de Café arábico,
Ecuador.
REFERENCES
Abruña, F., Vicente-Chandler, J., Silva, S.
1959. The effects of different fertility levels
on yields of intensively managed coffee in
Puerto Rico. J. Agric. Univ. P.R. 43, 141146.
Abruña, F., Vicente-Chandler, J., Becerra,
L.A., Bosque-Lugo R. 1965. Effects of liming
and
fertilization
on yields and foliar
composition of high-yielding sun-grown coffee
in Puerto Rico. J. Agric. Univ. P.R. 49, 413428.
Escarramán, A., Romero, J.M., Almonte, I.,
Ribeyre, F. Aguilar, P., Jimenez, H., Causse,
A., Olivares, F., Ceballos, F. 2008. Atributos de
la calidad del café en zonas productoras de la
República Dominicana. Instituto Dominicano de
Investigaciones Agropecuarias y Forestales
(IDIAF) y Consejo Dominicano del Café
(DODOCAFE), Santo Domingo, DO. 92 p.
Hergoualc’h, K., Skiba, U., Harmand, J.,
Henault, C. 2008. Fluxes of greenhouse gases
from andosols under cofee monoculture or shaed
by Inga densiflora in Costa Rica. Bioeochemistry
89, 329-345.
139
Diagnosis of soil fertility coffee, Nuñez et al.
InfoStat. 2008. Manual del usuario. Grupo
InfoStat, FCA, versión 2004. Universidad
Nacional de Córdoba. Editorial Brujas,
Argentina.
Indeángelo, N., Wilson, M.G., Tasi, H.A.A.
2007. Indicadores de calidad para dos suelos con
características vérticas de Entre Ríos (Argentina).
Cad. Lab. Xeol. Laxe. Cor. 32, 111-125.
Marques, M.S., Sá, N.M., Scott, M.R. 2003.
Descomposición, dinámica de los elementos
inorgánicos y colonización por microrganismos
de hojas de araribá (Centrolobium tomentosum
Guill. ex Benth) en latosoles del bosque Atlántico
brasileño. Agric. Téc. 63, 59 - 68.
Martínez, N. 2010. Diagnóstico de la fertilidad
de los suelos cafetaleros y recomendaciones de
manejo en la provincia Barahona. Tesis para
optar por el título de: Maestría en Ecología y
Medio Ambiente. Universidad Nacional Pedro
Henríquez Ureña. Asesor Pedro Núñez y co
asesores Ángel Pimentel e Isidro Almonte.
República Dominicana, Santo Domingo. 127 p.
Núñez, P., Cuevas, B. 2004. Especies arbóreas
de valor comercial y cultivos alimenticios
presentes en cafetales de las provincias Monseñor
Novel y La Vega. Agroforestería. Res. Invest.
Idiaf. 1, 1-27.
Page, A.L., Miller, R.H., Keeney, D.R.
(Eds). 1982. Method of Soil Analysis, Part 2,
Chemical and Microbiological Properties.
Second
Edition. American Society of
Agronomy, Soil Science. Society of America,
Madison.
Pérez, A. 2002. Validación de la Efectividad y
Eficiencia de la Repela, Pepena y Graniteo en el
Control de la Broca (Hypothenemus hampei
Ferrari). Instituto Dominicano de Investigaciones
Agropecuarias y Forestales (IDIAF), Barahona,
República Dominicana.
Pérez, A. Cespedes, C., Núñez, P. 2008.
Caracterización física-química y biológica de
enmiendas orgánicas aplicadas en la producción
de cultivos en República Dominicana. R.C. Suelo
Nutr. Veg. 8, 10-29.
Montenegro, G.E.J. 2005. Efecto del aporte de
nutrientes de la biomasa de tres tipos de árboles
de sombra en sistemas de manejo de café
orgánico y convencional. Tesis Mag. Sc. CATIE,
Turrialba, Costa Rica. 67 p.
Torres, D., Rodríguez, N., Yendis, H.,
Florentino A., Zamora, F. 2006. Cambios en
algunas propiedades químicas del suelo según el
uso de la tierra en el sector el cebollal, Estado
Falcón, Venezuela. Bioagro 18, 123-128.
Montico, S. 2006. Manejo de situaciones con
suelos salinos y alcalinos. Cátedra Manejo de
Tierras, Facultad de Ciencias Agrarias, U.N. de
Rosario. En línea http://www.produccionanimal.com.ar/suelos_ganaderos/54-salinos_ y_
alcalinos.pdf
Vicente-Chandler, J., Abruña, F., Bosque
Lugo, R. and Silva, S. 1968. Intensive
coffee culture in Puerto Rico.
Boletín
#211. Universidad
de
Puerto
Rico,
Mayagüez, Estación
Experimental Agrícola.
4 p.
140