1
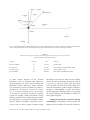
Spatial and temporal characterization of fish assemblages
in a tropical coastal system influenced by freshwater inputs:
northwestern Yucatan peninsula
Daniel Arceo-Carranza & Ma. Eugenia Vega-Cendejas
CINVESTAV-IPN, Unidad Mérida, Km. 6 Antig. Carr. a Progreso, A. P. 73 Cordemex, C.P. 97310 Mérida, Yucatán,
México; [email protected]; [email protected]
Received 06-vii-2007.
Corrected 10-vii-2008.
Accepted 14-viii-2008.
Abstract: Coastal lagoons are important systems for freshwater, estuarine and marine organisms; they are considered important zones of reproduction, nursery and feeding for many fish species. The present study investigates the fish assemblages of the natural reserve of Dzilam and their relationship with the hydrologic variables.
A total of 6 474 individuals (81 species) were collected, contributing with more than 50% considering the
Importance Value Index (IVI), Sphoeroides testudineus, Fundulus persimilis, Anchoa mitchilli, Eucinostomus
gula, Eucinostomus argenteus and Mugil trichodon. Differences in species composition were found between
seasons the highest during the cold fronts. Spatially, differences were related with the presence of freshwater
seeps, the highest in the ecological characterized eastern part and the lowest with higher difference in specific
composition located in the western part of the internal zone, due to a higher abundance and dominance of L.
rhomboides. Salinity and temperature were the variables that presented a higher influence in the distribution of
some pelagic species such as A. mitchilli and A. hepsetus. Because of the abundant freshwater seeps characteristic of the coastal lagoons of Yucatan Peninsula their community structure and fish assemblage display spatial
and temporal differences in specific composition. Rev. Biol. Trop. 57 (1-2): 89-103. Epub 2009 June 30.
Key words: Ichthyofauna, species composition, temporal variation, freshwater inputs, environmental variables,
Bocas de Dzilam.
Coastal lagoons and estuaries are environments featured by being transitional places
between land and marine habitats, as well as
dynamic systems with highly environmental
variability in short and long term. So that,
their biological communities are influenced
mainly by physical environment (Kupschus
and Tremain 2001), and their structure, diversity and stability are defined by biologic interactions (intra and interspecific) (Francis et al.
2002). Within these ecosystems, fish constitute the main biological component of marine
and estuarine species using them as feeding,
reproduction, growth and protection grounds
(Raz-Guzmán and Huidobro 2002), in terms
of their tolerance limits to those hydrologic
conditions (Whitfield 1999). Variables affecting their distribution in estuarine waters are
salinity, temperature, turbidity, and dissolved
oxygen, though sediment type heterogeneity
and vegetation, also influence the availability of nutritional resources and the protection
against predators (Blaber and Blaber 1980,
Marchand 1993, Blaber 1997, Marshall and
Elliot 1998). Estuarine fish assemblages show
cyclical variations in abundance and composition, and since they include species of fresh
and marine waters, they can show sedentary or
migratory behaviors and be present in diverse
stages of their development (Simier et al. 2004)
as well as seasonal changes in their habitat
types, because of coastal processes.
Rev. Biol. Trop. (Int. J. Trop. Biol. ISSN-0034-7744) Vol. 57 (1-2): 89-103, March-June 2009
89
Few studies have been realized in Yucatan
Peninsula and specifically the ichthyofauna
community in “Bocas de Dzilam” Reserve has
not been assessed (Vega-Cendejas et al. 1993,
Vega-Cendejas et al. 1994, Vega-Cendejas et
al. 220). Because of its reserve status and to
its ecological importance for estuarine ichthyofauna, this research aims to investigate fish
assemblages distribution related to climatic
season and some hydrologic variables.
Study area. “Bocas de Dzilam” lagoon
declared a protected natural area since 1989
(Zone of Ecological Conservation, Reserve of
Dzilam), is located in Southeastern Mexico in
the central coast of Yucatan State (21° 19’ - 21°
32’ N, 88° 35’ - 88° 58’ W) with a surface of
9.4 km2, 12.9 km long, a maximum width of
1.65 km with a permanent connection with
the sea (375 m wide), bordered by mangrove,
and depth 1 - 2.5m, with 80% of the bottom
covered by macrophytes, dominated mainly
by Halodule wrightii and Ruppia maritima
(Herrera-Silveira et al. 1998, Medina-Gómez
and Herrera-Silveira 2003). It is featured by
the presence of subterranean flows and springs
giving it a special nature by the presence of
ecotones regulated by fresh and salty water.
MATERIALS AND METHODS
Six bimonthly samplings including fish
and physical variables were performed from
May 2003 to March 2004 during climate seasons of rain (July -September), northern cold
fronts “norths” (November - January) and dry
(May - March) along 8 stations distributed in
different environments. Fish sampling was
realized with a beach seine (15 m x 1.5 m; 2.5
cm mesh size), hauls by duplication covering
an average area of 240 m2. Prior collection,
physicochemical variables were measured in
situ (temperature, salinity and dissolved oxygen) using a Yellow Springs Instrument (model
85). Fish were preserved in 10% formalin,
identified, counted, and measured for standard
length to the nearest mm.
90
Data Analysis: Spatial and temporal
differences in salinity, temperature and dissolved oxygen, were subjected to different
variance analysis of two ways variance analysis (ANOVA), normality and homogeneity
standards of variances were double-checked
by Kolgomorov-Smirnov and Bartlett tests,
respectively. Density and biomass were determined as the number and weight of organisms per unit area (ind/m2, g/m2), extrapolated
to 10m2. Spatial and temporal differences in
density and biomass were determined by two
ways analysis of variance after transforming
data to log (x+1) and verifying homocedasticity. For this last analysis, extremely abundant
species were eliminated (Clarke and Warwick
2001, Tsou and Matheson 2002). Community
structure was analyzed through richness (S),
evenness (J) and diversity of species (H’) using
Shannon-Wiener index. Dominance implying
hierarchical structuring and evaluation of relative specie importance, was carried out in each
zone and on annual basis with Index of Value of
Importance (IVI), which incorporates information about density (DR), frequency (FR) and
relative biomass (BR) for each species (IVI =
DR + FR + BR) (Brower and Zar 1977).
Spatial and temporal changes in assemblage ecological parameters were performed
with statistical program PRIMER 5, Plymouth
Routines in Multivariate Ecological Research
(Clarke and Gorley 2001). Fish assemblage
differences among sites and/or climatic seasons
were tested by Similarity analysis (ANOSIM)
non-parametric test that applies the Bray Curtis
similarity matrix (Clarke and Green 1988).
Species contribution by climate season or
sampling station was evaluated with similarity
percentage (SIMPER) test, which determines
percentage contribution of each species in order
to classify a group (similarity) and discriminate species among sample groups (dissimilarity) (Clarke and Green 1988). Redundancy
Analysis (RDA) was used to evaluate the interrelation among media densities and environmental parameters. This multi-varied analysis
and IVI were performed with the statistical program ANACOM (De la Cruz 1994). Spearman
Rev. Biol. Trop. (Int. J. Trop. Biol. ISSN-0034-7744) Vol. 57 (1-2): 89-103, March-June 2009
with a total weight of 64 kg. Best represented
families by number of species were Gerreidae
(4 genus and 7 species), Carangidae (4 genus
and 5 species), Sciaenidae (3 genus and 5 species), Engraulidae (1 genus and 5 species) and
Syngnathidae (1 genus and 5 species). The
most abundant species being Anchoa mitchilli,
Fundulus persimilis, A. hepsetus, Eucinostomus
gula, E. argenteus and Sphoeroides testudineus,
while S. testudineus, F. persimilis and Mugil
trichodon contributed with 56.6% of total
weigh. Results of two-way ANOVA (P>0.05)
indicated not differences in density and biomass among climate seasons and sampling
sites (Table 1). Considering both ecological
parameters and their occurrence frequency 12
species contributed with more than 70%, with
S. testudineus (14.2) being the most representative (Fig. 2).
Diversity (H’), evenness and species richness did not vary significantly (P>0.05) among
neither climate seasons nor sampling sites (Fig.
3). Spatially, average diversity was 2.40 ±0.69
bits/ind, with maximum values recorded in site
5 (2.9 bits/ind) and minimum in site 1 (1.75
bits/ind). In the inlet of the lagoon (site 8) the
correlation coefficient was used to determine
the significance of each variable to fish distribution (Zar 1984). Species ecological classification was performed separating fish in
marine-euryhaline, marine-stenohaline and
estuarine residents species based on their relative abundance at each climate season (Castro
Aguirre et al. 1999, Froese and Pauly 2004)
RESULTS
Hydrologic variables: Temperature was
significantly different among all climatic seasons (rainy and norths p = 0.00014; rainy and
dry p = 0.002261; norths and dry p = 0.00014),
with the lowest during norths (24°C) and highest in the rainy (31°C) (Fig. 1). Salinity showed
the lowest values during norths (mainly in
November) with an average of 29° C, with
the highest value (37°C) in the dry season. No
significant differences (p>0.05) were found for
dissolved oxygen (Table 1).
40
35
35
Salinity
40
30
25
20
30
25
20
15
10
10
40
40
35
35
Temp. (ºC)
15
30
25
20
15
30
25
20
15
10
10
16
14
12
10
8
6
4
2
0
20
O2 mg/l
O2 mg/l
Temp. (ºC)
Salinity
Species composition and spatial-temporal variation: A total of 6 474 fish were captured; comprising 81 species and 37 families,
15
10
5
0
1
2
3
4
5
6
7
8
Jul.
Sampling stations
Sep.
Rainy
Nov.
Jan.
Norths
Mar.
May
Dry season
Fig. 1. Salinity, temperature and oxygen variations in sampling sites (A) and bimonthly (B) (±1 STD).
Rev. Biol. Trop. (Int. J. Trop. Biol. ISSN-0034-7744) Vol. 57 (1-2): 89-103, March-June 2009
91
highest species richness was recorded (17.67)
and the lowest in site 2 (10.67). As to evenness, the highest corresponded to site 7 (0.74)
and the lowest in site 1 (0.52). On temporal
basis, higher diversity was registered during
norths (2.66 ±0.69 bits/ind), while the lowest
was during dry season (2.22 ±0.84 bits/ind).
Likewise the highest species richness happened
during norths (17.88) and the lowest during
rains (10.63), and for evenness rainy season
had the highest (0.68) and the lowest in dry
season (0.62).
TABLE 1
Results of ANOVA analysis to test significant differences
in environmental variables (temperature, dissolved
oxygen, salinity) and for some ecological parameters of
fish community (diversity, species richness, evenness),
density and biomass after their transformation log (x+1).
* Significant differences p<0.05
Variable/analysis result Spatial (n=8) Temporal (n=3)
Temperature
F
p
Dissolved oxygen
F
p
Salinity
F
p
Diversity Shannon (H)
F
p
No. species
F
p
Evenness (J)
F
p
Log Density
F
p
Log Biomass
F
p
Ecological Category: Dominating fish
with abundance higher than 70% in each
of the climate seasons were classified as
marine-euryhaline. Among these we found
A. mitchilli, A. hepsetus, E. argenteus, E.
gula, Lagodon rhomboides, Harengula jaguana, S. testudineus, and M. trichodon. Respect
to marine-stenohaline component, higher percentage was shown in norths constituted by
Opisthonema oglinum, Archosargus rhomboidalis, Haemulon bonariense, H. parrai,
Anchoa cubana, A. lamprotaenia, Trachinotus
falcatus and Sphyraena barracuda among
others, while resident estuarine species were
shown with higher incidence in dry season represented by F. persimilis, Floridichthys polyommus, Poecilia velifera, Gambusia yucatana,
*
0.1800
0.9857
81.0027
0.0000*
0.5549
0.7810
0.6717
0.5214
0.8660
0.5526
4.7104
0.0204*
0.6190
0.7330
0.8737
0.4320
0.4170
0.8777
3.3861
0.0531
0.7337
0.6470
0.3603
0.7016
1.9433
0.0750
0.5220
0.5955
2.1177
0.0523
1.4126
0.2501
P<0.05.
A. rhomboidalis
S. notata
A. hepsetus
F. polyommus
L. rhomboides
H. jaguana
M. trichodon
E. argenteus
E. gula
A. mitchilli
F. persimilis
S. testudineus
0
2
4
6
8
10
12
14
16
Importance Value index (%)
Fig. 2. Dominant fish species collected in “Bocas de Dzilam” lagoon during the study period, ranked by the Importance
Value measure.
92
Rev. Biol. Trop. (Int. J. Trop. Biol. ISSN-0034-7744) Vol. 57 (1-2): 89-103, March-June 2009
3.6
3.8
Bits/ind
Diversity (H)
3.4
3.2
3.0
2.8
2.6
2.2
2.4
1.6
2.0
1.4
1.6
1.0
1.2
0.6
28
No. species
30
24
24
20
18
16
12
12
# Eyenness (J)
6
8
0
4
0.95
0.95
0.85
0.85
0.75
0.75
0.65
0.65
0.55
0.55
0.45
0.45
0.35
0.35
0.25
0.25
1
2
3
4
5
6
7 8
Jul.
Sampling stations
Sep.
Rainy
Nov.
Jan.
Mar.
May
Norths Dry season
Fig. 3. Diversity index, total number of species and evenness of the sampling stations and season variation.
Cichlasoma urophthalmus, Lucania parva,
Cyprinodon artifrons and Garmanella pulchra
(Fig. 4, Table 2).
Spatial and temporal differences among
assemblages: ANOSIM indicated significant
differences in fish assemblage composition on
the climate season (R = 0.292, p<0.05) and spatial (R = 0.335, p<0.001) among sites 1-4, 1-6,
1-7, 1-8, 5-7 and 6-8 (Table 3). Total significant
dissimilarity among sampling sites shows a
range between 83.09% and 93.62% (Table 4).
These differences are caused by abundance
among dominating species in each sampling
site, being L. rhomboides, E. argenteus, E.
gula, S. testudineus, H. jaguana, F. persimilis,
F. polyommus, A. mitchilli, M. trichodon and H.
parrai contributing with more than 50% to the
spatial dissimilarity. Among climate seasons
there is a total range of dissimilarity between
78.62% and 83.99% with more than 50% by E.
argenteus, E. gula, S. testudineus, F. polyommus, M. trichodon, L. rhomboides, H. jaguana,
and F. persimilis (Table 4).
According to statistical test SIMPER, station 1 is characterized by L. rhomboides, which
was found in 58.40% as well as other species
such as S. testudineus, E. gula and E. argenteus
which showed important percentages in the
specific characterization of the sampling sites.
There are stations where dominancy is shared
and characterization is determined by many
species that represent percentages lower than
30%, such as sites 4, 7 and 8. Total similarity
for each sampling site throughout time was
from 5% (site 7) to 44% (site 2) showing the
similarity degree of each site among different seasons. Temporally species common for
rainy season were E. gula, E. argenteus, S.
testudineus and M. trichodon with more than
Rev. Biol. Trop. (Int. J. Trop. Biol. ISSN-0034-7744) Vol. 57 (1-2): 89-103, March-June 2009
93
120
100
Estuarine
Percentage
80
S. marine
60
40
20
E. marine
0
Rains
Norths
Dry season
Fig. 4. Temporal distribution of ecological categories of the “Bocas de Dzilam” fish assemblages.
60%, furthermore norths are characterized by
E. gula, E. argenteus, S. testudineus and F.
polyommus, while dry season shows 8 species (E. argenteus, E. gula, S. testudineus,
M. trichodon, L. rhomboides, H. jaguana, H.
bonariense and A. lineatus) that contributed
with more than 85%.
Considering abundance and species composition, sampling sites are conformed by three
main groups. The first one includes sites 7 and
8, located in the external zone of the lagoon
(marine zone) and characterized by the highest salinity value (35-38), species richness and
evenness. In the second group, the site located
in the inner zone (No.1) forms an independent
entity with the lowest salinity record and the
species richness and diversity because of the
dominance of L. rhomboides. Finally, the third
group is conformed by sites located in the
center of the lagoon (2 - 6) (Fig. 5).
Relation between species and hydrologic variables: Species that showed a positive
correlation (Spearman, p<0.05) with salinity were Cynoscion arenarius, A. hepsetus, T.
falcatus, Oligoplites saurus, H. jaguana, O.
oglinum and Ariopsis felis, while Bairdiella
chrysoura preferred oligohaline waters. In
TABLE 2
Relative abundance (%N) and biomass (%W), ecological category (E.C.) and seasonal occurrence (S.O.)
of fish species registered in Dzilam lagoon, Yucatan
Species
Family
%N
% W.
E. C.
S.O.
Anchoa mitchilli
Engraulidae
18.71
1.48
E. mar
ND
Fundulus persimilis
Fundulidae
18.18
20.77
Estuar
D
Anchoa hepsetus
Engraulidae
8.80
0.37
E. mar
N
Eucinostomus gula
Gerreidae
8.18
3.31
E. mar
R N D
Eucinostomus argenteus
Gerreidae
8.11
2.54
E. mar
R N D
Sphoeroides testudineus
Tetraodontidae
6.03
30.42
E. mar
R N D
Harengula jaguana
Clupeidae
5.67
4.11
E. mar
R N D
Floridichthys polyommus
Cyprinodontidae
4.73
1.28
Estuar
R N D
94
Rev. Biol. Trop. (Int. J. Trop. Biol. ISSN-0034-7744) Vol. 57 (1-2): 89-103, March-June 2009
TABLE 2 (Continued)
Relative abundance (%N) and biomass (%W), ecological category (E.C.) and seasonal occurrence (S.O.)
of fish species registered in Dzilam lagoon, Yucatan
Species
Family
%N
% W.
E. C.
S.O.
Lagodon rhomboides
Sparidae
4.13
2.68
E. mar
R N D
Mugil trichodon
Mugilidae
3.02
5.39
E. mar
R N D
Opisthonema oglinum
Clupeidae
1.42
0.15
S. mar
N
Haemulon bonariense
Haemulidae
1.36
2.43
S. mar
R N D
Archosargus rhomboidalis
Sparidae
1.28
2.68
S. mar
R N D
Poecilia velifera
Poeciliidae
1.16
0.09
Estuar
N D
Strongylura notata
Belonidae
1.05
4.87
E. mar
R N D
Selene vomer
Carangidae
0.71
1.84
E. mar
N D
Achirus lineatus
Achiridae
0.61
0.19
E. mar
R N D
Haemulon parra
Haemulidae
0.60
0.43
S. mar
R N
Sphoeroides nephelus
Tetraodontidae
0.43
0.43
E. mar
N D
Anchoa cubana
Engraulidae
0.43
0.02
S. mar
N
Lutjanus griseus
Lutjanidae
0.39
0.71
E. mar
R N D
Ariopsis felis
Ariidae
0.39
2.53
E. mar
R N D
Anchoa lamprotaenia
Engraulidae
0.38
0.17
S. mar
N D
Mugil curema
Mugilidae
0.37
0.21
E. mar
R N D
Gambusia yucatana
Poeciliidae
0.30
0.007
Estuar
N D
Opsanus beta
Batrachoididae
0.26
0.24
E. mar
N D
Orthopristis chrysoptera
Haemulidae
0.25
0.91
E. mar
R N D
Strongylura timucu
Belonidae
0.21
0.87
E. mar
Ll D
Synodus foetens
Synodontidae
0.21
0.37
E. mar
R N D
Trachinotus falcatus
Carangidae
0.20
1.10
S. mar
R N D
“Cichlasoma” urophthalmus
Cichlidae
0.20
1.79
Estuar
N D
Elops saurus
Elopidae
0.17
0.55
E. mar
R N
Oligoplites saurus
Carangidae
0.10
0.08
E. mar
R N
Cynoscion arenarius
Sciaenidae
0.08
0.04
E. mar
N
Cynoscion nebulosus
Sciaenidae
0.08
0.21
E. mar
R N D
Lucania parva
Fundulidae
0.08
0.001
Estuar
N D
Paralichthys albigutta
Paralichthyidae
0.08
0.03
E. mar
R D
Scorpaena brasiliensis
Scorpaenidae
0.07
0.02
E. mar
N
Prionotus tribulus
Triglidae
0.07
0.05
E. mar
N D
Sphyraena barracuda
Sphyraenidae
0.07
1.39
S. mar
R N D
Menticirrhus saxatilis
Sciaenidae
0.07
0.07
E. mar
N D
Hyporhamphus roberti
Hemiramphidae
0.06
0.01
E. mar
N
Bairdiella chrysoura
Sciaenidae
0.06
0.26
E. mar
D
Stephanolepis hispidus
Monacanthidae
0.05
0.007
S. mar
N
Chilomycterus schoepfii
Diodontidae
0.05
0.009
E. mar
N
Symphurus plagiusa
Cynoglossidae
0.05
0.02
E. mar
N D
Rev. Biol. Trop. (Int. J. Trop. Biol. ISSN-0034-7744) Vol. 57 (1-2): 89-103, March-June 2009
95
TABLE 2 (Continued)
Relative abundance (%N) and biomass (%W), ecological category (E.C.) and seasonal occurrence (S.O.)
of fish species registered in Dzilam lagoon, Yucatan
Species
Family
%N
% W.
E. C.
S.O.
Cyprinodon artifrons
Cyprinodontidae
0.05
0.001
Estuar
D
Chriodorus atherinoides
Hemiramphidae
0.05
0.09
E. mar
D
Menidia colei
Atherinopsidae
0.05
0.002
E. mar
N D
Nicholsina usta
Scaridae
0.03
0.01
S. mar
N
Gerres cinereus
Gerreidae
0.03
0.02
E. mar
N
Haemulon plumierii
Haemulidae
0.03
0.02
S. mar
N
Chaetodipterus faber
Ephippidae
0.03
0.02
E. mar
N D
Syngnathus louisianae
Syngnathidae
0.03
0.002
E. mar
N D
Dasyatis americana
Dasyatidae
0.02
1.39
E. mar
R
Anchoa lyolepis
Engraulidae
0.02
0.002
E. mar
N
Citharichtys spilopterus
Paralichtyidae
0.02
0.008
E. mar
D
Eucinostomus melanopterus
Gerreidae
0.02
0.001
E. mar
N
Syngnathus floridae
Syngnathidae
0.02
0.002
E. mar
N
Lutjanus cyanopterus
Lutjanidae
0.01
0.01
E. mar
R
Hyporhamphus meeki
Hemirramphidae
0.01
0.01
E. mar
D
Acanthostracion quadricornis
Ostraciidae
0.01
0.23
E. mar
R
Diapterus auratus
Gerreidae
0.01
0.01
E. mar
N
Eugerres plumieri
Gerreidae
0.01
0.07
E. mar
D
Gymnura micrura
Gymnuridae
0.01
0.08
S. mar
R
Bathygobius soporator
Gobiidae
0.01
0.002
E. mar
R
Ctenogobius stigmaticus
Gobiidae
0.01
0.001
E. mar
D
Garmanella pulchra
Cyprinodontidae
0.01
< 0.001
Estuar
D
Opsanus phobetron
Batrachoididae
0.01
0.12
S. mar
N
Bairdiella sanctaeluciae
Sciaenidae
0.01
0.01
S. mar
N
Syngnathus scovelli
Syngnathidae
0.01
< 0.001
E. mar
D
Carangoides ruber
Carangidae
0.01
0.007
E. mar
R
Monacanthus ciliatus
Monacanthidae
0.01
0.001
S. mar
N
Caranx latus
Carangidae
0.01
0.001
E. mar
N
Archosargus probatocephalus
Sparidae
0.01
0.004
E. mar
R
Diapterus rhombeus
Gerreidae
0.01
0.001
E. mar
N
Syngnathus pelagicus
Syngnathidae
0.01
0.001
E. mar
D
Mugil cephalus
Mugilidae
0.01
0.03
E. mar
R
Pomatomus saltatrix
Pomatomidae
0.01
0.01
S. mar
N
Urobatis jamaicensis
Urolophidae
0.01
0.39
E. mar
N
Syngnathus makaxi
Syngnathidae
0.01
< 0.001
E. mar
D
E. mar: Eurihaline marine, Estuar: Estuarine, S. mar: Stenohaline marine.
N= norths; R= rainy; D= dry season.
96
Rev. Biol. Trop. (Int. J. Trop. Biol. ISSN-0034-7744) Vol. 57 (1-2): 89-103, March-June 2009
TABLE 3
R statistic values and their significance levels for pairwise comparisons of species composition of the sites and
seasons using ANOSIM (P<0.05)
**
*
Differences inter-sites
and inter-seasons
R value
1 vs 4
0.917*
1 vs 6
1.000*
1 vs 7
0.542*
1 vs 8
0.750*
5 vs 7
0.500*
6 vs 8
0.417*
rains vs norths
0.203**
rains vs dry season
0.359*
norths vs dry season
0.344*
p<0.001
p<0.05
terms of dissolved oxygen Achirus lineatus
and Dasyatis americana showed a significant negative relation (Spearman, p>0.05).
Temperature affected significantly Symphurus
plagiusa, B. chrysoura and Sphoeroides nephelus, while A. lamprotaenia, M. trichodon
and A. felis were found in areas with higher
temperature values (Table 5).
RDA analysis indicated that salinity and
temperature were the principal hydrologic factors that influence composition and species
distribution. The first two axes explain 41.14%
of variance and correlation (0.93 and 0.56)
with A. mitchilli and A. hepsetus occurrence
greatly influenced by salinity and temperature
(Fig. 6). Some species distribution such as L.
rhomboides, F. persimilis, H. jaguana, and S.
testudineus were influenced by other variables
not measured in this research, such as substrate
type, surrounding vegetation, food availability
and even specific biological considerations.
TABLE 4
Species contributing to the dissimilarities between
sampling stations and climatic seasons based
on relative abundance
Groups
compared
Dissimilarity
Species
%
S1-S4
87.77
L. rhomboides
F. persimilis
H. jaguana
E. argenteus
18.95
17.24
10.08
9.83
S1-S6
86.03
L. rhomboides
E. argenteus
E. gula
24.63
18.56
9.80
93.62
L. rhomboides
E. gula
S. testudineus
A. rhomboidalis
29.95
11.06
8.15
6.97
90.64
L. rhomboides
E. gula
A. mitchilli
M. trichodon
H. parrai
19.89
9.11
8.75
8.10
6.21
88.14
E. argenteus
E. gula
F. polyommus
S. testudineus
15.39
14.41
11.55
10.15
83.09
E. argenteus
E. gula
A. mitchilli
M. trichodon
H. parrai
F. polyommus
15.99
10.03
8.80
7.63
6.16
6.16
78.62
E. argenteus
E. gula
S. testudineus
F. polyommus
M. trichodon
13.64
11.90
9.67
8.90
8.24
80.91
E. argenteus
E. gula
L. rhomboides
M. trichodon
14.61
14.55
11.60
9.93
83.99
S. testudineus
E. gula
F. polyommus
E. argenteus
L. rhomboides
H. jaguana
F. persimilis
10.95
8.59
8.06
8.04
6.20
5.94
5.91
S1-S7
S1-S8
S5-S7
S6-S8
Rainsnorths
Rainsdry
season
Norths
-dry
season
Rev. Biol. Trop. (Int. J. Trop. Biol. ISSN-0034-7744) Vol. 57 (1-2): 89-103, March-June 2009
97
DISCUSSION
TABLE 5
Correlation matrix of overall means of hydrologic
variables with fish species (only those species with at
least one significant correlation are shown);*p<0.05
Species
Salinity
Oxygen
Temperature
Symphurus plagiusa
-1.344
-1.458
-2.954*
Cynoscion arenarius
2.898*
0.096
0.759
Bairdiella chrysoura
-2.636*
-0.764
-2.636*
Sphoeroides nephelus
-2.214
-1.199
-2.445*
Achirus lineatus
-0.608
-2.690*
0.388
Anchoa lamprotaenia
1.837
0.515
3.167*
Anchoa hepsetus
3.167*
-0.408
1.188
Mugil trichodon
1.084
0.572
2.500*
Trachinotus falcatus
3.167*
-0.408
1.188
Oligoplites saurus
3.088*
-0.648
1.064
Harengula jaguana
3.880*
-0.699
0.848
Opisthonema oglinum
4.381*
-0.236
1.098
Ariopsis felis
2.705*
0.000
3.613*
Dasyatis americana
0.191
-2.940*
-0.894
Species composition and ecological category: Compared with previous studies and with
other coastal systems in Yucatan Peninsula and
Gulf of Mexico, fish species richness of “Bocas
de Dzilam” (81 spp.) can be considered high
(Vega- Cendejas et al. 1997, Raz-Guzmán and
Huidobro 2002, Vega-Cendejas and Hernández
2004) (Table 6). However, many of the species are represented by low densities because
they are in transit and enter to the system for
very short terms, usually only to feed themselves (Strongylura notata) or sometimes to
lay eggs (F. persimilis). According to Simier
et al. (2004) the high diversity registered can
be caused by: 1) establishment in the estuary
of many marine species due to the permanent
communication with the ocean and the presence of various freshwater seeps; and 2) heterogeneous habitats (seagrass meadows, prop
root mangroves, mudflats, underground water
flowerings) favoring colonization by different
fish species.
The ichthyofauna in “Bocas de Dzilam” is
dominated by estuarine species, characteristic
100
Dissimilarity percentage
80
60
50%
I
40
II
III
20
6
5
3
2
4
1
8
7
0
Sampling stations
Fig. 5. Dendrogram of dissimilarity of stations based on log (x+1) transformed total abundance of fish species using the
Bray Curtis index.
98
Rev. Biol. Trop. (Int. J. Trop. Biol. ISSN-0034-7744) Vol. 57 (1-2): 89-103, March-June 2009
Salinity
A. mitch
-40
Temperature
A. heps
E. argen
-38
-12
Oxygen
F. polyom
-42
-28
P. velif
E. gul
-41 -13
-51
-25
-56
O. ogli
H. jagua
-55
CI
-26
-10-23
-77
S. testud
-78
F. persim
-19
L. rhomb
C II
Fig. 6. Redundancy analyses (RDA) diagram of the overall fish abundances versus environmental variables represented by
arrows. Species abbreviations are the first letter of the genus name and first four letters of the species name.
TABLE 6
Comparative fish species number and coastal lagoon total area for some systems from
Yucatan Peninsula and Gulf of Mexico
Lagoon
No Spp
Area
81
9.4 km2
Rio Lagartos
81
km2
Celestún lagoon
94
Bocas de Dzilam
Laguna Madre
84
of other coastal lagoons of the Yucatan
Peninsula, such as mojarras and anchovies
(Vega Cendejas et al. 1997, Vega Cendejas and
Hernández 2004). Moreover, many commercial importance species (Haemulon plumierii,
Orthopristis chrysoptera, Cynoscion nebulosus, C. arenarius, Lutjanus griseus, A. mitchilli,
A. hepsetus, E. gula and E. argenteus,) used the
system for feeding, raising and shelter. Tough
salinity gradients create physiological barriers
for most species, it has been found that seasonally, the marine euryhaline component, like S.
notata enter to these coastal systems taking
80
28.14 km2
200
km2
Authors
Present study
Vega-Cendejas and Hernández, 2004
Vega-Cendejas, 2004
Raz-Guzmán and Huidobro, 2002
advantage of the diverse food resources Many
others use this environment as nursery such as
L. griseus, E. argenteus and E. gula. The small
size recorded for most of the individuals indicates the importance of the seagrass meadows,
mangroves and mudflat to grow and shelter
against predators. Similar results were reported
by Vega-Cendejas and Hernández (2004) for
Río Lagartos lagoon.
Temporal and spatial variations among
assemblages: Temporally, during norths the
highest species number (59) uses the lagoon as
Rev. Biol. Trop. (Int. J. Trop. Biol. ISSN-0034-7744) Vol. 57 (1-2): 89-103, March-June 2009
99
protection against strong winds and was characterized by their abundance and aggregation,
such as anchovies (A. mitchilli and A. hepsetus)
and jacks (Selene vomer). High density and
biomass percentages are generally associated
to the occasional presence of small pelagic
fish big schools (Simier et al. 2004). Seasonal
variability in fish assemblages reflects some
species abundance due to reproductive pulses, mainly during the first stages in their
life cycle (Machado and Araújo 2003). For
instance, during the dry season, it was recorded
a F. persimilis abundance peak in relation to its
reproductive stage. Similar results were found
by Vega-Cendejas and Hernández (2004) that
reported an abundance peak for F. grandissimus during dry season in Río Lagartos, suggesting a reproductive season for this species in
the Yucatan coast.
In terms of spatial distribution, the inner
zone (station 1), showed the least number of
species (20), and Lagodon rhomboides was
the most abundant with more than 60% of
the total capture. On the other hand, stations
with the highest number of species were 6
and 8. In site 6, located in the innermost
zone of the lagoon, many estuarine-type and
freshwater species were found (11%) such as
“Cichlasoma” urophtalmus, C. artifrons, G.
pulchra, G. yucatana, P. velifera and Mendia
colei. This site is characterized by freshwater
seeps that give hydrologic estuarine conditions
and produce an abundance of organic matter
(personal observation), which may explain the
presence of these species even if salinity is
high; furthermore this site is characterized by
a high habitat heterogeneity with mangroves
and muddy flatland floors that contribute to
ichthyofauna diversification, even for shelter
of important species such as “C”. urophtalmus;
moreover they provide food to benthophagous (Gerreidae) and detritophagous species
(Mugilidae) (Simier et al. 2004). Station 8,
located in the external zone (near the inlet),
is the other site with the highest species richness in the lagoon. This place has a permanent
communication with the sea, favoring transit
for many interacting species. Predominantly
100
open estuaries are species rich; their permanent
or near-permanent connection with the sea
allows access into these systems (Harrison and
Whitfield 2006).
According to abundance and species composition, sampling sites were distributed in
three groups (Figure 5), the first one included
stations located in the external zone (7 and 8),
where specific composition comprises mainly
marine species considered only in transit and
that occasionally get into the lagoon. The use
of surf zones by a great number of fish, mainly
in juvenile stages, is likely responsible for
the existence of rich sources of food in form
of zooplankton and for the protection against
predators that those shallow, low turbid and
low turbulent waters provide (Lasiak 1986).
The second group is conformed by site
1 located in the inner zone, which forms an
independent group due to a high representation
of small size individuals (3-5 cm) of L. rhomboides. This zone is characterized by a bed of
submerged vegetation dominated by Halodule
wrigthii (Herrera Silveira et al. 1998). This
shows the ecological role of seagrass meadows
as growing and feeding zones for juvenile
stages of marine species (Jenkins et al. 1997,
Gray et al. 1998). The third group comprises
inner stations, with dominating species of wide
distribution within the lagoon. These sites
are also characterized by shallow depths with
muddy bottoms, sometimes with submerged
macrophytes and macroalgae, aside from high
turbidness and a great quantity of decomposing
organic matter, which is used by detritophagous species.
Relation between species and hydrologic
variables: The ever-changing conditions in
hydrology can become a physical barrier for
the access of many marine origin species; such
is the case of salinity gradients, while variations in temperature can affect ichthyofauna
distribution, through their thermal differences,
but above all because of the joined effect with
dissolved oxygen (Marshall and Elliott 1998).
Environmental variables did not show spatial
gradient as in other coastal systems of Yucatan
Rev. Biol. Trop. (Int. J. Trop. Biol. ISSN-0034-7744) Vol. 57 (1-2): 89-103, March-June 2009
Peninsula (Rueda 2001, Vega-Cendejas and
Hernández 2004). However there is a clear
seasonal pattern influenced by climatic conditions, specially during norths. Species found
as estuarine residents and most dominating did
not show any relation with environmental variables, but some marine species did so because
of their abundance in certain climatic seasons.
Salinity has a great influence over distribution
and abundance of some marine species, like
in anchovies (A. hepsetus and A. mitchilli)
and herrings (H. jaguana and O. oglinum).
We have to take into account that response of
many species to salinity fluctuations can vary
during their life cycle. For instance, juvenile
herrings can tolerate wider ranges than adults
(Marshall and Elliott 1998). As for temperature, it showed certain influence over some
species, such as mullets (M. trichodon), silver
croaker (B. chrysoura) and catfish (A. felis). It
is unlikely that thermal tolerance by itself be the
main factor to influence the examined species
distribution. However, temperature’s influence
over fish distribution grows through effects of
synergy between temperature and dissolved
oxygen (Pomfret et al. 1991, Blaber 1997,
Marshall and Elliott 1998). We have to consider that biological interactions that influence
the composition of estuarine fish assemblages,
such as, habitat preference, predator-prey relation, food availability and often reproductive
biology of species. Therefore, estuarine fish
patterns of distribution can not be only attributed to physicochemical factors, but to a synergy
between biotic and abiotic factors.
CONCLUSIONS
The main spatial and temporal differences between fish assemblages in a coastal
system influenced by freshwater seeps was
species composition, due to the behavior and
biology of each species at a given time and
place. Site 1, located in the inner zone (bottom
with Halodule wrightii) showed the greatest
difference amongst all sampling sites. In addition it can be characterized as having a lower
diversity value because of juvenile dominance
(L. rhomboides) i.e. using the system as a
nursery. Temporarily, the greatest diversity and
species richness was obtained during the north
wind season because several marine species
of ecological and economical importance used
the system for shelter and feeding. Salinity was
the hydrologic variable that best related fish
distribution patterns with a direct influence on
the pelagic species A. mitchilli, A. hepsetus, H.
jaguana and O. oglinum.
ACKNOWLEDGMENTS
We are grateful for the help of many colleagues that was indispensable to realize the
fieldworks. In special we want to thank Mirella
Hernández de Santillana for her assistance at
fish sampling and in the laboratory- thank you
to all of you. We are indebted to Luis Capurro
for corrections to the English versions and to
anonymous referees for their comments and
suggestions that enrich the manuscript.
Resumen
Las lagunas costeras son sistemas importantes para
muchas especies de organismos dulceacuícolas, estuarinos y marinos, ya que son consideradas zonas de reproducción, refugio y alimentación de muchas especies de
peces. El presente estudio analizó los ensamblajes de la
comunidad íctica de la reserva de Dzilam y su relación
con las variables hidrológicas. Se capturaron un total de
6 474 individuos (81 especies), en donde Sphoeroides
testudineus, Fundulus persimilis, Anchoa mitchilli,
Eucinostomus gula, Eucinostomus argenteus and Mugil
trichodon contribuyeron con más del 50% del Indice de
Valor de Importancia (IVI). Las diferencias en composición de especies se encontraron entre temporadas, la
mayor durante los nortes. Espacialmente, las diferencias
fueron relacionadas con la presencia de afloramientos de
agua dulce, la mayor en la zona Este de la laguna y la
menor con mayor diferencia en composición específica se
localizó en la parte Oeste de la zona interna, esto debido
a la gran abundancia y dominancia de una sola especie
(L. rhomboides). La salinidad y la temperatura fueron
las variables que presentaron la mayor influencia en la
distribución de algunas especies pelágicas como son A.
mitchilli y A. hepsetus. Debido a la abundancia de afloramientos de agua dulce, característicos de las lagunas
costeras de la Península de Yucatán, los ensamblajes de
peces muestran diferencias espaciales y temporales en la
composición específica.
Rev. Biol. Trop. (Int. J. Trop. Biol. ISSN-0034-7744) Vol. 57 (1-2): 89-103, March-June 2009
101
Palabras clave: Ictiofauna, composición de especies,
variación temporal, entradas de agua dulce, variables
ambientales, Bocas de Dzilam.
REFERENCES
Blaber S., J.M. 1997. Fish and fisheries of tropical estuaries. Chapman and Hall, London, England.
Blaber S., J.M. & T.G. Blaber. 1980. Factors affecting the
distribution of juvenile estuarine and inshore fish. J.
Fish Biol. 17: 143-162.
Brower JE, Zar JH. 1977. Field and Laboratory Methods
for General Ecology. W. C. Brown Co. Publishers,
Dubuque, Iowa, USA.
Castro-Aguirre JP, Espinoza H, Schmitter-Soto J. 1999.
Ictiofauna estuarino lagunar y vicaria de México.
Colección Textos Politecnicos. Serie Biotecnologias.
Ed. Limusa, México.
Clarke K.R. & R.H.Green 1988. Statistical design and
analysis for a ‘biological effects’ study. Mar. Ecol.
Prog. Series. 46: 213-226.
Clarke KR, Gorley R. 2001. PRIMER V5: User Manual/
Tutorial. PRIMER-E Plymouth, UK.
Clarke KR, Warwick RM. 2001. Change in Marine
Communities: An Approach to Statistical Analysis
and Interpretation. 2nd edition. Natural Environment
Research Council, Plymouth Marine Laboratory,
Plymouth U.K.
De La Cruz AG. 1994. ANACOM: Sistema para el
Análisis de Comunidades en computadoras personales. Versión 3.0. Manual del usuario. CINVESTAVIPN, Unidad Mérida, Yucatán, México.
Francis M., R. Hurst, B. McArdle, N. Bagley & O.
Anderson. 2002. New Zeland demersal fish assemblages. Env. Biol. Fish. 65: 215-234.
Gray C. A., R.C. Chick & D.J. McElligott. 1998. Diel
changes in assemblages of fishes associated with
shallow seagrass and bare sand. Estuar. Coast. Shelf
Sci. 46: 849-859.
Harrison, D.T. & A.K. Whitfield. 2006. Estuarine typology and the structuring of fish communities in South
Africa. Env. Biol. Fish. 75: 269-293.
Herrera-Silveira J.A., R.J. Ramírez & A. Zaldivar. 1998.
Overview and characterization of the hydrology and
primary producer communities of selected coastal
lagoons of Yucatan, México. Aquatic Ecosystem
Health and Management. 1: 353-372.
102
Jenkins GP, May HMA, Wheatley MJ, Holloway MG.
1997. Comparison of fish assemblages associated
with seagrass and adjacent unvegetated habitats of
Port Phillip Bay and Corner Inlet, Victoria, Australia,
with emphasis on commercial species. Estuar. Coast.
Shelf Sci. 44: 569-588.
Kupschus S & D. Tremain. 2001. Associations between
fish assemblages and environmental factors in nearshore habitats of a subtropical estuary. J. Fish Biol.
58: 1383-1403.
Lasiak TA. 1986. Juveniles, food and the surfzone habitat:
implications for teleost nursery areas. South African
J. Zoo. 21: 52-56.
Machado P.A.L. & F.G. Araújo. 2003. Spatial, temporal,
and diel variations of fish assemblages at two sandy
beaches in the Sepetiba Bay, Rio de Janeiro, Brazil.
Estuar. Coast. Shelf Sci. 57: 817-828.
Marchand J. 1993. The influence of seasonal salinity and
turbidity maximum variations on the nursery function
of the Loire estuary (France). Netherlands J. Aquat.
Ecol. 27: 427-436.
Marshall S. & M. Elliot. 1998. Environmental Influences
on the Fish Assemblage of the Humber Estuary, U.K.
Estuar. Coast. Shelf Sci. 46: 175-184.
Medina-Gómez I, Herrera-Silveira J.A. 2003. Spatial characterization of water quality in a karstic coastal
lagoon without anthropogenic disturbance: a multivariate approach. Estuar. Coast. Shelf Sci. 58:
455-465.
Pomfret JR, Elliott M, O‘Reilly MG & Phillips S. 1991.
Spatial and temporal patterns in the fish communities in two U.K. North Sea estuaries, p.277-284. In:
Elliott M & Ducrotoy SP (eds) Estuaries and coasts:
Spatial and Temporal Intercomparisons. Olsen &
Olsen, Fredensborg, Denmark.
Raz-Guzman A & L. Huidobro. 2002. Fish communities in
two environmentally different estuarine systems of
Mexico. J. Fish Biol. 61: 182-195.
Rueda M. 2001. Spatial distribution of fish species in a
tropical estuarine lagoon: a geostatistical appraisal.
Mar. Ecol. Prog. Ser. 222: 217-226.
Simier M, L. Blanc, C. Aliaume, P.S. Diouf & J.J. Albaret.
2004. Spatial and temporal structure of fish assemblages in an “inverse estuary”, the Sine Saloum system (Senegal). Estuar. Coast. Shelf Sci. 59: 69-86.
Tsou TS, Matheson RE Jr. 2002. Seasonal Changes in the
Nekton Community of the Suwanee River Estuary
and the Potential Impacts of Freshwater Withdrawal.
Estuaries 25: 1372-1381.
Rev. Biol. Trop. (Int. J. Trop. Biol. ISSN-0034-7744) Vol. 57 (1-2): 89-103, March-June 2009
Vega-Cendejas ME. 2004. Ictiofauna de la Reserva de
la Biosfera Celestún, Yucatán: una contribución al
conocimiento de su diversidad. An. Inst. Biol. Univ.
Nal. Autón. Méx. Ser. Zoo. 75: 193-2006.
Vega-Cendejas M.E. & M. Hernández. 2004. Fish community structure and dynamics in a coastal hypersaline lagoon: Rio Lagartos, Yucatan, Mexico. Estuar.
Coast. Shelf Sci. 60: 285-299.
Vega-Cendejas ME, F, Arreguin & M. Hernández. 1993.
Trophic fluxes on the campeche, Campeche Bank,
México. pp. 206-213 In Christensen V. and Pauly
D. (eds) Trophic models of aquatic ecosystems,
ICLAEM Conf. Proc.
Vega-Cendejas M.E., M. Hernández & F. Arreguin. 1994.
Trophic interrelations in a beach seine fishery from
the northwestern coast of the Yucatan peninsula,
México. J. Fish Biol. 44: 647-659.
Vega-Cendejas M.E., M. Hernández & G. De La Cruz
Agüero G. 1997. Los peces de la Reserva de la Biosfera
de Celestún. CINVESTAV Mérida. PRONATURA.
Península de Yucatán, México.
Whitfield A. K. 1999 Ichthyofaunal assemblages in estuaries: A South African case study. Rev. Fish. Biol.
Fisheries 9: 151-186.
Zar, JH. 1984. Biostatistical Analysis, 2nd edition, Prentice
Hall. New Jersey, USA.
INTERNET REFERENCES
Froese R, Pauly D. 2004. FishBase, version (09/2004).
(Downloaded: Feb 24, 2005 www.fishbase.org).
Rev. Biol. Trop. (Int. J. Trop. Biol. ISSN-0034-7744) Vol. 57 (1-2): 89-103, March-June 2009
103