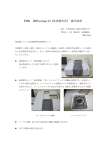
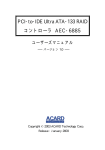
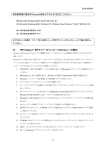
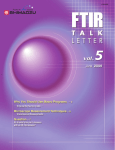
1
206-95130A
PharmaReport Program
Instruction Manual
日本薬局方対応マクロプログラム
取扱説明書
Read this manual carefully before using this product. Please
keep this manual for future reference.
製品を使用される前にこの取扱説明書をよくお読みください。いつ
でも使用できるように大切に保管してください。
分析計測機器事業部
1
206-95130A
Instruction Manual
IRsolution
PharmaReport Program
Read this manual carefully before using this product.
Please keep this manual for future reference.
Analytical & Measuring Instruments Division
Copyright © Shimadzu Corporation 2003
All rights are reserved, including those to reproduce this publication or parts there of in any form
without permission in writing from Shimadzu Corporation.
1.
Information in this publication is subject to change without notice and does not represent a
commitment on the part of vender.
2.
Any errors or omissions which many have occurred in this publication despite the utmost
care taken in its production will be corrected as soon as possible, but not necessarily
immediately upon detection.
3.
Note the Shimadzu does not have any obligation concerning the effects resulting from the
application of the contents of this manual.
Please acknowledge being not able to answer for the influence of the result of operation by the
content of this book.
-2-
For safety use
IRsolution PharmaReport Program is an optional program for IRsolution to create a report for
identification test for Pharmacopoeia works. Please remember the following items when using this
product.
1. Please DO NOT use this product for purposes other than what is was designed for.
2. For safety reasons, follow the procedure described in the instruction manual
3. Obey warnings or caution descriptions.
4. DO NOT modify the product by yourself.
This instruction manual defines the levels of warning as follows;
Warning
Death or serious injury may result is this warning is not followed.
Caution
Injury may result if this caution is not followed.
Notice
This notice with increase the understanding and usefulness of the software.
-3-
Guide for using the Instruction Manual
The manual of the PharmaReport program for the IRsolution software is one this book composition.
This instruction manual explains functions of the PharmaReport program function offered as an option
function of the IRsolution software in this book. For general operations of the IRsolution, refer to the
Instruction Manual for the IRsolution software.
-4-
Contents
Chapter 1
Outline of the PharmaReport Program ................................................................... 6
1-1
Outline ............................................................................................................................ 6
1-2
Environment to operate the PharmaReport Program .................................................... 6
Chapter 2
Setup....................................................................................................................... 7
2-1
Confirmation of number.................................................................................................. 7
2-2
Setup .............................................................................................................................. 7
2-3
Print template ................................................................................................................. 8
2-4
Notes .............................................................................................................................. 8
2-4-1
Selection of spectrum ............................................................................................. 8
2-4-2
Printed Scan parameter.......................................................................................... 9
Chapter 3
How to use of the program. .................................................................................. 10
3-1
Data which should be prepared ................................................................................... 10
3-2
Beginning of program ................................................................................................... 10
3-3
Outline of the operation ................................................................................................ 11
3-4
Load Standard (standard spectrum) button ................................................................. 12
3-5
Load Sample (sample spectrum) button ...................................................................... 12
3-6
Peak table file............................................................................................................... 13
3-6-1
Load Peak Table (reading of peak table file)........................................................ 13
3-6-2
Edit Peak Table (making and edit of peak table file) ............................................ 13
3-7
Calculation (calculation execution) button.................................................................... 15
Chapter 4
How to use of the program. .................................................................................. 18
4-1
Data which should be prepared ................................................................................... 18
4-2
Beginning of program ................................................................................................... 18
4-3
Outline of the operation ................................................................................................ 19
4-4
Operation method......................................................................................................... 19
Chapter 5
How to use of the program. .................................................................................. 22
- Peak detection function -........................................................................................................... 22
5-1
Data which should be prepared ................................................................................... 22
5-2
Beginning of program ................................................................................................... 22
5-3
Outline of the operation ................................................................................................ 23
5-4
Load Sample (sample spectrum) button ...................................................................... 23
5-5
Peak table file............................................................................................................... 24
5-5-1
Load Peak Table (reading of peak table file)........................................................ 24
5-5-2
Edit Peak Table (making and edit of peak table file) ............................................ 25
5-6
Detection (peak detection) button ................................................................................ 26
Chapter 6
How to use of the program. .................................................................................. 28
- Alteration check program - ........................................................................................................ 28
6-1
Operation method......................................................................................................... 28
-5-
Chapter 1 Outline of PharmaReport Program
1-1
Outline
The PharmaReport Program for IRsolution is supplied as an option program which operates
on the IRsolution software. The following functions are included in this program.
1.
Report Creating
Creates an analysis report to compare a sample spectrum with a standard spectrum
based on identification test in the pharmacopoeias. Peak wavenumbers and peak
ratios are calculated and the program judges Pass (OK)/Fail (NG) based on the
errors calculated Peak wavenumbers and Peak ratios.
2.
Spectrum Comparison
Creates a report suitable to compare standard and sample spectra based on
identification test in the pharmacopoeias.
3.
Peak Detection
Detect peaks being described in identification test in the pharmacopoeias, and
creates a report.
1-2
Environment to operate the PharmaReport Program
1. Version of IRsolution
The PharmaReport Program operates by IRsolution Version 1.10 or later. Please
contact to you Shimadzu representatives to upgrade your IRsolution version, when
you use older version of IRsolution.
2. Macro platform
The PharmaReport Program operates by using the Macro Platform of the IRsolution
software. If the Macro Platform is not installed, the PharmaReport does not run.
Please perchance and install the Macro Platform when it is not possession.
-6-
Chapter 2 Setup
2-1
Confirmation of parts
Check up necessary parts are included in your package before installation.
Name of articles
Installation disk for PharmaReport
Instruction Manual (this book)
2-2
P/N
No.
206-72488-91
1 set
206-95130
1
Setup
This paragraph describes the procedure to install the PharmaReport Program to the
IRsolution software.
Please confirm the IRsolution software and Macro Platform has been correctly installed in
the computer before the installation.
1. Insert the installation disk in the floppy disk drive.
2. Select “Run” on the start button menu of Windows.
3. Input to the file name as “A:setup”, and then clicks < OK > button.
4. The installation program starts.
5. Click < OK > button, and the installation is finished.
6. “ParmReport.lcm” is copied to “… ¥Program files¥Shimadzu¥IRsolution¥macros”
folder.
“Kyokuhou3.ptm”,
“Kyokuhou2.ptm”,
“Kyokuhou1NG.ptm”,
and
“Kyokuhou1OK.ptm” are copied onto “… ¥Program files ¥Shimadzu ¥IRsolution
¥PrintTemplates” folder.
-7-
2-3
Print template
When IRsolution is not installed in “C:¥Program files¥Shimadzu¥IRsolution”, it is necessary
to correct the print template file. Please correct four files of ““Kyokuhou3.ptm”,
“Kyokuhou2.ptm”, “Kyokuhou1NG.ptm”, and “Kyokuhou1OK.ptm” as follows.
1.
Run the “Report” function, and click < No > button on the print screen once. As a
result,
“…¥Program
files¥Shimadzu¥IRsolution¥data¥kyokuho¥report.txt”
and
“report2.txt” are created.
2.
Select the [Print] tab on IRsolution.
3.
Select [File]-[Open] and open “Kyokuhou3.ptm”.
4.
Select the evaluation result text frame.
5.
Specify the “Report.txt” or “Report2.txt” to the result text frame on the “RTF
Filename” column in object property window.
6.
Select [File]-[Save].
7.
Other
“Kyokuhou2.ptm”,
“Kyokuhou1NG.ptm”,
and
“Kyokuhou1OK.ptm”
are
similarly corrected.
2-4
Notes
Please note the following points when you use this program.
2-4-1
Selection of spectrum
In this program, data with an “active pointer” in the selected spectrum file is used to
calculation.
In IRsolution, when various Data manipulation such as Baseline correction, Kubelka-Munk
conversion, etc. are done to the measured data, the Data manipulation result is saved as a
“Child” data of the original data in the has the tree-structured file. Data with an “Active
pointer” is displayed first when a file consisted of two or more data is opened. In this program,
data with an “active pointer” in the selected spectrum file is used to calculation. An active
pointer is usually set to the data treated at the end. When an active pointer is not set to target
data, the file is opened with IRsolution, and mouse’s right button is clicked on the tree view.
Then select an active pointer of the displayed context menu, and close the file.
-8-
Figure 2-1 Tree view and Active pointer
2-4-2
Scan parameters on Report
When the Raw (scanned) data is used by this program, Scan parameters are printed on the
report. However, when an active pointer is set to manipulated data, the Scan parameters are
not printed, and leave blank. The reason is that Manipulated data does not include scan
parameters because it is not raw data.
-9-
Chapter 3 How to use of the program.
- Report creating function The Report function creates an analysis report to compare a sample spectrum with a
standard spectrum based on identification test in the pharmacopoeias. Peak wavenumbers and
peak ratios are calculated and the program judges Pass (OK)/Fail (NG) based on the errors
calculated Peak wavenumbers and Peak ratios.
3-1
Data which should be prepared
Standard spectrum (Transmittance)
Sample spectrum (Transmittance)
Peak table (It is made in this program.)
Note
In this program, data with an “active pointer” in the selected spectrum file is used to
calculation.
When the Raw (scanned) data is used by this program, Scan parameters are printed
on the report. However, when an active pointer is set to manipulated data, the Scan
parameters are not printed, and leave blank.
3-2
Starting of program
1. Start IRsolution.
2. Click the [Macro] tab to display the macro platform screen.
3. Select [Macro]-[Open Macro Container] to open “…¥Program Files ¥Shimadzu
¥IRsolution¥Macros¥PharmaReport.lcm”. The program is displayed in the macro
toolbar.
4. Select “PharmaReport” under the “PharmaReport.lcm”, and then select [Macro]-[Run] to
execute the program.
Note
The program does not start even if the
is clicked.
5. The dialog box in Figure 3-1 opens.
Figure 3-1. Selection of program
- 10 -
button in the macro toolbar
Button
Content
Printout
Runs the Spectrum Comparison function.
Peak Detection
Runs the Peak detection function.
Report
Runs the Report creating function.
6. Then, click < Report > to open the dialog box in Figure 3-2, and the Report creating
function for Pharmacopoeias starts.
Figure 3-2. “Report creating function” screen
Button
3-3
Content
Load Standard
Loads a standard spectrum.
Load Sample
Loads a sample spectrum.
Load Peak Table
Loads a Peak table file which has already been made.
Edit Peak Table
Creates/Edits a Peak table file.
Calculation
Calculates and creates a Report.
Exit
Closes the program.
Outline of the operation
The outline of the operation of this program is as follows.
1. Load a standard spectrum with < Load Standard > button.
2. Load a sample spectrum with < Load Sample > button.
3. Load a Peak table file which has already been made with < Load Peak Table > button,
or create a Peak table file with < Edit Peak Table > button.
4. Click the < Calculation > button to create a Report.
- 11 -
3-4
<Load Standard> Spectrum button
It is a button to prepare a standard spectrum file necessary for the calculation.
1. Click the < Load Standard > button to open the “Load Standard Spectrum” dialog box.
2. Select the standard spectrum
3. Clicking the <Open > button returns to the dialog box in Figure 3-2.
Figure 3-3. ”Load Standard Spectrum” dialog box
3-5
<Load Sample> Spectrum button
It is a button to prepare a sample file necessary for the calculation.
1. Click the < Load Sample > button to open the “Load Sample Spectrum” dialog box.
2. Select the sample spectrum.
3. Clicking the <Open > button returns to the dialog box in Figure 3-2.
Figure 3-4. ”Load Sample Spectrum” dialog box
- 12 -
3-6
Peak table file
Up to 10 peaks can be specified to detect. Up to 4 peaks can be specified to calculate the
Transmittance Ratio to evaluate the intensity. The set of the peak wavenumber is saved as a
data file.
The peak table file can be created by clicking < Load Peak Table > button in Figure 3-2, or
edited by clicking < Edit Peak Table > button.
3-6-1
<Load Peak Table> button
The peak table file which has already been made can be loaded by clicking <Load Peak
Table> button in Figure 3-2.
1.
The dialog box in Figure 3-5 opens.
Figure 3-5. Load Peak File dialog box
2.
The extension of the peak table file is “.wdtr”.
3.
Select a Peak table file and then, click the <Open> button to return to the dialog box
in Figure 3-2.
4.
Clicking the < Edit Peak Table > button explains next is used to create the Peak table
newly.
3-6-2
<Edit Peak Table> button
The peak table file can be created or edited by clicking < Edit Peak Table > button in Figure
3-2.
1.
The dialog box in Figure 3-6 opens.
- 13 -
Figure 3-6. “Edit Peak Information” dialog box
2.
Input peak wavenumbers into “Wave No.” column, and the range of the Tolerance of
the peak wavenumber into the “Tolerance” column. It is possible to input up to ten
peaks. The check mark is put to “Use” columns of the wavenumber used to calculate.
Even if the wavenumber is input, the one without check mark is not used to
calculate.
3.
First of all, number of peaks to be used for Peak ratio evaluation to “Evaluation
Peak No.”. Then input the numbers of the peak wavenumber to be used for
evaluation. It is possible to specify up to four peaks. The range of the Tolerance
compared with the peak is input to the “Tolerance” column.
4.
When the input ends, < OK > button is clicked. The dialog box in Figure 3-7 is
displayed, and the created peak table file is saved. The extension of the peak table
file is “.wdtr”.
5.
Clicking the <Save> button returns to the dialog box in Figure 3-2.
- 14 -
Figure 3-7. “Save Peak File” dialog box
3-7
<Calculation> button
The calculation is executed, and judged. The result is displayed on the screen and printed.
1.
The <Calculation> button will be activated when all of Loading Peak Table, Loading
Sample file and Loading Standard file are done.
2.
When < Calculation > button is clicked, the calculation is executed according to the
following procedures.
(1) The peak of standard spectrum is detected referring to the peak table.
(2) The peak of the sample spectrum is detected referring to the detected peak list
of standard spectrum.
(3) Errors (differences of peak wavenumber of standard from one pf sample) are
calculated.
(4) Peak ratios in Transmittance are calculated for the standard spectrum.
(5) Peak ratios in Transmittance are calculated for the sample spectrum.
(6) Ratio of peak ratios in (5) to peak ratios in (4) for evaluation.
(7) Prints out the result of (3) and (6). At this time, Judgment becomes “NG” when
one of errors of peak wavenumber or one of errors of peak ratio is not satisfied
Tolerance.
(8) When all of all listed errors are satisfied Tolerances, Judgment is “OK”.
3.
The spectrum and the Judgment (“OK” “NG”) are displayed.
Figure 3-8. Evaluation
- 15 -
4.
The dialog box in Figure 3-9 opens when < OK > button is clicked.
Figure 3-9. Print dialog box
Click <Yes> button to printout a Report such as Figure 3-10. The program ends if
<No> button is clicked.
Reported on
Reported by:
2003/08/07 06:21:36
Shimazu
OK!
9 0
% T
7 5
6 0
4 5
906.58
3 0
1028.10
|
C
|
B
540.09
3060.20
0
1600.99
2849.95
1 5
|
A
- 1 5
4 0 0 0
F T IR
3 5 0 0
M e a s u re m e n t
3 0 0 0
2 5 0 0
2 0 0 0
1 7 5 0
1 5 0 0
1 2 5 0
1 0 0 0
7 5 0
5 0 0
1 / c m
C:¥Program Files¥Shimadzu¥IRsolution¥data¥kyokuhou¥Sample.smf
Scanned on
:2003/08/07 15:25:20
Accumulation :20 Times
Resolution
:4 [1/cm]
Apodization
:Happ-Genzel
9 0
% T
7 5
6 0
4 5
906.58
3 0
1028.10
|
C
|
B
542.02
0
1600.99
2849.95
1 5
3060.20
5.
|
A
- 1 5
4 0 0 0
F T IR
3 5 0 0
M e a s u re m e n t
3 0 0 0
2 5 0 0
2 0 0 0
1 7 5 0
1 5 0 0
1 2 5 0
1 0 0 0
C:¥Program Files¥Shimadzu¥IRsolution¥data¥kyokuhou¥STD.smf
Scanned on
:2003/08/07 14:50:30
Accumulation :20 Times
Resolution
:4 [1/cm]
Apodization
:Happ-Genzel
Peak wavenumber
Sample
(cm-1)
A_P1 540.1
__P2 906.6
B_P3 1028.1
C_P4 1601.0
__P5 3060.2
__P6 2849.9
Peak Ratio
Sample
A/B
1.4584
A/C
0.9514
B/C
0.6524
(%T)
5.0
29.4
12.8
4.3
2.0
8.8
Standard goods
(cm-1)
(%T)
542.0
5.5
906.6
29.2
1028.1
12.7
1601.0
4.2
3060.2
2.0
2849.9
8.8
Tolerance
(cm-1)
5.00
5.00
5.00
5.00
5.00
5.00
Error
(cm-1)
0.36
0.00
0.00
0.00
0.00
0.00
Standard goods
1.4031
0.9150
0.6522
Tolerance
1+/-0.3
1+/-0.3
1+/-0.3
Error
1.0394
1.0397
1.0003
Figure 3-10. Printed report example
- 16 -
7 5 0
5 0 0
1 / c m
The report consists of the Scan parameter, Judgment (OK or NG), spectra of standard and
sample, and calculated table.
Markers to show the selected peaks for detection and evaluation are displayed.
The upper part of the calculated table shows the detected peak wavenumbers and their
transmittance for both sample and standard spectra. The right row shows error which is
calculated by “[Peak wavenumber of sample] – [Peak wavenumber of standard]”.
The lower part shows Peak ratios of evaluation peaks for both sample and standard spectra.
The right row shows a error which is calculated by “[Peak ratio of sample] / [Peak ratio of
standard]”.
- 17 -
Chapter 4 How to use of the program.
- Spectrum comparison function The Spectrum comparison function creates a report suitable to compare standard and sample
spectra based on identification test in the pharmacopoeias.
4-1
Data which should be prepared
Standard spectrum (Transmittance)
Sample spectrum (Transmittance)
Note
In this program, data with an “active pointer” in the selected spectrum file is used to
calculation.
When the Raw (scanned) data is used by this program, Scan parameters are printed
on the report. However, when an active pointer is set to manipulated data, the Scan
parameters are not printed, and leave blank.
4-2
Starting of program
1.
Start IRsolution.
2.
Click the [Macro] tab to display the macro platform screen.
3.
Select [Macro]-[Open Macro Container] to open “…¥Program Files ¥Shimadzu
¥IRsolution¥Macros¥PharmaReport.lcm”. The program is displayed in the macro
toolbar.
4.
Select “PharmaReport” under the “PharmaReport.lcm”, and then select [Macro]-[Run] to
execute the program.
Note
The program does not start even if the
is clicked.
5.
The dialog box in Figure 4-1 opens.
Figure 4-1. Selection of program
- 18 -
button in the macro toolbar
Button
6.
4-3
Content
Printout
Runs the Spectrum Comparison function.
Peak Detection
Runs the Peak detection function.
Report
Runs the Report creating function.
Then, click < Printout > button.
Outline of the operation
The outline of the operation of this program is as follows.
1. Load a standard spectrum.
2. Load a sample spectrum.
3. The report is printed.
4-4
Operation method
1. Click < Printout > button in Figure 4-1.
2. The dialog box in Figure 4-2 opens.
Figure 4-2. “Load Standard Spectrum” dialog box
3. Select a standard spectrum, and then click <Open > button.
4. The dialog box in Figure 4-3 opens.
- 19 -
Figure 4-3. “Load Sample Spectrum” dialog box
5. Select a sample spectrum, and then click <Open > button.
6. The dialog box in Figure 4-4 opens.
Figure 4-4. Print dialog box
7. Click <Yes> button to printout a Report such as Figure 4-5. The program ends if <No>
button is clicked.
- 20 -
Reported on:
Reported by:
2003/08/07 06:21:36
Shimazu
90
%T
80
70
60
50
40
30
20
10
0
4500
4000
P o ly s ty re n e F ilm
File name
Sample name
Scanned on
3500
3000
2500
2000
1750
1500
1250
1000
750
500
1/cm
750
500
1/cm
:C:¥Program Files¥Shimadzu¥IRsolution¥data¥kyokuhou¥Sample.smf
:PS1
Resolution
:4 [1/cm]
:2003/08/07 15:25:20
Accumulation
:20 Times
Apodization
:Happ-Genzel
90
%T
80
70
60
50
40
30
20
10
0
4500
4000
P o ly s ty re n e F ilm
File name
Sample name
Scanned on
3500
3000
2500
2000
1750
1500
1250
1000
:C:¥Program Files¥Shimadzu¥IRsolution¥data¥kyokuhou¥STD.smf
:PS2
Resolution
:4 [1/cm]
:2003/08/07 14:50:30
Accumulation :20 Times
Apodization
:Happ-Genzel
Figure 4-5. Printed report example
- 21 -
Chapter 5 How to use of the program.
- Peak detection function The Peak detection function detect peaks being described in identification test in the
pharmacopoeias, and creates a report.
5-1
Data which should be prepared
Sample spectrum (Transmittance)
Peak table (It is made in this program.)
Note
In this program, data with an “active pointer” in the selected spectrum file is used to
calculation.
When the Raw (scanned) data is used by this program, Scan parameters are printed
on the report. However, when an active pointer is set to manipulated data, the Scan
parameters are not printed, and leave blank.
5-2
Starting of program
1. Start IRsolution.
2. Click the [Macro] tab to display the macro platform screen.
3. Select [Macro]-[Open Macro Container] to open “…¥Program Files ¥Shimadzu
¥IRsolution¥Macros¥PharmaReport.lcm”. The program is displayed in the macro toolbar.
4. Select “PharmaReport” under the “PharmaReport.lcm”, and then select [Macro]-[Run] to
execute the program.
Note
The program does not start even if the
is clicked.
5. The dialog box in Figure 5-1 opens.
Figure 5-1. Selection of program
- 22 -
button in the macro toolbar
Button
Content
Printout
Runs the Spectrum Comparison function.
Peak Detection
Runs the Peak detection function.
Report
Runs the Report creating function.
6. Then, click < Peak Detection > to open the dialog box in Figure 5-2, and the Peak
detection function for Pharmacopoeia starts.
Figure 5-2. “Peak detection function” screen
Button
5-3
Content
Load Sample
Loads a sample spectrum.
Load Peak Table
Loads a Peak table file which has already been made.
Edit Peak Table
Creates/Edits a Peak table file.
Detection
Detects peak and creates a Report.
Exit
Closes the program.
Outline of the operation
The outline of the operation of this program is as follows.
1. Load a sample spectrum with < Load Sample > button.
2. Load a Peak table file which has already been made with < Load Peak Table > button,
or create a Peak table file with < Edit Peak Table > button.
3. Click the < Detection > button to create a Report.
5-4
<Load Sample> Spectrum button
It is a button to prepare a sample file necessary for the calculation.
1. Click the < Load Sample > button to open the “Load Sample Spectrum” dialog box.
- 23 -
2. Select the sample spectrum.
3. Clicking the <Open > button returns to the dialog box in Figure 5-2.
Figure 5-3. ”Load Sample Spectrum” dialog box
5-5
Peak table file
Up to 10 peaks can be specified to detect. Up to 4 positions can be specified to remark. The
set of the peak wavenumber is saved as a data file.
The peak table file can be created by clicking < Load Peak Table > button in Figure 5-2, or
edited by clicking < Edit Peak Table > button
5-5-1
<Load Peak Table> button
The peak table file which has already been made can be read by clicking <Load Peak Table>
button in Figure 5-2.
1.
The dialog box in Figure 5-4 opens.
Figure 5-4. “Load Peak Table” dialog box
- 24 -
2.
The extension of the peak table file is “.wdtp”.
3.
Select a Peak table file and then, click the <Open> button to return to the dialog box
in Figure 5-2.
4.
Clicking the < Edit Peak Table > button explains next is used to create the Peak table
newly.
5-5-2
<Edit Peak Table> button
The peak table file can be created or edited by clicking < Edit Peak Table > button in Figure
5-2.
1.
The dialog box in Figure 5-5 opens.
Figure 5-5. “Edit Peak W. No.” dialog box
2.
Input peak wavenumbers into “Wave No.” column. It is possible to input up to ten
peaks. The check mark is put to “Use” columns of the wavenumber used to calculate.
Even if the wavenumber is input, the one without check mark is not used to calculate.
3.
First of all, number of positions to be used for Remark. Then input the wavenumbers
for Remarks. It is possible to specify up to four positions.
4.
When the input ends, < OK > button is clicked. The dialog box in Figure 5-6 is
displayed, and the created peak table file is saved. The extension of the peak table file
is “.wdtp”.
5.
Clicking the <Save> button returns to the dialog box in Figure 5-2.
- 25 -
Figure 5-6. “Save Peak File” dialog box
5-6
<Detection> button
The peak detection is executed. The result is printed.
1.
The <Detection> button will be activated when all of Loading Peak Table and
Loading Sample file are done.
2.
The dialog box in Figure 5-7 opens.
Figure 5-7 print dialog box
3.
Click <Yes> button to printout a Report such as Figure 5-8. The program ends if
<No> button is clicked.
The procedure from which the calculation is executed is as follows.
(1) The peak of the sample spectrum is detected referring to the peak table.
(2) When the peak is not detected, the error message is actually displayed.
(3) The peak position is plotted on the screen.
(4) When <detection> is selected, a spectrum, scan parameters, and peak information
are printed such as Figure 5-8.
(5) Close the program clicking “Cancel” button once, and select [File]-[SaveAs] command
to save the spectrum with peak marks.
- 26 -
90
%T
75
60
45
906.48
30
540.03
3058.89
0
1600.81
2848.67
1027.99
15
-15
4500
4000
P o ly s ty re n e F ilm
File name
Sample Name
Scanned on
Resolution
Accumulation
Apodization:
3500
3000
2500
2000
1750
1500
1250
:C:¥Program Files¥Shimadzu¥IRsolution¥data¥kyokuhou¥Sample.smf
:PS1
Peak wavenumber
:2002/05/07 15:10:23
P1:542.0 5.5
:4 [1/cm]
P2:906.6 29.2
:20 Times
P3:1028.1 12.7
Happ-Genzel
P4:1601.0 4.2
P5:3060.2 2.0
P6:2849.9 8.8
Figure 5-8. Printed report example
- 27 -
1000
750
Remark wavenumber
M1:1750
M2:2250
500
1/cm
Chapter 6 How to use of the program.
- Alteration check program The Alteration check function is included in this program. The Alteration check function is a
program which checks whether this program is illegally altered.
6-1
Operation method
1. Select Alteration check from [Start]-[Program].
2. When “Shimadzu user authentication tool” is installed, Login dialog box of Figure 6-1 is
displayed. Input User ID and password. When the tool is not installed, the dialog in
Figure 6-2 is displayed.
Figure 6-1. “Log in” screen
3. “Alteration check program” screen in Figure 6-2 is displayed.
Figure 6-2 “Alteration check program” screen
4. Select “PharmaReport program”, and click < check > button.
5. When the screen in Figure 6-3 is displayed, click the < execution > button.
- 28 -
Figure 6-3. “Alteration check” screen
6. The Alteration check result is displayed in the dialog.
Figure 6-4. Check result
7. When < Note pad > button is clicked, the check result is displayed. It is possible to print
from this screen. The check result cannot be corrected.
Figure 6-5. Check result
- 29 -
206-95130A
IRsolution
日本薬局方対応
マクロプログラム
取扱説明書
Read this manual carefully before using this product.
Please keep this manual for future reference.
製品を使用される前にこの取扱説明書をよくお読みください。いつ
でも使用できるように大切に保管してください。
分析計測機器事業部
Copyright © 2002 株式会社 島津製作所
おことわり
(1)
本書の著作権は、株式会社 島津製作所が所有します。したがって、当社の許可なく内容の
一部または全部を転載・複製することはできません。
(2)
本書の内容は改良のため将来予告なしに変更されることがあります。
(3)
本書の内容は作成にあたり万全を期しておりますが、万一誤りや記載もれなどが発見されて
も、ただちに修正できないことがあります。
本書の内容による運用の結果の影響に関しては、責任を負いかねますのでご了承ください。
-2-
製品保証について
このたびは本製品をご購入いただきましたありがとうございます。
当社は本製品に対し、下記のとおり保証をいたします。
記
1.保証期間
据付けから起算して 1 年間といたします。ただし、日本国内に限ります。
2.保証内容
保証期間内に当社の責により故障が生じた場合は、その修理または部品の代替を無
償で行ないます。
3.保証除外事項
保証期間内であっても、下記に該当する故障の場合は保証の対象から除外させていた
だきます。
1. 誤ってお取り扱いになった場合
2. 当社または当社指定会社以外で修理や改造などが行われたことに起因する場合
3. 故障の原因が機器以外の理由による場合
4. 高温多湿、腐食性ガス、振動など過酷な環境条件の中でご使用になった場合
5. 火災、地震その他の天災地変による場合
6. いったん据付けた後、移動あるいは輸送された場合
7. 消耗品およびそれに順ずる部品
注)プログラムテープも消耗品です。
おことわり
(1)
本書の著作権は、株式会社 島津製作所が所有します。従って、当社の許可なく内容の一部また
は全部を転載・複製することはできません。
(2)
本書の内容は、改良のため将来予告なく変更されることがあります。
(3)
本書の内容は、作成にあたり万全を期してはおりますが、万一誤りや記載漏れが発見されても、直
ちに修正できないことがあります。
(4)
当製品の補修部品の供給期間は、製造打ち切り後 7 年としております。この供給期間以降は、補
修部品の供給にお応えできない場合がございますのであらかじめご了承ください。ただし、弊社純
正部品でないものは製造した会社の定める供給期間とさせていただきます。
-3-
安全にお使いいただくために
IRsolution 日本薬局方対応マクロプログラムは FTIR 制御用ソフトウェア IRsolution のオプション
プログラムです。本製品をお使いいただくために以下の点を厳守してください。
1.
上記以外の目的で使用しないでください。
2.
取扱説明書の手順に従ってください。取扱説明書に従わない場合は安全性が損なわれる恐れ
があります。
3.
警告、注意事項を守ってください。
4.
無断で改造をしないでください。
この取扱説明書では、警告内容を次のように規定しています。
警告
その事象を避けなければ、死亡、重傷、または中程度の傷害を負う可能性のある場合
に用いています。
注意
その事象を避けなければ、軽度の傷害を負う可能性のある場合、および物的傷害の可
能性のある場合に用いています。
注記
作業能率をよくしたり、記事の理解を助ける場合に用いています。
-4-
本書の使用ガイド
IRsolution ソフトウェア用日本薬局方対応マクロプログラムの取扱説明書は本書1冊の構成となっておりま
す。
本書では IRsolution ソフトウェアのオプション機能として提供される、日本薬局方対応マクロプログラム機能
について説明します。試料スペクトルの測定方法など、一般の IRsolution 操作に関しては、IRsolution ソフト
ウェアに付属の取扱説明書を参照してください。
-5-
目次
第1章
日本薬局方対応マクロプログラムの概要.......................................................................... 8
1-1
概要 ................................................................................................................................ 8
1-2
日本薬局方対応マクロプログラムが動作する環境............................................................ 8
第2章
セットアップ ...................................................................................................................... 9
2-1
員数の確認 ..................................................................................................................... 9
2-2
セットアップ ...................................................................................................................... 9
2-3
印刷テンプレート............................................................................................................ 10
2-4
注意事項 ....................................................................................................................... 10
2-4-1
スペクトルの選択 ................................................................................................... 10
2-4-2
印刷される測定パラメータ ...................................................................................... 11
第3章
プログラムの使い方− レポート作成機能 − ................................................................. 12
3-1
用意しなければならないデータ ....................................................................................... 12
3-2
プログラムの開始 .......................................................................................................... 12
3-3
プログラムの流れ .......................................................................................................... 13
3-4
Load Standard(標準スペクトル)ボタン.......................................................................... 14
3-5
Load Sample(試料スペクトル)ボタン ............................................................................ 14
3-6
ピーク波数テーブルファイル ........................................................................................... 15
3-6-1
Load Peak Table (ピーク波数テーブルファイルの読み込み) ................................ 15
3-6-2
Edit Peak Table (ピーク波数テーブルファイルの作成・編集) ................................ 15
3-7
Calculation(計算実行)ボタン ........................................................................................ 17
第4章
プログラムの使い方−スペクトル出力機能 −................................................................ 19
4-1
用意しなければならないデータ ....................................................................................... 19
4-2
プログラムの開始 .......................................................................................................... 19
4-3
プログラムの流れ .......................................................................................................... 20
4-4
操作方法 ....................................................................................................................... 20
第5章
プログラムの使い方−ピーク検出機能 −...................................................................... 23
5-1
用意しなければならないデータ ....................................................................................... 23
5-2
プログラムの開始 .......................................................................................................... 23
5-3
プログラムの流れ .......................................................................................................... 24
5-4
Load Sample(試料スペクトル)ボタン ............................................................................ 25
5-5
ピーク波数テーブルファイル ........................................................................................... 25
5-5-1
Load Peak Table (ピーク波数テーブルファイルの読み込み) ................................ 25
5-5-2
Edit Peak Table (ピーク波数テーブルファイルの作成・編集) ................................ 26
5-6
Detection(ピーク検出)ボタン ........................................................................................ 27
第6章
プログラムの使い方− 改ざんチェックプログラム − ...................................................... 29
-6-
6-1
操作方法 ....................................................................................................................... 29
-7-
第1章 日本薬局方対応マクロプログ
ラムの概要
概要
1-1
IRsolution 用日本薬局方対応マクロプログラムは、IRsolution ソフトウェア上で動作するオプションプロ
グラムとして供給されています。本プログラムには、以下の機能が含まれています。
1.
レポート作成機能
日本薬局方の「赤外吸収スペクトル測定法」に記載されている、標準品によるスペクトルの確
認方法に基づいた分析結果報告書を、IRsolution ソフトウェア上で作成する。
2.
スペクトル出力機能
日本薬局方の「赤外吸収スペクトル測定法」に記載されている、標準品によるスペクトルの確
認方法に基づいたスペクトル出力を IRsolution ソフトウェア上で作成する。
3.
ピーク検出機能
ピーク検出機能は、日本薬局方の「赤外吸収スペクトル測定法」に記載されている、ピーク検
出を行ない、出力を IRsolution ソフトウェア上で作成する。
1-2
日本薬局方対応マクロプログラムが動作する環境
1. IRsolution のバージョン
日本薬局方対応マクロプログラムは IRsolution Version 1.10 またはそれ以降のバージョンで動
作します。それよりも古いバージョンの IRsolution をご使用の場合は、弊社営業担当者にご連絡
の上、バージョンアップしてください。
2. マクロプログラムオプション
日本薬局方対応マクロプログラムは IRsolution ソフトウェアのマクロプログラムオプションを利用
して動作します。マクロプログラムオプションをインストールしていただかないと動作しません。もし、
マクロプログラムオプションをお持ちでない場合は、弊社営業担当者にご連絡の上、ご購入いた
だき、インストールしてください。
-8-
第 2 章 セットアップ
2-1
員数の確認
開梱したら以下のものがそろっていることを確認してください。
品名
日本薬局方対応マクロプログラム インストールディスク
P/N
個数
206-72488-91
1
206-95130
1
取扱説明書(本書)
2-2
セットアップ
この節では IRsolution ソフトウェアに日本薬局方対応マクロプログラムを追加する手順を説明します。プ
ログラムは弊社サービスマンによりあらかじめセットアップが行われている場合もあります。そのときは次の
「プログラムの使い方」にお進みください。
インストールの前に、ご使用のコンピュータに IRsolution ソフトウェアが正しくインストールされていること
をご確認ください。
1. インストールディスクをフロッピーディスクドライブに挿入します。
2. Windows のスタートボタンをクリックし、ファイル名を指定して実行を選択します。
3. ファイル名に”a:setup”と入力して<OK>ボタンをクリックします。
4. インストールプログラムが設定を行います。
5. 最後に<OK>ボタンをクリックし、インストールを終了します。
6. 『 日 本 薬 局 方 . l c m 』 が ”…¥Program files¥Shimadzu¥IRsolution¥macros” フ ォ ル ダ に
『Kyokuhou3.ptm』、『Kyokuhou2.ptm』、『Kyokuhou1NG.ptm』と『Kyokuhou1OK.ptm』
が”…¥Program files¥Shimadzu¥IRsolution¥PrintTemplates”フォルダにコピーされま
す。
-9-
印刷テンプレート
2-3
IRsolution が”c:¥ Program files¥Shimadzu¥IRsolution”にインストールされていない場合は、印刷
テ ン プ レ ー ト フ ァ イ ル を 修 正 し な け れ ば な り ま せ ん 。 『 Kyokuhou3.ptm 』 、 『 Kyokuhou2.ptm 』 、
『Kyokuhou1NG.ptm』と『Kyokuhou1OK.ptm』の 4 つのファイルについて、以下のように修正してくださ
い。
1.
一 旦 、 『 レ ポ ー ト 出 力 機 能 』 を 実 行 し 、 印 刷 画 面 で <No>ボ タ ン を ク リ ッ ク し ま す 。 こ れ に よ
り
、
”…..¥Program
files¥Shimadzu¥IRsolution¥data¥kyokuho¥report.txt”
と”report2.txt”が作成されます。
2.
IRsolution 上で、[印刷]タブをクリックします。
3.
[ファイル]-[開く]を選び、”Kyokuhou3.ptm”を開きます。
4.
評価結果テキストフレームを選択します。
5.
オブジェクトプロパティ(Object Properties)ウィンドウの”RTF Filename”欄に上記 1 で作成され
た”report.txt”または”report2.txt”を指定します。
6.
[ファイル]-[上書き保存]を選びます。
7.
その他の『Kyokuhou2.ptm』、『Kyokuhou1NG.ptm』と『Kyokuhou1OK.ptm』についても同
様に修正します。
注意事項
2-4
本プログラムを使用する際は以下の点にご注意ください。
2-4-1
スペクトルの選択
本プログラムでは、選択されたスペクトルファイルの中のアクティブポインタのついているデータを読み込
み計算に使用します。
IRsolution では、測定されたデータにベースライン補正やクベルクムンク変換などの各種データ処理を
行なった場合、データ処理結果は処理前のデータの子供としてファイルの中に保存されるツリー上のファイ
ル構造を持っています。複数のスペクトルがファイルの中に存在しますので、そのデータを代表するデータ
として、『アクティブポインタ』をつけ、ファイルを保存した場合に最初に表示するようになっています。本プロ
グラムではこのアクティブポインタのついているデータを使用して処理を行ないます。通常、最後に扱われ
たデータにアクティブポインタが設定されます。目的のデータにアクティブポインタが設定されていない場合
は、IRsolution でファイルを開き、ツリービュー上でマウスの右ボタンをクリックします。表示されるコンテキス
トメニューのアクティブポインタを選択し、そのままファイルを閉じてください。
- 10 -
図 2-1 ツリービューとアクティブポインタ
2-4-2
印刷される測定パラメータ
本プログラムで、測定された生データを用いた場合、レポートにスペクトルの測定パラメータが印刷されま
す。しかし、データ処理を行なったデータにアクティブポインタが設定されている場合は、測定パラメータは
印刷されず、空白となります。これは、データ処理をしたデータは、生データではないので測定パラメータを
もたないためです。
- 11 -
第 3 章 プログラムの使い方
− レポート作成機能 −
レポート作成機能は、日本薬局方の「赤外吸収スペクトル測定法」に記載されている、標準品によるスペ
クトルの確認方法に基づいた分析結果報告書を、IRsolution 上で作成するためのマクロプログラムです。
3-1
用意しなければならないデータ
標準スペクトルのデータ(透過率)
対応する試料スペクトルのデータ(透過率)
ピーク波数テーブル(このプログラムの中で作成できます)
注記
本プログラムでは、選択されたスペクトルファイルの中のアクティブポインタのついているデータを
読み込み計算に使用します。
本プログラムで、測定された生データを用いた場合、レポートにスペクトルの測定パラメータが印
刷されます。しかし、データ処理を行なったデータにアクティブポインタが設定されている場合は、
測定パラメータは印刷されず、
3-2
プログラムの開始
1. IRsolution を起動します。
2. [マクロ]タブをクリックして、マクロプログラミング画面を表示させます。
3. [マクロ]−[マクロコンテナを開く]を選び、” …:¥Program Files¥Shimadzu¥IRsolution¥Macros
¥日本薬局方.lcm”を選択します。マクロツールバーにプログラムが表示されます。
4. マクロツールバーの”日本薬局方.lcm”の下に表示されている”日本薬局方.bas”を選び、[マクロ]−
[実行]を選ぶとプログラムを実行します。
注 記
マクロツールバー上の
(実行)ボタンをクリックしても、プログラムは起動しませ
ん。
5. 図 3-1 のダイアログボックスが開きます。
図 3-1 プログラムの選択
- 12 -
ボタン
内容
Printout
スペクトル出力機能を開始します。
Peak Detection
ピーク検出機能を開始します。
Report
レポート作成機能を開始します。
6. そこで、<Report>ボタンをクリックすると、図 3-2 のダイアログボックスが開き、日本薬局方対応レポ
ート作成機能が開始します。
図 3-2 レポート作成機能初期画面
ボタン
3-3
内容
Load Standard
標準スペクトルを読み込みます。
Load Sample
試料スペクトルを読み込みます。
Load Peak Table
すでに作成されているピーク波数テーブルファイルを読み込みます。
Edit Peak Table
ピーク波数テーブルファイルを作成したり、編集したりします。
Calculation
レポート作成を実行します。
Exit
レポート作成を実行せずに、プログラムを終了します。
プログラムの流れ
このプログラムの操作の概要は以下のようになります。
1. <Load Standard>ボタンで標準スペクトルを読み込みます。
2. <Load Sample>ボタンで試料スペクトルを読み込みます。
3. <Load Peak Table>ボタンですでに作成されているピーク波数テーブルファイルを読み込むか、
<Edit Peak Table>ボタンでピーク波数テーブルファイルを作成します。
4. <Calculation>ボタンをクリックしてレポート作成を実行します。
- 13 -
3-4
Load Standard(標準スペクトル)ボタン
計算に必要な標準品ファイルを用意するためのボタンです。
1. <Load Standard>ボタンをクリックすると『Load Standard Spectrum』ダイアログボックスが開き
ます。
2. 標準試料スペクトルを選択して<開く>ボタンをクリックしてください。
3. <開く>ボタンをクリックすると、図 3-2 のダイアログボックスに戻ります。
図 3-3 『Load Standard Spectrum』ダイアログボックス
3-5
Load Sample(試料スペクトル)ボタン
計算に必要な試料ファイルを用意するためのボタンです。
1. <Load Sample>ボタンをクリックすると『Load Sample Spectrum』ダイアログボックスが開きま
す。
2. 試料スペクトルを選択して<開く>ボタンをクリックしてください。
3. <開く>ボタンをクリックすると、図 3-2 のダイアログボックスに戻ります。
図 3-4 『Load Sample Spectrum』ダイアログボックス
- 14 -
ピーク波数テーブルファイル
3-6
日本薬局方の「赤外吸収スペクトル測定法」記載の標準品によるスペクトルの確認方法に基づき、検出
するピーク波数は全部で 10 点まで指定することができます。また、透過率の比を評価するピークは、その中
から 4 点まで選択できます。このプログラムでは、これら多くの数値を毎回入力する手間を省くため、ピーク
波数のセットをデータファイルとして保存しておき必要に応じてそれを読み込んで使用しています。
図 3-2 で<Load Peak Table>ボタンをクリックするとすでに作成されているピーク波数テーブルファイル
を読み込むことができ、<Edit Peak Table>ボタンをクリックするとピーク波数テーブルファイルを作成したり、
編集したりできます。
Load Peak Table (ピーク波数テーブルファイルの読み込み)
3-6-1
図 3-2 で<Load Peak Table>ボタンをクリックするとすでに作成されているピーク波数テーブルファイル
を読み込むことができます。
1.
図 3-5 のダイアログボックスが開きます。
図 3-5 Load Peak Table ダイアログボックス
2.
ピーク波数テーブルファイルの拡張子は “.wdtr” です。
3.
<開く>ボタンをクリックすると、図 3-2 のダイアログボックスに戻ります。
4.
もちろん、あらかじめピーク波数テーブルのファイルは作成しておかなければなりませんが、同じ
データを計算ごとに再入力する手間がはぶけます。新規にテーブルを作成するには、次に説明
する<Edit Peak Table>ボタンを使用します。
3-6-2
Edit Peak Table (ピーク波数テーブルファイルの作成・編集)
図 3-2 で<Edit Peak Table>ボタンをクリックするとピーク波数テーブルファイルを作成したり、編集したり
できます。
1.
図 3-6 のダイアログボックスが開きます。
- 15 -
図 3-6 Edit Peak Information ダイアログボックス
2.
ピーク波数を『WaveNo.』欄に入力し、波数の許容範囲を『Tolerance』欄に入力します。10
個まで入力できます。計算に使用する波数の『Use』欄にチェックマークをつけます。波数が入
力されていても、チェックマークがついていないものは計算に使用されません。
3.
透過率比評価ピークを計算する場合は、まず、使うピーク波数の数を『Evaluation Peak
No.』に入力します。続いて、使用するピーク波数の番号を入力します。4 つまで指定できます。
ピーク比の許容範囲を『Tolerance』欄に入力します。
4.
入力が終了したら、<OK>ボタンをクリックします。図 3-7 のダイアログボックスが表示され、作成
したピーク波数テーブルファイルを保存します。ピーク波数テーブルファイルの拡張子は
“.wdtr” です。
5.
<保存>ボタンをクリックすると、図 3-2 のダイアログボックスに戻ります。
図 3-7 Save Peak File ダイアログボックス
- 16 -
3-7
Calculation(計算実行)ボタン
計算を実行し、判定を行ないます。結果は画面およびプリンタに出力されます。
1.
標準スペクトルの読み込み(Load Standard)、試料スペクトルの読み込み(Load Sample)、ピー
ク波数テーブルファイルの読み込み(Load Peak Table)または作成(Edit Peak Table)がされる
と、<Calculation>ボタンが有効になります。
2.
<Calculation>ボタンをクリックすると以下の手順で計算が実行されます。
① ピーク波数テーブルを参照して、標準品スペクトルのピークを検出します。
② 実際に検出された標準品スペクトルのピーク波数を参照して、試料スペクトルのピークを検
出します。
③ 標準品スペクトルと試料スペクトルの、対応するピーク波数の誤差を計算します。
④ 試料スペクトルの、選択された評価用ピークにおける透過率から評価ピーク透過率比を算
出します。
⑤ 標準品スペクトルの、選択された評価用ピークにおける透過率から評価ピーク透過率比を
算出します。
⑥ ④の⑤に対する比を評価値として算出します。
⑦ ③と⑥の結果を画面に出力します。このとき、波数誤差が許容範囲(Tolerance)を越える
もの、および⑥の評価値が許容範囲(Tolerance)を逸脱するものについては、”NG”となり
ます。
⑧ すべての箇所で⑦の基準を逸脱しなかったとき、総合評価を”OK”とします。もし一箇所で
も”NG”となったものがあれば総合評価結果は”NG”となります。
3.
スペクトルと総合評価結果(”OK”または”NG”)をメッセージ出力します。
図 3-8 評価
4.
<OK>ボタンをクリックすると、図 3-9 のダイアログボックスが開きます。
図 3-9 印刷ダイアログボックス
5.
<Yes>ボタンをクリックするとプリンタ出力が実行され図 3-10 のようなレポートが出力され、<No>
- 17 -
ボタンをクリックするとそのままプログラムは終了します。
レポート作成日時:
レポート作成者:
2003/08/07 06:21:36
島津
OK!
9 0
% T
7 5
6 0
4 5
906.58
3 0
1028.10
|
C
|
B
540.09
3060.20
0
1600.99
2849.95
1 5
|
A
- 1 5
4 0 0 0
F T IR
3 5 0 0
M e a s u re m e n t
3 0 0 0
2 5 0 0
2 0 0 0
1 7 5 0
1 5 0 0
1 2 5 0
1 0 0 0
7 5 0
5 0 0
1 / c m
C:¥Program Files¥Shimadzu¥IRsolution¥data¥kyokuhou¥Sample.smf
測定日
: 2003/08/07 15:25:20
積算
: 20 回
分解
: 4 [1/cm]
アポダイズ関数 : Happ-Genzel
9 0
% T
7 5
6 0
4 5
906.58
3 0
1028.10
|
C
|
B
542.02
3060.20
0
1600.99
2849.95
1 5
|
A
- 1 5
4 0 0 0
F T IR
3 5 0 0
M e a s u re m e n t
3 0 0 0
2 5 0 0
2 0 0 0
1 7 5 0
1 5 0 0
1 2 5 0
1 0 0 0
7 5 0
5 0 0
1 / c m
C:¥Program Files¥Shimadzu¥IRsolution¥data¥kyokuhou¥STD.smf
測定日
: 2003/08/07 14:50:30
積算
: 20 回
分解
: 4 [1/cm]
アポダイズ関数 : Happ-Genzel
ピーク位置
試料
(cm-1)
A_P1
540.1
__P2
906.6
B_P3 1028.1
C_P4 1601.0
__P5 3060.2
__P6 2849.9
ピーク比
試料
A/B
1.4584
A/C
0.9514
B/C
0.6524
(%T)
5.0
29.4
12.8
4.3
2.0
8.8
標準品
(cm-1)
542.0
906.6
1028.1
1601.0
3060.2
2849.9
(%T)
5.5
29.2
12.7
4.2
2.0
8.8
標準品
1.4031
0.9150
0.6522
許容値
(cm-1)
5.00
5.00
5.00
5.00
5.00
5.00
誤差
(cm-1)
0.36
0.00
0.00
0.00
0.00
0.00
許容値
1+/-0.3
1+/-0.3
1+/-0.3
不一致度
1.0394
1.0397
1.0003
図 3-10 プリンタ出力の例
出力結果は、測定パラメータと「OK」か「NG」の判定結果、標準品および試料のスペクトル、および計算
結果の表からなります。
検出したピークと評価のために選択されたピークを示すマーカーが表示されます。
計算結果は、上段に検出したピークを、試料および標準品について波数、透過率で示してあります。右
端の列は誤差です。[試料のピーク波数]−[標準品のピーク波数]で計算され、許容値内なら合格となりま
す。
下段は、各評価ピークにおける強度比を、これも試料および標準品について示してあります。右端の列
は、不一致度です。[試料のピーク比]/[標準品のピーク比]で計算され、許容値内なら合格となります。
- 18 -
第 4 章 プログラムの使い方
−スペクトル出力機能 −
スペクトル出力機能は、日本薬局方の「赤外吸収スペクトル測定法」に記載されている、標準品によるス
ペクトルの確認方法に基づいたスペクトル出力を IRsolution 上で作成するためのマクロプログラムです。
4-1
用意しなければならないデータ
試料スペクトルのデータ(透過率)
対応する標準スペクトルのデータ(透過率)
注記
本プログラムでは、選択されたスペクトルファイルの中のアクティブポインタのついているデータを
読み込み計算に使用します。
本プログラムで、測定された生データを用いた場合、レポートにスペクトルの測定パラメータが印
刷されます。しかし、データ処理を行なったデータにアクティブポインタが設定されている場合は、
測定パラメータは印刷されず、
4-2
プログラムの開始
1.
IRsolution を起動します。
2.
[マクロ]タブをクリックして、マクロプログラミング画面を表示させます。
3.
[ マ ク ロ ] − [ マ ク ロ コ ン テ ナ を 開 く ] を 選 び 、 ”
… :¥Program
Files¥Shimadzu¥IRsolution¥Macros¥日本薬局方.lcm”を選択します。マクロツールバーにプロ
グラムが表示されます。
4.
マクロツールバーの”日本薬局方.lcm”の下に表示されている”日本薬局方.bas”を選び、[マクロ]−
[実行]を選ぶとプログラムを実行します。
注 記
マクロツールバー上の
(実行)ボタンをクリックしても、プログラムは起動しませ
ん。
5.
図 4-1 のダイアログボックスが開きます。
図 4-1 プログラムの選択
- 19 -
ボタン
6.
4-3
内容
Printout
スペクトル出力機能を開始します。
Peak Detection
ピーク検出機能を開始します。
Report
レポート作成機能を開始します。
そこで、<Printout>ボタンをクリックします。
プログラムの流れ
このプログラムの操作の概要は以下のようになります。
1. 標準スペクトルを読み込みます。
2. 試料スペクトルを読み込みます。
3. レポートの印刷をします。
4-4
操作方法
1. 図 4-1 で、<Printout>ボタンをクリックします。
2. 図 4-2 のダイアログボックスが開きます。
図 4-2 Load Standard Spectrum ダイアログボックス
3. 標準スペクトルを選んで<開く>ボタンをクリックします。
4. 図 4-3 のダイアログボックスが開きます。
- 20 -
図 4-3 Load Sample Spectrum ダイアログボックス
5. 試料スペクトルを選んで<開く>ボタンをクリックします。
6. 図 4-4 のダイアログボックスが開きます。
図 4-4 印刷ダイアログボックス
7. <Yes>ボタンをクリックするとプリンタ出力が実行され図 4-5 のようなレポートが出力され、<No>ボタ
ンをクリックするとそのままプログラムは終了します。
- 21 -
レポート作成日時:
レポート作成者:
2003/08/07 06:21:36
島津
90
%T
80
70
60
50
40
30
20
10
0
4500
4000
P o ly s ty re n e F ilm
ファイル名
試料名
測定日
3500
3000
2500
2000
1750
1500
1250
1000
750
500
1/cm
750
500
1/cm
: C:¥Program Files¥Shimadzu¥IRsolution¥data¥kyokuhou¥Sample.smf
: PS1
分解
: 4 [1/cm]
: 2003/08/07 15:25:20
積算
: 20 回
アポダイズ関数
: Happ-Genzel
90
%T
80
70
60
50
40
30
20
10
0
4500
4000
P o ly s ty re n e F ilm
ファイル名
試料名
測定日
3500
3000
2500
2000
1750
1500
1250
1000
: C:¥Program Files¥Shimadzu¥IRsolution¥data¥kyokuhou¥STD.smf
: PS2
分解
: 4 [1/cm]
: 2003/08/07 14:50:30
積算
: 20 回
アポダイズ関数 : Happ-Genzel
図 4-5 プリンタ出力の例
- 22 -
第 5 章 プログラムの使い方
−ピーク検出機能 −
ピーク検出機能は、日本薬局方の「赤外吸収スペクトル測定法」に記載されている、ピーク検出を行ない
出力を IRsolution ソフトウェア上で作成するためのマクロプログラムです。
5-1
用意しなければならないデータ
試料スペクトルのデータ(透過率)
ピーク波数およびマーク波数テーブル(このプログラムの中で作成できます)
注記
本プログラムでは、選択されたスペクトルファイルの中のアクティブポインタのついているデータを
読み込み計算に使用します。
本プログラムで、測定された生データを用いた場合、レポートにスペクトルの測定パラメータが印
刷されます。しかし、データ処理を行なったデータにアクティブポインタが設定されている場合は、
測定パラメータは印刷されず、
5-2
プログラムの開始
1. IRsolution を起動します。
2. [マクロ]タブをクリックして、マクロプログラミング画面を表示させます。
3. [ マ ク ロ ] − [ マ ク ロ コ ン テ ナ を 開 く ] を 選 び 、 ”
… :¥Program
Files¥Shimadzu¥IRsolution¥Macros¥日本薬局方.lcm”を選択します。マクロツールバーにプロ
グラムが表示されます。
4. マクロツールバーの”日本薬局方.lcm”の下に表示されている”日本薬局方.bas”を選び、[マクロ]−
[実行]を選ぶとプログラムを実行します。
注 記
マクロツールバー上の
(実行)ボタンをクリックしても、プログラムは起動しませ
ん。
5. 図 5-1 のダイアログボックスが開きます。
- 23 -
図 5-1 プログラムの選択
ボタン
内容
Printout
スペクトル出力機能を開始します。
Peak Detection
ピーク検出機能を開始します。
Report
レポート作成機能を開始します。
6. そこで、<Peak Detection>ボタンをクリックすると、図 5-2 のダイアログボックスが開き、日本薬局方対
応ピーク検出機能が開始します。
図 5-2 ピーク検出機能初期画面
ボタン
5-3
内容
Load Sample
試料スペクトルを読み込みます。
Load Peak Table
すでに作成されているピーク波数テーブルファイルを読み込みます。
Edit Peak Table
ピーク波数テーブルファイルを作成したり、編集したりします。
Detection
ピーク検出を実行します。
Exit
ピーク検出を実行せずに、プログラムを終了します。
プログラムの流れ
このプログラムの操作の概要は以下のようになります。
1. 試料スペクトルを読み込みます。
2. <Load Peak Table>ボタンですでに作成されているピーク波数テーブルファイルを読み込むか、
<Edit Peak Table>ボタンでピーク波数テーブルファイルを作成します。
3. <Detection>ボタンをクリックしてピーク検出を実行し結果を印刷します。
- 24 -
5-4
Load Sample(試料スペクトル)ボタン
計算に必要な試料ファイルを用意するためのボタンです。
1. <Load Sample>ボタンをクリックすると『Load Sample Spectrum』ダイアログボックスが開きま
す。
2. 試料スペクトルを選択して<開く>ボタンをクリックしてください。
3. <開く>ボタンをクリックすると、図 5-2 のダイアログボックスに戻ります。
図 5-3 『Load Sample Spectrum』ダイアログボックス
ピーク波数テーブルファイル
5-5
日本薬局方の「赤外吸収スペクトル測定法」記載の標準品によるスペクトルの確認方法に基づき、検出
するピーク波数は全部で 10 点まで指定することができます。また、4 つのマーク波数を入力することができ
ます。
次にファイルの保存を行ないますこのプログラムでは、これら多くの数値を毎回入力する手間を省くため、
ピーク波数のセットをデータファイルとして保存しておき必要に応じてそれを読み込んで使用しています。
図 5-2 で<Load Peak Table>ボタンをクリックするとすでに作成されているピーク波数テーブルファイル
を読み込むことができ、<Edit Peak Table>ボタンをクリックするとピーク波数テーブルファイルを作成したり、
編集したりできます。
Load Peak Table (ピーク波数テーブルファイルの読み込み)
5-5-1
図 5-2 で<Load Peak Table>ボタンをクリックするとすでに作成されているピーク波数テーブルファイル
を読み込むことができます。
1.
図 5-4 のダイアログボックスが開きます。
- 25 -
図 5-4 Load Peak Table ダイアログボックス
2.
ピーク波数テーブルファイルの拡張子は “.wdtp” です。
3.
<開く>ボタンをクリックすると、図 5-2 のダイアログボックスに戻ります。
4.
もちろん、あらかじめピーク波数テーブルのファイルは作成しておかなければなりませんが、同じ
データを計算ごとに再入力する手間がはぶけます。新規にテーブルを作成するには、次に説明
する<Edit Peak Table>ボタンを使用します。
Edit Peak Table (ピーク波数テーブルファイルの作成・編集)
5-5-2
図 5-2 で<Edit Peak Table>ボタンをクリックするとピーク波数テーブルファイルを作成したり、編集したり
できます。
1.
図 5-5 のダイアログボックスが開きます。
図 5-5 Edit Peak W.No.ダイアログボックス
2.
ピーク波数を『WaveNo.』欄に入力します。10 個まで入力できます。計算に使用する波数の
『Use』欄にチェックマークをつけます。波数が入力されていても、チェックマークがついていない
ものは計算に使用されません。
- 26 -
3.
ピーク検出をする必要はないが、書き出したいマーク波数がある場合は、まずマークする波数の
数を『Marker W.No.』に入力します。続いて、マークする波数を入力します。4 つまで指定できま
す。
4.
入力が終了したら、<OK>ボタンをクリックします。図 5-6 のダイアログボックスが表示され、作成し
たピーク波数テーブルファイルを保存します。ピーク波数テーブルファイルの拡張子は “.wdtp”
です。
5.
<保存>ボタンをクリックすると、図 5-2 のダイアログボックスに戻ります。
図 5-6 Save Peak File ダイアログボックス
5-6
Detection(ピーク検出)ボタン
ピーク検出を実行します。結果は画面およびプリンタに出力されます。
1.
試料スペクトルの読み込み(Load Sample)、ピーク波数テーブルファイルの読み込み(Load
Peak Table)または作成(Edit Peak Table)がされると、<Detection>ボタンが有効になりま
す。
2.
図 5-7 のダイアログボックスが開きます。
図 5-7 印刷ダイアログボックス
3.
<Yes>ボタンをクリックするとプリンタ出力が実行され図 5-8 のようなレポートが出力され、<No>
ボタンをクリックするとそのままプログラムは終了します。
- 27 -
計算が実行される手順は次の通りです。
① ピーク波数テーブルを参照して、試料スペクトルのピークを検出します。
② 実際にはピークが検出されなかった場合、エラーメッセージを表示します。
③ ピーク位置を画面上にプロットします。
④ 実行を選択した場合、プリンタへスペクトル、スペクトル情報、ピーク情報を出力します(図 5-8)。
⑤ プリンタ出力が終わると、メイン画面に戻ります。
⑥ ピークやマーク位置の入ったスペクトルを保存したい場合は、「キャンセル」ボタンをクリックして
プログラムをいったん終了し、IRsolution の [ファイル] メニューの[保存] または [名前をつ
けて保存] を使用してください。
90
%T
75
60
45
906.48
30
540.03
3058.89
0
1600.81
2848.67
1027.99
15
-15
4500
4000
P o ly s ty re n e F ilm
3500
3000
2500
2000
1750
ファイル名 : C:¥Program Files¥Shimadzu¥IRsolution¥data¥kyokuhou¥Sample.smf
試料
: PS1
測定日 : 2002/05/07 15:10:23
分解
: 4 [1/cm]
積算
: 20 回
アポダイズ関数 : Happ-Genzel
図 5-8 プリンタ出力の例
- 28 -
1500
1250
ピーク波数
P1:542.0 5.5
P2:906.6 29.2
P3:1028.1 12.7
P4:1601.0 4.2
P5:3060.2 2.0
P6:2849.9 8.8
1000
750
マーク波数
M1:1750
M2:2250
500
1/cm
第 6 章 プログラムの使い方
− 改ざんチェックプログラム −
本プログラムには、改ざんチェック機能が含まれています。改ざんチェック機能は、本プログラムが不正に
改ざんされていないかかを点検するプログラムです。
6-1
操作方法
1. [スタート]−[プログラム]−[IRsolution]−[改ざんチェックソフトウェア]と選びます。
2. 『島津ユーザー認証ツール』がインストールされている場合は、図 6-1 のログインダイアログが表示され、
登録されているユーザーID とパスワードでログインします。『島津ユーザー認証ツール』がインストール
されていない場合は、表示されずに図 6-2 に進みます。
図 6-1 ログイン画面
3. 図 6-2 の『プログラム改ざんチェック』画面が表示されます。
図 6-2 プログラム改ざんチェック画面
4. 『日本薬局方マクロプログラム』を選び、<チェック>ボタンをクリックします。
5. 図 6-3 の画面が表示されるので、<実行>ボタンをクリックします。
- 29 -
図 6-3 プログラム改ざんチェック画面
6. 改ざんチェック結果がダイアログ上に表示されます。
図 6-4 チェック結果
7. <メモ帳>ボタンをクリックすると、チェック結果が表示されます。この画面から印刷することができます。
なお、チェック結果を修正することはできません。
図 6-5 チェック結果
- 30 -