1
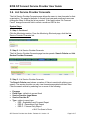
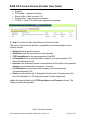
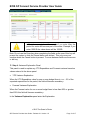
EMPLOYMENT ONTARIO INFORMATION SYSTEM EOIS EOIS Service Provider Connect Service Provider User Guide Chapter 3: Monitoring Version: 1.0 June, 2015 EOIS SP Connect Service Provider User Guide Document History Version # 1.0 Date Description June 15, 2015 Initial version for June 2015 release 2015 The Queen’s Printer SPC Service Provider User Guide - Release 2.1 Version 1.0 Page 2 of 17 EOIS SP Connect Service Provider User Guide TABLE OF CONTENTS Document History...................................................................................................... 2 3 Service Provider Monitoring ............................................................................... 4 3.1. Introduction ..................................................................................................... 4 3.2. Roles and Responsibilities ............................................................................ 4 3.3. Monitoring ....................................................................................................... 4 3.4. Dashboard - Service Provider Forecasts Panel ........................................... 5 3.5. Monitoring Section.......................................................................................... 7 3.6. List Service Provider Forecasts .................................................................... 8 3.7. View and Complete Service Provider Forecasts (EER) ............................. 10 3.8. Submit Service Provider Forecast (EER) .................................................... 16 3.9. Generate Reports .......................................................................................... 16 2015 The Queen’s Printer SPC Service Provider User Guide - Release 2.1 Version 1.0 Page 3 of 17 EOIS SP Connect Service Provider User Guide 3 Service Provider Monitoring 3.1. Introduction Servicer provider reporting is part of agreement monitoring activity and is located in Monitoring section of SP Connect. The system further groups the expenditure and forecast reports i.e. Estimate of Expenditure Report EER, under the term forecasts and the system page name for the EER is called Service Provider Forecast. At the beginning of the program cycle the ministry defines the reporting requirements for each program and set up in SP Connect the individual report formats and key dates related to the when the report will be available to service providers and when it is due. Once a report has reached its release date it will appear on the service provider user Dashboard. If an EER is required, one must be completed for each site within the agreement. For agreements with multiple funded sites separate forecasts for each are required to be completed. This chapter provides service provider users with an overview of the process and system steps to complete and submit expenditure and forecast reports. 3.2. Roles and Responsibilities The following table lists the actions that a service provider user role can perform. Functionality List Reports View Reports Update Reports Submit Reports Generate Report Service Provide Administrator (SPA) X X X X Service Provide Submission Authority (SPSA) X X X X X 3.3. Monitoring Once the EER release date has occurred the report will display on the service provider users Dashboard in the Service Provider Forecast panel. This is the most efficient way to access the report. Each site in the agreement will have a separate 2015 The Queen’s Printer SPC Service Provider User Guide - Release 2.1 Version 1.0 Page 4 of 17 EOIS SP Connect Service Provider User Guide report. The EER reports can also be access via the Monitoring section List Service Provider Forecasts link. Service Provider E-mail Notification: The system will send an automatic notification e-mail to service providers when an EER is released and the due date has passed. The email will be sent to the email address/es shown in the Service Provider page - Corporate Details panel. 3.4. Dashboard - Service Provider Forecasts Panel The Service Provider Forecast panel of the Dashboard displays a list of EERs that need to be actioned. Only EERs associated to the service provider will be displayed. System Steps Step 1: Dashboard On the Dashboard, go to the Service Provider Forecast panel to view all EERs that are due. Step 2: Service Provider Forecast panel The Service Provider Forecast panel contains the following information: Site – The service delivery site which is hyperlinked to provide quick access to open the specific EER page Program – Program name Name – Name of report Service Provider – Legal name of the service provider Due Date – Date forecast is due Date Submitted – Date forecast was submitted Days Overdue – Number of days past the due date o will only be calculated for records with status of Open 2015 The Queen’s Printer SPC Service Provider User Guide - Release 2.1 Version 1.0 Page 5 of 17 EOIS SP Connect Service Provider User Guide o based on the number of business days from the current system date minus the service provider forecast due date Status – Current status of the forecast (the system only displays forecasts in “Open” and “Pending Resubmission” status) The list can be sorted by clicking on the column heading. Service Provider Forecast Statuses Status Open Submitted Pending Resubmission Confirmed Description The forecast/report has been released to the service provider but has not yet been submitted The forecast/report was submitted. The forecast/report has been returned to the service provider for resubmission. The ministry has confirmed the forecast/report Step 3: Service Provider Forecast Click on the Site link to open the Service Provider Forecast detail page 2015 The Queen’s Printer SPC Service Provider User Guide - Release 2.1 Version 1.0 Page 6 of 17 EOIS SP Connect Service Provider User Guide The system will only display records where the current system date is greater or equal to the forecast/EER release date. 3.5. Monitoring Section Within the Monitoring section, a service provider can access a list of past and current forecasts, and generate reports. System Steps Step 1: Dashboard Click the Monitoring section. This will open the Monitoring Shortcuts page. Click List Service Provider Forecasts to view a list of past and current forecasts. Click Generate Reports to view the Service Provider Forecast Completion Report. Each of these processes will be covered in the following sections. 2015 The Queen’s Printer SPC Service Provider User Guide - Release 2.1 Version 1.0 Page 7 of 17 EOIS SP Connect Service Provider User Guide 3.6. List Service Provider Forecasts The List Service Provider Forecasts page allows the users to view forecasts for their organization. The page list defaults to current fiscal year and month and users can change the filters to refine the list as needed. If the results show “No Forecast Found” change the month field to reflect a month an EER is due. System Steps Step 1: Dashboard Click the Monitoring section. From the Monitoring Shortcuts page, click the List Service Provider Forecasts link. Step 2: List Service Provider Forecasts The List Service Provider Forecasts page has two panels: Search Criteria and List Service Provider Forecasts. Step 3: List Service Provider Forecasts The Search Criteria panel shows a number of filters to assist with refining your search. The service provider can only view forecasts associated with their sites. Filter the search criteria by selecting one or more of the following: Program Fiscal Year - defaults to current fiscal Service Provider Legal Name Service Provider ID Type - refers to report type o EER - Expenditure and Forecast Report o EER-E - Expenditure Only Report o EER-F - Forecast Only Report 2015 The Queen’s Printer SPC Service Provider User Guide - Release 2.1 Version 1.0 Page 8 of 17 EOIS SP Connect Service Provider User Guide Status - see below chart for description of each Month Due - Default to current Month Click Search to begin. The system will display all records associated with the filtered search criteria. If you want to begin another search, click Clear to start over. Step 4: List Service Provider Forecasts The search results will appear in the List Service Provider Forecasts panel. The following columns are displayed: Site – the service delivery site for which the report is related to Program Type – reporting type Name – name and period of reporting Service Provider - Legal name of service provider Status – current status of service provider forecast Due Date – date the service provider forecast is due The list can be sorted by clicking on the column headings. Click the Site link to open the specific forecast / EER. Service Provider Forecast Statuses Status Open Description The forecast/report has been released to the service provider but has not yet been submitted 2015 The Queen’s Printer SPC Service Provider User Guide - Release 2.1 Version 1.0 Page 9 of 17 EOIS SP Connect Service Provider User Guide Status Submitted Pending Resubmission Confirmed Description The forecast/report was submitted. The forecast/report has been returned to the service provider for resubmission. The ministry has confirmed the forecast/report Step 4: List Service Provider Forecast Detail 3.7. View and Complete Service Provider Forecasts (EER) The Service Provider Administrator (SPA) can complete the EER but only the Service Provider Submission Authority (SPSA) can submit reports to the ministry. The Service Provider Forecast page provides users with access to the individual site EERs. From this page user can complete the report and if the user is an SPSA the user will have an option to submit the report. The page contains a number of panels which must be completed as part of the submission. The panels will be explained as separate steps. This section of the guide show the process to view, compete and update the service provider forecast report (i.e. EER) that is in Open or Pending Resubmission status. Once the forecast is submitted the page will display as read only. The below steps display the screen view for a standard EER which includes both expenditures and forecasts. The EERE – Expenditure Only Report and EERF – Forecast Only Report will display differently. 2015 The Queen’s Printer SPC Service Provider User Guide - Release 2.1 Version 1.0 Page 10 of 17 EOIS SP Connect Service Provider User Guide System Steps Step 1: Dashboard From the Dashboard - Service Provider Forecast panel section 3.4 or from the List Service Provider Forecasts section 3.6, select the EER to be viewed. The page name contains the site number, for example “Service Provider Forecast 2222A”. There are seven distinct panels displayed and the main panels related to the EER financial details will be explained as a separate step. Service Provider Forecast Details Service Provider Expenditures and Forecast Variance Explanation Other Revenue Gross Surplus / Deficit Analysis Net Surplus / Deficit Analysis Status History Step 2: Service Provider Forecast Click the Service Provider Forecast Details panel. The information displayed includes the following: Reporting Period - displays the period of the report Service Provider Site ID Due Date – when report is due to the ministry 2015 The Queen’s Printer SPC Service Provider User Guide - Release 2.1 Version 1.0 Page 11 of 17 EOIS SP Connect Service Provider User Guide Program PO Number – Agreement Number Status (refer to table in section 3.6) Release Date – date the report is released TP Office –Local ETD office where agreement is managed Step 3: Service Provider Expenditures and Forecast Panel This panel contains the site allocation, expenditure and forecast details and the columns include: Budget Lines for specific program Allocation as per the time the report was submitted YTD Expenditures for the reporting period of the EER % Expended field is a calculated field rounded to zero decimal places (YTD Expenditure/Allocation)*100 Forecast is the estimated forecast of expenditures until the end of the agreement Variance is a calculated field (Allocation – Forecast) % Of Allocation is a calculated field rounded to zero decimal places (Forecast/Allocation)*100 Totals row will calculate the % Expended Variance and % Allocation using the sum of the allocations, YTD expenditures and Forecast respectively. Update the required fields in the YTD Expenditures and Forecast columns. The variance columns will populate. 2015 The Queen’s Printer SPC Service Provider User Guide - Release 2.1 Version 1.0 Page 12 of 17 EOIS SP Connect Service Provider User Guide Only whole numbers can be entered. If you enter a “period” it will not be accepted and the numbers you enter after the period for cents will become part of the entre. Example if you enter 1000.00 the value shown will be 100000. Note: Do not use the Enter key when completing the fields as the use of this key will prompt the system to think the Cancel button was clicked. This only occurs on screens where the Cancel button is present. To move between fields use the mouse or tab key. Step 4: Variance Explanation Panel This panel is used to explain any YTD Expenditure and Forecast variance based on values entered in the above panel. YTD Variance Explanation When the YTD Expenditure value for one or more budget lines is + or – 5% of the expected expenditure for the period, the field will become mandatory. Forecast Variance Explanation When the Forecast value for one or more budget lines is less than 98% or greater than100% this field will become mandatory. In the Variance Explanation panel enter the Explanation. 2015 The Queen’s Printer SPC Service Provider User Guide - Release 2.1 Version 1.0 Page 13 of 17 EOIS SP Connect Service Provider User Guide Step 5: Other Revenue Panel Other Revenue includes Interest Earned and Disposition of Assets. Total is an automatically calculated field. The field defaults to blank and must be completed. In the Other Revenue panel, enter the Interest Earned (G), and Disposition of Assets (both mandatory fields). Step 6: Gross Surplus/Deficit Analysis Panel This panel is read-only and displays the following fields: Ministry Funding Received – for the reporting period YTD Expenditure – based on values entered in above panel Gross Surplus or Deficit - the name will be customized base on whether there is a surplus or deficit. Percentage Gross Surplus or Deficit - calculated field (Ministry Funding Received – YTD Expenditures). Percentage Gross Surplus (or Percentage Gross Deficit) is a calculated field. Rounded to zero decimal places (Gross Surplus/Ministry Funding Received)*100. Step 7: Net Surplus/Deficit Analysis Panel This panel is read only and displays the following fields: Gross Surplus - as per above panel 2015 The Queen’s Printer SPC Service Provider User Guide - Release 2.1 Version 1.0 Page 14 of 17 EOIS SP Connect Service Provider User Guide Total Other Revenue - from value entered in panel Net Surplus or Deficit - the name will be customized base on whether there is a surplus or deficit. Net Surplus (or Net Deficit) is a calculated field. (Gross Surplus + Interest Earned + Disposition of Assets). Once the service provider has completed the forecast input, they can either Save it to review later or Submit Forecast. The submit process will be covered in section 3.8. Only the SPSA user will see the Submit Forecast button. Status History panel The Status History panel displays the Date Time, Status and the Created by for each time the forecast status is changed. 2015 The Queen’s Printer SPC Service Provider User Guide - Release 2.1 Version 1.0 Page 15 of 17 EOIS SP Connect Service Provider User Guide 3.8. Submit Service Provider Forecast (EER) Only a Service Provider Submission Authority can submit a forecast. This procedure is followed once the forecast is completed and ready for submission to the Ministry. If a EER has been submitted and the service provider realizes a change is needed, they will need to contact the local office and request that the submission be rejected. Once the ETC returns the EER the status will change to Pending Resubmission which will allow it to be updated and resubmitted. Once a forecast is in confirmed status it cannot be changed. Repeat steps 1 to 5 in section 3.7 to update Service Provider Forecasts. Step 1: Net Surplus/Deficit Analysis panel Ensure the above panels are completed and click Submit Forecast to submit the forecast to the Ministry. Once a forecast is submitted the status will be updated to Submitted. 3.9. Generate Reports The Monitoring section contains access to the Service Provider Forecast Completion Report. This report contains information on the EER completion activity including number in open status, late, submitted and pending resubmission. The Service Provider Forecast Completion Report search values, defaulted to current month but can be filtered as required. System Steps Step 1: Monitoring 2015 The Queen’s Printer SPC Service Provider User Guide - Release 2.1 Version 1.0 Page 16 of 17 EOIS SP Connect Service Provider User Guide Click the Generate Reports link from the Monitoring Shortcuts panel. Step 2: Generate Reports From the Payment Report panel enter the following fields: Report Type Program – defaults to blank which will include all programs (recommended that user enter a program type) Fiscal Year – defaults to current fiscal year Month – defaults to current month Click Generate PDF to open and view the report. The report will be opened as a PDF and users can view the details. The report can be saved using the standard PDF save functions. 2015 The Queen’s Printer SPC Service Provider User Guide - Release 2.1 Version 1.0 Page 17 of 17