1
Copyright © 1992 by Environmental Systems Research Institute, Inc.
All Rights Reserved.
Printed in the United States of America.
The information contained in this document is the exclusive property of Environmental Systems Research
Institute, Inc. This work is protected under United States Copyright Law and other international copyright
treaties and conventions. No part of this work may be reproduced or transmitted in any form or by any means,
electronic or mechanical, including photocopying and recording, or by any information storage or retrieval
system, except as expressly permitted in writing by Environmental Systems Research Institute, Inc. All
requests should be sent to Environmental Systems Research Institute, Inc., 380 New York Street, Redlands, CA
92373 USA Attention: Contracts Manager.
The information contained in this document is subject to change without notice.
DISCLAIMER
Information has been obtained from sources believed to be reliable, but
its accuracy and completeness, and the opinions based thereon, are not
guaranteed. As every effort is made to provide accurate information in
this database, ESRI would appreciate it if Licensees could call to our
attention any errors that may occur by communicating with ESRI.
E S R I i s n o t i n v i t i n g r e l i a n c e o n this data, and the Licensee should
always check actual data. The information herein is subject to change.
U.S. GOVERNMENT LIMITED RIGHTS
Use, duplication, and disclosure by the Government is subject to
FAR § 52.227-14 (JUN 1987) OR DFARS § 252.227-7013 (OCT 1988), as applicable.
Contractor/Manufacturer is Environmental Systems Research Institute, Inc., 380 New
York Street, Redlands, CA USA 92373.
ESRI, ARC/INFO, and PC ARC/INFO are registered trademarks of Environmental Systems Research Institute, Inc.,
Redlands, CA USA.
ArcCAD, ArcUSA, ArcView, ArcWorld, ARC/INFO COGO, ARC/INFO GRID, ARC/INFO NETWORK, ARC/INFO TIN,
ARC Macro Language (AML), ARCSHELL, DATABASE INTEGRATOR, IMAGE INTEGRATOR, PC ARCEDIT, PC
ARCPLOT, PC DATA CONVERSION, PC NETWORK, PC OVERLAY, PC STARTER KIT, WorkStation ARC/INFO,
and the ESRI logo and the ArcData logo are trademarks of Environmental Systems Research Institute, Inc., Redlands,
CA USA. ARCMAIL and ArcData are service marks of Environmental Systems Research Institute, Inc., Redlands, CA
USA.
Macintosh is a registered trademark of Apple Computer, Inc.
dBASE is a registered trademark and ObjectVision is a trademark of Borland International, Inc.
CorelDRAW is a product name of Corel Systems Corporation
EOSAT is a registered trademark of Earth Observation Satellite Company
INFO and PC INFO are trademarks of Henco Software, Inc.
Microsoft and MS–DOS are registered trademarks; Windows, FoxPro, and Paintbrush are trademarks; and Excel and
Publisher are product names of Microsoft Corporation
Q + E is a trademark of Pioneer Software Systems Corporation
UNIX is a registered trademark of UNIX Systems Laboratories, Inc.
Acknowledgments
The World Bank's Social Indicators of Development is included by permission of The World Bank. Attributes
from the World Resources 1992–93 Data Base are included by permission of the World Resources Institute. The
Robinson Projection is copyrighted by Rand McNally and Company. All algorithms associated with the
projection and contained in the ArcWorld database are not copyrighted, and are provided with the knowledge of
Rand McNally and Company.
Contents
Preface
Getting started with ArcWorld
ix
Chapter 1:
What is ArcWorld?
A flexible world database
World regions
ArcWorld database layer summary tables
1-1
1-1
1-3
1-3
Chapter 2:
Exploring the ArcWorld database
Getting started
Exploring statistical attributes at a global level
Exploring socioeconomic factors in South America
Deforestation in Central and South America
Data documentation views
Ideas for other ways to use ArcWorld
2-1
2-2
2-3
2-9
2-16
2-24
2-26
Chapter 3:
Database concepts and organization
Concepts and terms
Coverages
The ArcWorld database
Attributes
ArcWorld attributes
Naming conventions
Data sources
Coordinate systems
3-1
3-1
3-2
3-6
3-8
3-12
3-14
3-16
3-20
Contents
Chapter 4:
Chapter 5:
Chapter 6:
vi
In greater detail: The ArcWorld 1:3M
layers
ArcWorld 1:3M cartographic layers
Country Boundaries
Country Internal Divisions
Major Cities
Railroads
Rivers and Water Bodies
Roads
4-1
4-3
4-5
4-12
4-15
4-18
4-21
4-27
ArcWorld 1:3M index layers
Landsat Nominal Scene Index
Latitude/Longitude Grids
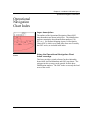
Operational Navigation Chart index
4-31
4-33
4-36
4-39
ArcWorld 1:3M country statistical attribute layers
Economic and Industrial Indicators
Education and Literacy
Food Production and Nutrition
Health and Vital Statistics
Labor Force Characteristics
Natural Resources and the Environment
Population Characteristics
4-41
4-43
4-52
4-60
4-67
4-76
4-83
4-97
The ArcWorld 1:25M and Browse Map
layers
Country Boundaries
Latitude/Longitude Grid
Major Cities
Map Elements
Rivers and Water Bodies
Selected Statistical Attributes
Browse Map statistical attributes
5-1
5-3
5-9
5-11
5-14
5-16
5-20
5-36
Using the database
Optimizing performance
Working with attributes
Drawing with ArcWorld
6-1
6-1
6-3
6-8
ArcWorld User's Guide and Data Reference
Contents
A: Data quality information
A-1
Appendix
ArcWorld 1:3M data
ArcWorld 1:25M and Browse Map data
July1992
A-2
A-12
Appendix B: ArcWorld Item definitions
B-1
Appendix C: Continent, region, and country codes
C-1
Appendix D: Incomplete coverage areas
D-1
Appendix E: Bibliography
E-1
Appendix F: Sources of other data
F-1
Index
Index-1
vii
Contents
viii
ArcWorld User's Guide and Data Reference
Preface
For more than twenty years, ESRI has been a pioneer in the development of
geoprocessing tools in support of Geographic Information Systems (GISs).
ESRI's ARC/INFO® software was the first database-oriented GIS ever
developed. Its introduction started a revolution in the way scientists, planners,
and managers solve problems. Thousands of organizations have chosen ESRI®
software products because these products incorporate leading technology in
geographic information management.
The ArcWorld™ database is one of the first products made available by ESRI
through the ArcDataSM program. ESRI is implementing the ArcData program to
facilitate the accessibility of high-quality data to ESRI software users. Data
distributed through the program have been developed by ESRI and leading data
vendors in the United States and abroad.
General-purpose databases like the ArcWorld and ArcUSA™ databases have
been designed to be robust yet easy to use, appropriate for both the novice and
the technically advanced user. Data for specific applications in product
marketing, business planning, vehicle routing, environmental assessment, and
many other disciplines are also being made available in a ready-to-use format
for use with all of our GIS software.
Getting started with ArcWorld
Welcome
The ArcWorld database contains the data needed to generate thematic maps of
the world at the country level. It contains cartographic, tabular, and index
information and is designed for a wide range of business, educational, and
scientific GIS applications. The ArcWorld database is formatted for UNIX®,
MS-DOS®, and Macintosh® systems.
Use ArcWorld data to . . .
•
•
•
•
•
•
•
•
Create country-level thematic maps
Generate simple outline maps for use as insets or locators
Identify worldwide demographic and socioeconomic patterns
Create basemaps for use with raster data
Serve as a cartographic base for your own tabular data
Find out which Landsat satellite scenes cover your study area
Observe how selected geographic features and patterns are related
Experiment with a variety of mapping techniques
What is in your ArcWorld package
• Compact discs (CD) that contain the ArcWorld database and some
preconstructed ArcView™ views
• ArcWorld 1:3M User's Guide and Data Reference
• ArcWorld Installation Instructions
• ArcWorld license agreement
July 1992
vii
Getting started with ArcWorld
To get started, you'll need . . .
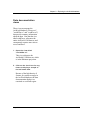
Your system configuration requirements consist of the following:
• Software suitable for your hardware platform (see Table 1)
• CD player (for CD-ROM) or drive appropriate for the distribution medium
you received
• Disk space appropriate to your version of ArcWorld (Table 2), if you wish to
copy the entire database onto your hard drive
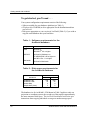
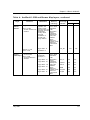
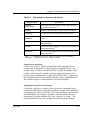
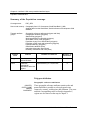
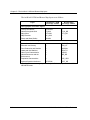
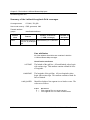
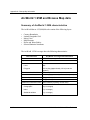
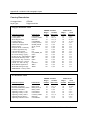
Table 1: Software requirements for the
ArcWorld database
System
Software
UNIX
ArcView or
ARC/INFO® 6.0 or higher
MS-DOS
ArcView for WindowsTM or
PC ARC/INFO® 3.4D or higher or
ArcCADTM Rev. 11 or higher
Macintosh
ArcView for Macintosh
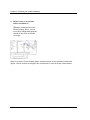
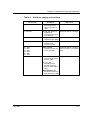
Table 2: Disk space requirements for
the ArcWorld database
Size (MB)
Database
ArcWorld 1:3M
ArcWorld 1:25M
Browse Map
Sample data (views)
dBASE
UNIX
330
18
4
5
500
22
4
5
The database size for ArcWorld 1:25M shown in Table 2 applies to only one
projection or coordinate system; the second set of data requires approximately
the same amount of disk space. The ArcWorld Installation Instructions give
instructions about copying individual coverages to another storage space.
viii
ArcWorld User's Guide and Data Reference
Getting started with ArcWorld
How to access the database
Depending upon the amount of disk space you have available and the
applications you plan for the ArcWorld data, you may read data directly from
the CD-ROM or decide to copy all or some of the data to your hard drive.
Copying the data onto your hard drive will significantly improve performance,
but requires extra storage space. Data copying and storage options for your
particular hardware platforms are discussed in the ArcWorld Installation
Instructions.
How to use this guide
If you're new to geographic information systems
If you've never worked with a geographic information system, you may want
to get an introduction to basic GIS concepts before you read this guide in detail.
You should also be familiar with the basic tools of the software you'll be using
(ArcView, ARC/INFO, or ArcCAD).
• To understand some basic concepts of GIS, see "What's GIS?" (Chapter 5 of
the ArcView User's Guide).
• The book Understanding GIS: The ARC/INFO Method is an excellent, more
extensive resource for novice ARC/INFO users.
• The ARC/INFO 6.0 handbook, ARC/INFO Data Model, Concepts, & Key
Terms will also be helpful.
• You can get excellent detailed information from the numerous published
materials on geographic information systems. See the bibliography for
references to other materials that might prove useful.
July 1992
ix
Getting started with ArcWorld
Using ArcWorld data with ArcView
This user's guide assumes that you are familiar with the basic tools and
functionality of your ArcView software. Although this manual concentrates on
using the database with ArcView, all of the applications discussed, and more,
are possible using ARC/INFO.
• If you're new to ArcView and the ArcWorld database is the first database
you'll be exploring, begin by taking the ArcView guided tour (see Chapter 2
of the ArcView User's Guide).
• Once you've become familiar with ArcView, explore the ArcWorld database
by following the guided tour in Chapter 2 of this manual. This hands-on
tutorial will help you learn the basic techniques for creating displays and
querying the data.
• We have included several preconstructed ArcWorld views. ArcView users
can immediately call these up to display and begin working with the data.
These displays are not accessible with ARC/INFO or ArcCAD software,
however.
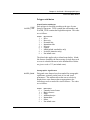
What is in this manual
Each chapter in this manual addresses a particular aspect of the database or its
use. The order in which you read the chapters is up to you, and you may wish
to defer reading a chapter until the information it contains is relevant to what
you are doing. The chapters are as follows:
Chapter 1
What is ArcWorld ?
Presents the geographic extent of the database and an overview of its contents.
Chapter 2
Exploring the ArcWorld database
Provides an ArcView tutorial that introduces you to the basic database
organization and illustrates fundamental techniques for selecting, displaying,
querying, and analyzing the data. Explores cartographic, index, and statistical
attribute data by leading you through sample applications.
x
ArcWorld User's Guide and Data Reference
Getting started with ArcWorld
Chapter 3
Database concepts and organization
Discusses such data elements as coverages and attributes and explains how they
have been organized in the ArcWorld database. Presents basic database
concepts like projection and scale. Lists data sources.
Chapter 4
In greater detail: The ArcWorld 1:3M layers
Examines in detail the geographic features represented by each data layer.
Presents definitions and codes for all of the feature attributes. This is the
chapter you'll use most often during a work session.
Chapter 5
The ArcWorld 1:25M and Browse Map layers
Describes the features and attribute definitions for the ArcWorld 1:25M and
Browse Map data.
Chapter 6
Using the database
Suggests strategies for using the database to display and query, and gives
information about advanced applications like data export. Strategies apply to
both ArcView and ARC/INFO users.
Appendixes
A to F
July 1992
Describe enhancements made during database development. Present attribute
field definitions for both INFO™ and dBASE® formats for use with advanced
applications that use ARC/INFO and ArcCAD. List country, region, and
continent codes, assignment of data to disputed areas, incomplete coverage
areas, and sources of additional information.
xi
Chapter 1
What is ArcWorld?
A flexible world database
The ArcWorld database contains data for the land areas of the world at two
scales. The ArcWorld 1:3M data set is larger both in scale and content. It was
developed at a nominal scale of 1:3,000,000 (the "M" in "1:3M" stands for
"million"), and it contains representations of more than 235,000 features,
including 240 countries, and more than 900 attributes. The ArcWorld 1:25M
data set represents a smaller-scale map. It contains all of the countries, but only
a sample of the features and thematic attributes from the 1:3M database. It
complements the larger data set by allowing an overview of the ArcWorld
database contents. A Browse Map is also included which links the full set of
ArcWorld 1:3M statistical attributes with a highly generalized world map that
represents approximately 141 countries. The Browse Map allows users to
review global thematic maps with on-line displays that draw very quickly.
The ArcWorld database contains a broad range of data, including cartographic
features (country boundaries, roads, railroads, rivers, lakes, major cities);
indexes (latitude/longitude grids, Landsat scenes, Defense Mapping Agency
Operational Navigation Charts); and statistical attributes for countries
(population, government expenditure, deforestation rate, energy production,
food supply, women in the labor force, etc.). ArcWorld can also be used as a
supplement to existing global databases, or in support of more specialized
geographic databases.
July 1992
1-1
Chapter 1—What is ArcWorld?
World regions
ArcWorld data are delivered in both UNIX ARC/INFO and PC ARC/INFO
coverages and can be used with the following software products:
•
•
•
•
ArcView (for UNIX, Windows, and Macintosh)
PC ARC/INFO Rev. 3.4D and higher
ARC/INFO Rev. 6.0 and higher on UNIX workstations
ArcCAD Rev. 11 and higher
PC ARC/INFO coverages store attributes in dBASE format. Thus, other
MS-DOS application software tools can be used with the ArcWorld database.
1-2
ArcWorld User's Guide and Data Reference
Chapter 1—What is ArcWorld?
World regions
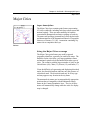
ArcWorld 1:3M and 1:25M data are classified by world region so you have an
easy means of selecting a small multicountry area for display or study. The
twenty-four ArcWorld regions are shown on the map on the opposite page.
ArcWorld features are also assigned to a country and a continent. A complete
list of countries, regions, and continents, together with their codes, can be
found in Appendix C.
ArcWorld database layer summary tables
The four tables that begins on the next page summarize the ArcWorld database.
Tables 1 through 3 describe the 1:3 million cartographic, index, and statistical
attribute layers. (Some large data layers are divided into two coverages;
coverage names end in "_E" for east and "_W" for west.) Table 4 describes the
1:25 million layers, which include both the 1:25 million-scale coverages and the
Browse Map coverages.
Both the ArcWorld 1:3M and ArcWorld 1:25M data are delivered in geographic
coordinates (latitude/longitude) in decimal degrees. The 1:25 million data are
also delivered in the Robinson projection. The Browse Map is in the Robinson
projection.
The coverage sizes in the table are approximate. In UNIX format, some
information is stored in a separate directory, so the overall database sizes listed
in Table 2 of "Getting Started" are larger than the sum of the component
coverages. Also, the size listed for the 1:25 million data accounts for only one
projection. Data in the other projection are approximately the same size.
July 1992
1-3
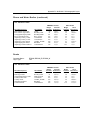
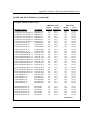
Chapter 1—What is ArcWorld?
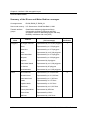
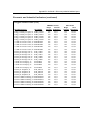
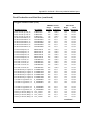
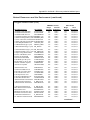
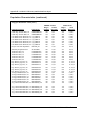
Table 1: ArcWorld 1:3M cartographic layers
Layer
Country
Boundaries
Features
Source,
Currency
Size (MB)
Coverage
Names
dBASE
UNIX
U.S.
Government—
World Data
Bank II, 1988
CTRY3M
18.07
16.53
Lines: 18,040
country boundaries,
shorelines, and more
Annotation: 180
country names
Polygon attribs.: 19
country names and
codes, regions,
continents,
organization
memberships
Line attributes: 9
country name,
boundary type, and
status
Country
Internal
Divisions
Lines: ca. 14,675
subnational boundaries
for some countries
Line attributes: 6
boundary level and
coincidence,
geographic reference
U.S.
Government—
World Data
Bank II, 1988
ADMIN3M
8.23
7.34
Major Cities
Points: 450
capitals, other major
cities
Annotation: 450
city names
Point attributes: 9
name, capital, major
city, local name,
geogr. reference
Defense
Mapping
Agency—
Operational
Navigation
Charts, various
years
CITY3M
0.19
0.21
Railroads
Lines: ca. 26,925
railroad lines
Line attributes: 7
type, display scale,
geogr. reference
U.S.
Government—
World Data
Bank II, 1988
RR3M
11.63
10.08
Rivers and
Water Bodies
Polygons: ca. 10,825
lakes, reservoirs, rivers,
lagoons
Polygon attributes: 7
type, significance,
geogr. reference
U.S.
Government—
World Data
Bank II, 1988
RIV3M
26.73
24.13
RIV3M_E
17.83
16.06
Lines: ca. 35,600
perennial and intermittent
rivers, canals
Line attributes: 9
type, rank,
coincidence, geogr.
reference
RIV3M_W
9.14
8.31
Lines: ca. 55,500
high speed, hard
surfaced, and unsurfaced
roads, and tracks
Line attributes: 7
type, display scale,
geogr. reference
121.94
18.73
RDS3M_E
9.36
7.92
RDS3M_W
12.40
10.67
Roads
1-4
Polygons: ca. 12,900
Attributes
U.S.
Government—
World Data
Bank II, 1988
RDS3M
ArcWorld User's Guide and Data Reference
Chapter 1—What is ArcWorld?
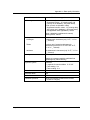
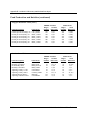
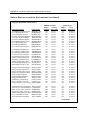
Table 2: ArcWorld 1:3M index layers
Layer
Landsat
Nominal Scene
Index
Features
Points: ca. 23,325
scene center points
Operational
Navigation
Chart (ONC)
Index
July 1992
Source,
Currency
Coverage
Names
Size (MB)
dBASE
UNIX
9.77
8.76
11.85
10.33
Point attributes.: 15
path, row, states
covered, lat./long. of
point
Line attributes: 15
path, row, states
covered, lat./long. of
footprint
EOSAT—
algorithm
generated, 1992
SAT_PT
EOSAT—
algorithm
generated, 1992
SAT_BND
ESRI—
generated, 1992
LTLG20
0.30
0.23
Lines: ca. 758
Line attributes: 3
latitude, longitude,
land/water code
Line attributes: 3
LTLG_BR
0.18
0.16
Polygons: ca. 300
1:1 million-scale map
areas
Polygon attributes: 1
map identification
number
ESRI—digitized
from analog
ONC index
map,1988
ONC_IDX
0.95
0.97
Lines: ca. 26,325
scene footprints
Latitude/
Longitude Grid
Attributes
Lines: ca. 1,450
20 by 20 degree grid
1-5
Chapter 1—What is ArcWorld?
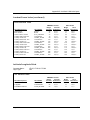
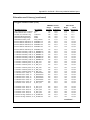
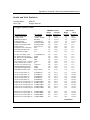
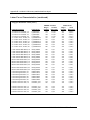
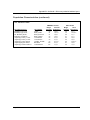
Table 3: ArcWorld 1:3M country statistical attribute layers
Layer
Features
Attributes
Source,
Currency
dBASE
UNIX
ECONIND
22.61
21.75
Economic and
Industrial
Indicators
Polygons: ca. 12,600
countries
Lines: ca. 16,395
country, region, continent
boundaries
Polygon attribs.: 102
Gross National
Product (GNP)
expenditure of Gross
Domestic Product
(GDP) on food,
housing,
transportation and
communication
Line attributes: 9
geogr. reference,
type
Education and
Literacy
Polygons: ca. 12,600
countries
Lines: ca. 16,395
country, region, continent
boundaries
Polygon attribs.: 91
U.S. Governeducational expenditure,ment—World
school enrollment,
Data Bank II,
literacy
1988
Line attributes: 9
World Bank—
geographic reference, Social
type
Indicators of
Development
(SID) 1990
database
EDU_LIT
22.17
20.64
Food
Polygons: ca. 12,600
Production and
countries
Nutrition
Lines: ca. 16,395
country, region, continent
boundaries
Polygon attribs.: 79
agricultural and forest
land; food imports;
quantity of food
produced; daily calorie
supply
Line attributes: 9
geographic reference,
type
U.S. Government—World
Data Bank II,
1988
AGRICUL
22.88
21.33
Health and Vital Polygons: ca. 12,600
Statistics
countries
Lines: ca. 16,395
country, region, continent
boundaries
Polygon attribs.: 110
access to safe water;
malnutrition; population
per physician; birth and
death rates; life
expectancy
Line attributes: 9
geographic reference,
type
U.S. Government—World
Data Bank II,
1988
HEALTH
25.50
23.89
1-6
U.S. Government—World
Data Bank II,
1988
World Bank—
Social
Indicators of
Development
(SID) 1990
database
Size (MB)
Coverage
Names
World Bank—
Social
Indicators of
Development
(SID) 1990
database
World Bank—
Social
Indicators of
Development
(SID) 1990
database
ArcWorld User's Guide and Data Reference
Chapter 1—What is ArcWorld?
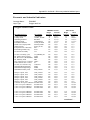
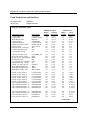
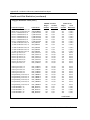
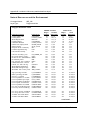
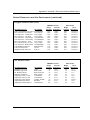
Table 3: ArcWorld 1:3M country statistical attribute layers, continued
Layer
Labor Force
Characteristics
Natural
Resources and
the
Environment
Population
Characteristics
July 1992
Features
Attributes
Source,
Currency
Polygons: ca. 12,600
countries
Lines: ca. 16,395
country, region, continent
boundaries
Polygon attribs.: 68
total labor force,
proportion of females,
percentage in farming
and manufacturing
Line attributes: 9
geographic reference,
type
U.S. Government—World
Data Bank II,
1988
Polygons: ca. 12,600
countries
Lines: ca. 16,395
country, region, continent
boundaries
Polygon attribs.: 120
GDP, government
expenditures,
sanitization, immunization, deforestation, endangered
species, energy
production and
consumption,
atmospheric
emissions
Line attributes: 9
geographic reference,
type
U.S. Government—World
Data Bank II,
1988
Polygons: ca. 12,600
countries
Lines: ca. 16,395
country, region, continent
boundaries
Polygon attribs.: 106
population by age,
urban and rural
females, growth
rate, and year 2000
projection
Line attributes: 9
geographic reference,
type
U.S. Government—World
Data Bank II,
1988
Coverage
Names
Size (MB)
dBASE
UNIX
LABOR
21.99
19.16
WRI_3M
29.90
27.91
POP_GEO
25.08
23.47
World Bank—
Social
Indicators of
Development
(SID) 1990
database
World Bank—
Social
Indicators of
Development
(SID) 1990
database
World Bank—
Social
Indicators of
Development
(SID) 1990
database
1-7
Chapter 1—What is ArcWorld?
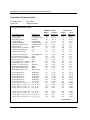
Table 4: ArcWorld 1:25M and Browse Map layers
Layer
Country
Boundaries
Latitude/
Longitude Grid
Major Cities
Map Elements
Rivers and
Water Bodies
1-8
Features
Polygons: ca. 2,070
Attributes
Source,
Currency
Size (MB)
Coverage
Names
dBASE
UNIX
10.26
6.90
U.S.
Government—
World Data
Bank II, 1988
CTRY25M
Lines: 3,940
countries, continents, and
coastlines
Annotation: 185
country names
Polygon attribs.: 19
country names and
codes, regions,
continents,
organization
memberships
Line attributes: 4
country name,
boundary type, and
status
Lines: ca. 1,450
20 by 20 degree grid
Line attributes: 3
latitude, longitude,
land/water code
ESRI—
generated, 1992
LTLG20
0.30
0.23
Lines: ca. 758
Line attributes: 3
LTLG_BR
0.18
0.16
Points: 186
major cities, state
capitals
Annotation: 186
city names
Point attributes: 9
name, capital, major
city, local name,
geogr. reference
CITY25M
0.01
0.92
Points: 129
Point attributes: 3
CITY_BR
0.01
0.07
Polygons: 8
scale bar
Lines: 19
scale bar
Annotation: 6
scale bar, title
Polygon attributes: 1
area fill codes
Line attributes: 0
ESRI—1992
—
0.02
Polygons: ca. 70
lakes, reservoirs
Polygon attributes: 6
type, geographic
reference
1.38
1.20
Lines: ca. 3,350
perennial and intermittent
rivers, lakes, reservoirs,
ice fields
U.S.
Government—
World Data
Bank II, 1988
Line attributes: 7
types, geogr.
reference
Defense
Mapping
Agency—
Operational
Navigation
Charts, various
years
SC_25M
(Coverage for
UNIX
Robinson
projection
only)
RIV25M
ArcWorld User's Guide and Data Reference
Chapter 1—What is ArcWorld?
Table 4: ArcWorld 1:25M and Browse Map layers, continued
Layer
Selected
Statistical
Attributes
Browse Map
statistical
attribute layers
Features
Polygons: ca. 2,025
Lines: ca. 3,880
countries, continents, and
coastlines
Attributes
Polygon attribs.: 90
population, vital
statistics, health,
agricultural land, food
production, economic
development,
housing, natural
resources
Line attributes: 8
boundary type,
geogr. reference
Coverage
Names
Size (MB)
dBASE
UNIX
U.S. GovernSTAT25M
ment—World
Data Bank II,
1988
World Bank—
Social
Indicators of
Development
(SID) 1990
database
World
Resources
Institute—World
Resources
1992–93 Data
Base
8.33
8.03
STAT_BR
0.49
0.49
Polygons: ca. 235
Lines: ca. 536
Polygon attribs.: 74
Line attributes: 0
Polygons: ca. 235
ca. 150 countries
Lines: ca. 536
country boundaries and
shorelines
Polygon attribs.: 86
Line attributes
(all layers): 0
U.S. Government—World
Data Bank II,
1988
ECONIND
0.47
0.48
Polygon attribs.: 75
World Bank—
Social
Indicators of
Development
(SID) 1990
database
World
Resources
Institute—World
Resources
1992–93 Data
Base
EDU_LIT
0.45
0.45
AGRICUL
0.46
0.47
HEALTH
0.51
0.51
LABOR
0.44
0.41
POP_GEO
0.50
0.51
WRI_BR
0.59
0.59
Polygon attribs.: 63
Polygon attribs.: 104
Polygon attribs.: 52
Polygon attribs.: 52
Polygon attribs.: 90
July 1992
Source,
Currency
1-9
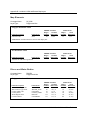
Chapter 2
Exploring the ArcWorld
database
This guided tour introduces ArcView users to the ArcWorld database by
exploring a series of preconstructed views included with the data. The tour
does not cover all aspects of the database, but it does illustrate some of the ways
in which the data at both the 1:3,000,000 and 1:25,000,000 scales can be used.
By following the exercises in this chapter, you will be better able to explore the
data on your own.
You will gain the most from these exercises if you are familiar with ArcView
functions. The emphasis of this tutorial is on exploring the database and not on
how to use the software tools, so it is recommended that you first do the
exercises in Chapter 2, "A guided tour of ArcView," of the ArcView User's
Guide.
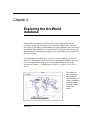
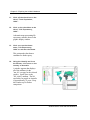
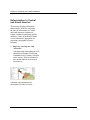
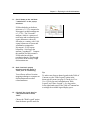
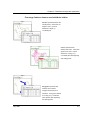
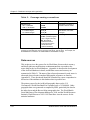
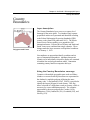
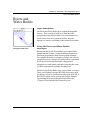
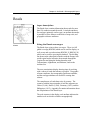
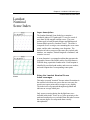
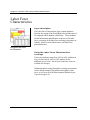
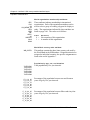
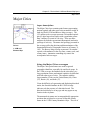
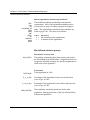
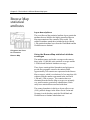
This chapter will
help you become
familiar with the
ArcWorld data, such
as the 1:25M Rivers
and Water Bodies
coverage shown in
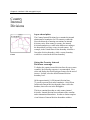
this ArcView
display.
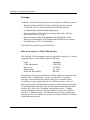
July 1992
2-1
Chapter 2—Exploring the ArcWorld database
In the first exercise, you will examine total population and life expectancy on a
global level using one of the ArcWorld statistical Browse Map coverages. In
the second exercise, 1989 Gross National Product (GNP) per capita in South
American countries is examined using ArcWorld 1:25M, and potential
relationships between GNP per capita and other socioeconomic variables are
explored. The third exercise involves exploring the deforestation of South and
Central America and teaches you how to create and analyze bivariate maps. The
last exercise explores the data documentation views provided with the database.
Getting started
Begin by loading ArcView; if you haven't already loaded and started ArcView,
please see the ArcView installation instructions.
Next, load your ArcWorld data set (see the ArcWorld Installation Instructions).
The "views" directory includes a series of preconstructed ArcView views to
guide you through the tour.
2-2
ArcWorld User's Guide and Data Reference
Chapter 2—Exploring the ArcWorld database
Exploring statistical
attributes at a global level
During this exercise, you will explore
some of the statistical attributes
included in the ArcWorld Browse
Map. Begin by opening the view
"stat.av", which displays country
boundaries for the world.
1 . Click on the check box to the
left of "Total Population,
1989".
You will see a thematic map
representing 1989 total population. Total population,
"totpop89", is one of the variables
in the ArcWorld Browse Map
coverage "stat_br".
2 . Select "Properties..." from
the theme-specific menu for
the theme "Total Population,
1989".
The Theme Property Sheet will
appear below the Table of
Contents. Notice that the attribute
"stat_flag" has been preset to
equal "2". In addition, the
attribute "totpop89" has been
preset to be greater than "-97" to
prevent the display of countries
that may have incomplete or
missing data. Quit from the
property sheet to continue.
July 1992
2-3
Chapter 2—Exploring the ArcWorld database
3 . In the Table of Contents,
choose the Table option from
the theme-specific menu
"Total Population, 1989".
This allows you to access
information contained in the
Browse Map coverage "stat_br".
Use the scroll bar to move to the
attribute "totpop89".
4 . Click on the attribute name
"totpop89" and select
Statistics.
A window pops up that displays
the count, sum, minimum,
maximum, and mean value for the
specified attribute. Notice that the
lowest total population in the
world is 184,208.
5 . Click "Dismiss".
6 . Click on the Query Builder
icon within the table for "Total
Population, 1989".
You will now build a logical
expression to locate the country
with the minimum population.
7 . Click on the attribute
"totpop89", near the top of
the scrolling list of attributes.
2-4
ArcWorld User's Guide and Data Reference
Chapter 2—Exploring the ArcWorld database
8 . Choose "<" from the
operators; then enter
"200000" on the line below
the "Values/Attributes" box.*
The logical expression now reads
( totpop89 < 200000 ).
9 . Click "Select".
One country (within the graphic
display and the table) will
highlight as having a total
population in 1989 of less than
200,000 people. Within the table,
the country can be identified as
Belize. Belize is a Central
American country bordered by
Mexico and Guatemala.
10.
Click "Selected" within the
table.
This action limits the records
displayed in the theme's table to
the current selected set. Use the
scroll bar to examine other
attributes, such as "grw_rate89",
"pop2000_89", and "landarea85",
which concern the country's
growth rate, projected population,
and total land area, respectively.
Quit from the table prior to
continuing.
* PC and Macintosh users will enter "200000" on the line above the "Values/Attributes" box.
July 1992
2-5
Chapter 2—Exploring the ArcWorld database
11.
Click off the check box to the
left of "Total Population,
1989".
12.
Click on the check box to the
left of "Life Expectancy,
1989".
A thematic map representing life
expectancy statistics draws in the
graphic display window.
13.
Click once on the theme
name "Life Expectancy,
1989" to activate the theme.
This action makes the theme a
candidate for further query.
14.
Using the Identify tool from
the Palette, click once on the
country of Australia.
A window appears that displays
all of the attributes for the
"stat_br" coverage for the selected
country. Scroll down to the
"life_exp89" attribute. The life
expectancy for people in Australia
is approximately 76 years. Keep
this window up for further
comparison.
2-6
ArcWorld User's Guide and Data Reference
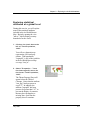
Chapter 2—Exploring the ArcWorld database
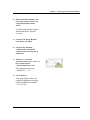
15.
Using the Identify tool, click
once on the African country
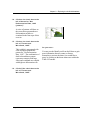
of Zaire.
Zaire
A second window appears that
displays all "stat_br" attributes for
Zaire. Position the two popup
windows next to each other for
easier comparison. Scroll down
to the "life_exp89" attribute for
Zaire. The life expectancy for
people in this country is approximately 52 years, about 24 years
less than an Australian's life
expectancy.
16.
In both windows, scroll down
to "exp_med85".
This attribute reflects the
percentage of Gross Domestic
Product (GDP) spent on medical
care. Government and private
spending are included in this
figure. In the country of
Australia, about 7% of the GDP is
spent on medical care, as
compared to the country of Zaire,
in which less than 1% of the GDP
goes toward medical care.
July 1992
2-7
Chapter 2—Exploring the ArcWorld database
17.
Scroll further down in both
windows to the attributes
"cal_cap85" and
"prot_cap85".
The attribute "cal_cap85"
represents the daily calorie supply
from net food supplies in the
country per capita, per day. The
"prot_cap85" attribute represents
the protein content of the net food
supply per capita, measured in
grams.
The difference in the attributes we
have examined in steps 16 and 17
may relate to the difference in life
expectancy in the two countries.
2-8
ArcWorld User's Guide and Data Reference
Chapter 2—Exploring the ArcWorld database
July 1992
2-9
Chapter 2—Exploring the ArcWorld database
Exploring socioeconomic
factors in South America
This exercise explores the socio-economic factors at work in
countries in South America. Begin by opening the view "gnp.av",
which displays ArcWorld 1:25M country boundaries for South
America.
1 . Click on the check box for the theme named "GNP Per
Capita, 1989".
You will see a thematic map showing the 1989 Gross National
Product (GNP) per capita for countries in South America. 1989
GNP per capita "gnp_cap89" is one of the variables in the
ArcWorld 1:25M "stat25m" coverage. This coverage contains
selected statistical attribute data at the national level.
Certain portions of southern Chile and Argentina are not shaded
because they are not the largest polygon for the country. See Chapter 6
for more information about using the "stat_flag" attribute.
July 1992
2-9
Chapter 2—Exploring the ArcWorld database
2 . Select "Properties..." from
the theme-specific menu for
the theme "GNP Per Capita,
1989".
The Theme Property Sheet will
appear below the Table of
Contents. Notice that the attribute
"stat_flag" has been preset to
equal "2". In addition, the
attribute "gnp_cap89" has been
preset to be greater than "-97", to
prevent the display of countries
that may have incomplete or
missing data. Quit from the
property sheet to continue.
Setting the "stat_flag" attribute equal to "2" through the
Theme's Property Sheet Query Builder provides
accurate summary statistics for any selected country.
3 . In the Table of Contents,
select the Table option from
the theme-specific menu for
"GNP Per Capita, 1989".
This allows you to access
information about estimated
national income per capita, in
1989 U.S. dollars. Use the scroll
bar to view the full extent of the
attributes contained within the
"stat25m" coverage.
4 . Click on the Query Builder
icon in the table.
5 . Click on the attribute
"continent" within the
scrolling list of attributes.
2-10
ArcWorld User's Guide and Data Reference
Chapter 2—Exploring the ArcWorld database
6 . Choose "=" from the
operators, then enter "South
America" on the line below
the "Values/Attributes" box.
7 . Click "Select".
Each country within the continent
of South America will highlight
within the graphic display and the
table.
8 . Scroll toward the center of
the table to the attribute
"gnp_cap89" within the table.
Click on the attribute name
and select "Statistics".
A window pops up that displays
the count, sum, minimum,
maximum, and mean values for
the specified attribute, both for all
records contained in the layer and
for records specific to the selected
set. Now you can compare the
minimum and maximum GNP per
capita of the countries of South
America to the minimum and
maximum GNP per capita of all
the countries in the world. Note
that the minimum GNP per capita
for South American countries in
1989 was $340 and the maximum
was $3,020.
July 1992
2-11
Chapter 2—Exploring the ArcWorld database
9 . Click "Dismiss".
10.
Click on the Query Builder
icon within the table.
11.
Click on the attribute
"gnp_cap89" in the scrolling
list of attributes.
12.
Choose ">" from the
operators; then enter the
number "3000" on the line
below the "Values/Attributes"
box.
The logical expression now reads
( gnp_cap89 > 3000 ).
Use a logical expression to create a more focused
selection set; in this case, to identify the country in
South America with the highest gross national product
per capita.
2-12
ArcWorld User's Guide and Data Reference
Chapter 2—Exploring the ArcWorld database
13.
Click "Select."
Your map will now highlight
(within the graphic display and
the table) the country in South
America with a 1989 GNP per
capita greater than $3,000.
14.
Click once on the theme
name for "GNP Per Capita,
1989" within the Table of
Contents to activate the
theme.
15.
Select the Identify tool from
the Tool Palette.
16.
Click once on the highlighted
country with the Identify tool.
A window pops up that contains
all attributes within the 1:25M
"stat25m" coverage for the
highlighted country, including its
name. The highlighted country
can now be identified as
Suriname. Scroll down to
"gnp_cap89". The country of
Suriname had a GNP per capita of
$3,020 in 1989. Keep this
window up for further
comparison.
17.
Click on the Query Builder
icon within the table.
18.
Click on the attribute
"gnp_cap89" within the
scrolling list of attributes.
July 1992
2-13
Chapter 2—Exploring the ArcWorld database
19.
Choose "<" from the
operators and enter "350" on
the line below the
"Values/Attributes" box.
The expression now reads
( gnp_cap89 < 350 ).
20.
Click "Select."
One country will be selected as
having a GNP per capita below
$350 in 1989.
21.
Click once on the highlighted
country with the Identify tool
from the palette.
A window pops up that contains
all attributes within the "stat25m"
coverage for the highlighted
country, including its name. The
country can now be identified as
Guyana. Scroll down to the
"gnp_cap89" attribute. Guyana
had a GNP per capita of $340 in
1989 as compared to Suriname
with a GNP per capita of $3,020
in 1989. Move the two popup
windows side by side prior to
continuing.
22.
Scroll up to the attribute
"foodprod89" within both
popup windows.
This attribute represents each
country's food production per
capita in 1986–88, in relation
2-14
ArcWorld User's Guide and Data Reference
Chapter 2—Exploring the ArcWorld database
to that produced in 1979–81.
Guyana's food production index
of 69.59 indicates that food
production per capita in that
country fell by roughly 30 percent
in 1986–88, compared with food
production per capita in 1979–81.
Suriname's food production fell
approximately 9 percent. Keep
this window up for later
comparison.
23.
Scroll farther down in the
popup windows to the
attributes "p_aggdpr88",
"p_indgdp88", and
"p_sergdp88".
These attributes represent
agriculture, industry, and services
respectively, as a percentage of
Gross Domestic Product (GDP),
which is a component of GNP.
Comparing the three attributes for
Guyana and Suriname reveals that
Guyana is more oriented toward
agriculture and industry and
Suriname is more serviceoriented.
24.
You may continue to explore
the differences in attributes
between Suriname and
Guyana.
July 1992
2-15
Chapter 2—Exploring the ArcWorld database
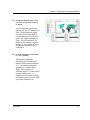
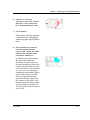
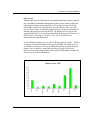
Deforestation in Central
and South America
This exercise displays information
that would be useful for comparing
the rates of deforestation in Central
and South American countries to
related variables by analyzing specific
attributes. Some of the themes in this
view would also be appropriate for
preparing a geographic reference
basemap.
1 . Begin by opening the view
"forest.av".
A thematic map representing the 1985
annual rate of change of forest and
woodland areas by country will draw
on the screen. Positive numbers for
this variable indicate an increase in
forested area.
A thematic map representing net
deforestation in 1985, by country.
2-16
ArcWorld User's Guide and Data Reference
Chapter 2—Exploring the ArcWorld database
2 . Select the Table option from
the theme-specific menu for
"Net Deforestation Rate,
1985".
A window pops up that contains
information for the "stat25m"
coverage.
3 . Click on the Query Builder
icon within the table.
4 . Click on the attribute
"netdefor85" toward the
center of the scrolling list of
attributes.
5 . Choose "<" from the
operators and enter "–2.5" on
the line below the
"Values/Attributes" box.
The expression now reads
( netdefor85 < –2.5 ).
6 . Click "Select".
Your map will now show two
countries highlighted as having a
net deforestation rate less than
–2.5% in 1985.
July 1992
2-17
Chapter 2—Exploring the ArcWorld database
7 . Click "Selected" within the table.
This option displays only records
included in the selected set within
the theme's table.
8 . Click once on the theme
name "Net Deforestation
Rate, 1985" in the Table of
Contents to activate the
theme.
This action activates the theme
area in the Table of Contents and
makes this theme a candidate for
further query.
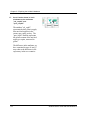
9 . Select the Identify tool from
the Palette and click once on
El Salvador, the westernmost
highlighted country.
A window pops up that contains
all of the attributes in the
"stat25m" coverage for this
country. Keep this window up
for later comparison.
10.
Click once on Nicaragua, the
other highlighted country, with
the Identify tool.
A second popup window appears
that contains all of the attributes
for the "stat25m" coverage for
Nicaragua. Position the two
popup windows beside each other
prior to continuing.
2-18
ArcWorld User's Guide and Data Reference
Chapter 2—Exploring the ArcWorld database
11.
Scroll down to the attribute
"netdefor85" in the popup
windows.
El Salvador had a net deforestation rate of –5.17% compared to
Nicaragua's net deforestation rate
of –2.72%. The "forests85"
attribute, which is a measure of
total forest and woodland area in
square kilometers, shows El
Salvador as a country with 1,100
square kilometers of forests and
woodland as compared to
Nicaragua's 39,300 square
kilometers. Scroll up to the
attribute "popdnsty85". Compare
this attribute for both countries.
El Salvador has a higher
population density, which might
be a factor in the country's high
deforestation rate.
12.
Quit from both popup
windows and the theme's
Table prior to continuing.
Tip
You will now utilize a bivariate
mapping technique to compare net
deforestation and two other
related attributes.
13.
To make room for new theme legends in the Table of
Contents, use the "Hide Legend" option in the
theme-specific menu (see page 2-9 in the ArcView
User's Guide for more information on "Hide
Legend" and "Show Legend"). Or, drag on the
lower right-hand corner of the Table of Contents box
to enlarge the available legend display space.
Click off the check box for
"Net Deforestation Rate,
1985".
Choose the "Hide Legend" option
from the theme-specific menu for
July 1992
2-19
Chapter 2—Exploring the ArcWorld database
this theme.
2-20
ArcWorld User's Guide and Data Reference
Chapter 2—Exploring the ArcWorld database
14.
Click on the check box to the
left of theme for "Net
Deforestation Rate, 1985
(pattern)".
A series of patterns will draw on
the screen that represent the net
deforestation variable we
examined in the first steps of this
exercise.
15.
Click on the check box to the
left of "Forests and
Woodland, 1985".
On your own...
This variable is represented with
color and draws beneath the
pattern for "Net Deforestation
Rate, 1985". The combination of
dark color and dense pattern
represents countries with large
forest and woodland area coupled
with high net deforestation rate.
16.
You may use the Identify tool from the Palette to gain
more information about a country or feature.
Remember to activate the theme you would like to
query by clicking on the theme name once within the
Table of Contents.
Click off the check box to the
left of "Forests and
Woodland, 1985".
July 1992
2-21
Chapter 2—Exploring the ArcWorld database
17.
Click on the check box to the
left of "CO 2 Emissions:
Deforestation".
This variable represents carbon
dioxide emissions from land use
change. The measurement is
expressed in thousands of metric
tons. The dark color and dense
pattern combination indicates
countries with high net
deforestation and high CO2
emissions from land use change.
18.
Click off the check boxes to
the left of "CO 2 Emissions:
Deforestation" and "Net
Deforestation Rate (pattern)".
Choose the "Hide Legend" option
from the theme-specific menu for
these themes.
19.
Using the "Zoom to Box" tool
from the Palette, zoom into
an area that encompasses the
country of El Salvador.
On your own . . .
You can now examine
El Salvador, a country that had a
net deforestation rate of –5.17%
in 1985, more closely.
2-22
You may change the symbolization of the country
boundaries to a bolder line symbol for this
portion of the exercise. Enter the legend portion
of the theme property sheet and click twice on the
line symbol. Choose a new line symbol from the
Symbol palette and click "OK". To apply this
change, click "apply" within the theme property
sheet.
ArcWorld User's Guide and Data Reference
Chapter 2—Exploring the ArcWorld database
20.
Click on the check boxes to
the left of "Central American
Countries" and "Roads".
The "Roads" theme references the
ArcWorld 1:3M roads coverage
(rds3m). Hard surface roads are
symbolized with a red line.
El Salvador has a developed
network of hard surface roads
throughout the country, which is
a possible factor in the high net
deforestation rate.
21.
Click off the check box for
"Roads".
22.
Click on the check boxes for
"Rivers", "Waterbodies",
"Subnational Boundaries",
and "Land/Ocean".
The features within these themes
provide further geographic
reference for El Salvador and the
surrounding countries.
23.
Click off the check boxes for
"Rivers", "Waterbodies", and
"Subnational Boundaries".
July 1992
2-23
Chapter 2—Exploring the ArcWorld database
24.
Click on the check boxes for
"Landsat Scene Footprints"
and "Landsat Scene
Centers".
These themes reference the
Landsat scene areas and the scene
center points. Notice that there is
overlap between each of the
scenes.
25.
Double click on the "Landsat
Scene Footprints" theme
name to access the Theme
Property Sheet.
26.
Click on the Query Builder
within the Property Sheet.
Build the expression
( cntry_nam1 lk 'El Salvador' ),
and click "select".
27.
Click "apply" within the
Property Sheet.
The representation of scene
footprints is now limited to those
covering El Salvador. These
images would be useful for
gaining more information about
change in forestation patterns and
development.
2-24
ArcWorld User's Guide and Data Reference
Chapter 2—Exploring the ArcWorld database
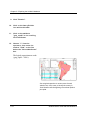
Data documentation
views
Three views accompany the
ArcWorld database ("browse.av",
"world25m.av" and "world3m.av")
that provide summary information
about the data. Note that the view
titled world3m.av references the
entire ArcWorld 1:3M data set, and
consequently requires more time to
access and draw.
1 . Open the view titled
"world25m.av".
This view references the
ArcWorld 1:25M data set, which
is in the Robinson projection.
2 . Click on the check box for any
theme to display a sample of
the indicated data.
Because of the high density of
features for certain coverages in
the ArcWorld database, the data
documentation displays are
restricted to a selected region.
July 1992
2-25
Chapter 2—Exploring the ArcWorld database
3 . Double click on any theme
within world25m.av.
Within the comments box in the
Theme Property Sheet, you can
access basic information about the
content of any of the ArcWorld
coverages.
When you enter the Theme Property Sheet, the bottom portion of the comments text block will
appear. Use the scroll bar at the right of the comments box to move to the top of the text block.
2-26
ArcWorld User's Guide and Data Reference
Chapter 2—Exploring the ArcWorld database
Ideas for other ways to use ArcWorld
The exercises in this guided tour provide only an introduction to the content and
the potential applications of the ArcWorld database. The following table lists
just a few of the many other issues you might want to explore by using the data.
Next to each issue are some of the attributes in the ArcWorld 1:3M coverages
that might be of interest.
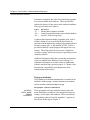
Table 1: Other views
Issues
Attributes
Planning educational
assistance
Primary school enrollment ratio
Teacher/student ratios
Illiteracy rate
Education and Literacy
(EDULIT)
Assessing nutritional
adequacy of food supply
Daily protein supply per capita
Daily calorie supply per capita
Food Production and
Nutrition
(AGRICUL)
Participation of women in
society
Labor force participation rate
Female labor force as % of total
Labor Force
Characteristics
(LABOR)
Planning health assistance
Infant mortality rate
Health and Vital Statistics
Mortality rate for children 0–5 yrs (HEALTH)
Population per hospital bed
Population studies
Population, age 0–14 as % of
Population
total
Characteristics
Projected population, year 2000 (POP_GEO)
Countries potentially most
affected by increases in
food prices
Expenditure on food as % of
gross domestic product
Food imports, cereals
Food Production and
Nutrition
(AGRICUL)
Countries potentially most
affected by increases in
energy prices
Expenditure on energy as % of
gross domestic product
Energy consumption per capita
Economic and Industrial
Indicators
(ECONIND)
Potential markets for news
publications
Newspaper circulation per 1,000 Education and Literacy
population
(EDU_LIT)
Illiteracy rate
Assessing potential for
Science and engineering
technological development students as % of total
Secondary school enrollment
ratio
July 1992
Layer/Coverage
Education and Literacy
(EDU_LIT)
2-27
Chapter 3
Database concepts and
organization
This chapter defines several basic database terms and explains how the
ArcWorld database is organized. The standards and procedures employed
during the development of the database are discussed, and the sources for the
ArcWorld data are described. The information in this chapter applies to all
components of the database, so it may be helpful to read this chapter before
reading Chapters 4 and 5, which contain detailed descriptions of each data
layer.
Concepts and terms
A map is a graphic display of spatially distributed elements called map features,
which correspond to real-world geographic entities. These real-world entities
are located spatially on maps by means of points, lines, and areas.
• Points define discrete locations on a map for geographic phenomena that are
too small to be depicted as lines or areas, such as well locations, telephone
poles, and buildings. Points can also represent locations that have no area,
such as mountain peaks. In the ArcWorld database, points are used to
represent cities and satellite scene centers.
• Lines represent the shapes of geographic objects that are too narrow to depict
as areas (such as highways and streams).
• Areas are closed figures that represent the shapes and locations of
homogeneous features such as countries, parcels, and water bodies.
The characteristics, or attributes, of map features may also be conveyed by
using labels or graphic symbols. For example, streams and water bodies are
July 1992
3-1
Chapter 3—Database concepts and organization
drawn in blue to indicate water; cities are labeled with their names; roads are
drawn with various line widths, patterns, and colors to represent different road
classes; and so on.
In addition to displaying feature locations and attributes, maps are typically
characterized by the following:
• Scale—the relationship between distance on the map and distance on the Earth
• Projection—the system used to transform the curved surface of the Earth to a
plane
• Coordinate system—the method used to relate feature locations by distance
and direction from other features
Until recently, maps were only available in paper (or analog) form. The
development of computerized geographic information systems has enabled
analog map features, relationships, and characteristics to be translated into
digital form for automated display, query, and analysis. The ArcWorld
database is just such a digital geographic database, one that can be used by
ArcView, ARC/INFO, or ArcCAD.
Coverages
The ArcWorld database is organized by coverage. Coverages represent the
main method for vector data storage in ARC/INFO format. A coverage is a set
of thematically associated data considered to be a unit. A coverage generally
describes one type of map feature, such as roads, countries, or lines of latitude
and longitude. A coverage contains both the locational data and thematic
attributes associated with map features.
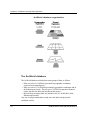
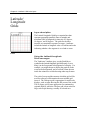
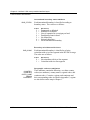
Coverage feature classes
In a coverage, map features are stored as points, lines (also known as arcs), or
polygons (for areas). The three feature classes can be employed in a coverage
either separately or in combination, depending on the requirements of the
captured geographic data. For example, in the ArcWorld database, countries
are stored in one coverage as both polygon features (areas) and line features
(boundaries). A fourth special feature class, annotation, is used in ArcWorld to
display country names and city names. When annotation is displayed the text is
3-2
ArcWorld User's Guide and Data Reference
Chapter 3—Database concepts and organization
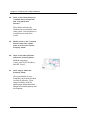
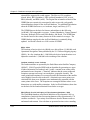
Coverage feature classes and attribute tables
Points represent features like
named places. Points have no
length or area. A point is
defined as a single x,y
coordinate pair.
Lines represent linear
features like roads. Lines have
length but no area. A line is
defined as a string of x,y
coordinate pairs with beginning
and ending points.
Polygons represent area
features like countries.
Polygons have area and a
perimeter. A polygon is defined
as a string of x,y coordinate
pairs with the same beginning
and ending points.
July 1992
3-3
Chapter 3—Database concepts and organization
automatically scaled, projected, positioned, and proportioned based on the
current map scale and projection.
In the ArcWorld database, the coverages have been given names that reflect
content, such as CTRY3M (country boundaries at the 1:3,000,000 scale) and
AGRICUL (agricultural production and nutrition data by country).
Two coverages, (1) Rivers and Water Bodies and (2) Roads, contain a very
large number of features. For these layers two regional coverages are provided
in addition to the coverage that contains the full extent of the database. The
smaller coverages improve software performance for most operations. A
description of the division between the eastern and western regional coverages
is provided with the individual coverage's description in Chapter 4.
Feature attribute tables
The attributes of the polygons, lines, and points in a coverage are stored in
feature attribute tables. Each feature class in a coverage has its own table;
polygon attributes are stored in Polygon Attribute Tables (PATs); line attributes
are stored in Arc Attribute Tables (AATs); and point attributes are stored in
Point Attribute Tables (PATs).
The columns in a feature attribute table represent the attributes of geographic
features. Each row, or record, in the table represents the attributes for a single
feature.
ARC/INFO-generated attributes
ARC/INFO-generated attributes are automatically created by ARC/INFO and are
different for each coverage type. The ARC/INFO-generated attributes are listed
in Table 1. (Since the ArcWorld database was developed using ARC/INFO
software, these attributes exist in the feature attribute tables even though they
are not all apparent with ArcView software.)
Several of the ARC/INFO-generated attributes, such as length, area, and
perimeter, provide useful information about coverage features. They are all
calculated in the units used for the coverage coordinate system. The ArcWorld
1:3M database uses decimal degrees; the ArcWorld 1:25M database is presented
in both decimal degrees and meters (Robinson projection).
3-4
ArcWorld User's Guide and Data Reference
Chapter 3—Database concepts and organization
Table 1: ARC/INFO-generated attributes
Attributes in Point
Attribute Tables
AREA (set to "0")
Attributes in Arc
Attribute Tables
FNODE#
Attributes in Polygon
Attribute Tables
AREA*
PERIMETER (set to "0") TNODE#
PERIMETER*
<coverage name>#
LPOLY# (set to "0" if no polygons)
<coverage name>#
<coverage name>-ID *
RPOLY# (set to "0" if no polygons)
<coverage name>-ID *
LENGTH *
<coverage name>#
<coverage name>-ID *
Note: Only the attributes marked with * appear in ArcView tables. The other ARC/INFOgenerated attributes are physically present in the ArcWorld coverage tables but are not
visible on the screen in ArcView.
Note that other ArcWorld attributes contain information similar to the
ARC/INFO-generated data. In such cases, the two sets of values will be
different from each other because they have been derived from a different
source—not calculated from the coordinate representation of the feature. For
example, in the POP_GEO coverage, both AREA and LANDAREA85 give a
value for country land area. Yet the values are different because AREA is given
in square decimal degrees (geographic coordinates) or square meters (Robinson
projection) and is derived from a digitized map, while LANDAREA85 is given
in square kilometers and is derived from the World Bank tabular database.
(Note that the utility of decimal degrees are limited as units of measure for area,
length, and perimeter because these values cannot be compared from one
latitude to another.) Furthermore, in countries made up of more than one
polygon, AREA contains the value for an individual polygon, while
LANDAREA85 contains the value for the country as a whole.
Coverages in the user's guide
In this user's guide, a group of coverages like the three Rivers and Water
Bodies coverages mentioned above is called a layer. To avoid repetition in
Chapters 4 and 5, the layers are described rather than the individual coverages.
July 1992
3-5
Chapter 3—Database concepts and organization
ArcWorld database organization
The ArcWorld database
The ArcWorld database includes three main groups of data, as follows:
• Data at a scale of 1:3,000,000 (presented in geographic coordinates,
expressed in decimal degrees)
• Data at a scale of 1:25,000,000 (presented in geographic coordinates and in
the Robinson projection. The two sets of 1:25M coverages have identical
names, but they are delivered in different directories.)
• Browse Map coverages (data at a nominal scale of 1:40,000,000, in the
Robinson projection).
Any one coverage contains data at only one scale and in one projection/
coordinate system.
3-6
ArcWorld User's Guide and Data Reference
Chapter 3—Database concepts and organization
Characteristics of ArcWorld 1:3M coverages
The ArcWorld 1:3M coverages contain more detail and a greater number of
features and feature attributes than the 1:25M coverages. This user's guide
groups the coverages containing the 1:3,000,000-scale data into cartographic,
index, and statistical layers. An overview of these three 1:3M layer groups
follows.
Coverages in the cartographic layers represent common
basemap information made up of a variety of man-made and natural geographic
features. The bulk of the data in these coverages is locational; attributes are
few, and usually they identify the location, class, and cartographic significance
of the features. The ArcWorld 1:3M database has six cartographic layers:
Country Boundaries, Country Internal Divisions, Major Cities, Railroads,
Rivers and Water Bodies, and Roads.
Cartographic layers.
Coverages in the three ArcWorld 1:3M index layers contain
several geographic reference grids and data indexes. The index layers are:
Landsat Nominal Scene Index (for Landsat 4 and 5 satellite data), Latitude/
Longitude Grids (5-, 10-, and 20-degree intervals), and Operational Navigation
Chart (ONC) index.
Index layers.
Coverages in the ArcWorld 1:3M statistical
layers contain both geographic features and a large number of attributes for
country statistics. The country boundaries represented in the statistical attribute
layers are slightly different than those in the Country Boundaries cartographic
layer. The specific differences are explained in Chapter 4. The layers are as
follows: Economic and Industrial Indicators, Education and Literacy, Food
Production and Nutrition, Health and Vital Statistics, Labor Force
Characteristics, Natural Resources and the Environment, and Population
Characteristics.
Statistical attribute layers.
Characteristics of ArcWorld 1:25M coverages
The ArcWorld 1:25M layers contain data that are generalized from the 1:3M
coverages. Map features are less detailed, and there are fewer feature attributes.
The 1:25M coverages complement the more detailed coverages by providing a
quick overview of the ArcWorld data. Because versions of both scales are
July 1992
3-7
Chapter 3—Database concepts and organization
stored in the same coordinate system, features from the 1:25M and 1:3M
coverages can be displayed together. For example, you might display 1:25M
Country Boundaries and Rivers and Water Bodies as a basic outline map, and
simultaneously display the Landsat Scene Index from the 1:3M database.
ArcWorld 1:25M has four cartographic layers: Country Boundaries; Major
Cities; Rivers and Water Bodies; and Map Elements (title and scale bar). There
are one latitude/longitude grid layer (20-degree intervals) and one 1:25M
statistical attribute layer.
Characteristics of Browse Map coverages
A highly generalized representation of the world's countries (with a nominal
scale of 1:40,000,000) is linked to ArcWorld 1:3M statistical attributes so that
thematic maps may be displayed very quickly. The Browse Map contains the
major countries of the world. The smallest nations, especially island nations,
are not shown in the Browse Map, and the continent of Antarctica has also been
omitted. Ten coverages are included in the Browse Map: Major Cities,
Latitude/Longitude Grid, Economic and Industrial Indicators, Education and
Literacy, Food Production and Nutrition, Health and Vital Statistics, Labor
Force Characteristics, Natural Resources and the Environment, Population
Characteristics, and Selected Statistical Attributes.
Attributes
The attributes (or items) in the ArcWorld feature attribute tables contain different
types of values—specifically, measurements, codes, flags, and names. The
values contained in an attribute determine the kinds of statistical operations that
can be performed on the data and influence the display of the data. The four
kinds of attribute values are discussed below.
Measurement attributes
Measurement attributes have numeric values that indicate a measurement, such
as number of people, calories, hectares, number of species, or dollars spent,
and not a code or designation. For example, the values in the measurement
attribute HHLDSIZR86 (persons per household, 1986) represent the average
number of people per household. Measurement values are usually continuous
(such as 3,145, 6.2, or –43.8) but may be ordinal (first, second, etc.). In the
3-8
ArcWorld User's Guide and Data Reference
Chapter 3—Database concepts and organization
Measurement
attribute
Flag attribute
Missing
measurement
value
ArcWorld database, measurement attributes are most common in the statistical
attribute layers.
Measurements can be expressed either as raw values or as percentages. Raw or
nonstandardized attributes, such as the number of active physicians in a
country, contain values indicating the original count or measurement. Such
attributes cannot easily be compared across countries because no standard for
comparison has been established. Raw values can be standardized to a unit of
area or population size. For example, the number of physicians in a country
could be divided by the total population, resulting in the value for the number of
physicians per capita. This standardized value can then be meaningfully
compared to the number of physicians per capita in other countries. Many raw
values in the ArcWorld statistical attribute layers have also been standardized
and are expressed as percentages, per units of measure, or per capita.
Missing measurement values
Sometimes the statistical measurement for a particular geographic area is not
available in the database. The value may be missing for three reasons: the data
is unavailable for an attribute; an entire country was not included in the source
database; or the polygon represents an ocean area. In the statistical coverages,
any of these conditions is represented by a negative code.
Data shown as missing in the World Bank or World Resources Institute (WRI)
tabular databases are indicated by a "-97" in the ArcWorld database. The "-98"
code indicates those ArcWorld countries which have no statistical data because
July 1992
3-9
Chapter 3—Database concepts and organization
ARC/INFOgenerated
attribute
Code attribute
Name attribute
Code attribute
Classification attributes
that particular geo-political unit was not included in the source database. Ocean
area is indicated by a code of "-99". Data are present only for land areas of the
world.
Some minor adjustments to the correspondence between the ArcWorld Federal
Information Processing System (FIPS) publication 10-3 country codes and the
World Bank and World Resources Institute country codes were made by ESRI.
These were generally restricted to polygons representing areas which are subject
to political dispute (country codes beginning with an "X"). Adjustments were
made in sixteen situations; in all of them, ESRI assigned the code of the country
in actual control of the area to the disputed polygons in the items WB_CNTRY
and WRI_CNTRY. (The specific cases are listed in Appendix C.)
To perform statistical analyses with attributes that contain missing measurement
values, first select only those records that contain values greater than -97. True
zeros (zero may represent zero or less than half of the unit of measure) and
negative numbers can occur in those attributes which indicate net rates of
change; so, selecting for positive values may yield an incomplete set of valid
records.
3-10
ArcWorld User's Guide and Data Reference
Chapter 3—Database concepts and organization
Code attributes
Code attributes have either numeric or alphabetic codes. The codes are a short
form for text descriptions of groups or categories. In the ArcWorld database,
code attributes are most common in the cartographic and index layers.
Numeric codes generally begin with "1" and rise sequentially. The code order
may be random, in which case the codes have no inherent numeric meaning.
However, the order may also reflect frequency or relative significance. For
example, in the Roads coverage, the quality of the surface material and speed of
travel decrease with increasing code values. Features that are inadvertently
created and are not the focus of the classification scheme, such as "background"
polygons, are usually represented by extreme value codes, such as "9" or "99".
Alphabetic codes are used sometimes instead of numeric codes. For example,
countries are assigned the Federal Information Processing Standards (FIPS)
two-letter country code. The World Bank uses a three-letter country code.
Two special types of code attributes, repetitive and flag attributes, warrant
discussion. Repetitive attributes share a common set of codes. Repetitive
attributes are useful in situations in which two or more of the codes apply to the
same feature. In the Landsat Scene Index layer, for example, the set of six
repetitive attributes, COUNTRY1 through COUNTRY6, utilizes the country
codes to indicate those countries that occur in a single Landsat scene. The
country codes in these repetitive situations are not in any particular order.
Flag attributes
Flag attributes contain a code that identifies certain records, or features, in a
coverage. Flags are needed in ArcWorld coverages that contain country
polygons in order to generate accurate summary statistical data from
measurement attributes. This is so because of two situations. First, some
countries, such as those that include offshore islands, are represented by
multiple polygons. Second, statistical attributes for a particular country may be
applied to additional polygons such as disputed territories (areas with country
codes beginning with "X"), or areas that were considered to be part of the
country in the source database but are considered as different countries in
ArcWorld.
For measurement attributes, each separate polygon is assigned the total value
for the political unit, resulting in repeating values. For countries or political
July 1992
3-11
Chapter 3—Database concepts and organization
units made up of multiple polygons, the sum of all the records would yield
inflated results. The flag values (in the attribute STAT_FLAG) have been
assigned to the largest polygon in each country or to a statistical calculation
polygon. These flag values allow a single record per political or statistical unit
to be selected for statistical analysis or for displaying text.
Name attributes
Name attributes may contain either alphabetic or alphanumeric names. They
serve two functions in the ArcWorld database. First, they may contain the
English-language equivalents of codes. If so, the user has the option of
generating an on-line display of attribute classes either by name or by code. For
example, in the Rivers and Water Bodies layer, TYPE contains the codes for the
different classes of water features, and WATER_TYPE contains the names for
these classes.
A second function of name attributes is to store place name information for the
geographic features. For example, the attribute called "NAME" in the Major
Cities layer contains city names.
ArcWorld attributes
In Chapters 4 and 5, the attributes within a coverage have been grouped by
topic, or theme, regardless of the type of values they contain. These thematic
attribute groups, which serve to organize the sometimes long lists of coverage
attributes, are intended to help the user locate data of interest in the on-line
feature attribute tables. The most common of the ArcWorld thematic attribute
groups are described below.
Geographic reference attributes
Geographic reference attributes allow the user to create displays that contain
features located in a geographic area of interest, such as country, region, or
continent. Many ArcWorld layers include geographic reference attributes,
although the specific attributes vary from one type of feature representation to
another. The geographic reference attributes used in the ArcWorld database are
presented in Table 2.
3-12
ArcWorld User's Guide and Data Reference
Chapter 3—Database concepts and organization
Table 2: Geographic reference attributes
Attribute Name
Description
COUNTRY
CNTRY_NAME
The two-letter code of the country in which a feature is located,
and the name of the country. 1
REGION
The name of the world region in which a feature is located.1,2
CONTINENT
The name of the continent in which a feature is located.1,2
COUNTRY1
COUNTRY2
The two-letter codes of the countries on each side of a linear
feature.1
CNTRY_NAME
Both of the country names for a linear feature coincident with a
country boundary.1
REGION
Both of the world region names for a linear feature coincident with
a world region boundary.1,2
CONTINENT
Both of the continent names for a linear feature coincident with a
continent boundary.1,2
Notes: 1. A complete listing of country, region, and continent codes is provided in
Appendix C. 2. Regions are shown on the map in Chapter 1.
Classification attributes
Classification attributes, which occur primarily in the cartographic layers,
contain codes or names that are used to organize geographic features. For
example, in the 1:3M Rivers and Water Bodies coverage, the attribute TYPE
contains codes that specify whether a particular polygon represents a river,
reservoir, lake, intermittent lake, or other type of water feature. Categories in
the classification attributes are generally mutually exclusive, although some of
them, like the repetitive country attributes, may be used together.
Cartographic significance attributes
Cartographic significance attributes, which occur in the cartographic layers,
contain codes that indicate cartographic significance or rank. Both a qualitative
and a quantitative scheme are present. The Country Boundaries and the Rivers
and Water Bodies layers employ a qualitative scheme in which features are
assigned one of six ranks ranging from "basic reference" to "minor". The
Roads and Railroads layers use a quantitative scheme based on minimum
July 1992
3-13
Chapter 3—Database concepts and organization
appropriate map scale. Features are assigned one of five scale ranks ranging
from 1:80 million to 1:5 million.
Other attributes
The remaining attributes in the ArcWorld layers are grouped by topic to assist in
locating the desired information. Most of them are measurement attributes.
Some of the attribute groups in the Natural Resources and the Environment
coverage are, for example, Economic, Health, Wilderness, Housing, Natural
resources, Habitat, Energy, Food supply, and Air pollution attributes.
Individual attributes in the Health group include SAFH20UR88 (percentage of
the urban population with access to safe water, in 1988), and IM_MEASL90
(percentage of one-year olds immunized against measles in 1990).
Naming conventions
To ensure consistency, naming conventions were adopted for ArcWorld
coverages and attributes. The names were intended to reflect two aspects of the
database—feature content and map scale—while complying with MS–DOS
restrictions on file name length. Tables 3 and 4 present the conventions used
for coverage and attribute names.
Attributes common to several different layers, such as country name, were
assigned the same attribute name in all layers (CNTRY_NAME). Conversely,
unique attributes were given names that are always unique within a layer and
usually unique across different layers. As an exception, some attributes in the
database have generic names even though they refer to different features. For
example, both the water body and railroad classification code attributes are
named TYPE. The attribute names for the World Bank and the World Resource
Institute statistical data are unique.
3-14
ArcWorld User's Guide and Data Reference
Chapter 3—Database concepts and organization
Table 4: Attribute naming conventions
Convention
Examples
Applied to:
P_ = percentage
P _ AGLAND85
(Percentage of land
used for agriculture in
1965)
Statistical attribute coverages
K = thousand
PLTHR_1K (Number of
threatened or
endangered plant taxa
per 1,000 taxa)
Statistical attribute coverages
_CAP = per capita
ENRG_CAP85 (Energy
consumption per capita)
Statistical attribute coverages
POP_ = population
P O P _ DOCT80
(Population per
physician in 1980)
Statistical attribute coverages
65 = 1965
70 = 1970
75 = 1975
80 = 1980
85 = 1985
89 = 1989
GRW_RATE6 5
(Population growth rate
for the year 1965)
Statistical attribute coverages
with time series or year specific
data
Abbreviation
LABORFOR85 (Number
of economically active
people in 1985)
All attributes
P_0_14_85
(Percentage of the
population between
0 and 14 years of age in
1985)
NETDEFOR85 (Net
annual rate of change to
forest land area in 1985)
July 1992
3-15
Chapter 3—Database concepts and organization
Table 3: Coverage naming conventions
Convention
Examples
Applied to:
Database scale
3M = 1:3,000,000
25M = 1:25,000,000
RDS3M
RDS25M
Cartographic coverages in
ArcWorld 1:3M and 1:25M
World region
E = Eastern Region
W = Western Region
RIV3M_E
RIV3M_W
ArcWorld 1:3M Rivers and
Water Bodies, and Roads
coverages
Content or source
R I V 25M (Rivers)
All coverages
LTLG5 (Latitude/longitude
grid, 5-degree intervals)
WRI_3M (Natural
Resources and the
Environment from the
World Resources
Institute database)
Note: The coverage feature attribute tables are assigned the coverage name plus an
extension for the table type (.PAT for polygons and points, .AAT for arcs). For example, the
file RDS3M.AAT contains the arc attribute table for the RDS3M coverage.
Data sources
This section reviews the sources for ArcWorld data, discusses their currency,
and briefly indicates modifications or enhancements that were made to the
source data for the ArcWorld database. (Appendix A describes the development
of the ArcWorld database in detail, and the data sources and currency are
summarized in Table 5.) The name of the reference document for each source is
also noted where relevant (complete bibliographic references are listed in
Appendix E). These documents should be consulted for a more comprehensive
discussion of the attributes in this database than is possible here.
The primary source for the ArcWorld geographic data was the U.S.
Government’s World Data Bank II at a nominal scale of 1:3,000,000. Other
geographic data were generated or compiled by ESRI, particularly the data for
the index layers and the Browse Map cartographic data. The World Bank's
Social Indicators of Development database for 1990, and the World Resources
Institute's World Resources 1992–1993 Data Base were the sources for the
statistical attributes.
3-16
ArcWorld User's Guide and Data Reference
Chapter 3—Database concepts and organization
Table 5: Sources and currency of ArcWorld 1:3M data
Layers
Graphic Data
Source
Attribute Data Source
Cartographic Layers
Country Boundaries
WDBII, 1988
WDBII, 1988
Country Internal Divisions
WDBII, 1988
WDBII, 1988
Major Cities
Defense Mapping
Agency—Operational
Navigation Charts,
(1:1 million-scale paper
maps), various years
The World Fact Book, 1989
Railroads
WDBII, 1988
WDBII, 1988
Rivers and Water Bodies
WDBII, 1988
WDBII, 1988
Roads
WDBII, 1988
WDBII, 1988
Index Layers
Landsat Nominal Scene Index
EOSAT algorithm, 1992
EOSAT algorithm, 1992
Latitude/Longitude Grids
ESRI, 1992
ESRI, 1992
Operational Navigation Chart
Index
ESRI, 1990
Defense Mapping Agency, ONC
and JNC published indexes
Statistical Layers
Economic and Industrial Indicators
WDBII, 1988
World Bank, Social Indicators of
Development (SID) database, 1990
Education and Literacy
WDBII, 1988
World Bank, SID database, 1990
Food Production and Nutrition
WDBII, 1988
World Bank, SID database, 1990
Health and Vital Statistics
WDBII, 1988
World Bank, SID database, 1990
Labor Force Characteristics
WDBII, 1988
World Bank, SID database, 1990
Natural Resources and the
Environment
WDBII, 1988
World Resources Institute, World
Resources 1992–1993 Data Base
Population Characteristics
WDBII, 1988
World Bank, SID database, 1990
World Data Bank II (WDBII)
World Data Bank II is a digital representation of the coastlines, islands, rivers,
lakes, international boundaries, roads, and railroads of the world for use in
automated mapping systems. The data were originally stream digitized and
have a nominal input scale of 1:3,000,000. The source, scale, and
completeness of the data vary by country. The original data files were in
Cartographic Automatic Mapping (CAM) format and comprised six lineJuly 1992
3-17
Chapter 3—Database concepts and organization
oriented files organized by world regions. The files are CIL (coastlines,
islands, lakes), BDY (boundary), PBY (political boundaries), RIV (rivers),
RRS (railroads), and RDS (roads). The original line orientation of much of the
WDBII data was extensively restructured in order to provide a polygonally
oriented database design for the ArcWorld database. For additional information
about the WDBII data source, see Anderson, Angel, and Gorny (1977).
The WDBII data are the basis for features and attributes in the following
ArcWorld 1:3M cartographic coverages: Country Boundaries, Country Internal
Divisions, Railroads, Rivers and Water Bodies, and Roads. The WDBII data
are also the basis for the country features in all the statistical coverages. The
WDBII database employed in the ArcWorld database is continually being
updated. ArcWorld is based on a 1988 version of WDBII.
Major cities
The locations of major cities in ArcWorld were derived from 1:1,000,000-scale
Operational Navigation Charts published by the U.S. Defense Mapping Agency
(DMA). In a few situations the 1:1,000,000-scale derived point locations were
adjusted to match the 1:3,000,000-scale rendering of the coastline.
Landsat nominal scene indexes
The Landsat satellites are operated by the Earth Observation Satellite Company
(EOSAT). EOSAT provided ESRI with an algorithm for generating two types
of index information for Landsat 4 and 5 scenes: nominal scene center points
and nominal scene footprints. ("Nominal" indicates that the center points and
footprints represent an average, not an absolute, geographic location. The
center points and footprints were averaged because the orientation of the satellite
varied slightly from one orbit to the next.) Nominal scene center points were
calculated first; then scene footprints were mathematically generated with the
center points as the focus. The footprints are rectangular outlines whose exact
dimensions vary with satellite orientation. In the ArcWorld database, these data
are the basis for the Landsat Nominal Scene Index coverages.
World Bank, Social Indicators of Development database, 1990
The World Bank database called Social Indicators of Development 1990 is a
compilation of statistical data for assessing human welfare approximately 170
countries worldwide. Up to ninety-four indicators describe human resources
and natural endowments. Since the data are presented as time-series extending
3-18
ArcWorld User's Guide and Data Reference
Chapter 3—Database concepts and organization
from 1965 to 1989 in five-year intervals, each unique attribute may be repeated
up to six times. The data are tabular and available in digital form. The
attributes are included in the following ArcWorld 1:3M layers: Economic and
Industrial Indicators, Education and Literacy, Food Production and Nutrition,
Health and Vital Statistics, Labor Force Characteristics, and Population
Characteristics. Forty of these attributes are included as part of the ArcWorld
1:25M Statistical Attributes layer. The reference document for this data source
is Social Indicators of Development 1990.
World Resources Institute, World Resources 1992–1993 Data Base
The World Resources 1992–1993 Data Base is one of a series of five statistical
databases developed by the World Resources Institute in collaboration with The
U.N. Environment Programme and the United Nations Development
Programme. The report provides country-level statistical information for the
condition of and trends in the world's natural resources and global
environment. The data are presented in more than fifty tables and are available
in digital form. A subset of 100 attributes is included in the ArcWorld 1:3M
layer called Natural Resources and the Environment. Thirty of these 100
attributes are included as part of the ArcWorld 1:25M Statistical Attributes layer.
The reference document for this data source is World Resources 1992–1993: A
Guide to the Global Environment—Toward Sustainable Development.
ESRI in-house development
Several ArcWorld coverages do not have a specific source, but were developed
for the database by ESRI (e.g., the geographic and attribute data for the
Latitude/Longitude Grids coverages). The Operational Navigation Chart (ONC)
Index was digitized from the Defense Mapping Agency's ONC index map. The
cartographic data for the Browse Map coverages were developed by a
professional cartographer who manually generalized a small-scale version of
WDBII. The redrafted map was then scanned and coded by ESRI.
July 1992
3-19
Chapter 3—Database concepts and organization
Coordinate systems
The ArcWorld database is available in a coordinate system that promotes the use
of the data set both alone and in conjunction with other data sets. ARC/INFO
users will be able to convert the database to other projections. The ArcWorld
1:3M and 1:25M databases also feature a specified coordinate precision.
Projection systems
The ArcWorld 1:3M database is delivered in decimal degrees. Storage in
geographic coordinates facilitates use with other data, which are commonly
supplied in decimal degrees, and enables conversion into the projection of
choice for update or analysis. The units of measure for the decimal degrees are
spherical latitude/longitude coordinates. For example, the latitude/longitude
coordinate of 37°30'15" is expressed as 37.50417.
The ArcWorld 1:25M database is delivered in the Robinson projection as well
as in decimal degrees. The coordinate units employed in conjunction with the
Robinson projection are meters. The central meridian is at zero degrees
longitude. Robinson is a pseudocylindrical projection in which the world
"looks right," with a good balance of size and shape for the land masses. It is
not, however, conformal, equal area, equidistant, or perspective. It has true
direction along all parallels and along the central meridian. Distances are
constant along the equator and other parallels but the scale varies. The
projection has true scale along 38 degrees north and south. There is constant
scale along any given parallel, and the scale is the same along the parallels that
are at equal distances from the equator.
Datum
No single statement can be made about the datum for the ArcWorld data because
the data were originally automated from a variety of source maps whose scale
and reference spheroid (datum) are unknown. The datum used during the
process of inverting the projected map source to decimal degrees is also
unknown. Any differences between datums would generally be insignificant,
however, given the small input scale (nominally 1:3,000,000) of the data and
their intended use (as a small-scale global basemap for thematic mapping and
visual backdrop). As long as the data are expressed in decimal degrees (a
spherical coordinate system), datum is generally not an issue. An appropriate
worldwide or regional datum would need to be selected when any portion of the
3-20
ArcWorld User's Guide and Data Reference
Chapter 3—Database concepts and organization
decimal degree version of the database is projected into a specific projection. A
sphere with a radius of 6,370,997 meters was the referenced datum for the
projection of the ArcWorld 1:25M and Browse Map data into the Robinson
projection.
Coordinate precision
Coordinate precision refers to the maximum number of digits allocated within a
data file for the storage of an x, y, or z coordinate value. Single-precision maps
store as many as seven significant digits for each coordinate. ArcWorld data are
provided in single precision. This means that any x,y coordinate in the
ArcWorld 1:3M database has a locational resolution at least to the nearest 100
meters at the equator. The 1:25M and Browse Map versions of ArcWorld in the
Robinson projection also have a locational resolution to at least the nearest 100
meters at the equator.
Projection conversion capability
ARC/INFO users can employ the PROJECT command to convert the ArcWorld
data into other projections. A coordinate system definition file (PRJ) is
included for each ArcWorld coverage and can be used in ARC/INFO for map
projection conversions. This option is not available to ArcView users.
July 1992
3-21
Chapter 4
In greater detail:
The ArcWorld 1:3M layers
This chapter describes the individual coverages in the ArcWorld 1:3M database.
To avoid repetition, coverages that belong to the same layer are described
together, since coverages in the same layer have the same feature and attribute
definitions, varying only in spatial extent. The layer descriptions are presented
in three major groups (cartographic, index, and statistical attribute). Within
each group, the layers are listed in alphabetical order.
The description of each layer begins with a discussion of the map features and
attributes in that layer. The discussion continues with information about the
particular use of the coverage(s) in that layer. Then a tabular summary of the
layer is given. These tables list the individual coverage names, coverage feature
classes, map feature counts, and the number of database attributes associated
with each feature class. The last part of the layer description, usually the
longest, defines the individual attributes that appear in the coverage feature
attribute tables, and the coding schemes associated with the attributes.
The summary tables for ArcWorld 1:3M layers may list up to three coverage
names for each layer. These coverage names correspond to the full
world coverage and, if required, each of the sectional parts. The section parts
are uniquely identified by directional suffixes: "_E" for east or "_W" for west.
Standard ARC/INFO-generated attributes discussed in Chapter 3 are not
described here, nor are they included in the attribute count in the layer summary
tables.
Detailed attribute field definitions for both dBASE and INFO formats are given
for each layer in Appendix B.
July 1992
4-1
ArcWorld 1:3M cartographic layers
The coverages in the cartographic layers contain basemap geographic features
such as roads, rivers, political boundaries, and city names, which provide a
locational context for the data in the statistical layers. The features in these
coverages represent those that are often placed on maps to orient the user.
These cartographic coverage attributes are confined to those used for
classification, geographic reference, and cartographic significance. The
Country Boundaries coverage described in this section reflects the recent
changes in the former Soviet Union (i.e., independent republics) and Germany
(i.e., one country). The country boundaries used as the cartographic
foundation for the statistical attribute coverages described later do not reflect
these recent political changes so that they match the World Bank and World
Resources Institute tabular data from previous years.
The ArcWorld 1:3M cartographic layers and coverages are listed in the table
below.
Layer
Country Boundaries*
Country Internal Divisions
Major Cities*
Railroads
Rivers and Water Bodies*
Roads
Coverage names
CTRY3M
ADMIN3M
CITY3M
RR3M
RIV3M, RIV3M_E, RIV3M_W
RDS3M, RDS3M_E, RDS3M_W
* Generalized versions of these layers are provided with ArcWorld 1:25M. If you do
not need the detail of the 1:3M coverage, substituting a generalized coverage will
minimize display time.
July 1992
4-3
Chapter 4—ArcWorld 1:3M cartographic layers
Country Boundaries
Country
Boundaries
Layer description
Polygons and Lines
The Country Boundaries layer serves as a country level
basemap for the entire globe. Two hundred forty separate
geopolitical entities are represented and identified according
to the Federal Information Processing Standards (FIPS)
country codes (from FIPS publication 10-3). The fifteen
former Soviet Union republics were upgraded to full
international status. East and West Germany and North and
South Yemen were combined into single countries. These
changes make the layer current to world political conditions
as of January 1, 1992.
Line attributes are present that identify coastlines and six
types of international boundaries. Attributes that permit
countries to be individually selected for display are contained
in both the line and polygon attribute tables. Annotation
containing country names accompanies this layer.
Using the Country Boundaries coverage
Countries with multiple geographic parts such as offshore
islands or overseas territorial possessions are represented in
the database by multiple polygons all having the same
country code. A flag attribute (STAT_FLAG) is provided to
identify the largest polygon for each country. This flag
allows selection of a single data record per country, which is
necessary for correct tabulation purposes. The countries
represented by the most polygons are Canada (1,658),
Philippines (1,286), Indonesia (939), Greenland (542), and
Norway (361).
July 1992
4-5
Chapter 4—ArcWorld 1:3M cartographic layers
Country Boundaries
Summary of the Country Boundaries coverage
Coverage name:
CTRY3M
Source and currency: U.S. Government—World Data Bank II, 1988
Thematic attribute
groups:
Geographic reference attributes (polygons and lines)
World organization membership (polygons)
Land/ocean indicator (polygons)
Cartographic significance (polygons)
Statistical flag (polygons)
Classification attribute (lines)
International boundary status attribute (lines)
Boundary coincidence with rivers (lines)
Annotation text:
Country names
Feature
class
Polygons
Lines
Feature
Number of features
All polygon features
Represented by ca. 12,902 polygons
Geopolitical units
256 features represented by ca. 12,132
polygons
Continents
Represented by ca. 208 polygons
Offshore islands
Represented by ca. 11,924 polygons
All line features
Represented by ca. 18,040 lines
Coastlines
Represented by ca. 14,351 lines
International
boundaries (all types)
Represented by ca. 1,204 lines
Coral reefs
Represented by ca. 1,525 lines
Number of
attributes
19
9
In special circumstances, separate geographical areas have
been defined in the coverage that do not have an equivalent
FIPS country code. In the sixteen cases where this
occurred, ESRI assigned a series of special country codes all
beginning with the letter "X". Instead of indicating a
country name these X-series codes provide a description of
the special circumstances present for these areas. For
4-6
ArcWorld User's Guide and Data Reference
Chapter 4—ArcWorld 1:3M cartographic layers
Country Boundaries
example, XG equals "Chinese control claimed by India,"
and XN equals "Sudan, administered by Egypt." See
Appendix C for a complete listing of X-series codes.
The country name annotation was placed so that it would not
overlap the city name annotation that accompanies the Major
Cities layer.
Polygon attributes
Geographic reference attributes
COUNTRY
CNTRY_NAME
REGION
CONTINENT
These attributes contain the following: FIPS 10-3 two-letter
country codes, country names, region names, and continent
names. Codes for countries and region and continent names
are listed in Appendix C. The world regions are shown on
the map in Chapter 1. These geographic reference codes can
be used to select particular country polygons, world regions,
or entire continents for display or study.
Land/ocean indicator
LAND_OCEAN
The codes for this attribute identify continents, islands, and
ocean areas, as follows:
Codes
Definitions
1 = Continent
2 = Offshore island
3 = Ocean
Cartographic significance
ISLND_RANK
July 1992
Offshore islands are ranked for cartographic significance,
primarily on the basis of size. These rank codes are present
only for islands surrounded by ocean; no islands within
inland water bodies are included in this layer. Greenland is
the largest island. Of the approximately 11,925 islands in
4-7
Chapter 4—ArcWorld 1:3M cartographic layers
Country Boundaries
the coverage, fewer than 18 percent (ca. 2,100) are ranked
as basic reference features. The codes are as follows:
Codes
1
2
3
4
5
9
=
=
=
=
=
=
Definitions
Basic reference feature
Major
Additional major
Intermediate
Minor
Unranked
Statistical flag
STAT_FLAG
Flag attribute used to identify a single polygon for each FIPS
10-3 country code. The flag is applied to the largest polygon
(based on area) in each country. The codes are as follows:
Codes
Definitions
0 = Other polygon
1 = Largest polygon per country
Note: the STAT_FLAG attributes in the statistical attribute
coverages include an additional code value ("2") in order to
accommodate the generation of summary statistics.
World organization membership attributes
These attributes indicate membership in international
organizations. Each of the organization attributes can be
used to select a group of country polygons for display or
study. The codes are as follows:
Codes
Definitions
0 = Not a member of this organization
1 = A member of this organization
4-8
EEC
European Economic Community (12 members).
FAO
Food and Agriculture Organization (157 members).
ArcWorld User's Guide and Data Reference
Chapter 4—ArcWorld 1:3M cartographic layers
Country Boundaries
GA
GA_MEMB_YR
United Nations General Assembly (159 members), and the
year that the country joined the U.N. General Assembly.
IAEA
International Atomic Energy Agency (110 members;
excludes Vatican City, which is not part of the database).
IBRD
International Bank for Reconstruction and Development
(i.e.,World Bank; 152 members).
IMF
OPEC
SC
UNESCO
International Monetary Fund (154 members).
Organization of Petroleum Exporting Countries
(13 members).
United Nations Security Council (5 permanent members).
United Nations Education, Scientific and Cultural
Organization (159 members).
WHO
World Health Organization (165 members).
WMO
World Meteorological Organization (158 members
represented in this database).
Line attributes
Classification attributes
TYPE
BND_TYPE
July 1992
Each line is classified according to the type of feature it
represents. This attribute allows you to symbolize different
line features (political boundaries, coastlines, reefs, etc.)
differently. TYPE contains the code number, and
BND_TYPE contains the English description. The codes are
as follows:
4-9
Chapter 4—ArcWorld 1:3M cartographic layers
Country Boundaries
Codes
1
2
3
4
9
=
=
=
=
=
Equivalents
Coastline
International boundary
Coral reef
World region boundary
Grid line
Grid lines (code 9) have been incorporated into this coverage
for processing purposes. These grid lines carry no thematic
information and can be "turned off" during data displays by
reselecting for all TYPE codes not equal to 9. The grid lines
follow lines of longitude and latitude.
International boundary status attribute
BND_STATUS
Each international boundary is classified according to
boundary status. This attribute allows you to display the
various types of boundaries using different colors or line
symbols. The codes are as follows:
Codes
1
2
3
4
5
6
9
4-10
=
=
=
=
=
=
=
Definitions
Demarcated or delimited
Indefinite or in dispute
Line of separation or sovereignty on land
Demilitarized zone in Israel
No defined line
Selected claim lines
Not an international boundary
ArcWorld User's Guide and Data Reference
Chapter 4—ArcWorld 1:3M cartographic layers
Country Boundaries
Boundary coincidence with rivers
BND_COINC
Each international boundary is classified as whether it is
coincident with a river line segment in the RIV3M coverage.
This attribute allows you to identify those portions of
international boundaries that were considered coincident with
a river or a portion of a river. This determination was made
by the United States government agency that originally
developed World Data Bank II. Approximately 35 percent
of the international boundary lines in the coverage are
classified as coincident. The codes are as follows:
Codes
Definitions
0 = Not coincident with river line segment
1 = Coincident with river line segment
Geographic reference attributes
COUNTRY1
COUNTRY2
CNTRY_NAME
REGION
CONTINENT
These attributes contain the following: two-letter country
codes (two attributes), country names, regional codes, and
continent codes. The countries on either side of an international boundary are listed by code in separate attributes
(COUNTRY1 and COUNTRY2), and by name in a single
attribute (CNTRY_NAME; e.g., "France/Germany"). Only
one country is identified for coastlines. A similar dual
coding scheme was used for boundaries between regions
and continents, except that codes rather than names were
used.
The "KQ" (Kingman Reef) country code exists only as a line
attribute. The land area of Kingman Reef is too narrow to be
represented as a polygon at 1:3 million scale.
Countries, regions, and continents and their corresponding
codes are listed in Appendix C; regions are also shown on
the map in Chapter 1.
July 1992
4-11
Chapter 4—ArcWorld 1:3M cartographic layers
Country
Internal
Divisions
Layer description
Lines
The Country Internal Divisions layer contains the internal
administrative boundaries for 126 countries worldwide.
Since the hierarchy of naming conventions for internal
divisions varies from country to country, the internal
division boundaries are coded in the database according to
the hierarchical level they occupy in each country. For
example, in the United States a state boundary would be a
first-order division boundary, while a county boundary
would be a second-order division boundary.
Using the Country Internal
Divisions coverage
To display the country internal division lines for one or more
countries, the following sequence is recommended. First,
select and display the desired polygon features for the area of
interest. Second, select the desired internal division
boundary level.
Of the approximately 10,500 internal division lines,
72 percent represent first-order boundaries. Only fifteen
fourth-order internal division boundary lines exist in the
database; these all occur in the Philippines.
This layer contains lines that are only country internal
divisions. Internal division lines terminate at the coastline
and at international boundaries. In order to obtain complete
visual closure of internal division boundaries within a
4-12
ArcWorld User's Guide and Data Reference
Chapter 4—ArcWorld 1:3M cartographic layers
Country Internal Divisions
Summary of the Country Internal Divisions coverage
Coverage name:
ADMIN3M
Source and currency: U.S. Government—World Data Bank II, 1988
Thematic attribute
groups:
Feature
class
Lines
Classification attribute
Boundary coincidence with rivers
Geographic reference attributes
Number of features
Number of
attributes
All line features
Represented by ca. 14,675 lines
6
First-order division
boundaries
Represented by ca. 10,500 lines
Second-order division
boundaries
Represented by ca. 3,875 lines
Third-order division
boundaries
Represented by ca. 275 lines
Fourth-order division
boundaries
Represented by 15 lines
Feature
country it is necessary to display the coastline and/or the
international boundaries.
In a few countries (e.g., South Africa) some internal
divisions may not connect to any other feature at one end.
July 1992
4-13
Chapter 4—ArcWorld 1:3M cartographic layers
Country Internal Divisions
Line attributes
Classification attribute
BND_LEVEL
This attribute provides the level number of the country
internal division boundary. The first order is the highest
level administrative division within the country (state,
province, department, etc.). The number of levels present
varies from country to country. The codes are as follows:
Codes
1
2
3
4
=
=
=
=
Definitions
First-order internal division
Second-order internal division
Third-order internal division
Fourth-order internal division
Boundary coincidence with rivers
BND_COINC
Each internal division boundary is classified as to
coincidence with a river line segment. Approximately
18 percent of the internal division boundary lines are coded
as coincident. The codes are as follows:
Codes
Definitions
0 = Not coincident with river line segment
1 = Coincident with river line segment
Geographic reference attributes
COUNTRY
CNTRY_NAME
REGION
CONTINENT
4-14
These attributes contain the following: two-letter country
codes, country names, regional codes, and continent codes.
Where a line represents a regional or continent boundary,
both areas are named (e.g., N_A/S_A). These attributes
make it possible to select administrative divisions by
country, world region, and continent. The areas and their
corresponding codes are listed in Appendix C; regions are
also shown on the map in Chapter 1.
ArcWorld User's Guide and Data Reference
Chapter 4—ArcWorld 1:3M cartographic layers
Major Cities
Major Cities
Layer description
The Major Cities layer contains point features representing
451 cities worldwide, including both large urban centers and
national capitals. There are name attributes for both the
conventional (Romanized) and native spellings of each city.
The names and spellings presented here reflect the decisions
and determinations of the International Board of Geographic
Names as of January 31, 1992. Annotation containing city
names also accompanies this layer.
Points
Using the Major Cities coverage
The Major Cities point features are useful as general
geographic identifiers, especially for small-scale maps. The
attributes for the cities allow very large population centers
and national capitals to be differentiated from other types of
cities. The countries with the largest number of cities are the
United States (40), China (35), Russia (19), and India (17).
Given the difficulty of representing and displaying diacritical
marks, the diacritical attribute indicates only the presence of
a diacritical mark. The diacritical mark may be of any type
and may appear at any location in the city name.
The annotated city names are in cartographically appropriate
positions that are compatible with the annotated country
names in the Country Boundaries layer. The size of these
names will automatically change when the scale of a display
map is changed.
July 1992
4-15
Chapter 4—ArcWorld 1:3M cartographic layers
Major Cities
Summary of the Major Cities coverage
Coverage name:
CITY3M
Source and currency: Cartography from the Defense Mapping Agency, Operational Navigation
Charts, various years. Attribute data from the World Fact Book, 1989.
Thematic attribute
groups:
Name attribute
Classification attributes
Additional name attribute
Geographic reference attributes
Annotation text:
City names
Feature
class
Points
Feature
Number of features
All point features
Represented by ca. 450 points
Capitals
Represented by 144 points
Major cities
Represented by 42 points
Number of
attributes
9
Point attributes
Name attribute
NAME
This attribute contains the conventional spelling (Romanized)
of the city. The name and spelling follow the Board of
Geographic Names standards as of January 31, 1992.
Classification attributes
CAPITAL
This attribute indicates whether the city is a national capital.
The codes are as follows:
Codes
Definitions
0 = Not a national capital
1 = A national capital
4-16
ArcWorld User's Guide and Data Reference
Chapter 4—ArcWorld 1:3M cartographic layers
Major Cities
MAJ_CITY
This attribute indicates whether a non-national capital city
has a population greater than 3,000,000. The codes are as
follows:
Codes
Definitions
0 = Not a major city
1 = A major city
Geographic reference attributes
COUNTRY
CNTRY_NAME
REGION
CONTINENT
These geographic reference codes can be used to select cities
by country, world region, or continent. Continent, region,
and country names and their codes are listed in Appendix C.
Additional name attributes
LOCAL_NAME
This attribute contains the local or native spelling of the city.
The name and spelling follow the current Board of
Geographic Names standards as of January 31, 1992. The
spelling in this attribute is the closest possible rendering
using a standard English character set. No special foreign
characters were used and no diacritical marks except the
apostrophe are present.
DIACR_FLAG
This attribute indicates whether diacritical marks are used in
the local spelling of the city. The codes are as follows:
Codes
Definitions
0 = No diacritical mark present
1 = Diacritical mark is present
July 1992
4-17
Chapter 4—ArcWorld 1:3M cartographic layers
Railroads
Layer description
The Railroads layer contains railroad information for more
than 135 countries around the world. It includes both a rail
type attribute, which contains primarily gauge width
information, and a display scale attribute, which provides
feature selection ability based on map scale.
Lines
Using the Railroads coverage
The completeness of the railroad data varies by country. The
countries with the largest number of railroad line segments
are Russia (6,123), China (3,001), and Germany (2,258).
The code structure in the display scale attribute indicates the
smallest scale at which it would be cartographically
appropriate to display a particular railroad line segment. (It
would be appropriate to display a railroad line at larger scales
than the one listed.) The smallest appropriate display scale
(or representative fraction) is 1:80,000,000; the largest is
1:5,000,000.
Appendix D contains information about the completeness of
the Railroads layer.
4-18
ArcWorld User's Guide and Data Reference
Chapter 4—ArcWorld 1:3M cartographic layers
Railroads
Summary of the Railroads coverage
Coverage name:
RR3M
Source and currency: U.S. Government—World Data Bank II, 1988
Thematic attribute
groups:
Feature
class
Lines
Classification attributes
Cartographic significance
Geographic reference attributes
Feature
Number of features
All line features
Represented by ca. 26,925 lines
Broad gauge
Represented by ca. 8,000 lines
Standard gauge
Represented by ca. 12,600 lines
Narrow gauge
Represented by ca. 4,125 lines
Ferries
Represented by ca. 30 lines
Under construction
(all types)
Represented by ca. 30 lines
Undifferentiated
Represented by ca. 2,150 lines
Number of
attributes
7
Line attributes
Classification attributes
TYPE
RAIL_TYPE
Each railroad segment is classified according to the
following list of road types. TYPE contains the code
number, and RAIL_TYPE contains the English description.
Codes
1
2
3
4
5
6
=
=
=
=
=
=
Equivalents
Broad gauge
Standard gauge
Narrow gauge
Railroad ferry
Broad gauge under construction
Standard gauge under construction
(continued)
July 1992
4-19
Chapter 4—ArcWorld 1:3M cartographic layers
Railroads
Codes
Equivalents
7 = Narrow gauge under construction
8 = Undifferentiated under construction
9 = Undifferentiated
There are no standard measurement values for broad,
standard, and narrow gauge widths. The actual widths for
these terms vary from country to country. In Canada,
Western Europe, and the United States standard gauge is
defined as 4 feet 8.5 inches (1.435 meters).
Cartographic significance
DISP_SCALE
Each railroad segment is classified with an appropriate
display scale ranking. The rankings range from a map scale
of 1:80,000,000 (smallest) to 1:5,000,000 (largest).
Codes
80
40
20
10
5
0
=
=
=
=
=
=
Definitions
1:80,000,000 scale
1:40,000,000 scale
1:20,000,000 scale
1:10,000,000 scale
1:5,000,000 scale
Additional unranked railroads
Geographic reference attributes
COUNTRY
CNTRY_NAME
REGION
CONTINENT
4-20
These attributes contain names and codes that make it
possible to select railroad features by country, world region,
and continent. Continents, regions, and countries and their
codes are listed in Appendix C.
ArcWorld User's Guide and Data Reference
Chapter 4—ArcWorld 1:3M cartographic layers
Rivers and Water Bodies
Rivers and
Water Bodies
Layer description
The Rivers and Water Bodies layer contains hydrographic
features. This coverage is made up of both lines and
polygons that represent perennial rivers, intermittent rivers,
canals, lakes, reservoirs, intermittent lakes, salt pans,
lagoons, ice shelves, and islands within inland water bodies.
Polygons and lines
Using the Rivers and Water Bodies
coverages
Because the Rivers and Water Bodies layer contains both
polygon and line features, a single hydrologic feature may
have been represented by both of these graphic elements.
For example, the Indus river begins as a single line, enters a
polygonal reservoir, changes to a braided stream represented
by a network of interconnected lines, changes into a
polygonal river with islands, and ends up meeting the ocean
in a delta represented by multiple diverging lines.
The Rivers and Water Bodies layer exists as three coverages.
There is a full global coverage (RIV3M) which can be used
for display, as well as east and west subsections (RIV3M_E,
RIV3M_W) which can be used for querying the database.
The dividing line between the subsections follows the
27 degree West longitude line from pole to pole.
July 1992
4-21
Chapter 4—ArcWorld 1:3M cartographic layers
Rivers and Water Bodies
Summary of the Rivers and Water Bodies coverages
Coverage names:
RIV3M, RIV3M_E, RIV3M_W
Source and currency: U.S. Government—World Data Bank II, 1988
Thematic attribute
groups:
Feature
class
Polygons
Lines
4-22
Classification attributes (polygons and lines)
Cartographic significance (polygons and lines)
Geographic reference attributes (polygons and lines)
Boundary coincidence with rivers (lines)
Number of features
(full coverage)
Number of
attributes
All polygon features
Represented by ca. 10,825 polygons
7
Rivers
Represented by ca. 150 polygons
Reservoirs
Represented by ca. 275 polygons
Lakes
Represented by ca. 6,300 polygons
Intermittent lakes
Represented by ca. 275 polygons
Salt pans
Represented by ca. 300 polygons
Lagoons
Represented by 6 polygons
Inland water islands
Represented by ca. 1,600 polygons
Ice shelves
Represented by 65 polygons
Not inland water
Represented by ca. 1,885 polygons
All line features
Represented by ca. 35,600 lines
Perennial rivers
Represented by ca. 21,100 lines
Intermittent rivers
Represented by ca. 1,325 lines
Canals
Represented by ca. 175 lines
Irrigation canals
Represented by ca. 215 lines
Shorelines
Represented by ca.11,325 lines
Country boundaries
Represented by 259 lines
Closure lines
Represented by 8 lines
Grid lines
Represented by 1,225 lines
Feature
9
ArcWorld User's Guide and Data Reference
Chapter 4—ArcWorld 1:3M cartographic layers
Rivers and Water Bodies
Polygon attributes
Classification attributes
TYPE
WATER_TYPE
Each polygon is classified according to the type of water
feature it represents. TYPE contains the code number, and
WATER_TYPE contains the English description. The codes
are as follows:
Codes
1
2
3
4
5
6
7
8
9
=
=
=
=
=
=
=
=
=
Equivalents
River
Reservoir
Perennial lake
Intermittent lake
Salt pan
Lagoon
Island (inland waterbodies only)
Ice shelf (Antarctica only)
Not inland water
The island code applies only to inland water bodies. Islandlike features formed by the interweaving of single lines such
as occur in a braided stream or in the distributaries of deltas
are given a code of "9" (not inland water).
Cartographic significance
WATER_RANK
Polygonal water features have been ranked for cartographic
significance, primarily on the basis of size and visual
prominence. This attribute allows the user to selectively
display those water features that are appropriate to the
chosen map scale or needed for visual reference. The codes
are as follows:
Codes
0
1
2
3
4
5
9
July 1992
=
=
=
=
=
=
=
Definitions
Unranked water feature
Basic reference
Major
Additional major
Intermediate
Minor
Not inland water
4-23
Chapter 4—ArcWorld 1:3M cartographic layers
Rivers and Water Bodies
Geographic reference attributes
COUNTRY
CNTRY_NAME
REGION
CONTINENT
These geographic reference attributes contain codes and
names that make it possible to select polygonal water
features by country, world region, and continent. The areas
and their corresponding codes are listed in Appendix C;
regions are also shown on the map in Chapter 1.
Line attributes
Classification attributes
TYPE
RIVER_TYPE
Each line is classified according to type of feature it
represents. TYPE contains the code number, and
RIVER_TYPE contains the English description. These
attributes allow you to select and symbolize the various
water features differently. The majority of lines are
perennial rivers, but other water features are present. Also
present in this layer are a few international boundaries,
polygon closure lines, and grid lines.
Codes
1
2
3
4
5
6
7
9
=
=
=
=
=
=
=
=
Equivalents
Perennial river
Intermittent river
Canal
Irrigation canal
Shoreline
Country boundary
Closure line
Grid lines
Some short sections of international boundaries (code 6) are
included in this layer as line features. This was necessary in
order to divide water bodies located in two or more countries
into their component national territories.
Closure lines (code 7) separate abutting water feature
polygons. They are most often used to show reservoirs
along rivers where the rivers and reservoirs are large enough
to be represented as polygons.
4-24
ArcWorld User's Guide and Data Reference
Chapter 4—ArcWorld 1:3M cartographic layers
Rivers and Water Bodies
Cartographic significance
RIVER_RANK
Perennial rivers, intermittent rivers, and canals have been
ranked for cartographic significance on the basis of overall
size, length, volume, and visual prominence. This attribute
allows the user to selectively display those water features
that are appropriate to the chosen map scale or needed for
visual reference. The codes are as follows:
Codes
1
2
3
4
9
=
=
=
=
=
Definitions
Major
Additional major
Additional
Minor
Unranked
Boundary coincidence with rivers
RIV_COINC
This attribute identifies those portions of rivers that were
deemed coincident with an international border or portions of
an international border in the CTRY3M coverage.
Approximately 25 percent of the river lines in this coverage
are classified as coincident. The codes are as follows:
Codes
Definitions
0 = Not coincident with an international boundary line
segment
1 = Coincident with an international boundary line
segment
Geographic reference attributes
COUNTRY1
COUNTRY2
CNTRY_NAME
REGION
CONTINENT
July 1992
These attributes contain the following: two-letter country
codes (two attributes), country names, regional codes, and
continent codes. Because rivers often serve as international
boundaries, two country code attributes have been provided.
The countries on either side of a river are listed by code in
separate attributes (COUNTRY1 and COUNTRY2), and by
name in a single attribute (CNTRY_NAME; e.g.,
"France/Germany"). If a river is completely within a
4-25
Chapter 4—ArcWorld 1:3M cartographic layers
Rivers and Water Bodies
country, either COUNTRY1 or COUNTRY2 will contain a
blank.
Where rivers form the boundaries between regions and
continents, both area codes are listed and separated by a
slash (e.g., E_EU/W_EU).
Countries, regions, and continents and their corresponding
codes are listed in Appendix C; regions are also shown on
the map in Chapter 1.
4-26
ArcWorld User's Guide and Data Reference
Chapter 4—ArcWorld 1:3M cartographic layers
Roads
Roads
Layer description
The Roads layer contains information about roads for more
than 150 countries around the world. It includes attributes
for road type (primarily surface type), an attribute that makes
it possible to select features on the basis of map scale, and
geographic reference attributes.
Lines
Using the Roads coverages
The Roads layer exists as three coverages. There is a full
global coverage (RDS3M) which can be used for display, as
well as east and west subsections (RDS3M_E, RDS3M_W)
which can be used for querying the database. The dividing
line between the subsections coincides with the Europe/Asia
world region border in Russia, then extends through the
Caspian Sea and along the Iranian boundary with
Turkmenistan, Afghanistan, and Pakistan, south to the
Arabian Sea.
The user can minimize display drawing times by working
with a subset of roads data whenever possible. Geographic
reference attributes, the cartographic significance attribute,
and the road type attributes are useful for creating data
subsets.
The completeness of roads data varies by country. The
countries with the largest number of road line segments are
China (15,666), Russia (3,286), Germany (1,819), and the
Philippines (1,815). Appendix D contains information about
the completeness of the Roads layer.
The code structure in the display scale attribute indicates the
smallest scale at which it would be cartographically
July 1992
4-27
Chapter 4—ArcWorld 1:3M cartographic layers
Roads
Summary of Roads coverages
Coverage names:
RDS3M, RDS3M_E, RDS3M_W
Source and currency: World Data Bank II, 1988
Thematic attribute
groups:
Feature
class
Lines
Classification attributes
Cartographic significance
Geographic reference attributes
Number of features
(full coverage)
Number of
attributes
All line features
Represented by ca. 55,500 polygons
7
High-speed roads
Represented by ca. 2,750 lines
Hard surface roads
Represented by ca. 24,000 lines
Gravel roads
Represented by ca. 8,675 lines
Unsurfaced roads
Represented by ca. 13,300 lines
Tracks and trails
Represented by ca. 6,100 lines
Roads under
construction
Represented by ca. 25 lines
Undifferentiated roads
Represented by ca. 625 lines
Feature
appropriate to display a particular road line segment. (It
would be appropriate to display the road segment at larger
scales than the one listed.) The smallest appropriate display
scale (or representative fraction) is 1:80,000,000; the largest
is 1:5,000,000.
4-28
ArcWorld User's Guide and Data Reference
Chapter 4—ArcWorld 1:3M cartographic layers
Roads
Line attributes
Classification attributes
TYPE
ROAD_TYPE
Each road segment is classified according to the following
list of road types. TYPE contains the code number, and
ROAD_TYPE contains the English description.
Codes
1
2
3
4
5
6
7
=
=
=
=
=
=
=
Equivalents
Highspeed
Hard surface
Gravel
Unsurfaced
Track or trail
Under construction
Undifferentiated
Cartographic significance
DISP_SCALE
Each road segment is classified with appropriate display
scale ranking. The rankings range from a map scale of
1:80,000,000 (smallest) to 1:5,000,000 (largest).
Codes
80
40
20
10
5
0
=
=
=
=
=
=
Definitions
1:80,000,000 scale
1:40,000,000 scale
1:20,000,000 scale
1:10,000,000 scale
1:5,000,000 scale
Additional unranked roads
Geographic reference attributes
COUNTRY
CNTRY_NAME
REGION
CONTINENT
July 1992
These geographic reference attributes contain codes and
names that make it possible to select road features by
country, world region, and continent. The areas and their
corresponding codes are listed in Appendix C; regions are
also shown on the map in Chapter 1.
4-29
ArcWorld 1:3M index layers
The coverages in the ArcWorld 1:3M index layers include three
latitude/longitude grids, a scene index for Landsat satellite data, and an index to
Operational Navigation Charts published by the U.S. Defense Mapping
Agency. Users can quickly determine the location of geographic features by
using one of the latitude/longitude grids. The map and satellite indexes provide
information needed for ordering those products; they can also provide a
convenient way to zoom in on a particular study area. The ArcWorld 1:3M
index layers are listed in the table below.
Layer
Coverage names
Landsat Nominal Scene Index
SAT_PT, SAT_BND
Latitude/Longitude Grids
LTLG5, LTLG10, LTLG20*
Operational Navigation Chart (ONC) Index ONC_IDX
* The LTLG20 coverage is also provided with ArcWorld 1:25M.
July 1992
4-31
Chapter 4—ArcWorld 1:3M index layers
Landsat Nominal Scene Index
Landsat
Nominal
Scene Index
Layer description
Points
The Landsat Nominal Scene Index layer contains a
worldwide index of 233 paths and 113 rows for a total of
more than 26,000 nominal satellite scenes. The scene
outlines apply to both Thematic Mapper and Multispectral
Scanner data acquired by Landsats 4 and 5. The index is
composed of two coverages, one containing the scene center
points, and the other containing scene footprints. The
attributes in both coverages are the same; they include path
numbers, row numbers, latitude/longitude coordinates, and
countries covered.
A scene footprint is a rectangular outline that represents the
geographic extent of the Earth's surface for which data are
collected along a particular Landsat orbit. Each footprint is
identified by an orbital path number and scene row number,
and each footprint has a corresponding center point.
Lines
Using the Landsat Nominal Scene
Index coverages
This index is termed "nominal" because minor fluctuations in
the satellite's orbit from one pass to the next can cause the
actual scene center points and coverages to vary slightly.
The index itself was generated through an algorithm and
indicates an average orbital pass.
Only scenes occurring during the daylight hours were
included in this index. Rows in very close proximity to the
north and south poles were excluded from this index because
the extreme degree of overlap made them visually
indecipherable.
July 1992
4-33
Chapter 4—ArcWorld 1:3M index layers
Landsat Nominal Scene Index
Summary of the Landsat Nominal Scene Index coverages
Point coverage
Coverage name:
SAT_PT
Source and currency: Nominal scene algorithm provided by the Earth Observation Satellite
Company, 1992
Thematic attribute
groups:
Feature
class
Points
Identification attributes
Country names
Feature
Number of features
Number of
attributes
Landsat nominal scene represented by 26,325 points
center points
15
Boundary coverage
Coverage name:
SAT_BND
Source and currency: Nominal scene algorithm provided by the Earth Observation Satellite
Company, 1992
Thematic attribute
groups:
Feature
class
Lines
Identification attributes
Country names
Feature
Number of features
Landsat nominal scene Represented by ca. 26,325 lines
footprints
Number of
attributes
15
A scene footprint resembles a polygon but is represented by
a single self-closing line. The footprint boundary lines may
be queried, but because the outer margins of the footprints
overlap somewhat, we recommend that you query this layer
by using the scene center points.
4-34
ArcWorld User's Guide and Data Reference
Chapter 4—ArcWorld 1:3M index layers
Landsat Nominal Scene Index
Scenes cover portions of up to six countries. The countries
with the largest number of scenes are Russia (ca. 1,840),
Antarctica (ca. 1,630), and Canada (ca. 1,140). More than
15,500 scenes cover only ocean areas.
Point attributes
These attributes are also associated with the line coverage.
Identification attributes
PATH
ROW
SCN_CENTER
Latitude and longitude of the scene center, expressed as
degrees, minutes, seconds, north or south latitude, followed
by degrees, minutes, seconds east or west longitude.
Example: 78 07 48N 016 04 12W.
COUNTRY1
COUNTRY2
COUNTRY3
COUNTRY4
COUNTRY5
COUNTRY6
These attributes contain the two-letter codes for the countries
the scene covers (to a maximum of six). The country codes
are always stored beginning with COUNTRY1, but the
countries are not listed in any specific order. Because of the
high density of disputed areas in Palestine, the codes for
disputed areas in this region of the world (XA through XE)
were not included beyond six separate political entities per
Landsat scene. (A complete listing of country codes is
contained in Appendix C.)
CNTRY_NAM1
CNTRY_NAM2
CNTRY_NAM3
CNTRY_NAM4
CNTRY_NAM5
CNTRY_NAM6
July 1992
Landsat satellite path number and row number.
The names of the countries the scene covers are stored in
these attributes. The country names are always stored
beginning with CNTRY_NAM1, but they are not presented
in any specific order.
4-35
Chapter 4—ArcWorld 1:3M index layers
Latitude/
Longitude
Grids
Layer description
The Latitude/Longitude Grids layer contains lines that
represent geographic parallels (lines of latitude) and
meridians (lines of longitude) at intervals of 5 degrees,
10 degrees, and 20 degrees. The grids for the three
intervals are contained in separate coverages. Attributes
include the latitude or longitude value of each line and codes
indicating whether a line segment is over land or ocean.
Lines
Using the Latitude/Longitude
Grids coverages
The "land/water" attribute gives you the flexibility to
symbolize the latitude/longitude grid differently so as to
bring it to the foreground or background of a display. For
example, you might choose to display the graticule in the
ocean areas (background), and to exclude it from the area
inside the countries to avoid obscuring other map features.
The scale of a map and the extent to which the grid will be
used for reference will determine the most suitable grid
interval. The 20-degree grid is appropriate for small-scale
displays, such as maps showing the full extent of the world.
The 10-degree grid is more appropriate for continental or
regional displays, while the 5-degree grid is best suited for
large-scale maps showing a country or selected area.
4-36
ArcWorld User's Guide and Data Reference
Chapter 4—ArcWorld 1:3M index layers
Latitude/Longitude Grids
Summary of Latitude/Longitude Grids coverages
Five-degree-interval coverage
Coverage name:
LTLG5
Source and currency: ESRI, generated, 1992
Thematic attribute
groups:
Feature
class
Lines
Identification attributes
Feature
Latitude and longitude
lines, 5- by 5-degree
grid
Number of features
Represented by ca. 9,375 lines
Number of
attributes
3
Ten-degree-interval coverage
Coverage name:
LTLG10
Source and currency: ESRI, generated, 1992
Thematic attribute
groups:
Feature
class
Lines
July 1992
Identification attributes
Feature
Number of features
Latitude and longitude Represented by ca. 3,440 lines
lines, 10- by 10-degree
grid
Number of
attributes
3
4-37
Chapter 4—ArcWorld 1:3M index layers
Latitude/Longitude Grids
Twenty-degree-interval coverage
Coverage name:
LTLG20
Source and currency: ESRI, algorithm generated, 1992
Thematic attribute
groups:
Feature
class
Lines
Identification attributes
Feature
Number of features
Latitude and longitude Represented by ca. 1,450 lines
lines, 20- by 20-degree
grid
Number of
attributes
3
Line attributes
Identification attributes
LATITUDE
The latitude of the grid line. All south latitude values begin
with a minus sign. This attribute contains a blank for lines
of longitude.
LONGITUDE
The longitude of the grid line. All west longitude values
begin with a minus sign. This attribute contains a blank for
lines of latitude.
LAND_WATER
Identifies whether a line segment is over land or water. The
codes are as follows:
Codes
Definitions
0 = Line segment lies over an ocean area
1 = Line segment lies over land or inland water
4-38
ArcWorld User's Guide and Data Reference
Chapter 4—ArcWorld 1:3M index layers
Operational Navigation Chart Index
Operational
Navigation
Chart Index
Layer description
The outlines of the Operational Navigation Chart (ONC)
sheet boundaries are shown in this layer. The identification
attribute contains the sheet identification numbers (G18,
P27, etc.). Six Defense Mapping Agency Jet Navigation
Charts (JNCs) which cover south polar areas not covered by
the ONC series, are included in the index.
Lines
Using the Operational Navigation Chart
Index coverage
This layer provides a visual reference for the relationship
between the ArcWorld database and ONC map sheets. The
polygons in this coverage can be queried for their sheet
identification numbers. The ONC index covers only the land
areas of the world.
July 1992
4-39
Chapter 4—ArcWorld 1:3M index layers
Operational Navigation Chart Index
Summary of the Operational Navigation Chart Index coverage
Coverage name:
ONC_IDX
Source and currency: U.S. Defense Mapping Agency—Operational Navigation Chart (ONC) and Jet
Navigation Chart (JNC) Standard Index Chart, 1988
Thematic attribute
groups:
Feature
class
Polygons
Identification attribute
Feature
Number of features
Number of
attributes
ONC map sheet boundaries
Represented by ca. 300 polygons
1
Polygon attribute
Identification attribute
MAP_ID
This attribute contains the map sheet identification code. The
ONC codes comprise a single letter followed by two digits
(e.g., H06), are based on a modified row and column
scheme. Rows are lettered A through V from north to south;
the letters I and O are excluded. Columns are numbered
from east to west beginning with the sheet that falls between
zero degrees longitude and fifteen degrees West longitude.
Offsets and overlap cause minor variations to this basic
scheme. The number of ONC map sheets per row varies, in
part because maps do not exist for areas that cover ocean
exclusively.
JNC map sheets for Antarctica (numbers 120 through 125)
are included in this index in order to provide complete global
coverage. No other JNC map boundaries are included.
JNC codes are composed of the letters "JNC" followed by
the sheet number (e.g., JNC120).
A blank code indicates that the polygon does not represent an
ONC or JNC sheet.
4-40
ArcWorld User's Guide and Data Reference
ArcWorld 1:3M country
statistical attribute layers
The coverages in the ArcWorld 1:3M statistical attribute layers provide a diverse
set of statistics at the country level. The tabular sources for statistical data are
the World Bank's Social Indicators of Development (SID) 1990 database and
the World Resources Institute's (WRI's) World Resources 1992–1993 Data
Base. The wide range of attribute data makes it possible to map the countries of
the world from a variety of disciplinary perspectives and permits the assessment
of trends and spatial relationships between countries.
Six of the ArcWorld 1:3M statistical attribute layers contain attributes from the
World Bank SID database. These attributes provide statistical data for 169 of
240 countries worldwide. More than seventy-five topics of general interest
have been included in ArcWorld 1:3M; the data for most of these topics are
presented as a series of attributes for six different time periods ranging from
1965 to 1989. The layers organize the attributes by thematic content.
The WRI attributes provide statistical data for 171 of 240 countries worldwide.
One hundred attributes on topics of general interest from the WRI database have
been included in a single ArcWorld 1:3M layer, Natural Resources and the
Environment.
Attributes that occur in both the 1:3 million and 1:25 million ArcWorld layers
have identical names in both layers.
The statistical attribute layers are as follows:
Layer
Coverage names
Economic and Industrial Indicators
Education and Literacy
Food Production and Nutrition
Health and Vital Statistics
Labor Force Characteristics
Natural Resources and the Environment
Population Characteristics
ECONIND
EDU_LIT
AGRICUL
HEALTH
LABOR
WRI_3M
POP_GEO
July 1992
4-41
Chapter 4—ArcWorld 1:3M country statistical attribute layers
Using the country statistical attribute layers
The country statistical attribute coverages contain political boundaries and
polygons to provide a geographic context for the statistical data. The country
boundaries in these layers do not reflect recent (1991) political changes for the
former Soviet Union and Germany in order to match the World Bank and
World Resources Institute tabular data from previous years. The Country
Boundaries coverage described in the cartographic layer section does
incorporate the recent boundary changes in those countries.
Sometimes a statistical data value for a particular geographic area is not available
in the database. Three special codes indicate the absence of data values in the
statistical attributes. These codes are as follows:
Codes
Definitions
–97 = Missing data or data not available
–98 = Country not included in the source tabular database
–99 = Ocean
Countries that comprise multiple geographic parts, such as offshore islands or
overseas territorial possessions, are represented in the database by multiple
polygons that all have the same country code. A flag attribute (STAT_FLAG)
is provided to identify a single polygon (the largest) for every country. These
flags allow the selection of a single data record per country, which is necessary
for generating correct summary statistics.
Additional information about the way missing measurement values are handled
in the database is given on page 3-9; information about how to use these codes
in combination with the statistical flag is given on page 6-4. Chapter 6 also
discusses the comparability and completeness of the statistical data in these
layers.
4-42
ArcWorld User's Guide and Data Reference
Chapter 4—ArcWorld 1:3M country statistical attribute layers
Economic
and Industrial
Indicators
Layer description
The Economic and Industrial Indicators layer contains a
subset of the attributes found in the sections of the World
Bank's Social Indicators of Development (SID) database
called Income and Poverty, and Expenditure. These
attributes include indicators on income, food expenditures,
housing, energy consumption, transportation, and
communication.
Polygons and lines
for countries
Using the Economic and Industrial
Indicators coverage
Time series attributes range from 1965 to 1989, with data for
five-year intervals from 1965 to 1985 and data for the
additional year of 1989. Not all years in the time series are
available for all topics.
Information about country boundaries, missing measurement
values, and the statistical flag attribute that applies to this
layer as well as to all of the other statistical attribute layers is
given on page 4-42.
July 1992
4-43
Chapter 4—ArcWorld 1:3M country statistical attribute layers
Economic and Industrial Indicators
Summary of the Economic and Industrial Indicators coverage
Coverage name:
ECONIND
Source and currency: Cartography from U.S. Government, World Data Bank II, 1988
Attribute data from the World Bank, Social Indicators of Development 1990
database
Thematic attribute
groups:
Feature
class
Geographic reference attributes (polygons and lines)
Cartographic attributes (polygons)
Statistical flag (polygons)
World organization membership (polygons)
World Bank country code (polygons)
Gross national product (polygons)
Household income (polygons)
Expenditures and indicators of wealth (polygons)
Classification attributes (lines)
International boundary status (lines)
Boundary coincidence with rivers (lines)
Feature
Number of features
Number of
attributes
102
Polygons
Countries and other
political divisions
Represented by ca. 12,609 polygons
Lines
Coastlines,
international
boundaries, and world
regions
Represented by ca. 16,395 lines
9
Polygon attributes
Geographic reference attributes
COUNTRY
CNTRY_NAME
REGION
CONTINENT
4-44
These geographic reference attributes contain codes and
names that make it possible to select polygonal features by
country, world region, and continent. The areas and their
corresponding codes are listed in Appendix C; regions are
also shown on the map in Chapter 1.
ArcWorld User's Guide and Data Reference
Chapter 4—ArcWorld 1:3M country statistical attribute layers
Economic and Industrial Indicators
Cartographic attributes
LAND_OCEAN
Flag used to identify continents, islands, and ocean areas.
The codes are as follows:
Codes
Definitions
1 = Continent
2 = Offshore island
3 = Ocean
ISLND_RANK
Offshore islands are ranked for cartographic significance,
primarily on the basis of size. These rank codes are only
present for islands surrounded by ocean; no islands within
inland water bodies are included in this layer. Greenland is
the largest island. The codes are as follows:
Codes
1
2
3
4
5
9
=
=
=
=
=
=
Definitions
Basic reference feature
Major
Additional major
Intermediate
Minor
Unranked
Statistical flag
STAT_FLAG
Flag used to identify a single polygon (the largest) for each
country for purposes of calculating summary statistics.
Chapter 6 provides more information about using this
attribute. The codes are as follows:
Codes
Definitions
0 = Other polygons in country.
1 = Polygon identifier for disputed territories,
reassigned areas, or countries for which data are
not tabulated by the World Bank or World
Resources Institute. (See Appendix C for a list of
disputed territories and reassigned areas.)
2 = Polygon identifier for countries that are assigned
statistical data by the World Bank or World
Resources Institute.
July 1992
4-45
Chapter 4—ArcWorld 1:3M country statistical attribute layers
Economic and Industrial Indicators
World organization membership attributes
These attributes indicate membership in international
organizations. Each of the organization attributes can be
used to select a group of country polygons for display or
study. The codes are as follows:
Codes
Definitions
0 = Not a member of this organization
1 = A member of this organization
EEC
European Economic Community (12 members).
FAO
Food and Agriculture Organization (157 members).
GA
GA_MEMB_YR
IAEA
International Atomic Energy Agency (110 members;
excludes Vatican City, which is not part of the database).
IBRD
International Bank for Reconstruction and Development
(i.e.,World Bank; 152 members).
IMF
OPEC
SC
UNESCO
4-46
United Nations General Assembly (159 members), and the
year that the country joined the U.N. General Assembly.
International Monetary Fund (154 members).
Organization of Petroleum Exporting Countries
(13 members).
United Nations Security Council (5 permanent members).
United Nations Education, Scientific, and Cultural
Organization (159 members).
WHO
World Health Organization (165 members).
WMO
World Meteorological Organization (158 members
represented in this database).
ArcWorld User's Guide and Data Reference
Chapter 4—ArcWorld 1:3M country statistical attribute layers
Economic and Industrial Indicators
World Bank country code attribute
WB_CNTRY
This attribute contains the three-letter country code used by
the World Bank in the SID database. Disputed territories are
assigned to individual countries; the specific assignments are
listed at the end of Appendix C.
Gross national product
GNP_CAP65
GNP_CAP70
GNP_CAP75
GNP_CAP80
GNP_CAP85
GNP_CAP89
Gross national product per capita by five-year time intervals,
in 1989 U.S. dollars.
Household income
July 1992
INCTOP1065
INCTOP1070
INCTOP1075
INCTOP1080
INCTOP1085
INCTOP1089
Percentage of total household income accruing to the top
10 percent of households ranked by total household income.
INCTOP2065
INCTOP2070
INCTOP2075
INCTOP2080
INCTOP2085
INCTOP2089
Percentage of total household income accruing to the top
20 percent of households ranked by total household
income.
INCBOT4065
INCBOT4070
INCBOT4075
INCBOT4080
INCBOT4085
INCBOT4089
Percentage of total household income accruing to the bottom
40 percent of households ranked by total household income.
4-47
Chapter 4—ArcWorld 1:3M country statistical attribute layers
Economic and Industrial Indicators
INCBOT2065
INCBOT2070
INCBOT2075
INCBOT2080
INCBOT2085
INCBOT2089
Percentage of total household income accruing to the bottom
20 percent of households ranked by total household income.
Expenditures and indicators of wealth
EXPFOODS70
EXPFOODS75
EXPFOODS80
EXPFOODS85
EXPFOODS89
Percentage of Gross Domestic Product (GDP) spent on
foods. Computed from United Nations International
Comparison Program (ICP) figures, or national estimates, if
available. GDP is the final output of goods and services
produced by the domestic economy. This figure includes net
export of goods and nonfactor services. It does not include
overseas workers' remittances, interest on loans, profits,
and other factor payments that residents receive from abroad.
Factor services are labor and capital.
EXPSTAPL75
EXPSTAPL80
EXPSTAPL85
EXPSTAPL89
Percentage of GDP spent on food staples. Food staples are
defined as bread, cereals, potatoes, and tubers. These
staples are major foods relating to the consumption of
carbohydrates. Computed from ICP figures, or national
estimates, if available.
EXPPROTN75
EXPPROTN80
EXPPROTN85
EXPPROTN89
Percentage of GDP spent on meat, fish, milk, cheese, and
eggs. These foods approximate a protein measure but
exclude beans, nuts, and other high protein-content food
products. Computed from ICP figures, or national
estimates, if available.
INVSTHSE75
INVSTHSE80
INVSTHSE85
INVSTHSE89
EXPENRGY75
EXPENRGY80
EXPENRGY85
EXPENRGY89
4-48
Fixed investment in housing as a percentage of GDP.
Includes all public and private outlays on residential
buildings, plus net changes in the level of inventory, which
relates primarily to work in progress.
Percentage of GDP spent on fuel and power. Includes
electricity, gas, liquid and other fuels, and ice. Computed
from ICP figures, or national estimates, if available.
ArcWorld User's Guide and Data Reference
Chapter 4—ArcWorld 1:3M country statistical attribute layers
Economic and Industrial Indicators
ENRG_CAP65
ENRG_CAP70
ENRG_CAP75
ENRG_CAP80
ENRG_CAP85
ENRG_CAP89
EXPTRCM70
EXPTRCM75
EXPTRCM80
EXPTRCM85
EXPTRCM89
Percentage of GDP spent on transport and communication.
Includes the purchase of motor cars. Computed from ICP
figures, or national estimates, if available.
POP_CAR65
POP_CAR70
POP_CAR75
POP_CAR80
POP_CAR85
POP_CAR89
Number of people per passenger car. A passenger car is
defined as any private vehicle seating nine people or less.
INVSTTR75
INVSTTR80
INVSTTR85
INVSTTR89
July 1992
Annual consumption of commercial primary energy (coal;
lignite; petroleum; natural gas; and hydro, nuclear, and
geothermal electricity) expressed in kilograms of
oil equivalent per capita.
Fixed investment in transport equipment as a percentage of
GDP. Includes all public and private outlays on transport
equipment, plus net changes in level of inventory.
POP_TELE75
POP_TELE80
POP_TELE85
POP_TELE89
Number of people per installed public or private telephone.
A telephone must be connectable to a central exchange to be
included. The data are generally derived from International
Telecommunications Union publications.
EXPHOUSE65
EXPHOUSE70
EXPHOUSE75
EXPHOUSE80
EXPHOUSE85
EXPHOUSE89
Percentage of GDP spent on housing. The figures reflect
actual and imputed household expenditure outlays, such as
actual and imputed rents, repair and maintenance charges,
and fuel and power for heating, lighting, cooking, and so
forth. Computed from ICP figures or national estimates, if
available.
4-49
Chapter 4—ArcWorld 1:3M country statistical attribute layers
Economic and Industrial Indicators
Line attributes
Classification attributes
TYPE
BND_TYPE
Each line is classified according to the type of feature it
represents. This attribute allows you to symbolize different
line features (political boundaries, coastlines, reefs, etc.)
differently. TYPE contains the code number, and
BND_TYPE contains the English description. The codes are
as follows:
Codes
1
2
3
4
9
=
=
=
=
=
Equivalents
Coastline
International boundary
Coral reef
World region boundary
Grid line
International boundary status attribute
BND_STATUS
Each international boundary is classified according to
boundary status. This attribute allows you to display the
various types of boundaries using different colors or line
symbols. The codes are as follows:
Codes
1
2
3
4
5
6
9
=
=
=
=
=
=
=
Definitions
Demarcated or delimited
Indefinite or in dispute
Line of separation or sovereignty on land
Demilitarized zone in Israel
No defined line
Selected claim lines
Not an international boundary
Boundary coincidence with rivers
BND_COINC
4-50
Each international boundary is classified as to being
coincident with a river line segment in the RIV3M coverage.
This attribute allows you to identify those portions of
international boundaries that were considered coincident with
ArcWorld User's Guide and Data Reference
Chapter 4—ArcWorld 1:3M country statistical attribute layers
Economic and Industrial Indicators
a river or a portion of a river. This determination was made
by the United States government agency that originally
developed World Data Bank II. Approximately 35 percent
of the international boundary lines in the coverage are
classified as coincident. The codes are as follows:
Codes
Definitions
0 = Not coincident with river line segment
1 = Coincident with river line segment
Geographic reference attributes
COUNTRY1
COUNTRY2
CNTRY_NAME
REGION
CONTINENT
July 1992
These attributes contain the following: two-letter country
codes (two attributes), country names, regional codes, and
continent codes. The countries on either side of an international boundary are listed by code in separate attributes
(COUNTRY1 and COUNTRY2), and by name in a single
attribute (CNTRY_NAME; e.g., "France/Germany"). Only
one country is identified for coastlines. A similar dual
coding scheme was used for boundaries between regions
and continents, except that codes rather than names were
used. Countries, regions, and continents and their
corresponding codes are listed in Appendix C; regions are
also shown on the map in Chapter 1.
4-51
Chapter 4—ArcWorld 1:3M country statistical attribute layers
Education and
Literacy
Layer description
The Education and Literacy layer contains a subset of the
attributes found in the section of the World Bank's Social
Indicators of Development (SID) database called Education.
These attributes include statistics on expenditure for
education; primary, secondary, and tertiary school
enrollments; pupil-teacher ratios; illiteracy; and newspaper
circulation.
Polygons and lines
for countries
Using the Education and Literacy coverage
Time series attributes range from 1965 to 1989, with data in
five-year intervals for 1965 to 1985 and data for the
additional year of 1989. Not all years in the time series are
available for all topics.
Information about country boundaries, missing measurement
values, and the statistical flag attribute that applies to this
layer, as well as to all of the other statistical attribute layers,
is given on page 4-42.
4-52
ArcWorld User's Guide and Data Reference
Chapter 4—ArcWorld 1:3M country statistical attribute layers
Education and Literacy
Summary of the Education and Literacy coverage
Coverage name:
EDU_LIT
Source and currency: Cartography from U.S. Government, World Data Bank II, 1988
Attribute data from the World Bank, Social Indicators of Development 1990
database
Thematic attribute
groups:
Feature
class
Geographic reference attributes (polygons and lines)
Cartographic attributes (polygons)
Statistical flag (polygons)
World organization membership (polygons)
World Bank country code (polygons)
Educational expenditure (polygons)
School enrollment (polygons)
Pupil-teacher ratios (polygons)
Success in primary school (polygons)
Literacy (polygons)
Classification attributes (lines)
International boundary status (lines)
Boundary coincidence with rivers (lines)
Feature
Number of features
Number of
attributes
Polygons
Countries and other
political divisions
Represented by ca. 12,609 polygons
91
Lines
Coastlines,
international
boundaries, and world
regions
Represented by ca. 16,395 lines
9
Polygon attributes
Geographic reference attributes
COUNTRY
CNTRY_NAME
REGION
CONTINENT
July 1992
These geographic reference attributes contain codes and
names that make it possible to select polygonal features by
country, world region, and continent. The areas and their
corresponding codes are listed in Appendix C; regions are
also shown on the map in Chapter 1.
4-53
Chapter 4—ArcWorld 1:3M country statistical attribute layers
Education and Literacy
Cartographic attributes
LAND_OCEAN
Flag used to identify continents, islands, and ocean areas.
The codes are as follows:
Codes
Definitions
1 = Continent
2 = Offshore island
3 = Ocean
ISLND_RANK
Offshore islands are ranked for cartographic significance,
primarily on the basis of size. These rank codes are only
present for islands surrounded by ocean; no islands within
inland water bodies are included in this layer. Greenland is
the largest island. The codes are as follows:
Codes
1
2
3
4
5
9
=
=
=
=
=
=
Definitions
Basic reference feature
Major
Additional major
Intermediate
Minor
Unranked
Statistical flag
STAT_FLAG
Flag used to identify a single polygon (the largest) for each
country for purposes of calculating summary statistics.
Chapter 6 provides more information about using this
attribute. The codes are as follows:
Codes
Definitions
0 = Other polygons in country.
1 = Polygon identifier for disputed territories,
reassigned areas, or countries for which data are
not tabulated by the World Bank or World
Resources Institute. (See Appendix C for a list of
disputed territories and reassigned areas.)
2 = Polygon identifier for countries that are assigned
statistical data by the World Bank or World
Resources Institute.
4-54
ArcWorld User's Guide and Data Reference
Chapter 4—ArcWorld 1:3M country statistical attribute layers
Education and Literacy
World organization membership attributes
EEC
FAO
GA
GA_MEMB_YR
IAEA
IBRD
IMF
OPEC
SC
UNESCO
WHO
WMO
These attributes indicate membership in international
organizations. Each of the organization attributes can be
used to select a group of country polygons for display or
study. The organizations indicated by these attributes are
listed on page 4-46. The codes are as follows:
Codes
Definitions
0 = Not a member of this organization
1 = A member of this organization
World Bank country code attribute
WB_CNTRY
This attribute contains the three-letter country code used by
the World Bank in the SID database. Disputed territories are
assigned to individual countries; the specific assignments are
listed at the end of Appendix C.
Educational expenditure
EXPEDUC70
EXPEDUC75
EXPEDUC80
EXPEDUC85
EXPEDUC89
Percentage of Gross Domestic Product (GDP) spent on
education by five-year intervals. This figure includes both
government and private spending. Computed from United
Nations International Comparison Program (ICP) figures, or
national estimates, if available.
School enrollment
Definitions of "school age" varies by country. Many but not
all countries consider primary school age to be 6–11 years
and secondary school age to be 12–17 years. Values over
100 percent are possible if some pupils are younger or older
than the country's standard school-age range.
July 1992
4-55
Chapter 4—ArcWorld 1:3M country statistical attribute layers
Education and Literacy
P_PRIMRY65
P_PRIMRY70
P_PRIMRY75
P_PRIMRY80
P_PRIMRY85
P_PRIMRY89
P_PRI_F65
P_PRI_F70
P_PRI_F75
P_PRI_F80
P_PRI_F85
P_PRI_F89
P_SECNDY65
P_SECNDY70
P_SECNDY75
P_SECNDY80
P_SECNDY85
P_SECNDY89
Percentage of school-age children who are enrolled in
primary school.
Percentage of female school-age children who are enrolled in
primary school.
Percentage of school-age children who are enrolled in
secondary school.
P_SEC_F65
P_SEC_F70
P_SEC_F75
P_SEC_F80
P_SEC_F85
P_SEC_F89
Percentage of female school-age children who are enrolled in
secondary school.
P_SCIENG65
P_SCIENG70
P_SCIENG75
P_SCIENG80
P_SCIENG85
P_SCIENG89
Percentage of all tertiary students who are enrolled in science
and engineering fields. Includes both public and private
institutions. Field of study is defined as the student's main
area of specialization based on International Standard
Classification of Education criteria.
Pupil-teacher ratios
PUPTCH_P65
PUPTCH_P70
PUPTCH_P75
PUPTCH_P80
PUPTCH_P85
PUPTCH_P89
4-56
The pupil-teacher ratio for primary schools. This ratio is
computed by dividing the number of pupils enrolled in
primary school by the total number of primary school
teachers.
ArcWorld User's Guide and Data Reference
Chapter 4—ArcWorld 1:3M country statistical attribute layers
Education and Literacy
PUPTCH_S65
PUPTCH_S70
PUPTCH_S75
PUPTCH_S80
PUPTCH_S85
PUPTCH_S89
The pupil-teacher ratio for secondary schools. This ratio is
computed by dividing the number of pupils enrolled in
secondary school by the total number of secondary school
teachers.
Success in primary school
PUP_GR4_75
PUP_GR4_80
PUP_GR4_85
PUP_GR4_89
Percentage of children who started primary school and
reached grade 4, based on enrollment records. The data are
affected by the number of repeaters.
REPEAT_P65
REPEAT_P70
REPEAT_P75
REPEAT_P80
REPEAT_P85
REPEAT_P89
Percentage of all children enrolled in primary school who
repeat a grade.
Literacy
ILLITER65
ILLITER70
ILLITER75
ILLITER80
ILLITER85
ILLITER89
Percentage of the population 15 years of age and older who
cannot, with understanding, both read and write a short
simple statement on everyday life. The application of this
criteria is subject to significant qualifiers in a number of
countries.
ILLIT_F85
ILLIT_F89
Percentage of the female population 15 years of age and
older who cannot, with understanding, both read and write a
short simple statement on everyday life. The application of
this criteria is subject to significant qualifiers in a number of
countries.
NEWSPAPR65
NEWSPAPR70
NEWSPAPR75
NEWSPAPR80
NEWSPAPR85
NEWSPAPR89
July 1992
Average circulation of a daily general-interest newspaper,
per 1,000 persons. A daily general-interest newspaper is
defined as a news periodical published at least four times a
week.
4-57
Chapter 4—ArcWorld 1:3M country statistical attribute layers
Education and Literacy
Line attributes
Thorough definitions of these attributes are given on page 4-50.
Classification attributes
TYPE
BND_TYPE
Each line is classified according to the type of feature it
represents. TYPE contains the code number, and
BND_TYPE contains the English description. The codes are
as follows:
Codes
1
2
3
4
9
=
=
=
=
=
Equivalents
Coastline
International boundary
Coral reef
World region boundary
Grid line
International boundary status attribute
BND_STATUS
Each international boundary is classified according to
boundary status. The codes are as follows:
Codes
1
2
3
4
5
6
9
=
=
=
=
=
=
=
Definitions
Demarcated or delimited
Indefinite or in dispute
Line of separation or sovereignty on land
Demilitarized zone in Israel
No defined line
Selected claim lines
Not an international boundary
Boundary coincidence with rivers
BND_COINC
Each international boundary is classified as to being
coincident with a river line segment in the RIV3M coverage.
The codes are as follows:
Codes
Definitions
0 = Not coincident with river line segment
1 = Coincident with river line segment
4-58
ArcWorld User's Guide and Data Reference
Chapter 4—ArcWorld 1:3M country statistical attribute layers
Education and Literacy
Geographic reference attributes
COUNTRY1
COUNTRY2
CNTRY_NAME
REGION
CONTINENT
July 1992
These attributes contain the following: two-letter country
codes (two attributes), country names, regional codes, and
continent codes. Countries, regions, and continents and
their corresponding codes are listed in Appendix C; regions
are also shown on the map in Chapter 1.
4-59
Chapter 4—ArcWorld 1:3M country statistical attribute layers
Food Production
and Nutrition
Layer description
Polygons and lines
for countries
The Food Production and Nutrition layer contains a subset
of the attributes found in the sections of the World Bank's
Social Indicators of Development (SID) database called
Natural Resources and Food. These attributes include
information on the amount of agricultural land, population
density on agricultural land, forest area, deforestation rates,
cereal crop imports, food aid, food production, daily calorie
consumption, and protein supply.
Using the Food Production and
Nutrition coverage
Time series attributes range from 1965 to 1989, with data in
five-year intervals for 1965 to 1985 and data for the
additional year of 1989. Not all years in the time series are
available for all topics.
Information about country boundaries, missing measurement
values, and the statistical flag attribute that applies to this
layer, as well as to all of the other statistical attribute layers,
is given on page 4-42.
4-60
ArcWorld User's Guide and Data Reference
Chapter 4—ArcWorld 1:3M country statistical attribute layers
Food Production and Nutrition
Summary of the Food Production and Nutrition coverage
Coverage name:
AGRICUL
Source and currency: Cartography from U.S. Government, World Data Bank II, 1988
Attribute data from the World Bank, Social Indicators of Development 1990
database
Thematic attribute
groups:
Feature
class
Geographic reference attributes (polygons and lines)
Cartographic attributes (polygons)
Statistical flag (polygons)
World organization membership (polygons)
World Bank country code (polygons)
Agricultural land (polygons)
Forests (polygons)
Food imports and aid (polygons)
Food production and supply (polygons)
Classification attributes (lines)
International boundary status (lines)
Boundary coincidence with rivers (lines)
Feature
Number of features
Number of
attributes
Polygons
Countries and other
political divisions
Represented by ca. 12,609 polygons
79
Lines
Coastlines,
international
boundaries, and world
regions
Represented by ca. 16,395 lines
9
Polygon attributes
Geographic reference attributes
COUNTRY
CNTRY_NAME
REGION
CONTINENT
July 1992
These geographic reference attributes contain codes and
names that make it possible to select polygonal features by
country, world region, and continent. The areas and their
corresponding codes are listed in Appendix C; regions are
also shown on the map in Chapter 1.
4-61
Chapter 4—ArcWorld 1:3M country statistical attribute layers
Food Production and Nutrition
Cartographic attributes
LAND_OCEAN
Flag used to identify continents, islands, and ocean areas.
The codes are as follows:
Codes
Definitions
1 = Continent
2 = Offshore island
3 = Ocean
ISLND_RANK
Offshore islands are ranked for cartographic significance,
primarily on the basis of size. These rank codes are only
present for islands surrounded by ocean; no islands within
inland water bodies are included in this layer. Greenland is
the largest island. The codes are as follows:
Codes
1
2
3
4
5
9
=
=
=
=
=
=
Definitions
Basic reference feature
Major
Additional major
Intermediate
Minor
Unranked
Statistical flag
STAT_FLAG
Flag used to identify a single polygon (the largest) for each
country for purposes of calculating summary statistics.
Chapter 6 provides more information about using this
attribute. The codes are as follows:
Codes
Definitions
0 = Other polygons in country.
1 = Polygon identifier for disputed territories,
reassigned areas, or countries for which data are
not tabulated by the World Bank or World
Resources Institute. (See Appendix C for a list of
disputed territories and reassigned areas.)
2 = Polygon identifier for countries that are assigned
statistical data by the World Bank or World
Resources Institute.
4-62
ArcWorld User's Guide and Data Reference
Chapter 4—ArcWorld 1:3M country statistical attribute layers
Food Production and Nutrition
World organization membership attributes
EEC
FAO
GA
GA_MEMB_YR
IAEA
IBRD
IMF
OPEC
SC
UNESCO
WHO
WMO
These attributes indicate membership in international
organizations. Each of the organization attributes can be
used to select a group of country polygons for display or
study. The organizations indicated by these attributes are
listed on page 4-46. The codes are as follows:
Codes
Definitions
0 = Not a member of this organization
1 = A member of this organization
World Bank country code attribute
WB_CNTRY
This attribute contains the three-letter country code used by
the World Bank in the SID database. Disputed territories are
assigned to individual countries; the specific assignments are
listed at the end of Appendix C.
Agricultural land
July 1992
P_AGLAND65
P_AGLAND70
P_AGLAND75
P_AGLAND80
P_AGLAND85
P_AGLAND89
The amount of agricultural land as a percentage of the total
land area, in five-year intervals. Includes areas used for
crops, pasture, market or kitchen gardens, and land lying
fallow. Total land excludes areas of inland waters and
rivers.
POPDNSAG65
POPDNSAG70
POPDNSAG75
POPDNSAG80
POPDNSAG85
POPDNSAG89
Population per square kilometer of agricultural land, in fiveyear intervals.
4-63
Chapter 4—ArcWorld 1:3M country statistical attribute layers
Food Production and Nutrition
Forests
FORESTS65
FORESTS70
FORESTS75
FORESTS80
FORESTS85
FORESTS89
The land area under natural or planted stands of trees,
measured in square kilometers. Includes productive and
nonproductive areas and cleared land that will be reforested
in the near future.
NETDEFOR65
NETDEFOR70
NETDEFOR75
NETDEFOR80
NETDEFOR85
NETDEFOR89
The net annual rate of change of forest and woodland area,
expressed as a percentage. A positive number indicates an
increase in forested area.
Food imports and aid
IMPTCERL65
IMPTCERL70
IMPTCERL75
IMPTCERL80
IMPTCERL85
IMPTCERL89
Food imports of cereals, measured in metric tons. Cereal
imports are defined as comprising all cereals in the Standard
International Trade Classification, revision 2, groups 041–
046. The cereal imports are based on calendar-year data and
are measured in grain equivalents.
AIDCERLB70
AIDCERLB75
AIDCERLB80
AIDCERLB85
AIDCERLB89
Cereal food aid, measured in metric tons. Aid covers wheat
and flour, bulgur, coarse grains, and the cereal component
of blended foods. The cereal food aid is based on data
reported for crop years.
Food production and supply
FOODPROD65
FOODPROD70
FOODPROD75
FOODPROD80
FOODPROD85
FOODPROD89
4-64
The average annual quantity of food produced per capita in
relation to the quantity produced in 1979–1981. The
quantity produced in 1979–1981 is assigned a relative value
of 100. Food is defined as comprising nuts, pulses, fruit,
cereals, vegetables, sugarcane, sugar beets, starchy roots,
edible oils, livestock, and livestock products. These figures
exclude animal feed, seeds for agriculture, and food lost in
processing.
ArcWorld User's Guide and Data Reference
Chapter 4—ArcWorld 1:3M country statistical attribute layers
Food Production and Nutrition
P_AGGDPB65
P_AGGDPB70
P_AGGDPB75
P_AGGDPB80
P_AGGDPB85
P_AGGDPB89
Percentage share of agriculture in the GDP. The percentage
share of agriculture covers forestry, hunting, and fishing, as
well as agriculture. In developing countries with high levels
of subsistence farming, much of agricultural production is
either not exchanged, or not exchanged for money. This
increases the difficulty of measuring the contribution of
agriculture to GDP and reduces the reliability and
comparability of such numbers.
CAL_CAP65
CAL_CAP70
CAL_CAP75
CAL_CAP80
CAL_CAP85
CAL_CAP89
The daily calorie supply per capita, computed as the energy
equivalent of net food supplies in a country, per capita, per
day. Available supplies comprise domestic production,
imports less exports, and changes in stock. This figure
excludes animal feed, seeds for agriculture, and food lost in
processing.
PROT_CAP65
PROT_CAP70
PROT_CAP75
PROT_CAP80
PROT_CAP85
PROT_CAP89
The protein content of the net food supply per capita,
measured in grams. Net food supplies comprise domestic
production, imports less exports, and changes in stock.
This figure excludes animal feed, seeds for agriculture, and
food lost in processing. U.S. Department of Agriculture
(USDA) minimum allowances are 60 grams of total protein
per day and 20 grams of animal or pulse (peas, beans,
lentils, etc.) protein.
Line attributes
Thorough definitions of these attributes are given on page 4-50.
Classification attributes
TYPE
BND_TYPE
Each line is classified according to the type of feature it represents. TYPE contains the code number, and BND_TYPE
contains the English description. The codes are as follows:
Codes
1
2
3
4
9
July 1992
=
=
=
=
=
Equivalents
Coastline
International boundary
Coral reef
World region boundary
Grid line
4-65
Chapter 4—ArcWorld 1:3M country statistical attribute layers
Food Production and Nutrition
International boundary status attribute
BND_STATUS
Each international boundary is classified according to
boundary status. The codes are as follows:
Codes
1
2
3
4
5
6
9
=
=
=
=
=
=
=
Definitions
Demarcated or delimited
Indefinite or in dispute
Line of separation or sovereignty on land
Demilitarized zone in Israel
No defined line
Selected claim lines
Not an international boundary
Boundary coincidence with rivers
BND_COINC
Each international boundary is classified as to being
coincident with a river line segment in the RIV3M coverage.
The codes are as follows:
Codes
Definitions
0 = Not coincident with river line segment
1 = Coincident with river line segment
Geographic reference attributes
COUNTRY1
COUNTRY2
CNTRY_NAME
REGION
CONTINENT
4-66
These attributes contain the following: two-letter country
codes (two attributes), country names, regional codes, and
continent codes. Countries, regions, and continents and
their corresponding codes are listed in Appendix C; regions
are also shown on the map in Chapter 1.
ArcWorld User's Guide and Data Reference
Chapter 4—ArcWorld 1:3M country statistical attribute layers
Health and Vital Statistics
Health and
Vital Statistics
Layer description
Polygons and lines
for countries
The Health and Vital Statistics layer contains a subset of the
attributes found in the sections of the World Bank's Social
Indicators of Development (SID) database called Human
Resources, Medical Care, and Poverty. These attributes
include information and indicators on safe water;
malnutrition; expenditure on medical care; number of
physicians, nurses, and hospital beds per person; birth and
death rates; infant mortality; fertility and contraception;
family size; and life expectancy.
Using the Health and Vital Statistics
coverage
Time series attributes range from 1965 to 1989, with data in
five-year intervals for 1965 to 1985 and data for the
additional year of 1989. Not all years in the time series are
available for all topics.
Information about country boundaries, missing measurement
values, and the statistical flag attribute that applies to this
layer, as well as to all of the other statistical attribute layers,
is given on page 4-42.
July 1992
4-67
Chapter 4—ArcWorld 1:3M country statistical attribute layers
Health and Vital Statistics
Summary of the Health and Vital Statistics coverage
Coverage name:
HEALTH
Source and currency: Cartography from U.S. Government, World Data Bank II, 1988
Attribute data from the World Bank, Social Indicators of Development 1990
database
Thematic attribute
groups:
Feature
class
Geographic reference attributes (polygons and lines)
Cartographic attributes (polygons)
Statistical flag (polygons)
World organization membership (polygons)
World Bank country code (polygons)
Access to safe water (polygons)
Malnutrition (polygons)
Health care expenditures and availability (polygons)
Vital statistics (polygons)
Classification attributes (lines)
International boundary status (lines)
Boundary coincidence with rivers (lines)
Feature
Number of features
Number of
attributes
110
Polygons
Countries and other
political divisions
Represented by ca. 12,609 polygons
Lines
Coastlines,
international
boundaries, and world
regions
Represented by ca. 16,395 lines
9
Polygon attributes
Geographic reference attributes
COUNTRY
CNTRY_NAME
REGION
CONTINENT
4-68
These geographic reference attributes contain codes and
names that make it possible to select polygonal features by
country, world region, and continent. The areas and their
corresponding codes are listed in Appendix C; regions are
also shown on the map in Chapter 1.
ArcWorld User's Guide and Data Reference
Chapter 4—ArcWorld 1:3M country statistical attribute layers
Health and Vital Statistics
Cartographic attributes
LAND_OCEAN
Flag used to identify continents, islands, and ocean areas.
The codes are as follows:
Codes
Definitions
1 = Continent
2 = Offshore island
3 = Ocean
ISLND_RANK
Offshore islands are ranked for cartographic significance,
primarily on the basis of size. These rank codes are only
present for islands surrounded by ocean; no islands within
inland water bodies are included in this layer. Greenland is
the largest island. The codes are as follows:
Codes
1
2
3
4
5
9
=
=
=
=
=
=
Definitions
Basic reference feature
Major
Additional major
Intermediate
Minor
Unranked
Statistical flag
STAT_FLAG
Flag used to identify a single polygon (the largest) for each
country for purposes of calculating summary statistics.
Chapter 6 provides more information about using this
attribute. The codes are as follows:
Codes
Definitions
0 = Other polygons in country.
1 = Polygon identifier for disputed territories,
reassigned areas, or countries for which data are
not tabulated by the World Bank or World
Resources Institute. (See Appendix C for a list of
disputed territories and reassigned areas.)
2 = Polygon identifier for countries that are assigned
statistical data by the World Bank or World
Resources Institute.
July 1992
4-69
Chapter 4—ArcWorld 1:3M country statistical attribute layers
Health and Vital Statistics
World organization membership attributes
EEC
FAO
GA
GA_MEMB_YR
IAEA
IBRD
IMF
OPEC
SC
UNESCO
WHO
WMO
These attributes indicate membership in international
organizations. Each of the organization attributes can be
used to select a group of country polygons for display or
study. The organizations indicated by these attributes are
listed on page 4-46. The codes are as follows:
Codes
Definitions
0 = Not a member of this organization
1 = A member of this organization
World Bank country code attribute
WB_CNTRY
This attribute contains the three-letter country code used by
the World Bank in the SID database. Disputed territories are
assigned to individual countries; the specific assignments are
listed at the end of Appendix C.
Access to safe water
SAFEH2O70
SAFEH2O75
SAFEH2O80
SAFEH2O85
SAFEH2O89
SAFH2OUB70
SAFH2OUB75
SAFH2OUB80
SAFH2OUB85
SAFH2OUB89
4-70
Percentage of the total population with reasonable access to
safe water supply, by five-year intervals. This definition
includes treated surface water and untreated but
uncontaminated groundwater, such as springs, sanitary
wells, and protected boreholes.
Percentage of the urban population with reasonable access to
safe water supply. This definition includes treated surface
water and untreated but uncontaminated groundwater, such
as springs, sanitary wells, and protected boreholes. In
urban areas this may be a public fountain or standpost
located not more than 200 meters away.
ArcWorld User's Guide and Data Reference
Chapter 4—ArcWorld 1:3M country statistical attribute layers
Health and Vital Statistics
SAFH2ORB65
SAFH2ORB70
SAFH2ORB75
SAFH2ORB80
SAFH2ORB85
SAFH2ORB89
Percentage of the rural population with reasonable access to
safe water supply. This definition includes treated surface
water and untreated but uncontaminated groundwater, such
as springs, sanitary wells, and protected boreholes. In rural
areas "reasonable access" implies that persons do not have to
spend a disproportionate part of each day obtaining water.
Malnutrition
P_MLNUTR65
P_MLNUTR70
P_MLNUTR75
P_MLNUTR80
P_MLNUTR85
P_MLNUTR89
Percentage of children under five years of age suffering from
malnutrition. Methods for assessing malnutrition vary. Data
for a few countries are for children three or four years of age
and younger.
Health care expenditures and availability
EXP_MED70
EXP_MED75
EXP_MED80
EXP_MED85
EXP_MED89
July 1992
Percentage of Gross Domestic Product (GDP) spent on
medical care. This includes both private and government
spending. Computed from United Nations International
Comparison Program (ICP) figures, or national estimates, if
available.
POP_DOCT65
POP_DOCT70
POP_DOCT75
POP_DOCT80
POP_DOCT85
POP_DOCT89
Population per physician. Physicians include medical
assistants who dispense medical services similar to
registered physicians. The definition of recognized medical
practitioners differs among countries.
POP_NURS65
POP_NURS70
POP_NURS75
POP_NURS80
POP_NURS85
POP_NURS89
Population per nurse. Nurses include both graduate,
practical, assistant, and auxiliary nurses and paraprofessional personnel such as health workers, first-aid workers,
traditional birth attendants, and so on.
4-71
Chapter 4—ArcWorld 1:3M country statistical attribute layers
Health and Vital Statistics
POP_HBED65
POP_HBED70
POP_HBED75
POP_HBED80
POP_HBED85
POP_HBED89
Population per hospital bed. A hospital is defined as an
establishment permanently staffed by at least one physician.
Hospitals include public, private, general, and specialized
facilities, and rehabilitation centers.
Vital statistics
4-72
BIR_RATE65
BIR_RATE70
BIR_RATE75
BIR_RATE80
BIR_RATE85
BIR_RATE89
Crude birth rate, which is defined as the number of births
per 1,000 persons in a given year. The data are based on a
combination of observed values and interpolated and
projected estimates.
FERTILTY65
FERTILTY70
FERTILTY75
FERTILTY80
FERTILTY85
FERTILTY89
Total fertility rate, which is defined as the average number of
children that would be born alive to a woman during her
lifetime, if she were to bear children in accordance with
prevailing age-specific fertility rates. The data are based on a
combination of observed values and interpolated and
projected estimates.
CONTRCPF70
CONTRCPF75
CONTRCPF80
CONTRCPF85
CONTRCPF89
Percentage of married women of childbearing age who are
using, or whose husbands are using, any form of
contraception. Childbearing age is usually defined as ages
fifteen to forty-nine, although some countries measure
contraceptive usage for other age groups.
CHLD_W_U65
CHLD_W_U70
CHLD_W_U75
CHLD_W_U80
CHLD_W_U85
CHLD_W_U89
Ratio of the number of children under five years of age per
100 women ages 15–49, for the urban population.
CHLD_W_R65
CHLD_W_R70
CHLD_W_R75
CHLD_W_R80
CHLD_W_R85
CHLD_W_R89
Ratio of the number of children under five years of age per
100 women ages 15–49, for the rural population.
ArcWorld User's Guide and Data Reference
Chapter 4—ArcWorld 1:3M country statistical attribute layers
Health and Vital Statistics
DTH_RATE65
DTH_RATE70
DTH_RATE75
DTH_RATE80
DTH_RATE85
DTH_RATE89
INF_DTH65
INF_DTH70
INF_DTH75
INF_DTH80
INF_DTH85
INF_DTH89
DTHUND5_85
DTHUND5_89
July 1992
Crude death rate, which is defined as the number of deaths
per 1,000 persons in a given year. The data are based on a
combination of observed values and interpolated and
projected estimates.
Infant mortality rate, which is defined as the number of
deaths of infants under one year of age per 1,000 live births
in a given year. The data are based on a combination of
observed values and interpolated and projected estimates. A
few countries use an atypical definition of live births, which
reduces their infant mortality rates relative to other countries.
Number of deaths of children under five years of age per
1,000 live births in a given year. The data are estimates
from projection models.
LIFE_EXP65
LIFE_EXP70
LIFE_EXP75
LIFE_EXP80
LIFE_EXP85
LIFE_EXP89
Life expectancy at birth for the total population. Life
expectancy is defined as the number of years a newborn
infant would live if the prevailing patterns of mortality were
to remain the same throughout its life. The data are based on
a combination of observed values and interpolated and
projected estimates.
LIFEXP_F65
LIFEXP_F70
LIFEXP_F75
LIFEXP_F80
LIFEXP_F85
LIFEXP_F89
Life expectancy at birth for females. Life expectancy is
defined as the number of years a newborn infant would live
if the prevailing patterns of mortality were to remain the
same throughout its life. The data are based on a
combination of observed values and interpolated and
projected estimates.
4-73
Chapter 4—ArcWorld 1:3M country statistical attribute layers
Health and Vital Statistics
Line attributes
Thorough definitions of these attributes are given on page 4-50.
Classification attributes
TYPE
BND_TYPE
Each line is classified according to the type of feature it
represents. TYPE contains the code number, and
BND_TYPE contains the English description. The codes are
as follows:
Codes
1
2
3
4
9
=
=
=
=
=
Equivalents
Coastline
International boundary
Coral reef
World region boundary
Grid line
International boundary status attribute
BND_STATUS
Each international boundary is classified according to
boundary status. The codes are as follows:
Codes
1
2
3
4
5
6
9
=
=
=
=
=
=
=
Definitions
Demarcated or delimited
Indefinite or in dispute
Line of separation or sovereignty on land
Demilitarized zone in Israel
No defined line
Selected claim lines
Not an international boundary
Boundary coincidence with rivers
BND_COINC
Each international boundary is classified as to being
coincident with a river line segment in the RIV3M coverage.
The codes are as follows:
Codes
Definitions
0 = Not coincident with river line segment
1 = Coincident with river line segment
4-74
ArcWorld User's Guide and Data Reference
Chapter 4—ArcWorld 1:3M country statistical attribute layers
Health and Vital Statistics
Geographic reference attributes
COUNTRY1
COUNTRY2
CNTRY_NAME
REGION
CONTINENT
July 1992
These attributes contain the following: two-letter country
codes (two attributes), country names, regional codes, and
continent codes. Countries, regions, and continents and
their corresponding codes are listed in Appendix C; regions
are also shown on the map in Chapter 1.
4-75
Chapter 4—ArcWorld 1:3M country statistical attribute layers
Labor Force
Characteristics
Layer description
The Labor Force Characteristics layer contains attributes
found in the section of the World Bank's Social Indicators of
Development (SID) database called Labor. These attributes
include information and indicators on the size of the labor
force, percentage of the labor force working in agriculture or
industry, female-to-male laborer ratios, and labor force
participation rates.
Polygons and lines
for countries
Using the Labor Force Characteristics
coverage
Time series attributes range from 1965 to 1989, with data in
five-year intervals for 1965 to 1985 and data for the
additional year of 1989. Not all years in the time series are
available for all topics.
Information about country boundaries, missing measurement
values, and the statistical flag attribute that applies to this
layer, as well as to all of the other statistical attribute layers,
is given on page 4-42.
4-76
ArcWorld User's Guide and Data Reference
Chapter 4—ArcWorld 1:3M country statistical attribute layers
Labor Force Characteristics
Summary of the Labor Force Characteristics coverage
Coverage name:
LABOR
Source and currency: Cartography from U.S. Government, World Data Bank II, 1988
Attribute data from the World Bank, Social Indicators of Development 1990
database
Thematic attribute
groups:
Feature
class
Geographic reference attributes (polygons and lines)
Cartographic attributes (polygons)
Statistical flag (polygons)
World organization membership (polygons)
World Bank country code (polygons)
Labor force attributes (polygons)
Classification attributes (lines)
International boundary status (lines)
Boundary coincidence with rivers (lines)
Feature
Number of features
Number of
attributes
Polygons
Countries and other
political divisions
Represented by ca. 12,609 polygons
68
Lines
Coastlines,
international
boundaries, and world
regions
Represented by ca. 16,395 lines
9
Polygon attributes
Geographic reference attributes
COUNTRY
CNTRY_NAME
REGION
CONTINENT
July 1992
These geographic reference attributes contain codes and
names that make it possible to select polygonal features by
country, world region, and continent. The areas and their
corresponding codes are listed in Appendix C; regions are
also shown on the map in Chapter 1.
4-77
Chapter 4—ArcWorld 1:3M country statistical attribute layers
Labor Force Characteristics
Cartographic attributes
LAND_OCEAN
Flag used to identify continents, islands, and ocean areas.
The codes are as follows:
Codes
Definitions
1 = Continent
2 = Offshore island
3 = Ocean
ISLND_RANK
Offshore islands are ranked for cartographic significance,
primarily on the basis of size. These rank codes are only
present for islands surrounded by ocean; no islands within
inland water bodies are included in this layer. Greenland is
the largest island. The codes are as follows:
Codes
1
2
3
4
5
9
=
=
=
=
=
=
Definitions
Basic reference feature
Major
Additional major
Intermediate
Minor
Unranked
Statistical flag
STAT_FLAG
Flag used to identify a single polygon (the largest) for each
country for purposes of calculating summary statistics.
Chapter 6 provides more information about using this
attribute. The codes are as follows:
Codes
Definitions
0 = Other polygons in country.
1 = Polygon identifier for disputed territories,
reassigned areas, or countries for which data are
not tabulated by the World Bank or World
Resources Institute. (See Appendix C for a list of
disputed territories and reassigned areas.)
2 = Polygon identifier for countries that are assigned
statistical data by the World Bank or World
Resources Institute.
4-78
ArcWorld User's Guide and Data Reference
Chapter 4—ArcWorld 1:3M country statistical attribute layers
Labor Force Characteristics
World organization membership attributes
EEC
FAO
GA
GA_MEMB_YR
IAEA
IBRD
IMF
OPEC
SC
UNESCO
WHO
WMO
These attributes indicate membership in international
organizations. Each of the organization attributes can be
used to select a group of country polygons for display or
study. The organizations indicated by these attributes are
listed on page 4-46. The codes are as follows:
Codes
Definitions
0 = Not a member of this organization
1 = A member of this organization
World Bank country code attribute
WB_CNTRY
This attribute contains the three-letter country code used by
the World Bank in the SID database. Disputed territories are
assigned to individual countries; the specific assignments are
listed at the end of Appendix C.
Labor force attributes
LABORFOR65
LABORFOR70
LABORFOR75
LABORFOR80
LABORFOR85
LABORFOR89
July 1992
Total labor force, which is defined as the number of
"economically active" people in the population, by five-year
intervals. This definition of total labor force includes the
armed forces and the unemployed, but excludes homemakers
and other unpaid caregivers.
P_AGRIC65
P_AGRIC70
P_AGRIC75
P_AGRIC80
P_AGRIC85
P_AGRIC89
Percentage of the total labor force engaged in farming,
forestry, hunting, and fishing.
P_INDUS65
P_INDUS70
P_INDUS75
P_INDUS80
P_INDUS85
P_INDUS89
Percentage of the total labor force engaged in mining,
manufacturing, construction, and the electricity, water, and
gas industries.
4-79
Chapter 4—ArcWorld 1:3M country statistical attribute layers
Labor Force Characteristics
P_FEMALE65
P_FEMALE70
P_FEMALE75
P_FEMALE80
P_FEMALE85
P_FEMALE89
FEM_URB65
FEM_URB70
FEM_URB75
FEM_URB80
FEM_URB85
FEM_URB89
Number of females per 100 males for the urban working-age
population (15–64).
FEM_RUR65
FEM_RUR70
FEM_RUR75
FEM_RUR80
FEM_RUR85
FEM_RUR89
Number of females per 100 males for the rural working-age
population (15–64). The significant differences between the
urban and rural gender ratios reflect migration patterns.
PARTICIP65
PARTICIP70
PARTICIP75
PARTICIP80
PARTICIP85
PARTICIP89
Percentage of the total population the labor force makes up.
These figures are based on International Labour Office
estimates.
PARTCP_F65
PARTCP_F70
PARTCP_F75
PARTCP_F80
PARTCP_F85
PARTCP_F89
4-80
Percentage of the total labor force composed of females.
Female participation rates in the labor force are significantly
underestimated in several developing countries according to
the World Bank.
Percentage of population of all ages in the labor force.
These figures are based on International Labour Office
estimates, on the age–sex structure of the population.
ArcWorld User's Guide and Data Reference
Chapter 4—ArcWorld 1:3M country statistical attribute layers
Labor Force Characteristics
Line attributes
Thorough definitions of these attributes are given on page 4-50.
Classification attributes
TYPE
BND_TYPE
Each line is classified according to the type of feature it
represents. TYPE contains the code number, and
BND_TYPE contains the English description. The codes are
as follows:
Codes
1
2
3
4
9
=
=
=
=
=
Equivalents
Coastline
International boundary
Coral reef
World region boundary
Grid line
International boundary status attribute
BND_STATUS
Each international boundary is classified according to
boundary status. The codes are as follows:
Codes
1
2
3
4
5
6
9
=
=
=
=
=
=
=
Definitions
Demarcated or delimited
Indefinite or in dispute
Line of separation or sovereignty on land
Demilitarized zone in Israel
No defined line
Selected claim lines
Not an international boundary
Boundary coincidence with rivers
BND_COINC
Each international boundary is classified as to being
coincident with a river line segment in the RIV3M coverage.
The codes are as follows:
Codes
Definitions
0 = Not coincident with river line segment
1 = Coincident with river line segment
July 1992
4-81
Chapter 4—ArcWorld 1:3M country statistical attribute layers
Labor Force Characteristics
Geographic reference attributes
COUNTRY1
COUNTRY2
CNTRY_NAME
REGION
CONTINENT
4-82
These attributes contain the following: two-letter country
codes (two attributes), country names, regional codes, and
continent codes. Countries, regions, and continents and
their corresponding codes are listed in Appendix C; regions
are also shown on the map in Chapter 1.
ArcWorld User's Guide and Data Reference
Chapter 4—ArcWorld 1:3M country statistical attribute layers
Natural Resources and the Environment
Natural
Resources
and the
Environment
Layer description
Polygons and lines
for countries
This layer contains more than 100 attributes from the World
Resource Institute's World Resources 1992–1993 Data
Base. These attributes provide country-level information on
a wide range of topics, such as gross domestic product,
central government expenditures, sanitation, education,
health, general infrastructure, agriculture, forestry, protected
land areas, biological diversity, energy production and
consumption, aquaculture, and atmospheric emissions.
Using the Natural Resources and
the Environment coverage
Information about country boundaries, missing measurement
values, and the statistical flag attribute that applies to this
layer, as well as to all of the other statistical attribute layers,
is given on page 4-42.
July 1992
4-83
Chapter 4—ArcWorld 1:3M country statistical attribute layers
Natural Resources and the Environment
Summary of the Natural Resources and the Environment coverage
Coverage name:
WRI_3M
Source and currency: Cartography from U.S. Government, World Data Bank II, 1988
Attribute data from the World Resources Institute, World Resources
1992–1993 Data Base
Thematic attribute
groups:
Feature
class
Geographic reference attributes (polygons and lines)
Cartographic attributes (polygons)
Statistical flag (polygons)
World organization membership (polygons)
World Resources Institute country code (polygons)
Gross domestic product (polygons)
Central government expenditures (polygons)
Sanitation attributes (polygons)
Education attributes (polygons)
Health attributes (polygons)
General infrastructure (polygons)
Agriculture and forestry (polygons)
Protected land areas (polygons)
Species diversity and status (polygons)
Energy production and consumption (polygons)
Marine catch and aquaculture (polygons)
Atmospheric emissions (polygons)
Classification attributes (lines)
International boundary status (lines)
Boundary coincidence with rivers (lines)
Feature
Number of features
Polygons
Countries and other
political divisions
Represented by ca. 12,609 polygons
Lines
Coastlines, international boundaries,
and world regions
Represented by ca. 16,395 lines
4-84
Number of
attributes
120
9
ArcWorld User's Guide and Data Reference
Chapter 4—ArcWorld 1:3M country statistical attribute layers
Natural Resources and the Environment
Polygon attributes
Geographic reference attributes
COUNTRY
CNTRY_NAME
REGION
CONTINENT
These geographic reference attributes contain codes and
names that make it possible to select polygonal features by
country, world region, and continent. The areas and their
corresponding codes are listed in Appendix C; regions are
also shown on the map in Chapter 1.
Cartographic attributes
LAND_OCEAN
Flag used to identify continents, islands, and ocean areas.
The codes are as follows:
Codes
Definitions
1 = Continent
2 = Offshore island
3 = Ocean
ISLND_RANK
Offshore islands are ranked for cartographic significance,
primarily on the basis of size. These rank codes are only
present for islands surrounded by ocean; no islands within
inland water bodies are included in this layer. Greenland is
the largest island. The codes are as follows:
Codes
1
2
3
4
5
9
July 1992
=
=
=
=
=
=
Definitions
Basic reference feature
Major
Additional major
Intermediate
Minor
Unranked
4-85
Chapter 4—ArcWorld 1:3M country statistical attribute layers
Natural Resources and the Environment
Statistical flag
STAT_FLAG
Flag used to identify a single polygon (the largest) for each
country for purposes of calculating summary statistics.
Chapter 6 provides more information about using this
attribute. The codes are as follows:
Codes
Definitions
0 = Other polygons in country.
1 = Polygon identifier for disputed territories,
reassigned areas, or countries for which data are
not tabulated by the World Bank or World
Resources Institute. (See Appendix C for a list of
disputed territories and reassigned areas.)
2 = Polygon identifier for countries that are assigned
statistical data by the World Bank or World
Resources Institute.
World organization membership attributes
EEC
FAO
GA
GA_MEMB_YR
IAEA
IBRD
IMF
OPEC
SC
UNESCO
WHO
WMO
These attributes indicate membership in international
organizations. Each of the organization attributes can be
used to select a group of country polygons for display or
study. The organizations indicated by these attributes are
listed on page 4-46. The codes are as follows:
Codes
Definitions
0 = Not a member of this organization
1 = A member of this organization
World Resources Institute country code
WRI_CNTRY
4-86
This attribute contains a two-letter code for the countries of
the world as they were identified by the World Resources
Institute in the World Resources 1992–1993 database. In
this attribute disputed territories are assigned to individual
countries; the specific assignments are listed at the end of
Appendix C.
ArcWorld User's Guide and Data Reference
Chapter 4—ArcWorld 1:3M country statistical attribute layers
Natural Resources and the Environment
Gross Domestic Product
P_AGGDPR88
P_INDGDP88
P_SERGDP88
Percentage of Gross Domestic Product (GDP) contributed
by activities in agriculture, industry, and services in 1988.
GDP is the sum of the final outputs of various sectors of a
country's economy, minus the value of the inputs for
production. These figures include net export of goods and
nonfactor services. They do not include overseas workers'
remittances, interest on loans, profits, and other factor
payments that residents receive from abroad. (Factor
services are labor and capital.) Some of the country values
are from earlier years.
Central government expenditures
Central government expenditures in 1989 for the following
(in U.S. dollars, except percentage):
P_GVTGDP89
GVT_CAP89
GVDEFENS89
GVEDUCAT89
GVHEALTH89
GVWLFHSE89
GVRECCLR89
GVAGFORF89
GVTRNCOM89
As a percentage of GDP.
Per capita.
Defense.
Education.
Health.
Social security, welfare, and housing.
Recreation, culture, and religion.
Agriculture, forestry, fishing, and hunting.
Transportation and communication.
Sanitation attributes
SAFH2OUR88
SAFH2ORR88
July 1992
Percentage of the urban population and percentage of the
rural population with access to safe drinking water. Access
to safe water in urban areas means having piped water or
access to a public piped water supply within 200 yards of a
dwelling, and in rural areas access means treated water or
protected, untreated water that is close enough to a dwelling
to fetch in a reasonable amount of time.
4-87
Chapter 4—ArcWorld 1:3M country statistical attribute layers
Natural Resources and the Environment
SANITATU80
SANITATR80
HLTHSERV88
Percentage of the urban population and percentage of the
rural population with access to sanitation services.
Sanitation services include public sewers, septic systems, pit
privies, and so on.
Percentage of the total population with access to health services.
Access means that a person can reach local health services by
local transportation within one hour.
Education attributes
PRIMRY_F89
PRIMRY_M89
The number of females and the number of males who are age
twenty-five and older and have completed primary school.
POSTSECF89
POSTSECM89
The number of females and the number of males who are age
twenty-five and older and have some postsecondary
education.
Health attributes
ORTUSE_R88
IMMUN_TB90
IM_DPT90
IM_POLIO90
IM_MEASL90
CONTRCEP89
4-88
Percentage of children experiencing episodes of diarrhea that
were treated with Oral Rehydration Salts (ORT). (Diarrheal
disease may lead to dehydration or malnutrition.)
The percentage of one-year-old children who were fully
immunized in 1990 against the following diseases:
tuberculosis; diphtheria, pertussis (whooping cough), and
tetanus (DPT); polio; and measles.
The percentage of married or cohabiting couples that use any
method of birth control.
ArcWorld User's Guide and Data Reference
Chapter 4—ArcWorld 1:3M country statistical attribute layers
Natural Resources and the Environment
General infrastructure
WILDERNS88
Wilderness area as a percentage of total land area, 1988.
Wilderness area is defined as lands showing no evidence of
development (settlements, roads, buildings, airports,
pipelines, powerlines, reservoirs, etc.). The minimum area
for inclusion was 4,000 square kilometers.
HHLDSIZR86
Average number of occupants per household, 1970–1986.
HHWOELEC82
Percentage of households without electricity from public
utilities, 1970–1982. Note: this figure includes residences
serviced by local generators or other privately owned means
of obtaining electricity.
TOTROADS89
PAVEDRDS89
Total kilometers of roads per 1,000 square kilometers of
land area, and the kilometers of paved roads per 1,000
square kilometers of land area. Data are from the latest
available figures between 1981 and 1989.
AIRPORTS89
Total number of public airports.
Agriculture and forestry
July 1992
CROPLAND89
Total area of cropland, in thousands of hectares. Cropland
refers to land under temporary and permanent crops,
temporary meadows, market and kitchen gardens, and
temporarily fallow land. Permanent cropland comprises
crops that do not need to be replanted after each harvest,
such as cocoa, coffee, rubber, fruit trees, and vines.
FERTILZE89
Average annual quantity of fertilizers consumed (nitrogen,
phosphate, and potash), in kilograms per hectare of
cropland, 1987–1989.
4-89
Chapter 4—ArcWorld 1:3M country statistical attribute layers
Natural Resources and the Environment
4-90
AIDCERLR89
Total cereal aid received by major recipients from major
donors, in thousands of metric tons, 1989. A major
recipient is a country that received at least 10,000 tons of
cereal aid.
NOSOILCN89
Total land area with soil that has no inherent chemical and
physical restraints to agricultural productivity, in thousands
of hectares, 1989. The following physical and chemical
constraints are absent in the soils included in this figure:
steep slope, shallowness, poor drainage, low nutrient retention, aluminum toxicity, acidity, phosphorus fixation,
amorphous material, vertic properties (i.e., shrinking and
swelling), low potassium reserves, calcareous soil, salinity,
excess sodium, acid sulfate soil, and gravel, and rocks.
CLOSEFOR80
OPENFOR80
PLANTATN80
OTHWOODS80
Extent of closed forests, open forests, plantations, and other
woodlands in 1980, in thousands of hectares.
DEFORCLO85
P_DEFCLO85
Average annual deforestation for closed forests, in
thousands of hectares, and percentage of the total closed
forest being deforested annually; 1981–1985. Deforestation
is defined as the permanent clearing of forests for use in
shifting cultivation, permanent agriculture, or settlements.
Not included are alterations such as selective logging.
DEFORTOT85
P_DEFTOT85
Average annual deforestation for all forests, in thousands of
hectares, and percentage of all forested areas being
deforested annually; 1981–1985. These figures refer to the
total forest area, including open forest, closed forest,
plantation, and other types of generally wooded areas.
ESTDEFOR89
The most recent estimate of average annual deforestation, in
thousands of hectares.
REFOREST85
Average annual reforestation, in thousands of hectares,
1981–1985.
ArcWorld User's Guide and Data Reference
Chapter 4—ArcWorld 1:3M country statistical attribute layers
Natural Resources and the Environment
Protected land areas
MANGCLOF80
PROTCLOF80
Extent of managed closed forest areas, and extent of
protected closed forest areas; in thousands of hectares.
P_PROTLN90
Percentage of national land area that is protected, in
thousands of hectares. Protected land includes both totally
and partially protected areas. Marine and coastal protected
area figures are calculated for all littoral, coral, island,
marine, and estuarine components. This figure does not
include locally or provincially protected sites, privately
owned areas, or areas managed primarily for the extraction
of natural resources. National lists also usually include sites
that are under international protection systems.
PRMARINE90
PRMARN_A90
The number of protected marine and coastal areas, and the
area of those protected areas, in thousands of hectares.
BIORESRV90
BIORES_A90
WETLANDS90
WETLND_A90
The number of biosphere reserves (terrestrial and coastal
environments that have been internationally recognized under
the United Nations Educational, Scientific, and Cultural
Organization Biosphere Program), and the area of those
reserves, in thousands of hectares.
The number of internationally significant wetlands, and the
area of those wetlands, in thousands of hectares.
Species diversity and status
The number of known species (including introduced species)
and the number of threatened species (endangered,
vulnerable, rare, or indeterminate; excluding introduced
species) of the following kinds of animals:
MAMLSPEC90
MAMLTHRT89
BIRDSPEC89
BIRDTHRT89
July 1992
Mammals (excludes cetaceans; i.e., whales and porpoises).
Birds.
4-91
Chapter 4—ArcWorld 1:3M country statistical attribute layers
Natural Resources and the Environment
REPTSPEC89
REPTTHRT89
Reptiles.
AMPHSPEC89
AMPHTHRT89
Amphibians.
FFSHSPEC89
FFSHTHRT89
Freshwater fishes.
PLANTAXA91
Total number of known native vascular plant species.
P_ENDMFL91
Endemic flora (plants that occur only in a single geopolitical
area or group of islands) as a percentage of the total plant
species.
PLANTHRT91
PLTHR_1K91
PLTHR_KM91
Rare and threatened plant taxa—total number; per 1,000
species; and per 10,000 square kilometers. These figures
are generally based on recorded species, but sometimes
include estimates. In most cases plant taxa refer to native
vascular species.
Because taxonomic concepts and the extent of knowledge are
variable, direct comparisons between countries are not
possible using the total number of taxa or the number per
1,000 species. The third attribute, PLTHR_KM91,
provides a relative estimate for comparing threatened species
in countries of different size; because the relationship
between area and the number of plant species is nonlinear, a
species–area curve was used to standardize this figure.
Energy production and consumption
Commercial production of the following, in petajoules
(1015 joules):
PROD_SOL89
4-92
Solid fuel (includes bituminous coal, lignite, peat, and oil
shale burned directly).
ArcWorld User's Guide and Data Reference
Chapter 4—ArcWorld 1:3M country statistical attribute layers
Natural Resources and the Environment
PROD_LIQ89
July 1992
Liquid fuel (includes crude petroleum and natural gas
liquids).
PROD_GAS89
Gaseous fuel (includes natural gas and other petroleum
gases).
PRDGEOWN89
Electric power from geothermal and wind energy.
PRDHYDRO89
Hydroelectric power.
PRDNUCLR89
Electric power from nuclear energy.
PROD_TOT89
Total energy production (includes solid, liquid, and gaseous
fuels and primary electricity production).
CONS_TOT89
Total commercial energy consumption, in petajoules, 1989.
CONS_87_89
Commercial energy consumption for 1989, in megajoules
per constant. The constant is calculated using the gross
national product expressed in 1987 U.S. dollars. This
figure represents domestic production plus net imports, less
stock increases, less aircraft and marine bunkers, less
unallocated quantities.
ENRG_IMP89
Energy imports expressed as a percentage of energy
consumption. This figure represents net imports, less stock
increases, less aircraft and marine bunkers, less unallocated
quantities. A negative value indicates that exports are greater
than imports.
TRFLCONS89
P_TRFUEL89
Total consumption of traditional fuels (fuelwood, charcoal,
bagasse [sugar processing waste], animal and vegetal
wastes), and traditional fuels as a percentage of total fuel
requirements.
ENRINTIN89
ENRINTAG89
Environmental intensity of industrial activities, and environmental intensity of agricultural activities; in megajoules
per industrial GDP, expressed in 1989 U.S. dollars.
4-93
Chapter 4—ArcWorld 1:3M country statistical attribute layers
Natural Resources and the Environment
MUNWASTE89
Annual generation of municipal waste, in kilograms per
capita. This figure includes household and bulky waste, as
well as comparable wastes from small commercial or
industrial enterprises, and market and kitchen residuals that
are collected and treated by or for municipalities. These data
are available only for the twenty-four countries that belong to
the Organization for Economic Cooperation and
Development (OECD). The year of the estimate varies from
1980 to 1990.
Marine catch and aquaculture
MRNCATCH89
Average annual marine catch, in thousands of metric tons,
1987–1989.
AQCULTPR89
Average annual aquaculture production of fish and shellfish,
thousands of metric tons, 1987–1989.
FOODFISH88
Average annual food supply from fish and fishery products,
1986–1988, in kilograms per capita.
Atmospheric emissions
Carbon dioxide emissions resulting from industrial
processes in 1989, in thousands of metric tons, from the
following sources:
CO2_SOL89
CO2_LIQ89
CO2_GAS89
4-94
Solid fuels.
Liquid fuels.
Gas fuels.
CO2GASFL89
Gas flaring.
CO2CEMNT89
Cement manufacturing.
ArcWorld User's Guide and Data Reference
Chapter 4—ArcWorld 1:3M country statistical attribute layers
Natural Resources and the Environment
CO2_TOT70
Total industrial carbon dioxide emissions, 1970.
CO2_CAP89
Industrial carbon dioxide emissions in metric tons per capita,
1989.
CO2DEFOR89
METHANE89
CFC89
SO2_89
Carbon dioxide emissions due to changes in land use
(primarily deforestation), in thousands of metric tons, for
1989.
Methane emissions resulting from human activities, in
thousands of metric tons, for 1989. This figure includes
methane contributions from solid waste, coal mining, oil and
gas production, wet rice agriculture, and livestock
production.
Chlorofluorocarbon (CFC) emissions, in thousands of
metric tons, for 1989.
Total sulfur dioxide emissions, in thousands of metric tons,
for 1989.
Line attributes
Thorough definitions of these attributes are given on page 4-50.
Classification attributes
TYPE
BND_TYPE
Each line is classified according to the type of feature it
represents. TYPE contains the code number, and
BND_TYPE contains the English description. The codes are
as follows:
Codes
1
2
3
4
9
July 1992
=
=
=
=
=
Equivalents
Coastline
International boundary
Coral reef
World region boundary
Grid line
4-95
Chapter 4—ArcWorld 1:3M country statistical attribute layers
Natural Resources and the Environment
International boundary status attribute
BND_STATUS
Each international boundary is classified according to
boundary status. The codes are as follows:
Codes
1
2
3
4
5
6
9
=
=
=
=
=
=
=
Definitions
Demarcated or delimited
Indefinite or in dispute
Line of separation or sovereignty on land
Demilitarized zone in Israel
No defined line
Selected claim lines
Not an international boundary
Boundary coincidence with rivers
BND_COINC
Each international boundary is classified as to being
coincident with a river line segment in the RIV3M coverage.
The codes are as follows:
Codes
Definitions
0 = Not coincident with river line segment
1 = Coincident with river line segment
Geographic reference attributes
COUNTRY1
COUNTRY2
CNTRY_NAME
REGION
CONTINENT
4-96
These attributes contain the following: two-letter country
codes (two attributes), country names, regional codes, and
continent codes. Countries, regions, and continents and
their corresponding codes are listed in Appendix C; regions
are also shown on the map in Chapter 1.
ArcWorld User's Guide and Data Reference
Chapter 4—ArcWorld 1:3M country statistical attribute layers
Population Characteristics
Population
Characteristics
Layer description
The Population Characteristics layer contains a subset of the
attributes found in the section of the World Bank's Social
Indicators of Development (SID) database called Human
Resources. These attributes include information on
population size and estimates, age structure, age dependency
ratios, percentage of urban and rural population, growth
rates, total land area, population density, and household
size.
Polygons and lines
for countries
Using the Population Characteristics
coverage
Time series attributes range from 1965 to 1989, with data in
five-year intervals for 1965 to 1985 and data for the
additional year of 1989. Not all years in the time series are
available for all topics.
Information about country boundaries, missing measurement
values, and the statistical flag attribute that applies to this
layer, as well as to all of the other statistical attribute layers,
is given on page 4-42.
July 1992
4-97
Chapter 4—ArcWorld 1:3M country statistical attribute layers
Population Characteristics
Summary of the Population coverage
Coverage name:
POP_GEO
Source and currency: Cartography from U.S. Government, World Data Bank II, 1988
Attribute data from the World Bank, Social Indicators of Development 1990
database
Thematic attribute
groups:
Feature
class
Geographic reference attributes (polygons and lines)
Cartographic attributes (polygons)
Statistical flag (polygons)
World organization membership (polygons)
World Bank country code (polygons)
Population by age, sex, and situation (polygons)
Population growth rates and projections (polygons)
Population density (polygons)
Classification attributes (lines)
International boundary status (lines)
Boundary coincidence with rivers (lines)
Feature
Number of features
Number of
attributes
106
Polygons
Countries and other
political divisions
Represented by ca. 12,609 polygons
Lines
Coastlines,
international
boundaries, and world
regions
Represented by ca. 16,395 lines
9
Polygon attributes
Geographic reference attributes
COUNTRY
CNTRY_NAME
REGION
CONTINENT
4-98
These geographic reference attributes contain codes and
names that make it possible to select polygonal water
features by country, world region, and continent. The areas
and their corresponding codes are listed in Appendix C;
regions are also shown on the map in Chapter 1.
ArcWorld User's Guide and Data Reference
Chapter 4—ArcWorld 1:3M country statistical attribute layers
Population Characteristics
Cartographic attributes
LAND_OCEAN
Flag used to identify continents, islands, and ocean areas.
The codes are as follows:
Codes
Definitions
1 = Continent
2 = Offshore island
3 = Ocean
ISLND_RANK
Offshore islands are ranked for cartographic significance,
primarily on the basis of size. These rank codes are only
present for islands surrounded by ocean; no islands within
inland water bodies are included in this layer. Greenland is
the largest island. The codes are as follows:
Codes
1
2
3
4
5
9
=
=
=
=
=
=
Definitions
Basic reference feature
Major
Additional major
Intermediate
Minor
Unranked
Statistical flag
STAT_FLAG
Flag used to identify a single polygon (the largest) for each
country for purposes of calculating summary statistics.
Chapter 6 provides more information about using this
attribute. The codes are as follows:
Codes
Definitions
0 = Other polygons in country.
1 = Polygon identifier for disputed territories,
reassigned areas, or countries for which data are
not tabulated by the World Bank or World
Resources Institute. (See Appendix C for a list of
disputed territories and reassigned areas.)
2 = Polygon identifier for countries that are assigned
statistical data by the World Bank or World
Resources Institute.
July 1992
4-99
Chapter 4—ArcWorld 1:3M country statistical attribute layers
Population Characteristics
World organization membership attributes
EEC
FAO
GA
GA_MEMB_YR
IAEA
IBRD
IMF
OPEC
SC
UNESCO
WHO
WMO
These attributes indicate membership in international
organizations. Each of the organization attributes can be
used to select a group of country polygons for display or
study. The organizations indicated by these attributes are
listed on page 4-46. The codes are as follows:
Codes
Definitions
0 = Not a member of this organization
1 = A member of this organization
World Bank country code attribute
WB_CNTRY
This attribute contains the three-letter country code used by
the World Bank in the SID database. Disputed territories are
assigned to individual countries; the specific assignments are
listed at the end of Appendix C.
Population by age, sex, and situation
TOTPOP65
TOTPOP70
TOTPOP75
TOTPOP80
TOTPOP85
TOTPOP89
Total population by five-year intervals.
P_0_14_65
P_0_14_70
P_0_14_75
P_0_14_80
P_0_14_85
P_0_14_89
Percentage of the population between zero and fourteen
years of age by five-year intervals.
P_15_64_65
P_15_64_70
P_15_64_75
P_15_64_80
P_15_64_85
P_15_64_89
4-100
Percentage of the population between fifteen and sixty-four
years of age by five-year intervals.
ArcWorld User's Guide and Data Reference
Chapter 4—ArcWorld 1:3M country statistical attribute layers
Population Characteristics
AGERATIO65
AGERATIO70
AGERATIO75
AGERATIO80
AGERATIO85
AGERATIO89
The age dependency ratio by five-year intervals. This is
defined as the ratio of the dependent population (under
fifteen and over sixty-four years) to the working-age
population (fifteen to sixty-four).
P_URBAN65
P_URBAN70
P_URBAN75
P_URBAN80
P_URBAN85
P_URBAN89
Percentage of the total population classified as living in
urban areas, by five-year intervals.
FEM_URB65
FEM_URB70
FEM_URB75
FEM_URB80
FEM_URB85
FEM_URB89
Ratio of females to every 100 males in urban areas. Under
normal demographic and economic circumstances, the
female-to-male ratio should not be significantly below 100.
FEM_RUR65
FEM_RUR70
FEM_RUR75
FEM_RUR80
FEM_RUR85
FEM_RUR89
Ratio of females to every 100 males in rural areas. Under
normal demographic and economic circumstances, the
female-to-male ratio should not be significantly below 100.
Population growth rates and projections
July 1992
GRW_RATE65
GRW_RATE70
GRW_RATE75
GRW_RATE80
GRW_RATE85
GRW_RATE89
The annual growth rate for the total population. Annual
growth rate (1964–65, 1974–75, and 1988–89) is calculated
from mid-year total population.
URBGRWRT65
URBGRWRT70
URBGRWRT75
URBGRWRT80
URBGRWRT85
URBGRWRT89
The annual growth rate for the urban population. Annual
growth rate (1964–65, 1974–75, and 1988–89) is calculated
from mid-year urban population.
4-101
Chapter 4—ArcWorld 1:3M country statistical attribute layers
Population Characteristics
U_R_DIFF65
U_R_DIFF70
U_R_DIFF75
U_R_DIFF80
U_R_DIFF85
U_R_DIFF89
POP2000_89
STATPOP89
Net difference between the urban and rural growth rates.
This figure reflects the tempo of urbanization. However, it
is not a net urban–rural migration measure because the
calculation also factors in basic birth and death variables
which are likely to differ between urban and rural areas.
The World Bank's population projection for the year 2000.
These data were calculated on the basis of a World Bank
model that uses country-specific trends moderated by overall
regional or global circumstances. The base year for the
demographic parameters used in this estimate was 1985.
Estimated total population when zero population growth is
achieved. Zero population growth is defined as a constant
birth rate equal to the death rate, with a stable age structure.
Population density
LANDAREA65
LANDAREA70
LANDAREA75
LANDAREA80
LANDAREA85
LANDAREA89
Total land area expressed in square kilometers. All land area
and inland water is included in this figure.
POPDNSTY65
POPDNSTY70
POPDNSTY75
POPDNSTY80
POPDNSTY85
POPDNSTY89
Population per square kilometer of total surface area, for
five-year intervals.
HHLDSIZB65
HHLDSIZB70
HHLDSIZB75
HHLDSIZB80
HHLDSIZB85
HHLDSIZB89
4-102
Average number of persons per household for the total
population in five-year intervals. A household consists of a
group of individuals who share living quarters and main
meals.
ArcWorld User's Guide and Data Reference
Chapter 4—ArcWorld 1:3M country statistical attribute layers
Population Characteristics
HHSIZE_U65
HHSIZE_U70
HHSIZE_U75
HHSIZE_U80
HHSIZE_U85
HHSIZE_U89
Average number of persons per household for urban areas,
in five-year intervals. A household consists of a group of
individuals who share living quarters and main meals.
Line attributes
Thorough definitions of these attributes are given on page 4-50.
Classification attributes
TYPE
BND_TYPE
Each line is classified according to the type of feature it represents. TYPE contains the code number, and BND_TYPE
contains the English description. The codes are as follows:
Codes
1
2
3
4
9
=
=
=
=
=
Equivalents
Coastline
International boundary
Coral reef
World region boundary
Grid line
International boundary status attribute
BND_STATUS
Each international boundary is classified according to
boundary status. The codes are as follows:
Codes
1
2
3
4
5
6
9
July 1992
=
=
=
=
=
=
=
Definitions
Demarcated or delimited
Indefinite or in dispute
Line of separation or sovereignty on land
Demilitarized zone in Israel
No defined line
Selected claim lines
Not an international boundary
4-103
Chapter 4—ArcWorld 1:3M country statistical attribute layers
Population Characteristics
Boundary coincidence with rivers
BND_COINC
Each international boundary is classified as to being
coincident with a river line segment in the RIV3M coverage.
The codes are as follows:
Codes
Definitions
0 = Not coincident with river line segment
1 = Coincident with river line segment
Geographic reference attributes
COUNTRY1
COUNTRY2
CNTRY_NAME
REGION
CONTINENT
4-104
These attributes contain the following: two-letter country
codes (two attributes), country names, regional codes, and
continent codes. Countries, regions, and continents and
their corresponding codes are listed in Appendix C; regions
are also shown on the map in Chapter 1.
ArcWorld User's Guide and Data Reference
Chapter 5
The ArcWorld 1:25M and
Browse Map layers
The ArcWorld 1:25M coverages represent generalized versions of some of the
larger-scale ArcWorld 1:3M coverages. The 1:25 million coverages have many
of the same cartographic features as the 1:3 million coverages, although they are
represented in less detail. The 1:25 million coverages are designed for people
interested in either world or regional-level analysis, or an exploratory
reconnaissance before delving into the ArcWorld 1:3M layers for more detailed
information.
The Browse Map coverages, which are also described in this chapter, are
designed for people who want to display any of the 500 or so ArcWorld
statistical attributes on a highly generalized world map. The Browse Map
coverages draw very rapidly and are useful for exploring general global
thematic patterns.
The ArcWorld 1:25M and Browse Map layers are listed in the table on the next
page.
July 1992
5-1
Chapter 5—The ArcWorld 1:25M and Browse Map layers
The ArcWorld 1:25M and Browse Map layers are as follows:
Layer
ArcWorld 1:25M
coverage names
Browse Map
coverage names
Cartographic and index layers
Country Boundaries
Latitude/Longitude Grid
Major Cities
Map Elements
Rivers and Water Bodies
CTRY25M
LTLG20
CITY25M
SC_25M*
RIV25M
—
LTLG_BR
CITY_BR
—
—
—
—
—
—
—
—
ECONIND
EDU_LIT
AGRICUL
HEALTH
LABOR
WRI_BR
—
STAT25M
POP_GEO
STAT_BR
Statistical attribute layers
Economic and Industrial Indicators
Education and Literacy
Food Production and Nutrition
Health and Vital Statistics
Labor Force Characteristics
Natural Resources and the
Environment
Population Characteristics
Selected Statistical Attributes
* The Map Elements coverage is provided only for Robinson projection in the UNIX
ARC/INFO format.
5-2
ArcWorld User's Guide and Data Reference
Chapter 5—The ArcWorld 1:25M and Browse Map layers
Country Boundaries
Country
Boundaries
Layer description
Polygons and lines
The Country Boundaries layer serves as a small-scale
national-level basemap for the entire globe. Two hundred
forty separate geopolitical entities are represented and
identified according to the Federal Information Processing
Standards (FIPS) country codes (from FIPS publication
10-3). The fifteen former Soviet Union republics were
upgraded to full international status. East and West
Germany and North and South Yemen were combined into
single countries. These changes make the layer current to
world political conditions as of January 1, 1992.
Line attributes are present that identify coastlines and six
types of international boundaries. Attributes that permit
countries to be individually selected for display are contained
in both the line and polygon attribute tables. Annotation
containing country names accompanies this layer.
Using the Country Boundaries coverage
Countries with multiple geographic parts such as offshore
islands or overseas territorial possessions are represented in
the database by multiple polygons all having the same
country code. A flag attribute (STAT_FLAG) is provided to
identify the largest polygon for each country. This flag
allows selection of a single data record per country, which is
necessary for correct tabulation purposes. The countries
represented by the most polygons are Canada (257), Russia
(190), United States (131), and Indonesia (129).
The country name annotation was placed so that it would not
overlap the city name annotation that accompanies the Major
Cities layer.
July 1992
5-3
Chapter 5—The ArcWorld 1:25M and Browse Map layers
Country Boundaries
Summary of the Country Boundaries coverage
Coverage name
CTRY25M
Source and currency: U.S. Government—World Data Bank II, 1988
Thematic attribute
groups:
Geographic reference attributes (polygons and lines)
Land/ocean indicator (polygons)
Cartographic significance (polygons)
Statistical flag (polygons)
World organization membership attributes (polygons)
Classification attributes (lines)
International boundary status attribute (lines)
Geographic reference attributes (lines)
Annotation text:
Country names
Feature
class
Polygons
Lines
5-4
Feature
Number of features
All polygon features
Represented by ca. 2,074 polygons
Geopolitical units
256 features represented by ca. 2,029
polygons
Continents
Represented by ca. 198 polygons
Offshore islands
Represented by ca. 1,831 polygons
All line features
Represented by ca. 3,940 lines
Coastlines
Represented by ca. 3,265 lines
International
boundaries (all types)
Represented by ca. 510 lines
Number of
attributes
19
8
ArcWorld User's Guide and Data Reference
Chapter 5—The ArcWorld 1:25M and Browse Map layers
Country Boundaries
Polygon attributes
Geographic reference attributes
COUNTRY
CNTRY_NAME
REGION
CONTINENT
These attributes contain the following: FIPS 10-3 two-letter
country codes, country names, region names, and continent
names. Codes for countries and region and continent names
are listed in Appendix C. The world regions are shown on
the map in Chapter 1. These geographic reference codes can
be used to select particular country polygons, world regions,
or entire continents for display or study.
Land/ocean indicator
LAND_OCEAN
This attribute contains words to identify continental areas,
offshore islands, and ocean polygons. The words are as
follows:
• Continent
• Island
• Ocean
Cartographic significance
ISLND_RANK
Offshore islands are ranked for cartographic significance,
primarily on the basis of size. These rank codes are only
present for islands surrounded by ocean; no inlands within
inland water bodies are included. Greenland is the largest
island. The codes are as follows:
Codes
1
2
3
4
5
9
July 1992
=
=
=
=
=
=
Definitions
Basic reference feature
Major
Additional major
Intermediate
Minor
Unranked
5-5
Chapter 5—The ArcWorld 1:25M and Browse Map layers
Country Boundaries
Statistical flag
STAT_FLAG
Flag attribute to identify a unique polygon for each FIPS
10-3 country code. The flag is applied to the largest polygon
(based on area) in each country. The codes are as follows:
Codes
Definitions
0 = Other polygon
1 = Largest polygon per country
Note: the STAT_FLAG attributes in the statistical attribute
coverages include an additional code value ("2") in order to
accommodate the generation of summary statistics.
World organization membership attributes
EEC
FAO
GA
GA_MEMB_YR
IAEA
IBRD
IMF
OPEC
SC
UNESCO
WHO
WMO
These attributes indicate membership in international
organizations. Each of the organization attributes can be
used to select a group of country polygons for display or
study. The organizations indicated by these attributes are
listed on page 4-46. The codes are as follows:
Codes
Definitions
0 = Not a member of this organization
1 = A member of this organization
Line attributes
Classification attributes
TYPE
BND_TYPE
5-6
Each line is classified according to the type of feature it
represents. This attribute allows you to symbolize different
line features (political boundaries, coastlines, reefs, etc.)
differently. TYPE contains the code number, and
BND_TYPE contains the English description. The codes are
as follows:
ArcWorld User's Guide and Data Reference
Chapter 5—The ArcWorld 1:25M and Browse Map layers
Country Boundaries
Codes
1
2
4
9
=
=
=
=
Definitions
Coastline
International boundary
World region boundary
Grid line
Grid lines (code 9) have been incorporated into this coverage
for processing purposes. These grid lines carry no thematic
information and can be "turned off" during data displays by
reselecting for all TYPE codes not equal to 9, or by setting
the line color to be blank for that category. The grid lines
follow lines of longitude and latitude.
International boundary status attribute
BND_STATUS
Each international boundary is classified according to
boundary status. This attribute allows you to display the
various types of boundaries using different colors or line
symbols. The codes are as follows:
Codes
1
2
3
4
5
6
9
July 1992
=
=
=
=
=
=
=
Definitions
Demarcated or delimited
Indefinite or in dispute
Line of separation or sovereignty on land
Demilitarized zone in Israel
No defined line
Selected claim lines
Not an international boundary
5-7
Chapter 5—The ArcWorld 1:25M and Browse Map layers
Country Boundaries
Geographic reference attributes
COUNTRY1
COUNTRY2
CNTRY_NAME
REGION
CONTINENT
These attributes contain the following: two-letter country
codes (two attributes), country names, regional codes, and
continent codes. The countries on either side of an international boundary are listed by code in separate attributes
(COUNTRY1 and COUNTRY2), and by name in a single
attribute (CNTRY_NAME; e.g., "France/Germany"). Only
one country is identified for coastlines. A similar dual
coding scheme was used for boundaries between regions
and continents, except that codes rather than names were
used.
Countries, regions, and continents and their corresponding
codes are listed in Appendix C; regions are also shown on
the map in Chapter 1.
5-8
ArcWorld User's Guide and Data Reference
Chapter 5—The ArcWorld 1:25M and Browse Map layers
Latitude/Longitude Grid
Latitude/
Longitude
Grid
Layer description
The Latitude/Longitude Grid layer includes coverages for
both the 1:25 million data and the Browse Map. These
coverages contain lines that represent geographic parallels
(lines of latitude) and meridians (lines of longitude) at
intervals of 20 degrees. Attributes include the latitude or
longitude value of each line and codes indicating whether a
line segment is over land or ocean.
Lines
1:25M and
Browse Map
Using the Latitude/Longitude Grid coverages
The attribute LAND_WATER provides the opportunity to
symbolize the latitude/longitude grid differently over land
and water. For example, the grid could be displayed in the
ocean areas to provide visual reference, and excluded from
areas inside countries to avoid obscuring other displayed
map features.
The spatial extent, scale, and purpose of the display will
determine whether or not the latitude/longitude grid should
be included. The 20-degree grid is appropriate for smallscale displays, such as maps showing the full extent of the
world or when large areas of ocean are shown.
July 1992
5-9
Chapter 5—The ArcWorld 1:25M and Browse Map layers
Latitude/Longitude Grid
Summary of the Latitude/Longitude Grid coverages
Coverage names:
LTLG20, LTLG_BR
Source and currency: ESRI, generated, 1992
Thematic attribute
groups:
Feature
class
Lines
Identification attributes
Number of features
(1:25M coverage)
Feature
Latitude and longitude Represented by ca. 1,450 lines
lines, 20- by 20-degree
grid
Number of
attributes
3
Line attributes
All of the attributes listed below are contained in both the
1:25M and Browse Map coverages.
Identification attributes
LATITUDE
The latitude of the grid line. All south latitude values begin
with a minus sign. This attribute contains a blank for lines
of longitude.
LONGITUDE
The longitude of the grid line. All west longitude values
begin with a minus sign. This attribute contains a blank for
lines of latitude.
LAND_WATER
Identifies whether a line segment is over land or water. The
codes are as follows:
Codes
Definitions
0 = Line segment lies over an ocean area
1 = Line segment lies over land or inland water
5-10
ArcWorld User's Guide and Data Reference
Chapter 5—The ArcWorld 1:25M and Browse Map layers
Major Cities
Major Cities
Layer description
Points
1:25M and
Browse Map
The Major Cities layer contains point features representing
national capitals and other major cities around the world, in
both ArcWorld 1:25M and Browse Map coverages. The
1:25 million-scale coverage represents 144 national capitals
plus 42 other large urban centers with a population greater
than 3 million, for a total of 186 cities. There are name
attributes for both the conventional (Romanized) and native
spellings of each city. The names and spellings presented in
the coverage reflect the decisions and determinations of the
International Board of Geographic Names as of January 31,
1992. The Browse Map coverage represents 129 national
capitals, with attributes for the city name, country code, and
country name. Annotation containing city names also
accompanies both coverages.
Using the Major Cities coverages
The Major Cities point features are useful as general
geographic identifiers, especially for small-scale maps. In
the 1:25M coverage, the attributes for the cities allow very
large population centers and national capitals to be differentiated from other types of cities. The countries with the
largest number of cities are the United States (40), China
(35), Russia (19), and India (17).
Given the difficulty of representing and displaying diacritical
marks, the diacritical attribute in the 1:25M coverage
indicates only the presence of a diacritical mark. The
diacritical mark may be of any type and may appear at any
location in the city name.
The annotated city names are in cartographically appropriate
positions that are placed so as to not overlap the country
names in the 1:25M Country Boundaries layer. The size of
July 1992
5-11
Chapter 5—The ArcWorld 1:25M and Browse Map layers
Major Cities
Summary of the Major Cities coverages
Coverage names:
CITY25M, CITY_BR
Source and currency: Cartography from the Defense Mapping Agency, Operational Navigation
Charts, various years. Attribute data from the World Fact Book, 1989.
Thematic attribute
groups:
Name attribute
Classification attributes
Additional name attribute
Geographic reference attributes
Annotation text:
City names
Feature
class
Points
Feature
Number of features
(1:25M coverage)
All point features
Represented by 186 points
National capitals
Represented by 144 points
Major urban centers
over 3 million
Represented by 42 points
Number of
attributes
9
these names will automatically change when the scale of a
display map is changed.
Point attributes
The complete list of attributes defined below is contained in the
ArcWorld 1:25M coverage. Asterisks indicate those attributes
that are included in the Browse Map coverage.
Name attribute
NAME*
5-12
This attribute contains the conventional spelling (Romanized)
of the city. The name and spelling follow the Board of
Geographic Names standards as of January 31, 1992.
ArcWorld User's Guide and Data Reference
Chapter 5—The ArcWorld 1:25M and Browse Map layers
Major Cities
Classification attributes
CAPITAL
This attribute indicates whether the city is a national capital.
The codes are as follows:
Codes
Definitions
0 = Not a national capital
1 = A national capital
MAJ_CITY
This attribute indicates whether a non-national capital city
has a population greater than 3,000,000. The codes are as
follows:
Codes
Definitions
0 = Not a major city
1 = A major city
Geographic reference attributes
COUNTRY*
CNTRY_NAME*
REGION
CONTINENT
These geographic reference codes can be used to select cities
by country, world region, or continent. Continent, region,
and country names and their codes are listed in Appendix C.
Additional name attributes
LOCAL_NAME
This attribute contains the local or native spelling of the city.
The name and spelling follow the current Board of
Geographic Names standards as of January 31, 1992. The
spelling in this attribute is the closest possible rendering
using a standard English character set. No special foreign
characters were used and no diacritical marks except the
apostrophe are present.
DIACR_FLAG
This attribute indicates whether diacritical marks are used in
the local spelling of the city. The codes are as follows:
Codes
Definitions
0 = No diacritical mark present
1 = Diacritical mark is present
July 1992
5-13
Chapter 5—The ArcWorld 1:25M and Browse Map layers
Map
Elements
Layer description
The Map Elements layer contains a scale bar and title that can
be used to make your display look like a finished map.
Using the Map Elements coverage
Polygons and lines
This layer contains only one coverage, in the Robinson
projection in UNIX format. This coverage is not provided
in the MS-DOS format because similar information can be
created in ArcView for Windows using the Map
Composition environment (accessed through the Preferences
menu).
In the polygon theme, the scale bar is coded so that it may be
filled with one or two colors. An annotation theme provides
the title and characters associated with the other map
elements.
The scale is given in kilometers for use with the data in the
Robinson projection. Because the scale bar is in a
predetermined location that cannot be changed, it can only be
used for maps that display the full extent of the database.
5-14
ArcWorld User's Guide and Data Reference
Chapter 5—The ArcWorld 1:25M and Browse Map layers
Map Elements
Summary of the Map Elements coverage
Coverage name:
SC_25M
Source and currency: ESRI, 1992
Thematic attribute
groups:
Classification attribute (polygons)
Annotation text:
Map title and scale
Feature
class
Feature
Number of features
Number of
attributes
Polygons
All polygon features
Represented by 8 polygons
1
Lines
All line features
Represented by 19 lines
0
Polygon attribute
Classification attribute
FILL
The scale bar is designed so that it can be filled with
alternating colors. The codes are as follows:
Codes
Definitions
1 = First color
2 = Second color
July 1992
5-15
Chapter 5—The ArcWorld 1:25M and Browse Map layers
Rivers and
Water Bodies
Layer description
The Rivers and Water Bodies layer contains hydrographic
features that are intended to provide basic visual orientation
for small-scale maps. It is made up of both lines and
polygons that represent large perennial rivers and lakes.
Using the Rivers and Water Bodies coverage
Polygons and lines
The Rivers and Water Bodies layer contains both polygon
and line features in a single coverage. A feature may require
that it be represented using both these graphic elements. For
example, the Nile River begins as a lake, then changes to a
single line, passes through a reservoir, becomes a single line
again, and is finally enters the Mediterranean Sea as series of
short branching lines.
Because all water features are coded for the country in which
they occur, short sections of international boundaries are
present inside lakes in this coverage in order to divide the
water body into its component national territories.
Those rivers that are of sufficient width to be represented as
polygons in the 1:3M Rivers and Water Bodies coverages
are represented solely by a centerline in this 1:25,000,000scale coverage.
5-16
ArcWorld User's Guide and Data Reference
Chapter 5—The ArcWorld 1:25M and Browse Map layers
Rivers and Water Bodies
Summary of the Rivers and Water Bodies coverage
Coverage name:
RIV25M
Source and currency: U.S. Government—World Data Bank II, 1988
Thematic attribute
groups:
Feature
class
Polygons
Lines
Classification attributes (polygons and lines)
Geographic reference attributes (polygons and lines)
Boundary coincidence with rivers (lines)
Feature
Number of features
All polygon features
Represented by ca. 70 polygons
Major lake
Represented by ca. 60 polygons
Not inland water
Represented by ca. 10 polygons
All line features
Represented by ca. 3,350 lines
Major river
Represented by ca. 3,190 lines
Shoreline
Represented by ca. 130 lines
Country boundary
Represented by ca. 25 lines
Grid line
Represented by 5 lines
Number of
attributes
6
7
Polygon attributes
Classification attributes
TYPE
WATER_TYPE
Each polygon is classified according to the type of water
feature it represents. TYPE contains the code number, and
WATER_TYPE contains the English description. The codes
are as follows:
Codes
Equivalents
1 = Major lake
2 = Not inland water
July 1992
5-17
Chapter 5—The ArcWorld 1:25M and Browse Map layers
Rivers and Water Bodies
Geographic reference attributes
COUNTRY
CNTRY_NAME
REGION
CONTINENT
These geographic reference attributes contain codes and
names that make it possible to select polygonal water
features by country, world region, and continent. The areas
and their corresponding codes are listed in Appendix C;
regions are also shown on the map in Chapter 1.
Line attributes
Classification attributes
TYPE
RIVER_TYPE
Each line is classified according to type of feature it
represents. TYPE contains the code number, and
RIVER_TYPE contains the English description. These
attributes allow you to select and symbolize the various
water features differently. The majority of lines are major
rivers, but other water features are present. Also present in
this layer are a few international boundaries, polygon closure
lines, and grid lines.
Codes
1
2
3
9
=
=
=
=
Equivalent
Major river
Shoreline
Country boundary
Grid line
Geographic reference attributes
COUNTRY1
COUNTRY2
CNTRY_NAME
REGION
CONTINENT
5-18
These attributes contain the following: two-letter country
codes (two attributes), country names, regional codes, and
continent codes. Because rivers often serve as international
boundaries, two country code attributes have been provided.
The countries on either side of a river are listed by code in
separate attributes (COUNTRY1 and COUNTRY2), and by
name in a single attribute (CNTRY_NAME; e.g.,
"France/Germany"). If a river is completely within a
country, either COUNTRY1 or COUNTRY2 will contain a
blank.
ArcWorld User's Guide and Data Reference
Chapter 5—The ArcWorld 1:25M and Browse Map layers
Rivers and Water Bodies
Where rivers form the boundaries between regions and
continents, both area codes are listed and separated by a
slash (e.g., E_EU/W_EU).
Countries, regions, and continents and their corresponding
codes are listed in Appendix C; regions are also shown on
the map in Chapter 1.
July 1992
5-19
Chapter 5—The ArcWorld 1:25M and Browse Map layers
Selected
Statistical
Attributes
Layer description
Polygons and lines
for countries
The Selected Statistical Attributes layer contains seventy
attributes selected from the ArcWorld 1:3M country
statistical attribute layers. These attributes include data from
both the World Bank and the World Resources Institute on
topics such as population, vital statistics, health, agriculture,
forestry, food production, the labor force, economic
development, the environment, and education. These
attributes are linked to both the 1:25,000,000-scale and the
Browse Map cartographic data.
1:25M and
Browse Map
Using the Selected Statistical Attributes
coverages
The statistical attribute names used in this coverage are the
same as those in the 1:3,000,000-scale coverages.
The country statistical attribute coverages contain political
boundaries and polygons to provide the geographic extent
for the statistical data. The country boundaries in this layer
do not reflect recent (1991) political changes in the former
Soviet Union and Germany in order to match the World
Bank and World Resources Institute tabular data from
previous years. The 1:25M Country Boundaries coverage
described at the beginning of this chapter does incorporate
the recent boundary changes in those countries.
5-20
ArcWorld User's Guide and Data Reference
Chapter 5—The ArcWorld 1:25M and Browse Map layers
Selected Statistical Attributes
Summary of the Selected Statistical Attributes coverages
Coverage name:
STAT25M, STAT_BR
Source and currency: Cartography from U.S. Government, World Data Bank II, 1988 (1:25M) and
Browse Map cartography from a manually generalized version of the WDBII.
Attribute data from the World Bank, Social Indicators of Development 1990
database and the World Resources Institute, World Resources 1992–1993
Data Base
Thematic attribute
groups:
Geographic reference attributes (polygons and lines)
Cartographic attributes (polygons)
Statistical flag (polygons)
World organization membership attributes
Classification attributes (lines)
World Bank attribute groups (polygons)
World Bank country code
Population
Vital statistics
Health
Agriculture and forestry
Food production and nutrition
Labor force
Economic development
Education
WRI attribute groups (polygons)
Economic development
Health
Wilderness area attribute
Housing
Land attributes
Animal and plant life
Energy
Municipal waste
Food supply
Atmospheric emissions
Feature
class
Feature
Number of features
(1:25M coverage)
Number of
attributes
Polygons
All polygon features
Represented by ca. 2,025 polygons
90
Lines
All line features
Represented by ca. 3,888 lines
8
Coastlines
Represented by ca. 3,265 lines
International boundaries
Represented by ca. 510 lines
July 1992
5-21
Chapter 5—The ArcWorld 1:25M and Browse Map layers
Selected Statistical Attributes
Sometimes a statistical data value for a particular geographic
area is not available in the database. Three special codes
indicate the absence of data values in the statistical attributes.
These special codes are as follows:
Codes
Definitions
–97 = Missing data or data not available
–98 = Country not included in the source tabular database
–99 = Ocean (1:25M coverage only)
Countries that comprise multiple geographic parts, such as
offshore islands or overseas territorial possessions, are
represented in the database by multiple polygons that all have
the same country code. A flag attribute (STAT_FLAG) is
provided to identify a single polygon (the largest) for every
country. These flags allow the selection of a single data
record per country, which is necessary for generating correct
summary statistics.
Additional information about the way missing measurement
values are handled in the database is given on page 3-9;
information about how to use these codes in combination
with the statistical flag is given on page 6-4. Chapter 6 also
discusses the comparability and completeness of the
statistical data in these layers.
Polygon attributes
The complete list of attributes defined below is contained in the
ArcWorld 1:25M coverage. Asterisks indicate those attributes
that are included in the Browse Map coverage.
Geographic reference attributes
COUNTRY*
CNTRY_NAME*
REGION
CONTINENT
5-22
These geographic reference attributes contain codes and
names that make it possible to select polygonal features by
country, world region, and continent. The areas and their
corresponding codes are listed in Appendix C; regions are
also shown on the map in Chapter 1.
ArcWorld User's Guide and Data Reference
Chapter 5—The ArcWorld 1:25M and Browse Map layers
Selected Statistical Attributes
Cartographic attributes
LAND_OCEAN
This attribute contains words to identify continental areas,
offshore islands, and ocean polygons. The words are as
follows:
• Continent
• Island
• Ocean
ISLND_RANK
Offshore islands are ranked for cartographic significance,
primarily on the basis of size. These rank codes are only
present for islands surrounded by ocean; no inlands within
inland water bodies are included. Greenland is the largest
island. The codes are as follows:
Codes
1
2
3
4
5
9
=
=
=
=
=
=
Definitions
Basic reference feature
Major
Additional major
Intermediate
Minor
Unranked
Statistical flag attribute
STAT_FLAG*
Flag used to identify a single polygon (the largest) for each
country for purposes of calculating summary statistics.
Chapter 6 provides more information about using this
attribute. The codes are as follows:
Codes
Definitions
0 = Other polygons in country.
1 = Polygon identifier for disputed territories,
reassigned areas, or countries for which data are
not tabulated by the World Bank or World
Resources Institute. (See Appendix C for a list of
disputed territories and reassigned areas.)
2 = Polygon identifier for countries that are assigned
statistical data by the World Bank or World
Resources Institute.
July 1992
5-23
Chapter 5—The ArcWorld 1:25M and Browse Map layers
Selected Statistical Attributes
World organization membership attributes
EEC
FAO
GA
GA_MEMB_YR
IAEA
IBRD
IMF
OPEC
SC
UNESCO
WHO
WMO
These attributes indicate membership in international
organizations. Each of the organization attributes can be
used to select a group of country polygons for display or
study. The organizations indicated by these attributes are
listed on page 4-46. The codes are as follows:
Codes
Definitions
0 = Not a member of this organization
1 = A member of this organization
World Bank attribute groups
World Bank country code
WB_CNTRY*
This attribute contains the three-letter country code used by
the World Bank in the SID database. Disputed territories are
assigned to individual countries; the specific assignments are
listed at the end of Appendix C.
Population
5-24
TOTPOP89*
Total population for 1989.
P_0_14_89*
Percentage of the population between zero and fourteen
years of age, in 1989.
P_15_64_89*
Percentage of the population between fifteen and sixty-four
years of age, in 1989.
GRW_RATE89*
These attributes contain the growth rate for the total
population. Annual growth rate (1988–89) calculated from
midyear total population.
ArcWorld User's Guide and Data Reference
Chapter 5—The ArcWorld 1:25M and Browse Map layers
Selected Statistical Attributes
URBGRWRT89*
These attributes contain the growth rate for the urban
population. Annual growth rate (1988–89) calculated from
midyear urban population.
U_R_DIFF89*
Net difference between the urban and rural growth rates.
This figure reflects the tempo of urbanization. However, it
is not a net urban–rural migration measure because the
calculation also factors in basic birth and death variables
which are likely to differ between urban and rural areas.
POP2000_89*
The World Bank's population projection for the year 2000.
These data were calculated on the basis of a World Bank
model that uses country-specific trends moderated by overall
regional or global circumstances. The base year for the
demographic parameters used in this estimate was 1985.
LANDAREA85*
Total land area expressed in square kilometers. All land area
and inland water is included in this figure.
POPDNSTY85*
Population per square kilometer of total surface area.
Vital statistics
The following data are based on a combination of observed
values and interpolated and projected estimates.
BIR_RATE89*
DTH_RATE89*
INF_DTH89*
July 1992
Crude birth rate, which is defined as the number of births
per 1,000 persons in a given year.
Crude death rate, which is defined as the number of deaths
per 1,000 persons in a given year.
Infant mortality rate, which is defined as the number of
deaths of infants under one year of age per 1,000 live births
in a given year. A few countries use an atypical definition of
live births, which reduces their infant mortality rates relative
to other countries.
5-25
Chapter 5—The ArcWorld 1:25M and Browse Map layers
Selected Statistical Attributes
LIFE_EXP89*
Life expectancy at birth for the total population. Life
expectancy is defined as the number of years a newborn
infant would live if the prevailing patterns of mortality were
to remain the same throughout its life.
Health
SAFEH2O85*
Percentage of the total population with reasonable access to
safe water supply. This definition includes treated surface
water and untreated but uncontaminated groundwater, such
as springs, sanitary wells, and protected boreholes.
EXP_MED85*
Percentage of Gross Domestic Product (GDP) spent on
medical care. This includes both private and government
spending. Computed from United Nations International
Comparison Program (ICP) figures, or national estimates, if
available.
POP_DOCT80*
Population per physician. Physicians include medical
assistants who dispense medical services similar to
registered physicians. The definition of recognized medical
practitioners differs among countries.
POP_HBED80*
Population per hospital bed. A hospital is defined as an
establishment permanently staffed by at least one physician.
Hospitals include public, private, general, and specialized
facilities, and rehabilitation centers.
Agriculture and forestry
5-26
P_AGLAND85*
The amount of agricultural land as a percentage of the total
land area. Includes areas used for crops, pasture, market or
kitchen gardens, and land lying fallow. Total land excludes
areas of inland waters and rivers.
POPDNSAG85*
Population per square kilometer of agricultural land.
ArcWorld User's Guide and Data Reference
Chapter 5—The ArcWorld 1:25M and Browse Map layers
Selected Statistical Attributes
FORESTS85*
The land area under natural or planted stands of trees,
measured in square kilometers. Includes productive and
nonproductive areas and cleared land that will be reforested
in the near future.
NETDEFOR85*
The net annual rate of change of forest and woodland area,
expressed as a percentage. A positive number indicates an
increase in forested area.
Food production and nutrition
July 1992
FOODPROD89*
The average annual quantity of food produced per capita in
relation to the quantity produced in 1979–1981. The
quantity produced in 1979–1981 is assigned a relative value
of 100. Food is defined as comprising nuts, pulses, fruit,
cereals, vegetables, sugarcane, sugar beets, starchy roots,
edible oils, livestock, and livestock products. This figure
excludes animal feed, seeds for agriculture, and food lost in
processing.
CAL_CAP85*
The daily calorie supply per capita, computed as the energy
equivalent of net food supplies in a country, per capita, per
day. Available supplies comprise domestic production,
imports less exports, and changes in stock. This figure
excludes animal feed, seeds for agriculture, and food lost in
processing.
PROT_CAP85*
The protein content of the net food supply per capita,
measured in grams. Net food supplies comprise domestic
production, imports less exports, and changes in stock.
This figure excludes animal feed, seeds for agriculture, and
food lost in processing. U.S. Department of Agriculture
(USDA) minimum allowances are 60 grams of total protein
per day and 20 grams of animal or pulse (peas, beans,
lentils, etc.) protein.
5-27
Chapter 5—The ArcWorld 1:25M and Browse Map layers
Selected Statistical Attributes
Labor force
LABORFOR89*
P_AGRIC80*
Total labor force in 1989. Total labor force is defined as the
number of "economically active" people in the population.
This definition of total labor force includes the armed forces
and the unemployed, but excludes homemakers and other
unpaid caregivers.
Percentage of the total labor force engaged in farming,
forestry, hunting, and fishing in 1980.
P_FEMALE89*
Percentage of the total labor force composed of females.
Female participation rates in the labor force are significantly
underestimated in several developing countries according to
the World Bank.
PARTICIP89*
Percentage of the total population the labor force makes up.
This figure is based on International Labour Office
estimates.
PARTCP_F89*
Percentage of population of all ages in the labor force.
These figures are based on International Labour Office
estimates, on the age–sex structure of the population.
Economic development
GNP_CAP89*
EXPFOODS85*
5-28
Gross national product per capita for 1989, in 1989 U.S.
dollars.
Percentage of Gross Domestic Product (GDP) spent on
foods. Computed from United Nations International
Comparison Program (ICP) figures, or national estimates, if
available. GDP is the final output of goods and services
produced by the domestic economy. This figure includes net
export of goods and nonfactor services. It does not include
overseas workers' remittances, interest on loans, profits,
and other factor payments that residents receive from abroad.
Factor services are labor and capital.
ArcWorld User's Guide and Data Reference
Chapter 5—The ArcWorld 1:25M and Browse Map layers
Selected Statistical Attributes
ENRG_CAP85*
Annual consumption of commercial primary energy (coal;
lignite; petroleum; natural gas; and hydro, nuclear, and
geothermal electricity) expressed in kilograms of
oil equivalent per capita.
POP_CAR80*
Number of people per passenger car. A passenger car is
defined as any private vehicle seating nine people or less.
POP_TELE80*
Number of people per installed public or private telephone.
A telephone must be connectable to a central exchange to be
included. The data are generally derived from International
Telecommunications Union publications.
Education
EXPEDUC85*
Percentage of Gross Domestic Product (GDP) spent on
education for 1985. This figure includes both government
and private spending. Computed from United Nations
International Comparison Program (ICP) figures, or national
estimates, if available.
P_PRIMRY85*
Percentage of school-age children who were enrolled in
primary school in 1985. Definitions of "school age" varies
by country. Many but not all countries consider primary
school age to be 6–11 years and secondary school age to be
12–17 years. Values over 100 percent are possible if some
pupils are younger or older than the country's standard
school-age range.
P_SECNDY85*
P_SCIENG85*
July 1992
Percentage of school-age children who were enrolled in
secondary school in 1985.
Percentage of all tertiary students who are enrolled in science
and engineering fields. Includes both public and private
institutions. Field of study is defined as the student's main
area of specialization based on International Standard
Classification of Education criteria.
5-29
Chapter 5—The ArcWorld 1:25M and Browse Map layers
Selected Statistical Attributes
PUPTCH_P85*
ILLITER85*
The pupil-teacher ratio for primary schools. This ratio is
computed by dividing the number of pupils enrolled in
primary school by the total number of primary school
teachers.
Percentage of the population fifteen years of age and older
who cannot, with understanding, both read and write a short
simple statement on everyday life. The application of this
criteria is subject to significant qualifiers in a number of
countries.
World Resources Institute attributes
Economic development
P_AGGDPR88*
P_INDGDP88*
P_SERGDP88*
Percentage of GDP contributed by activities in agriculture,
industry, and services in 1988. GDP is the sum of the final
outputs of various sectors of a country's economy, minus
the value of the inputs for production. These figures include
net export of goods and nonfactor services. They do not
include overseas workers' remittances, interest on loans,
profits, and other factor payments that residents receive from
abroad. (Factor services are labor and capital.) Some of the
country values are from earlier years.
P_GVTGDP89*
Central government expenditures in 1989 as a percentage of
GDP.
Health
SAFH2OUR88*
SAFH2ORR88*
5-30
Percentage of the urban population and percentage of the
rural population with access to safe drinking water. Access
to safe water in urban areas means having piped water or
access to a public piped water supply within 200 yards of a
dwelling, and in rural areas access means treated water or
ArcWorld User's Guide and Data Reference
Chapter 5—The ArcWorld 1:25M and Browse Map layers
Selected Statistical Attributes
protected, untreated water that is close enough to a dwelling
to fetch in a reasonable amount of time.
IM_DPT90*
IM_MEASL90*
The percentage of one-year-old children who were fully
immunized in 1990 against the following diseases:
diphtheria, pertussis (whooping cough), and tetanus (DPT);
and measles.
CONTRCEP89*
The percentage of married or cohabiting couples that use any
method of birth control.
Wilderness area attribute
WILDERNS88*
Wilderness area as a percentage of total land area, 1988.
Wilderness area is defined as lands showing no evidence of
development (settlements, roads, buildings, airports,
pipelines, powerlines, reservoirs, etc.). The minimum area
for inclusion was 4,000 square kilometers.
Housing
HHLDSIZR86*
HHWOELEC82*
Average number of occupants per household, 1970–1986.
Percentage of households without electricity from public
utilities, 1970–1982. Note: this figure includes residences
serviced by local generators or other privately owned means
of obtaining electricity.
Land attributes
CROPLAND89*
July 1992
Total area of cropland, in thousands of hectares. Cropland
refers to land under temporary and permanent crops,
temporary meadows, market and kitchen gardens, and
temporarily fallow land. Permanent cropland comprises
crops that do not need to be replanted after each harvest,
such as cocoa, coffee, rubber, fruit trees, and vines.
5-31
Chapter 5—The ArcWorld 1:25M and Browse Map layers
Selected Statistical Attributes
NOSOILCN89*
Total land area with soil that has no inherent chemical and
physical restraints to agricultural productivity, in thousands
of hectares, 1989. The following physical and chemical
constraints are absent in the soils included in this figure:
steep slope, shallowness, poor drainage, low nutrient
retention, aluminum toxicity, acidity, phosphorus fixation,
amorphous material, vertic properties (i.e., shrinking and
swelling), low potassium reserves, calcareous soil, salinity,
excess sodium, acid sulfate soil, gravel, and rocks.
DEFORTOT85*
Average annual deforestation for all forests, in thousands of
hectares 1981–1985. Deforestation is defined as the
permanent clearing of forests for use in shifting cultivation,
permanent agriculture, or settlements. Not included are
alterations such as selective logging. These figures refer to
the total forest area, including open forest, closed forest,
plantation, and other types of generally wooded areas.
P_PROTLN90*
Percentage of national land area that is protected, in
thousands of hectares. Protected land includes both totally
and partially protected areas. Marine and coastal protected
area figures are calculated for all littoral, coral, island,
marine, and estuarine components. This figure does not
include locally or provincially protected sites, privately
owned areas, or areas managed primarily for the extraction
of natural resources. National lists also usually include sites
that are under international protection systems.
Animal and plant life
MAMLSPEC90*
MAMLTHRT89*
5-32
The number of known mammal species in a country
(including introduced species), and the number of threatened
mammal species (endangered, vulnerable, rare, or
indeterminate—excluding introduced species). Both of these
figures exclude whales and porpoises.
ArcWorld User's Guide and Data Reference
Chapter 5—The ArcWorld 1:25M and Browse Map layers
Selected Statistical Attributes
PLANTHRT91*
PLTHR_1K91*
PLTHR_KM91*
Rare and threatened plant taxa—total number; per 1,000
species; and per 10,000 square kilometers. These figures
are generally based on recorded species, but sometimes
include estimates. In most cases plant taxa refer to native
vascular species.
Because taxonomic concepts and the extent of knowledge are
variable, direct comparisons between countries are not
possible using the total number of taxa or the number per
1,000 species. The third attribute, PLTHR_KM91,
provides a relative estimate for comparing threatened species
in countries of different size; because the relationship
between area and the number of plant species is nonlinear, a
species–area curve was used to standardize this figure.
Energy
July 1992
CONS_87_89*
Commercial energy consumption for 1989, in megajoules
per constant. The constant is calculated using the gross
national product expressed in 1987 U.S. dollars. This
figure represents domestic production plus net imports, less
stock increases, less aircraft and marine bunkers, less
unallocated quantities.
ENRG_IMP89*
Energy imports expressed as a percentage of energy
consumption. This figure represents net imports, less stock
increases, less aircraft and marine bunkers, less unallocated
quantities. A negative value indicates that exports are greater
than imports.
P_TRFUEL89*
Traditional fuels as a percentage of total fuel requirements.
Traditional fuels include fuelwood, charcoal, bagasse (sugar
processing waste), animal wastes, and vegetal wastes.
5-33
Chapter 5—The ArcWorld 1:25M and Browse Map layers
Selected Statistical Attributes
Municipal waste attributes
MUNWASTE89*
Annual generation of municipal waste, in kilograms per
capita. This figure includes household and bulky waste, as
well as comparable wastes from small commercial or
industrial enterprises, and market and kitchen residuals that
are collected and treated by or for municipalities. These data
are available only for the twenty-four countries that belong to
the Organization for Economic Cooperation and
Development (OECD). The year of the estimate varies from
1980 to 1990.
Food supply
FOODFISH88*
Average annual food supply from fish and fishery products,
1986–1988, in kilograms per capita.
Atmospheric emissions
CO2_CAP89*
CO2DEFOR89*
METHANE89*
CFC89*
5-34
Industrial carbon dioxide emissions in metric tons per capita,
1989. This figure includes industrial carbon dioxide
additions from solid, liquid, and gas fuels, gas flaring, and
cement manufacture.
Carbon dioxide emissions due to changes in land use
(primarily deforestation), in thousands of metric tons, for
1989.
Methane emissions resulting from human activities, in
thousands of metric tons, for 1989. This figure includes
methane contributions from solid waste, coal mining, oil and
gas production, wet rice agriculture, and livestock
production.
Chlorofluorocarbon (CFC) emissions, in thousands of
metric tons, for 1989.
ArcWorld User's Guide and Data Reference
Chapter 5—The ArcWorld 1:25M and Browse Map layers
Selected Statistical Attributes
Line attributes
These line attributes are contained in the ArcWorld 1:25M
coverage, but not in the Browse Map coverage.
Classification attribute
TYPE
BND_TYPE
Each line is classified according to the type of feature it
represents. This attribute allows you to symbolize different
line features (political boundaries, coastlines, reefs, etc.)
differently. TYPE contains the code number, and
BND_TYPE contains the English description. The codes are
as follows:
Codes
1
2
4
9
=
=
=
=
Definitions
Coastline
International boundary
World region boundary
Grid line
International boundary status attribute
BND_STATUS
Each international boundary is classified according to
boundary status. This attribute allows you to display the
various types of boundaries using different colors or line
symbols. The codes are as follows:
Codes
1
2
3
4
5
6
9
=
=
=
=
=
=
=
Definitions
Demarcated or delimited
Indefinite or in dispute
Line of separation or sovereignty on land
Demilitarized zone in Israel
No defined line
Selected claim lines
Not an international boundary
Geographic reference attribute
COUNTRY1
COUNTRY2
CNTRY_NAME
REGION
CONTINENT
July 1992
These attributes contain the following: two-letter country
codes (two attributes), country names, regional codes, and
continent codes. Countries, regions, and continents and
their corresponding codes are listed in Appendix C; regions
are also shown on the map in Chapter 1.
5-35
Chapter 5—The ArcWorld 1:25M and Browse Map layers
Browse Map
statistical
attributes
Layer descriptions
The seven Browse Map statistical attribute layers contain the
attributes that are linked to the highly generalized Browse
Map representation of the countries of the world. The
statistical attributes match those included in the ArcWorld
1:3M statistical attribute layers from the World Bank and the
World Resources Institute.
Polygons and lines
for countries
Browse Map
Using the Browse Map statistical attribute
coverages
The attribute names used in this coverage are the same as
those in the 1:3,000,000-scale statistical coverages and the
1:25M Selected Statistical Attributes coverage.
These layers contain political boundaries and polygons to
provide the geographic extent for the statistical data.
Approximately 140 countries are represented in the Browse
Map coverages, which is a reduction of a few more than 100
countries from the number represented in the ArcWorld
1:3M and 1:25M coverages. The countries that were
eliminated from the Browse Map coverage were primarily
very small countries, particularly island nations, which
rarely have statistical data associated with them.
The country boundaries in this layer do not reflect recent
(1991) political changes in the former Soviet Union and
Germany in order that they match the World Bank and
World Resources Institute tabular data sets.
5-36
ArcWorld User's Guide and Data Reference
Chapter 5—The ArcWorld 1:25M and Browse Map layers
Browse Map statistical attributes
Summary of the Browse Map statistical attribute layers
Coverage names
and topics:
ECONIND
EDU_LIT
AGRICUL
HEALTH
LABOR
WRI_BR
POP_GEO
Economic and Industrial Indicators
Education and Literacy
Food Production and Nutrition
Health and Vital Statistics
Labor Force Characteristics
Natural Resources and the Environment
Population Characteristics
Source and currency: Cartography from a manually generalized and scanned version of the U.S.
Government, World Data Bank II, 1988. Attribute data from the World Bank,
Social Indicators of Development 1990 database (all of the above coverages
except WRI_BR), and the World Resources Institute, World Resources 1992–
1993 Data Base (WRI_BR only)
Feature
class
Feature
Number of features
Polygons
All polygon features
141 countries represented by ca. 235
polygons
Lines
All line features
Represented by ca. 536 lines
Number of
attributes
Varies with the
coverage
0
Occasionally a statistical data value for a particular
geographic area is not available in the database. Special
"flag" values indicate the absence of data values in the
statistical attributes. These special flag codes are as follows:
Codes
Definitions
–97 = Missing data or data not available
–98 = Country not included in the source tabular database
Countries that have multiple geographic parts, such as
offshore islands or overseas territorial possessions, are
represented in the database by multiple polygons that all have
the same country code. A flag attribute (STAT_FLAG) is
provided to identify the largest polygon in a country. These
flags allow the selection of a single data record per country,
which is necessary for generating correct summary statistics
from the database.
July 1992
5-37
Chapter 5—The ArcWorld 1:25M and Browse Map layers
Browse Map statistical attributes
Additional information about the way missing measurement
values are handled in the database is given on page 3-9;
information about how to use these codes in combination
with the statistical flag is given on page 6-4. Chapter 6 also
discusses the comparability and completeness of the
statistical data in these layers.
Polygon attributes
With the exceptions noted below, the Browse Map statistical
attribute coverages contain the same attributes as the
corresponding ArcWorld 1:3M country statistical attributes
coverages, as described in Chapter 4. Please refer to pages
4-43 through 4-104 for definitions of the polygon attributes.
The Browse Map coverages do not contain the following
attributes:
Geographic reference attributes
REGION
CONTINENT
Cartographic attributes
LAND_OCEAN
ISLAND_RANK
World organization membership attributes
EEC
FAO
GA
GA_MEMB_YR
IAEA
IBRD
5-38
IMF
OPEC
SC
UNESCO
WHO
WMO
ArcWorld User's Guide and Data Reference
Chapter 5—The ArcWorld 1:25M and Browse Map layers
Browse Map statistical attributes
Statistical flag attribute
STAT_FLAG
Flag used to identify a single polygon for each country for
the purpose of calculating summary statistics. The polygon
is selected on the basis of largest area. The codes in the
Browse Map coverages are as follows:
Codes
Definitions
0 = Other polygon
2 = Largest polygon per country
Line attributes
The Browse Map coverages do not contain any line attributes
other than the standard ARC/INFO-generated attributes.
Note on item definitions
Individual tables for the Browse Map statistical attribute
coverages have not been repeated in Appendix B because the
attributes have the same dBASE and INFO item definitions
as those in the ArcWorld 1:3M tables. However, the
beginning column numbers in the 1:3M tables do not
correspond to the Browse Map coverages since some of the
non-statistical attributes have been deleted from the Browse
Map coverages.
July 1992
5-39
Chapter 6
Using the database
This chapter contains information that will help you use the ArcWorld database
successfully. The information covers three general areas: (1) techniques for
selecting data in order to improve software performance, (2) information about
working with attributes in order to analyze data, and (3) suggestions for
creating attractive, functional graphic displays.
Optimizing performance
Use the Browse Map coverages or 1:25M data whenever possible
As noted in Chapter 2, drawing time can be decreased by using the Browse
Map coverages and 1:25,000,000-scale data whenever possible. For smallscale representations of the attribute information present in the 1:3,000,000scale data, the cartographic level of detail in the Browse Map coverages may be
sufficient.
Reduce the number of features
To improve performance when you use a large database like ArcWorld 1:3M,
reduce the amount of data you are dealing with as soon as possible. This will
improve performance for subsequent search operations (logical operations) as
well as reduce drawing times. Most of the layers in the database have been
coded by country, world region, and continent. Thus, if you know that your
need for cartographic or attribute information is limited to one country or
region, selecting first by the appropriate area of interest will speed up
subsequent operations. Any of the geographic reference attributes, such as
region and country names, can be used for this selection. The use of FIPS 10-3
country codes eliminates the need to spell out long names like "Dominican
July 1992
6-1
Chapter 6—Using the database
Republic." In ArcView, use the Definition tool in the Theme Property Sheet to
select the countries with which to work.
Reduce the number of attributes
You can also reduce the number of attributes you work with. If you are an
ARC/INFO user, you can use commands like DROPITEM or PULLITEMS to
eliminate unnecessary attributes. If you use ArcView for Windows, you can
use commercially available PC software like Q + E™, dBASE, or FoxPro™ for
this purpose.
Use simple selection statements
Break complex selection logic statements into simpler statements. For example,
to select all countries in the Western Africa region in which the percentage of
population between the ages of 0 and 14 is greater than 10%, in 1989 you could
use the following complex statement:
REGION = Western Africa and P_0_14 _89 > 10
However, the same selection logic can be expressed in the following two
statements:
REGION = Western Africa
P_0_14 _89 > 10
and these statements will search the database in less time than a single complex
statement.
For use with ARC/INFO, normalize the database
ARC/INFO users may want to create a series of smaller, more compact tables
for tabular information in order to take advantage of the relate capability in
ARC/INFO. The process of creating compact related tables is called
normalization; explanations can be found in standard database design textbooks.
The present design of the ArcWorld database allows the ArcView user to access
tables that are not normalized.
6-2
ArcWorld User's Guide and Data Reference
Chapter 6—Using the database
Working with attributes
Completeness of the attributes
An inherent problem with global databases is the lack of consistency and
completeness for all areas of the globe. Some countries of the world have been
extensively mapped and have long-standing and sophisticated statistical
collection systems; other countries have been incompletely mapped and have
few resources to devote to the collection of statistical data. An additional
problem is that extensive data collection is done only for the major countries of
the world. Small countries, island republics, and overseas territories are not
usually surveyed other than for demographic and vital statistics.
Also, the type and number of attributes collected have changed with time. The
most comprehensive and complete attributes are, again, demographic and vital
statistics data. Data on topics of current interest such as the amount of
municipal waste generated per capita have been collected only for industrialized
countries. It often takes many years before new kinds of statistics are collected
on a worldwide basis. The exact number of countries covered by a particular
statistical attribute varies; the ArcWorld database covers approximately 170 of
the 240 geopolitical entities in the World.
These completeness factors apply to three of the cartographic layers. The
Roads, Railroads, and Country Internal Divisions layers have, to varying
degrees, incomplete worldwide coverage. Usually data are missing for entire
countries, but roads data end within countries in two situations: (1) no data are
present south of approximately 20 degrees South latitude in South America and
(2) in Norway and Sweden there are no data north of approximately 59 degrees
North latitude. Lists of the major countries without roads, railroads, or country
internal divisions data are provided in Appendix D.
Comparability of the statistical attributes
The statistics presented here are compiled from the most authoritative sources
available, usually international speciality organizations and/or national
governments. Both the World Bank and the World Resources Institute review
their data for reliability, validity, appropriateness, and consistency.
Nevertheless, users of the ArcWorld data should constantly keep in mind that
the concepts, definitions, and methodology underlying these statistical attributes
vary, sometimes significantly. Variation can be both from one country to
another, and over time within a country. In some cases, data are extrapolated or
July 1992
6-3
Chapter 6—Using the database
estimated from current trends or statistical models. Statistical systems in many
developing countries are still weak, and this affects the availability and
reliability of the data. For the above reasons the ArcWorld attributes are useful
for identifying broad trends and differences.
Generation of statistics using STAT_FLAG
To generate summary statistics, it is necessary to use the STAT_FLAG attribute
in conjunction with the "missing data" code explained in Chapter 3. Selecting
values greater than -97 eliminates null values from factoring into the
classification of the data, and selecting STAT_FLAG = 2 specifies that only
polygons with statistical attributes will be drawn. For example, you could
examine worldwide CO2 emissions by defining the following expression:
CO2_CAP89 > -97 AND STAT_FLAG = 2
You could include countries with "X" codes as part of your thematic display by
defining the following expression:
CO2_CAP89 > -97 AND STAT_FLAG > 0
Although this second expression enhances the appearance of the display, it does
not yield correct summary statistics.
Annotation and text labels
There are two options for creating a thematic map with country names. The
recommended method is to use the annotation contained in any of the statistical
coverages. To display annotation, the statistical theme must be duplicated
within the ArcView Table of Contents and defined as an annotation theme. The
names of approximately 150 countries are annotated.
The second method is to specify the text labels option within the legend portion
of the statistical theme's property sheet. You have the flexibility to specify the
font, size, color, and placement of the text labels.
6-4
ArcWorld User's Guide and Data Reference
Chapter 6—Using the database
Data export
Attribute data from ArcWorld may be downloaded into other software programs
like spreadsheets or database management systems, where charts, graphs, and
other graphic displays can be generated. ArcView users can save a selected
tabular data set to a file by clicking on the "save the table as a file" icon at the
top of a Theme Table. A dialog box appears that you can use for navigating to a
directory into which you can write the file. By default, ArcView saves a tabseparated ASCII file. You can change this setting by choosing "Preferences" in
the File menu. See Chapter 3 in the ArcView User's Guide for more
information on saving tabular data.
A list of Windows software for use with ArcWorld appears in Table 1. This list
of software is included to illustrate the types of packages with which ArcView
for Windows can be used. It is not an endorsement of any particular software
product, nor is it inclusive; many other products will work as effectively.
These are some of the products that we have tried at ESRI and have found to be
effective for use with ArcWorld data.
July 1992
6-5
Chapter 6—Using the database
ArcWorld data can be imported into
other software applications like Excel for
further statistical analysis.
6-6
ArcWorld User's Guide and Data Reference
Chapter 6—Using the database
Table 1: Windows software
Software Program
Functions
dBASE
Used to manage and manipulate feature attribute and
related tables
Excel
Spreadsheet tools for manipulating selected attribute
records, business graphics, summaries, and other
spreadsheet functions
Q+E
Joins dBASE attribute tables
CorelDRAW
Graphics editor for Windows
Paintbrush
Graphics editor for Windows (and delivered as part of
Windows)
ObjectVision
Used to build front ends to dBASE files
Publisher
A word processing and publishing package that is
integrated with Windows
Units of measure
A number of different units of measure are used in ArcWorld attributes. Units
used for area, length, volume, and weight are listed in Table 2. Other units
used in the database include decimal degrees (used for all geographic coordinate
layers and in the latitude/longitude grids) and dollars (which may be expressed
in different denominations, like thousands of dollars). For the statistical
July 1992
6-7
Chapter 6—Using the database
attributes a value of "0" equals zero or less than half the unit of measure. The
ARC/INFO software-generated items AREA and LENGTH are expressed in
decimal degrees for ArcWorld 1:3M and one version of ArcWorld 1:25M. Use
of these two items for feature comparisons should be avoided because the
ground distance represented by a degree of longitude varies with latitude
(69.172 miles at the equator, 0 miles at the poles).
Table 2: Units of measure in the ArcWorld database
Units
Layers in which used
Common
equivalents
Area
Square kilometer
1:3M statistical layers
1:25M Selected Statistical Attributes layer
247.105 acres
0.386 sq. miles
Square meter
All 1:25M Robinson projection polygon
layers
10.76 square feet
1.196 sq. yards
Hectare
1:3M statistical layers
1:25M Selected Statistical Attributes layer
2.471 acres
Length
Meter
All 1:25M Robinson projection layers
3.281 feet
Weight
Metric ton
1:3M statistical layers
1:25M Selected Statistical Attributes layer
1,000 kilograms
2,204.6 pounds
Kilogram
1:3M statistical layers
1:25M Selected Statistical Attributes layer
2.204 pounds
Gram
1:3M statistical layers
1:25M Selected Statistical Attributes layer
1,000 milligrams
0.035 ounces, avdp.
Energy
6-8
Megajoule
1:3M statistical layers
1:25M Selected Statistical Attributes layer
1 million joules
947.8 British Thermal
Units (BTUs)
Petajoule
1:3M statistical layers
1:25M Selected Statistical Attributes layer
1 quadrillion joules
947.8 billion British
Thermal Units (BTUs)
Calorie
(food calorie)
1:3M statistical layers
1:25M Selected Statistical Attributes layer
3.97 British Thermal
Units (BTUs)
ArcWorld User's Guide and Data Reference
Chapter 6—Using the database
Drawing with ArcWorld
Graphic results of selection operations
The geographic features in most of the database layers are coded by country,
world region, and continent to facilitate selection operations. Sometimes this
type of coding can produce unexpected graphic results. For example,
unexpected results may appear because rivers often meander in and out of a
country, or international boundaries may meet in the middle of a lake. In these
situations, a selection of features by country name will display only portions of
the lake and those river segments that are within the country, and not those
slightly outside the country boundary. To make the water features look more
familiar, display the Country Boundaries layer along with the Rivers and Water
Bodies layer.
Feature drawing order
The order in which features are drawn on the screen affects the final display.
For example, if polygon features are shaded last, the shades will cover any
previously drawn shades, line work, and text. You will need to experiment
with the drawing order of the features you select in order to achieve the best
display. In general, the following drawing order (from bottom to top in the
ArcView Table of Contents) can help you achieve the desired display:
1.
2.
3.
4.
July 1992
Color-filled polygon shades
Pattern-filled polygons
Lines or polygon borders
Point features and text
6-9
Chapter 6—Using the database
Choroplethic mapping
Choroplethic mapping is the use of area shades or patterns to show the areal
distribution of statistical information. Many of the statistical attribute data are
ideally represented by this type of mapping.
However, to develop meaningful comparisons, you will often need to
standardize the data by area or population. For example, in the World
Resources Institute 1990 database, the 1985 population figures for Belgium and
Zimbabwe are 9,850,000 and 9,710,000, respectively. If the area of the
countries is not taken into account, a choropleth map of the world would show
the populations as approximately equal. But Belgium has less than 8 percent
the area of Zimbabwe, so the population density is 3,255 people per 1,000
hectares, as compared with 251 people per 1,000 hectares for Zimbabwe; these
population situations are very different.
In this instance, the population density for both countries is listed in an attribute
named POPDNSTY85 in the Population Characteristics layer. For other
population variables, however, such as the total number of people in the year
2000 (POP2000), the data are absolute numbers and have not been standardized
by area.
To simplify a display, use the same patterns for the same ranges in all areas. If
the value of each country's density were given a unique value, the resulting map
would show a different shade for each country, which would be difficult to
interpret. Instead, divide the data into a few classes, which are easier to
understand when they are mapped. Cartographers generally recommend using
from four to ten different classes; some cartographers recommend using an odd
number of classes so that there is one class that can be further categorized as
high, medium, and low.
You can form classes by using the "class values" option in the ArcView legend
window, or by using the ARCPLOT CLASS command in ARC/INFO.
6-10
ArcWorld User's Guide and Data Reference
Chapter 6—Using the database
Bivariate mapping
A variation of choroplethic mapping, which was referred to in Chapter 2 as
"bivariate mapping," is the method of simultaneously displaying two variables
using different symbols over the same geographic area. In ArcView, bivariate
mapping can be accomplished by displaying one variable in a color and the
other variable in a pattern. This technique is commonly used to investigate
possible relationships between two different attributes. For example, we may
wish to explore the idea that a country's carbon dioxide emissions from land
use may be related to the country's net deforestation rate. In statistical terms,
the variable being explained, carbon dioxide emissions, is called the
"dependent" variable, and the other is called the "independent" variable.
Because ArcView makes it so easy to generate color ramps (colors of gradually
changing hue or of gradually increasing intensity, which can be made to
correspond to gradual increases in a variable), it is recommended that you use
colors to display the independent variables and a pattern to display the
dependent variable; using color and pattern in this way makes it easy to create a
series of bivariate maps.
July 1992
6-11
Appendix A
Data quality information
This appendix provides data quality information for the ArcWorld database.
The information is presented in the format recommended by the Digital
Cartographic Data Standards Task Force as part of the development of the
Spatial Data Transfer Standard (SDTS). It includes information about the
source data, positional and attribute accuracy, and logical consistency of both
the 1:3 million and 1:25 million coverages.
July 1992
A-1
Appendix A—Data quality information
ArcWorld 1:3M data
During the development of the ArcWorld database, several modifications were
made to the source data in order to generate a database in which the following
was true:
•
•
•
•
•
All data were at a common scale.
The level of resolution was uniform.
The coding scheme was consistent.
Measurements were comparable (standardized).
Thematic groupings were consistent.
The production of the ArcWorld database involved
•
Joining multiple coverages into sections that together provided complete
global coverage
•
Modifying source cartographic information and attribution schemes
•
Associating tabular data with a cartographic base
•
Mathematically generating a variety of index grids
•
Manually digitizing source materials
In addition, a second, smaller-scale (1:25,000,000) data set was produced from
the larger 1:3,000,000 data set.
A-2
ArcWorld User's Guide and Data Reference
Appendix A—Data quality information
Summary of ArcWorld 1:3M characteristics
The ArcWorld data at 1:3,000,000 scale consist of the following layers:
•
•
•
•
•
•
•
•
•
•
•
•
•
•
•
•
Country Boundaries
Country Internal Divisions
Major Cities
Railroads
Rivers and Water Bodies
Roads
Landsat Nominal Scene Index
Latitude/Longitude Grids
Operational Navigational Chart (ONC) Series Index
Economic and Industrial Indicators
Education and Literacy
Food Production and Nutrition
Health and Vital Statistics
Labor Force Characteristics
Natural Resources and the Environment
Population Characteristics
The ArcWorld 1:3M coverages have the following characteristics:
Characteristic
Format
ARC/INFO coverages
Input scale
1:3,000,000 (nominal)
Resolution:
Lines
0.002 deg
Polygons
July 1992
ArcWorld coverage characteristics
No global minimum feature criteria applied
Resolution of statistical data
To country level
Generalization tolerance
0.0005 deg
Feature classes
Polygon, line, point
Feature attribute tables
Polygon, arc, point
Database normalization status
Unnormalized (repeating records exist)
Number of layers:
Cartographic
6 (10 coverages)
Index
3 (6 coverages)
Statistical attribute
7 (7 coverages)
A-3
Appendix A—Data quality information
Characteristic
Attribute types
Naming conventions:
Coverages
ArcWorld coverage characteristics
Measurement (interval or ordinal values)
Suppressed values: -97 (missing data), -98
(country not in tabular database), -99 (ocean
areas)
Code (numeric or alphabetic codes)
Suppressed numeric values: -97 (missing data),
-98 (country not in tabular database), -99 (ocean
areas). Not applicable values (alphabetic): blanks
Name (alphabetic or alphanumeric names)
Missing values: blanks
8 alphanumeric characters (only "A–Z", "1–9", or
"_" allowed)
Tables
8 primary and 3 extension alphanumeric
characters (xxxxxxxx.PAT or .AAT with "A–Z",
"1–9", or "_" allowed)
Attributes
10 alphanumeric characters (only "A–Z", "1–9", or
"_" allowed)
Indexing
Tabular (all attributes sorted by value in index field)
Spatial (all coverages spatially subdivided into
quadrangles by feature density)
Projection system
Geographic coordinates
Units of measure
Decimal degrees
Horizontal datum
N/A
Vertical datum
N/A
Coordinate precision
Single (coordinates rounded to the nearest
1/10,000 of a degree)
Lineage
There are four main sources for the ArcWorld 1:3M data:
•
•
•
A-4
Data derived from 1:3,000,000-scale U.S. State Department World Data
Bank II
Mathematically generated indexes
Data developed by ESRI from a variety of hard copy sources
ArcWorld User's Guide and Data Reference
Appendix A—Data quality information
•
Data derived from tabular files published by the World Bank and the World
Resources Institute
Each of these is discussed in greater detail below.
Data derived from World Data Bank II
Basic production process
The primary source of cartographic information for the ArcWorld 1:3M
coverages was the 1973 World Data Bank II (WDBII) database, which was
produced by the U.S. State Department. A variety of ArcWorld coverages
incorporate cartographic primitives and/or attribute data from WDBII, including
the following:
Layer
Coverage name
Country Boundaries
Country Internal Divisions
Railroads
Rivers and Water Bodies
Roads
Economic and Industrial Indicators
Education and Literacy
Food Production and Nutrition
Health and Vital Statistics
Labor Force Characteristics
Natural Resources/Environment
Population Characteristics
CTRY3M
ADMIN3M
RR3M
RIV3M, RIV3M_E, RIV3M_W
RDS3M, RDS3M_E, RDS3M_W
ECONIND
EDU_LIT
AGRICUL
HEALTH
LABOR
WRI_3M
POP_GEO
There is little formal documentation on the lineage of WDBII, although it is
known that the WDBII database was automated from maps with source scales
ranging from 1:1,000,000 to 1:4,000,000. The exact areas for which the
various sources were used is not known, although it is believed that the
1:4,000,000 maps were used primarily for Antarctica and northeastern Russia.
In general, the data show significant inconsistencies in representation rules for
road, rail, and hydrographic features, owing primarily to differences in the
applications for which the data were acquired. These data were subjected to
significant restructuring in that features were transferred from their original
thematic groups into others for the ArcWorld design.
ESRI received the data as ASCII flat files of coordinates and related tables. The
data were converted to ARC/INFO format by using a routine developed by
July 1992
A-5
Appendix A—Data quality information
ESRI. Significant revisions were made to the original WDBII source data,
mainly for purposes of topology correction, spurious polygon removal, and
coordinate density reduction (for line primitives). In the original data, many
lines did not intersect where intended and there were many spurious polygons
(artifacts from stream digitizing) and excess vertices (multiple vertices at
identical locations). The original data also lacked polygon topology. ESRI
built polygon topology where necessary to conform to the ArcWorld database
design, and in many cases transferred line attributes to polygon features.
Various levels of processing were applied to the original data. Within the
ArcWorld database, the Roads, Railroads, and Country Internal Divisions data
have been subjected only to the basic processes outlined above.
The data for the Country Boundaries layer (including line and polygon feature
types) were extensively processed to make the layer current to January 1, 1992.
All of the original polygon country name values were eliminated and recoded.
The spelling of country names follows the directives of the Board of
Geographic Names (as of January 31, 1992). All features have country codes
derived from FIPS publication 10-3. The specific date of the standard used in
original WDBII coding is unknown.
All political boundaries were edited to reflect national boundaries as of
January 1, 1992, including the reunification of Germany, the unification of the
Yemens, and the dissolution of the Union of Soviet Socialist Republics. New
countries were assigned FIPS codes based on direction from the U.S. State
Department via the Defense Mapping Agency (DMA). Polygon attribute codes
for membership in various international organizations (United Nations, NATO,
etc.) are based on the U.S. State Department's World Fact Book 1989.
Country names were assigned to islands and other ill-defined features by using
the following general hierarchy of sources: DMA/State Department directives
for the Digital Chart of the World (DCW), the DCW itself, Defense Intelligence
Agency Manual (DIAM) 65-18 (1984), the National Geographic Atlas of the
World—Sixth Edition (1990), Rand McNally's The New International Atlas
(1987), and The Times Atlas of the World—Eighth Comprehensive Edition
(1990). The coding of world regions was based on the United Nations'
Standard Country or Area Codes for Statistical Use (1982). Webster's New
Geographical Dictionary (1988) was consulted to resolve ambiguous issues.
Countries were coded as belonging entirely to single regions, with the exception
of Russia, which was divided into European and Asiatic sections by using
internal division boundaries corresponding roughly to the continental boundary
described in Webster's New Geographical Dictionary.
A-6
ArcWorld User's Guide and Data Reference
Appendix A—Data quality information
The Rivers and Water Bodies coverage was extensively processed to build
topology from the original line data. The polygons were coded using a voting
procedure to identify the most commonly occurring attributes on the lines
comprising a polygon feature, and assigning the polygon feature the most
common attribute. Afterward, the data were plotted at 1:3,000,000 scale and
reviewed for gross errors in attribute coding assignment. All river and water
body features were assigned attribute codes that identified the countries they
occurred in by performing a large overlay (using the ARC IDENTITY
command) of the data with country polygons. Country attributes were assigned
to support cartographic display applications. However, rivers or water bodies
can be displayed separately from country boundaries where the two coincide.
Data quality review
No independent evaluation of the attribute or positional accuracy of the source
data was undertaken, except that international boundaries, country names, and
associated attribute codes were exhaustively reviewed for correctness and
completeness. However, a series of coverage-based (global) diagnostic tests
were run on each ArcWorld coverage to ensure data quality and integrity. Code
attributes were reviewed by checking for invalid codes in the database using the
ARC/INFO CODEFIND command. Consistency of attribute combination was
verified using the ARC CONSIST command. Interlayer consistency was
verified by creating composite plots of the various data layers. Automated tests
for correct linkages between attribute tables and primitives and for valid feature
types were also performed.
Mathematically generated indexes
The following five coverages were mathematically generated:
Layer
Coverage name
Landsat Nominal Scene Index
Latitude/Longitude Grid
SAT_PT, SAT_BND
LTLG5, LTLG10, LTLG20
The theoretical locations of latitude/longitude grids at 5-, 10-, and 20-degree
intervals were mathematically generated using the ARC/INFO GENERATE
command with the GRID option. The grids were densified at an interval of one
degree to support projection processing.
July 1992
A-7
Appendix A—Data quality information
The Landsat Nominal Scene Index was generated mathematically by using the
nominal scene center points and an algorithm provided by EOSAT. The
nominal scene index generated by the algorithm was plotted in its entirety to
verify overall completeness and correctness in all areas.
Data quality review
To ensure data quality, all mathematically generated data were plotted at a scale
of approximately 1:30,000,000 and reviewed for anomalies.
Data derived from hard copy sources
The following two coverages were manually digitized from hard copy sources:
Layer
Coverage name
ONC Index
Major Cities
ONC_IDX
CITY3M
The Operational Navigational Chart (ONC) Index was manually digitized by
ESRI from the Standard Index Chart listed in Appendix E. The source map
was digitized manually in ARC/INFO. The data were then plotted out at scale,
and the coding was evaluated for completeness and correctness by being
compared to the ONC sheet identification number. The boundaries in the index
are not authoritative; in the true boundaries there is significant overlap between
sheets, whereas the boundaries in the database are discrete.
The Major Cities layer was manually digitized by ESRI from the 1,000,000scale ONCs. The city locations that resulted were compared with the smallerscale ArcWorld Country Boundaries layer. A few cities fell outside the
coastline because of differences in the input scale of the two data sources. The
locations of the cities that fell outside the coastline were adjusted to match the
1:3,000,000-scale version of the coastline.
The English and native spellings of city names are based on the conventions of
the Board of Geographic Names as of January 31, 1992. The data were then
plotted out at scale to verify completeness, and adherence to the source
manuscript with regard to position and city name.
A-8
ArcWorld User's Guide and Data Reference
Appendix A—Data quality information
Data derived from tabular files
The following seven coverages contain attributes derived from statistical tabular
data files:
Layer
Coverage name
Economic and Industrial Indicators
Education and Literacy
Food Production and Nutrition
Health and Vital Statistics
Labor Force Characteristics
Natural Resources and the Environment
Population Characteristics
ECONIND
EDU_LIT
AGRICUL
HEALTH
LABOR
WRI_3M
POP_GEO
All the layers above are hybrid data sets that include cartographic data from the
ArcWorld Country Boundaries layer and published tabular data sets. The
attributes in all the layers listed above except the Natural Resources and the
Environment layer are based on the World Bank Standard Indicators of
Development (1990–91) data set. The Natural Resources and the Environment
layer was derived from attribute data from the World Resources 1992–93
database (World Resources Institute [WRI]).
The World Bank data were available as ASCII tabular files. These files were
loaded into INFO (after the appropriate templates were created), and joined to
their respective polygon attribute tables. The WRI data were subjected to a
similar process, except that the data were originally received in a dBASE III
format; these data were used to generate tabular ASCII files, which were loaded
in turn into INFO. It should be noted that the cartographic component of the
layers containing the database is not as current as that for the Country
Boundaries layer: The available attribute data did not reflect the reunification of
Germany or the dissolution of the Soviet Union (although Yemen was
represented as unified). The cartographic data reflect the political boundaries to
which the data were tabulated.
July 1992
A-9
Appendix A—Data quality information
Positional accuracy
No detailed evaluation of the positional accuracy of the ArcWorld 1:3M data has
been made; knowledge of the source (WDBII) data is insufficient to determine
the positional accuracy of data derived from the source. The latitude/longitude
and Landsat grids were mathematically generated and are stored in singleprecision coverages. The ESRI-digitized data (the ONC index and major city
locations) are intended for cartographic display only, since no rigorous attempt
has been made to control their positional accuracy.
Attribute accuracy
The accuracy of most attributes in the ArcWorld 1:3M layers has not been
explicitly tested against independent sources. However, all the data have been
reviewed for anomalous visual patterns both on-line and in hard copy. Data
derived from the World Bank and WRI tabular files were tested for proper
relationships with country codes during the processing procedure that linked the
tabular data with cartographic coverage components. All attributes were tested
by using the automated techniques described in the Lineage section of this
appendix. All ESRI-added data (e.g., membership in world organizations,
world region codes) were reviewed and verified against source maps.
Logical consistency
All data were found to be topologically correct using ARC/INFO Rev. 6.0.1.
No duplicate features are present. All polygons are closed, and all lines
intersect where intended. No undershoots or overshoots are present.
A-10
ArcWorld User's Guide and Data Reference
Appendix A—Data quality information
Completeness
The ArcWorld data were closely reviewed to ensure the completeness of
shorelines and of country boundaries. The completeness of the Rivers and
Water Bodies coverage reflects that of the source materials and is considered to
be fairly consistent. The completeness of the Country Internal Divisions and
Roads layers also reflects the completeness of the source materials and is
considered to be less consistent. The statistical data are incomplete in that
selected records in the database may not contain data for some attributes.
July 1992
A-11
Appendix A—Data quality information
ArcWorld 1:25M and Browse Map data
Summary of ArcWorld 1:25M characteristics
The ArcWorld data at 1:25,000,000 scale consist of the following layers:
•
•
•
•
•
•
Country Boundaries
Latitude/Longitude Grid
Major Cities
Map Elements
Rivers and Water Bodies
Selected Statistical Attributes
The ArcWorld 1:25M coverages have the following characteristics:
Characteristic
Format
ARC/INFO coverages
Input scale
1:25,000,000
Resolution:
Lines
N/A
Polygons
A-12
ArcWorld coverage characteristics
0.01 sq deg (approximately 124 sq km at the
equator)
Resolution of statistical data
To country level
Generalization tolerance
0.001 deg (approximately 110 m at the equator)
Feature classes
Polygon, line, point
Feature attribute tables
Polygon, line, point
Database normalization status
Unnormalized (repeating records exist)
Number of layers:
Cartographic
4 (4 coverages)
Index
1 (1 coverage)
Statistical attribute
1 (1 coverage)
ArcWorld User's Guide and Data Reference
Appendix A—Data quality information
Characteristic
Attribute types
Naming conventions:
Coverages
ArcWorld coverage characteristics
Measurement (interval or ordinal values)
Suppressed values: -97 (missing data), -98
(country not in database), -99 (ocean areas)
Code (numeric or alphabetic codes)
Suppressed numeric values: -97 (missing data),
-98 (country not in database), -99 (ocean areas).
Not applicable values (alphabetic): blanks
Name (alphabetic or alphanumeric names)
Missing values: blanks
8 alphanumeric characters (only "A–Z", "1–9" or
"_" allowed)
Tables
8 primary and 3 extension alphanumeric
characters (xxxxxxxx.PAT or .AAT with "A–Z",
"1–9" or "_" allowed)
Attributes
10 alphanumeric characters (only "A–Z", "1–9" or
"_" allowed)
Indexing
Tabular (all attributes sorted by value in index field)
Spatial (all coverages spatially subdivided into
quadrangles by feature density)
July 1992
Projection system
Robinson
Longitude of central meridian: 0˚ 00' 00''
False easting: 0 m
False northing: 0 m
Geographic coordinates (decimal degrees)
Units of measure
Meters
Decimal degrees
Horizontal datum
N/A
Vertical datum
N/A
Coordinate precision
Single (coordinates rounded to the nearest
1/10,000 of a degree)
A-13
Appendix A—Data quality information
Summary of ArcWorld Browse Map coverage
characteristics
The ArcWorld Browse Map consists of the following coverages:
•
•
•
•
•
•
•
•
•
•
Major Cities
Latitude Longitude Grid
Economic and Industrial Indicators
Education and Literacy
Food Production and Nutrition
Health and Vital Statistics
Labor Force Characteristics
Natural Resources and the Environment
Population Characteristics
Selected Statistical Attributes
The ArcWorld Browse Map coverages have the following characteristics:
Characteristic
Format
ARC/INFO coverages
Input scale
1:40,000,000
Resolution:
Lines
N/A
Polygons
A-14
ArcWorld coverage characteristics
N/A
Resolution of statistical data
To country level
Generalization tolerance
N/A
Feature classes
Polygon, line, point
Feature attribute tables
Polygon, line, point
Database normalization status
Unnormalized (repeating records exist)
Number of layers:
Cartographic
1 (1 coverage)
Index
1 (1 coverage)
Statistical attribute
1 (8 coverages)
ArcWorld User's Guide and Data Reference
Appendix A—Data quality information
Characteristic
Attribute types
Naming conventions:
Coverages
ArcWorld coverage characteristics
Measurement (interval or ordinal values)
Suppressed values: -97 (missing data), -98
(country not in database), -99 (ocean areas)
Code (numeric or alphabetic codes)
Suppressed numeric values: -97 (missing data),
-98 (country not in database), -99 (ocean areas).
Not applicable values (alphabetic): blanks
Name (alphabetic or alphanumeric names)
Missing values: blanks
8 alphanumeric characters (only "A–Z", "1–9" or
"_" allowed)
Tables
8 primary and 3 extension alphanumeric
characters (xxxxxxxx.PAT or .AAT with "A–Z",
"1–9" or "_" allowed)
Attributes
10 alphanumeric characters (only "A–Z", "1–9" or
"_" allowed)
Indexing
Tabular (all attributes sorted by value in index field)
Spatial (all coverages spatially subdivided into
quadrangles by feature density)
July 1992
Projection system
Robinson
Longitude of central meridian: 0˚ 00' 00''
False easting: 0 m
False northing: 0 m
Units of measure
Meters
Horizontal datum
N/A
Vertical datum
N/A
Coordinate precision
Single (coordinates rounded to the nearest
1/10,000 of a degree)
A-15
Appendix A—Data quality information
Lineage
ArcWorld 1:25M and Browse Map data are derived from the following sources:
•
•
•
•
Data derived from ArcWorld 1:3M data (principally data derived from
1:3,000,000-scale U.S. State Department's World Data Bank II)
A mathematically generated latitude/longitude grid
Data derived from 1:25M ArcWorld coverages (data in the ArcWorld
Browse Major Cities coverage)
Data derived from tabular files published by the World Bank (Social
Indicators of Development 1990 database) and World Resources Institute
(World Resources 1992–1993 Data Base).
Each of these is described in greater detail below.
Data derived from 1:3M ArcWorld data
The ArcWorld 1:25M cartographic layers are generalized versions of 1:3 million
cartographic layers. These layers include the following:
Layer
Coverage
Country Boundaries
Major Cities
Map Elements
Rivers and Water Bodies
CTRY25M
CITY25M
SC_25M
RIV25M
The properties of the source data for the ArcWorld database are described in the
section for the 1:3 million layers. In order to generate the 1:25 million
coverages, features with specific attribute values were extracted from the
1:3 million coverages and placed in the 1:25 million coverages. They were
then selectively edited and generalized to reduce coordinate density and produce
a visually pleasing product with a data density and data content similar to other
products of the same scale. In addition, some attributes in the 1:3 million
Country Boundaries and Rivers and Water Bodies coverages were dropped
from the 1:25 million coverages. The Map Elements coverage contains a title
and scale bar and was created exclusively for use with the ArcWorld 1:25M data
in the Robinson projection.
A-16
ArcWorld User's Guide and Data Reference
Appendix A—Data quality information
The Browse Map coverages were generated by selectively editing the
1:3 million WDBII data and ArcWorld 1:25M data in order to reduce feature
density and produce a visually pleasing display for rapidly viewing thematic
data at a scale of 1:40 million. In addition, some attributes in the 1:3M
statistical attributes coverages were dropped for the Browse Map coverages.
In order to produce the cartographic data for the Browse Map statistical
attributes coverages, the original WDBII country boundaries were plotted at a
scale of approximately 1:40M and the map was then redrafted by a professional
cartographer. This generalized, drafted version was scanned and vectorized to
produce a polygon coverage of all countries. The coverage was then selectively
edited to permit linking of the cartographic features with statistical attributes.
The international boundaries of the former Soviet Union and former East and
West Germany were retained in order to match the tabular data. In addition,
small islands were deleted from the data. Because this included deletion of
small island nations, the Browse Map coverages contain fewer countries than
those in the ArcWorld 1:25M and 1:3M data.
Country Boundaries layer
Topological edits. All topological edits for the 1:25M Country Boundaries
coverage occurred in decimal degrees. Initially, the 1:3 million Country
Boundaries coverage was selectively edited to remove all islands with an area of
less than 0.01 square degree (approximately 124 square kilometers at the
equator). However, all political entities present in the 1:3 million database were
retained to ensure that the number of countries would be the same in both the
1:3 million and 1:25 million ArcWorld Country Boundaries coverages.
Therefore, at least one polygon was retained for every island nation, even if it
were below the minimum feature size. Islands below the minimum feature size
that were known to have value for visual reference were also retained. No
polygons were removed from continents on the basis of minimum feature size.
After these edits, the coverage was generalized using the ARC GENERALIZE
command with a tolerance value of 0.001 degree. At the equator, this tolerance
translates into approximately 110 meters at ground scale; the tolerance gradually
decreases away from the equator. Therefore, generalization (and coordinate
reduction) in northern and southern latitudes is less than in areas near the
equator. A tolerance of 0.001 degree was found to be sufficiently high to
reduce coordinate density at all latitudes without introducing undue error in
equatorial regions, where the effects of the generalization were most severe.
July 1992
A-17
Appendix A—Data quality information
(Once fully edited as described below, the decimal degree version of the
coverages was converted to the Robinson projection.)
Attribution. All attributes from the 1:3 million Country Boundaries coverage
were retained, except that the BND_COINC code was dropped from the 1:25
million coverage.
Data quality review. The generalized coverage was plotted at a scale of
1:25,000,000 and reviewed visually for anomalies in topology and attribution.
In addition, automated diagnostic checks were run on the data to ensure that
correct topology was maintained after the generalization process.
Rivers and Water Bodies layer
Topological edits. All topological edits for the 1:25 million Rivers and Water
Bodies coverage occurred in decimal degrees. Features were selectively
extracted from the 1:3 million Rivers and Water Bodies coverage and placed in
the 1:25 million Rivers and Water Bodies coverage. They were then edited to
ensure that major world river systems were represented appropriately at a scale
of 1:25,000,000. The coverage was then generalized to reduce coordinate
volume.
As an initial processing step, the centerlines for all rivers represented with both
shorelines in the 1:3 million coverage were copied into the 1:25 million Rivers
and Water Bodies coverage. A number of large rivers represented as only a
single line in the 1:3 million coverage were identified by using the Atlas of
World Physical Features (Snead, 1972). These rivers were extracted from the
1:3 million coverage and added to the 1:25 million coverage.
Once all desired rivers and river systems were present in the 1:25 million
coverage, they were edited to a level of detail more appropriate for the small
scale of the coverage. Most major river systems with multiple tributaries in the
1:3 million coverage were edited so as to retain only the longest or most
characteristic branch, except in cases where the tributaries were necessary to
retain the characteristics of the drainage system in an area. For some river
systems, such as the Amazon, the largest tributaries were retained because they
were larger than some major rivers in other continents.
Only the largest water bodies were included in the 1:25 million coverage. These
were initially identified from the Information Please Almanac 1990 ("The
World's Largest Lakes"). They were then extracted from the 1:3M coverage
A-18
ArcWorld User's Guide and Data Reference
Appendix A—Data quality information
and copied into the 1:25 million Rivers and Water Bodies coverage. Only water
bodies classified as perennial or intermittent were included. To reduce data
volume, lakes represented as lake systems were selectively edited to retain a
characteristic lake outline at a scale of 1:25,000,000 as determined from other
small-scale sources. The only islands retained were those necessary for visual
reference. River outlets for major lakes were generally added to the database,
unless this resulted in the addition of long river features that would otherwise
not have been part of the 1:25 million coverage. Source rivers for intermittent
lakes were not retained for the 1:25 million coverage, unless they were major
rivers in their own right.
Following all selective edits, the coverage was generalized using the ARC
GENERALIZE command with a tolerance value of 0.001 degree
(approximately 110 meters at the equator). As for the Country Boundaries
coverage, this value was chosen because it reduced coordinate density for the
entire coverage regardless of latitude, but still resulted in a visually pleasing
product at the equator, where the effects of the generalization were most severe.
Attribution. The Rivers and Water Bodies coverage is simplified considerably
by comparison with the 1:3 million coverage. Therefore, the codes ranking
these features according to importance (i.e., WATER_RANK and
RIVER_RANK) were dropped from the 1:25 million coverage. The
RIV_COINC attribute, which indicates coincidence between rivers and
international boundaries, was also dropped for the 1:25 million coverage.
Data quality review. The generalized coverage was plotted at a scale of
1:25,000,000 and reviewed visually for anomalies in topology and attribution.
The coverage was also compared to other basemaps of similar scale to ensure
that data density and content were appropriate for the coverage considering its
scale. In addition, automated diagnostic checks were run on the data to ensure
that topology remained correct after the generalization process.
Major Cities layer, ArcWorld 1:25M coverage
Topological edits. The 1:25 million Major Cities coverage contains a subset of
the names in the 1:3 million coverage, which includes all national capitals and
cities with a population of more than three million.
Attribution. All attributes from the 1:3 million coverage were retained.
July 1992
A-19
Appendix A—Data quality information
Data quality review. The city names were plotted at 1:25,000,000 and reviewed
for spelling. Spelling conventions are based on the directives of the Board of
Geographic Names.
Major Cities layer, Browse Map coverage
Topological edits. The Major Cities Browse Map coverage contains a subset of
the national capitals in the 1:25M coverage.
Attribution. All attributes from the 1:25 million coverage were retained.
Data quality review. All city names were plotted in conjunction with the
Browse Map cartographic data to ensure that only those capitals remained in the
coverage for which country polygons existed in the Browse Map coverages.
Mathematically generated coverages
Latitude/Longitude Grid layer
The 1:25 million coverages and the Browse coverages include one of the
following mathematically generated coverages:
Layer
Coverage
Latitude/Longitude Grid (1:25M)
LTLG20
Latitude/Longitude Grid (Browse Map) LTLG_BR
For both the 1:25M and Browse Map coverages, a 20-degree-interval
latitude/longitude grid was mathematically generated using the ARC/INFO
GENERATE command. The grid was densified by adding vertices at onedegree intervals to permit projection processing. The Browse version of the
latitude/longitude grid was edited to be consistent with the geographic content of
the statistical attribute coverages.
Data quality review. The grid was plotted at a scale of 1:25,000,000 and
reviewed visually for anomalies.
A-20
ArcWorld User's Guide and Data Reference
Appendix A—Data quality information
Data derived from tabular files
Statistical attribute layers
The 1:25M coverages include one coverage that was derived from tabular files,
as follows:
Layer
Coverage
Selected Statistical Attributes
STAT25M
The Browse Map coverages include eight coverages that were derived from
tabular files, as follows:
Layer
Coverage
Economic and Industrial Indicators
ECONIND
Education and Literacy
EDU_LIT
Food Production and Nutrition
AGRICUL
Health and Vital Statistics
HEALTH
Labor Force Characteristics
LABOR
Natural Resources and Environment
WRI_BR
Population Characteristics
POP_GEO
Selected Statistical Attributes
STAT_BR
The ArcWorld 1:25M and Browse Map statistical attributes include data from
two tabular sources: the World Bank's Social Indicators of Development 1990
(SID) database (current through 1990) and the World Resources Institute 1992–
1993 database (current to 1992). Both data sets were available as ASCII files.
The SID data were initially extracted from the World Bank STARS database.
INFO templates were prepared to store a total of thirty attributes from the SID
database, including the three-letter World Bank country codes (WB_CNTRY)
and forty attributes from the WRI database. Attributes were selected on the
basis of importance and completeness. In general, only attributes for which at
least 80 percent of the countries had values were included in the database.
Some attributes for which fewer than 80 percent of the countries had values
were included if the attribute was considered to be of major interest.
The data from the SID and WRI ASCII files were copied into the INFO
templates. Once in INFO format, the attributes were linked to the Country
Boundaries coverage by using the ARC/INFO command JOINITEM using
WB_CNTRY as the relate item. Both the FIPS country codes (COUNTRY)
and World Bank country codes (WB_CNTRY) in the Country Boundaries
July 1992
A-21
Appendix A—Data quality information
coverage associated with the statistical attribute layer reflect the currency of the
statistical data (1990). Therefore, in the Statistical Attributes layer, East and
West Germany and North and South Yemen are coded as separate entities, and
the Soviet Union is coded as a single entity.
Data quality review. No exhaustive review of the SID or WRI data was
undertaken. However, a sample of the ASCII files was printed and reviewed
against printed or on-line source data. Two countries from each continent
(representing a sample of approximately 8 percent) were checked for correct
correspondence between the INFO files and the original source files.
Positional accuracy
No detailed evaluation of the positional accuracy of the ArcWorld 1:25M or
Browse Map data has been undertaken. Knowledge of the source data is
insufficient to determine the positional accuracy of the source product or of the
1:25M and Browse coverage data. The 20-degree-interval latitude/longitude
grid was mathematically generated and is stored as a single precision coverage.
Attribute accuracy
The accuracy of most attributes in the ArcWorld 1:25M and Browse Map
coverages has not been explicitly tested against independent sources. However,
all of the data have been reviewed for anomalous visual patterns both on line
and in hard copy. Data derived from World Bank and WRI tabular files were
tested for proper relationships with country codes during the processing
procedure that linked the tabular data with cartographic coverage components.
All attributes were tested using the automated techniques described in the
Lineage section of this appendix.
Logical consistency
All data were found to be topologically correct using ARC/INFO Rev. 6.0.1.
No duplicate features are present. All polygons are closed, and all lines
intersect where intended. No undershoots or overshoots are present.
A-22
ArcWorld User's Guide and Data Reference
Appendix A—Data quality information
Completeness
The ArcWorld 1:25M data, although generalized in terms of number of features
and coordinate density, does retain the completeness of shorelines and of
country boundaries that characterize the ArcWorld 1:3M layers. In order to
create a smaller and visually pleasing product, only selected major features were
included in the 1:25M Rivers and Water Bodies and Major Cities layers. For
the same reasons, only a subset of features were retained for the Browse Map
Major Cities coverage and the cartographic data of the Browse Map statistical
attributes coverages. The statistical attributes contained in the ArcWorld
database represent a subset of the tabular source data. In addition, there are
some missing data for particular countries (for one or more attributes) within the
ArcWorld statistical attributes.
July 1992
A-23
Appendix B
ArcWorld item definitions
The tables in this appendix present the definition of each item in the ArcWorld database.
The sample feature attribute tables immediately below illustrate the way in which the
item definitions are presented. The columns in all tables are the same, but the
ARC/INFO-generated items for point and polygon features differ somewhat from the
ARC/INFO-generated items for line features. The notes below the sample tables
provide information about these and other table characteristics.
Item definitions are presented for each set of ArcWorld coverages. The coverages
appear in the same order as in Chapters 4 and 5: first the 1:3M cartographic, index, and
statistical attribute layers, and then the 1:25M layers. In order to reduce repetition, the
ARC/INFO-generated items are omitted from the feature attribute tables in this
appendix.
Polygon (or point) feature tables
Coverage Names:1
Layer Type:2
TEMPLATE_PY
Polygon (or Point)
Polygon (or Point) Attribute Table
dBASE Columns
Item Description 3,4
Area
Perimeter
Arc Internal Number
User Assignable ID
July 1992
Item Name 5
AREA
PERIMETER
(coverage name)#
(coverage name)-ID
Begin
Column
Column 6 Definition 7
1
14
27
38
13,N,6
13,N,6
11,N,0
11,N,0
INFO Items
Begin
Item
Column 8 Definition 9
1
5
9
13
4,12,F,3
4,12,F,3
4,5,B
4,5,B
B-1
Appendix B—ArcWorld item definitions
Line feature tables
Coverage Names:1
Layer Type:2
TEMPLATE_LN
Line
Arc Attribute Table
dBASE Columns
Item Description 3,4
Item Name 5
From Node Number
To Node Number
Left Polygon Number
Right Polygon Number
Arc Length
Arc Internal Number
User Assignable ID
FNODE#
TNODE#
LPOLY#
RPOLY#
LENGTH
(coverage name)#
(coverage name)-ID
Begin
Column
Column 6 Definition 7
1
12
23
34
45
58
69
11,N,0
11,N,0
11,N,0
11,N,0
13,N,6
11,N,0
11,N,0
INFO Items
Begin
Item
Column 8 Definition 9
1
5
9
13
17
21
25
4,5,B
4,5,B
4,5,B
4,5,B
4,12,F,3
4,5,B
4,5,B
Notes:
1. The coverage directory names. For the ArcWorld 1:3M database, the first coverage listed
is for the worldwide coverage. The next two coverages listed represent the eastern and
western sections, respectively. (The final letter of the smaller coverages designates the
Section.)
2. The type of coverage. Coverages that contain only polygons, lines (arcs), or points require
only one feature attribute table. Many of the ArcWorld coverages contain both polygon and
line features and thus require two feature attribute tables.
3. A brief descriptive variable (item) name. The attribute descriptions in Chapters 4 and 5
provide complete definitions for the attributes and the attribute codes.
4. In all feature attribute tables, the first few items are generated automatically by the
ARC/INFO software.
In a Polygon Attribute Table (PAT), four items are software generated. The four items and
their definitions are shown in the PAT example above.
In a Point Attribute Table (PAT), the ARC/INFO-generated items are the same as in a
polygon attribute table, and the area and perimeters are set to zero. Although some
documentation refers to the point attribute table as XAT to differentiate it from the polygon
attribute table, INFO software does not distinguish between point and polygon attribute
B-2
ArcWorld User's Guide and Data Reference
Appendix B—ArcWorld item definitions
tables, and so polygons and points cannot be combined in one coverage, nor can point and
polygon coverages have the same name.
In an Arc Attribute Table (AAT), seven items are assigned automatically. The seven items
and their definitions are shown in the sample AAT above.
5. The defined variable (item) name. INFO or dBASE uses this name to read the item. In
INFO, the item name may be up to sixteen characters long, may not include spaces, must
begin with a letter, and is case sensitive. Because dBASE has slightly different
requirements for the defined item names, the "#" in the INFO software-generated item
names is replaced with an underscore "_" in the dBASE tables. The remaining item names
in the ArcWorld database have been limited to ten alphanumeric characters so that names
are identical in both formats.
6. In the dBASE columns, the Begin Column entry defines the column in which the variable
begins. A dBASE record may be up to 4,000 bytes, or 128 items wide (whichever comes
first).
7. A dBASE column definition has four elements:
a. Item name (see note 5)
b. Item width—the number of bytes needed to store the variable
c. Item type—may be N, for numeric, or C, for character
d. Number of displayed decimal places (for item type N)
8. In the INFO Items columns, the Begin Column entry defines the column in which the
variable begins. An INFO record may be 4,096 columns (bytes) wide. This limit applies
also to related records, so the combined length of selected and related records cannot
exceed 4,096. (There are no related items in the ArcWorld 1:3M and ArcWorld 1:25M
databases as they are delivered.)
9. An INFO item definition has five elements:
a. Item name (see note 5)
b. Item width—the number of bytes needed to store the variable
c. Output width—the number of columns needed to display the item value
d. Item type—may be B, for binary; C, for character; F, for floating decimal;
I, for integer; or N, for numeric
e. Number of displayed decimal places (for item types F, N, and on some
platforms, B)
July 1992
B-3
Appendix B—ArcWorld 1:3M cartographic layers
Country Boundaries
Coverage Name:
Layer Type:
CTRY3M
Polygon and Line
Polygon Attribute Table
dBASE Columns
Item Description
Item Name
Country FIPS Code
Country Name
World Region Name
Continent Name
Land/Water Identifier
Island Carto. Display Rank
Statistical Flag
European Econ. Community
Food and Agriculture Org.
UN General Assembly
UN Gen. Assembly (year)
Int. Atomic Energy Agency
Int. Recon. Dev. (World Bank)
International Monetary Fund
Org. of Petrol. Exp. Countries
United Nations Sec. Council
UN Ed., Sci. and Cult. Org.
World Health Organization
World Meteorological Orga.
COUNTRY
CNTRY_NAME
REGION
CONTINENT
LAND_OCEAN
ISLND_RANK
STAT_FLAG
EEC
FAO
GA
GA_MEMB_YR
IAEA
IBRD
IMF
OPEC
SC
UNESCO
WHO
WMO
Begin
Column
49
51
91
112
125
134
135
136
137
138
139
143
144
145
146
147
148
149
150
Column
Definition
2,C,0
40,C,0
21,C,0
13,C,0
9,C,0
1,N,0
1,N,0
1,N,0
1,N,0
1,N,0
4,N,0
1,N,0
1,N,0
1,N,0
1,N,0
1,N,0
1,N,0
1,N,0
1,N,0
INFO Items
Begin
Column
17
19
59
80
93
102
103
104
105
106
107
111
112
113
114
115
116
117
118
Item
Definition
2,2,C
2,2,C
21,21,C
13,13,C
9,9,C
1,1,I
1,1,I
1,1,I
1,1,I
1,1,I
4,4,I
1,1,I
1,1,I
1,1,I
1,1,I
1,1,I
1,1,I
1,1,I
1,1,I
Annotation: Country names
Arc Attribute Table
dBASE Columns
Item Description
Item Name
Boundary Type Code
Boundary Type Name
International Boundary Status
Boundary Coincidence
Adjoining Country 1 Code
Adjoining Country 2 Code
Adjoining Country Names
Adjoining Region Abbrev.
Adjoining Continent Abbrev.
TYPE
BND_TYPE
BND_STATUS
BND_COINC
COUNTRY1
COUNTRY2
CNTRY_NAME
REGION
CONTINENT
B-4
Begin
Column
80
81
91
92
93
95
97
138
147
Column
Definition
1,N,0
10,C,0
1,N,0
1,N,0
2,C,0
2,C,0
41,C,0
9,C,0
7,C,0
INFO Items
Begin
Column
Item
Definition
29
30
40
41
42
44
46
87
96
1,1,I
10,10,C
1,1,I
1,1,I
2,2,C
2,2,C
41,41,C
9,9.C
7,7,C
ArcWorld User's Guide and Data Reference
Appendix B—ArcWorld 1:3M cartographic layers
Country Internal Divisions
Coverage Name:
Layer Type:
ADMIN3M
Line
Arc Attribute Table
dBASE Columns
Item Description
Item Name
Internal Div. Bnd. Level
Boundary Coincidence
Country FIPS Code
Country Name
World Region Name
Continent Name
BND_LEVEL
BND_COINC
COUNTRY
CNTRY_NAME
REGION
CONTINENT
Begin
Column
80
81
82
84
124
145
Column
Definition
1,N,0
1,N,0
2,C,0
40,C,0
21,C,0
13,C,0
INFO Items
Begin
Column
Item
Definition
29
30
31
33
73
94
1,1,I
1,1,I
2,2,C
40,40,C
21,21,C
13,13,C
Major Cities
Coverage Names:
Layer Type:
CTY3M
Point
Point Attribute Table
dBASE Columns
Item Description
Item Name
City Name (English)
Capital City Flag
Major City Flag
Country FIPS Code
Country Name
World Region Name
Continent Name
City Name (Native)
Diacritical Mark Flag
NAME
CAPITAL
MAJ_CITY
COUNTRY
CNTRY_NAME
REGION
CONTINENT
LOCAL_NAME
DIACR_FLAG
Begin
Column
49
89
90
91
93
133
154
167
207
Column
Definition
40,C,0
1,N,0
1,N,0
2,C,0
40,C,N
21,C,0
13,C,0
40,C,0
1,N,0
INFO Items
Begin
Column
17
57
58
59
61
101
122
135
175
Item
Definition
40,40,C
1,1,1
1,1,I
2,2,C
40,40,C
21,21,C
13,13,C
40,40,C
1,1,I
Annotation: City names
July 1992
B-5
Appendix B—ArcWorld 1:3M cartographic layers
Railroads
Coverage Name:
Layer Type:
RR3M
Line
Arc Attribute Table
dBASE Columns
Item Description
Item Name
Rail Line Classification
Rail Line Class. Name
Cartographic Display Scale
Country FIPS Code
Country Name
World Region Name
Continent Name
TYPE
RAIL_TYPE
DISP_SCALE
COUNTRY
CNTRY_NAME
REGION
CONTINENT
Begin
Column
80
81
111
113
115
155
176
Column
Definition
1,N,0
30,C,0
2,N,0
2,C,0
40,C,0
21,C,0
13,C,0
INFO Items
Begin
Column
29
30
60
62
64
104
125
Item
Definition
1,1,I
30,30,C
2,2,I
2,2,C
40,40,C
21,21,C
13,13,C
Rivers and Water Bodies
Coverage Name:
Layer Type:
RIV3M, RIV3M_E, RIV3M_W
Polygon and Line
Polygon Attribute Table
dBASE Columns
Item Description
Item Name
Water Feature Type Code
Water Feature Type Name
Cartographic Display Rank
Country FIPS Code
Country Name
World Region Name
Continent Name
TYPE
WATER_TYPE
WATER_RANK
COUNTRY
CNTRY_NAME
REGION
CONTINENT
B-6
Begin
Column
49
50
70
72
74
114
135
Column
Definition
1,N,0
20,C,0
2,N,0
2,C,0
40,C,0
21,C,0
13,C,0
INFO Items
Begin
Column
17
18
38
40
42
82
103
Item
Definition
1,1,I
20,20,C
2,2,I
2,2,C
40,40,C
21,21,C
13,13,C
ArcWorld User's Guide and Data Reference
Appendix B—ArcWorld 1:3M cartographic layers
Rivers and Water Bodies (continued)
Arc Attribute Table
dBASE Columns
Item Description
Item Name
River Feature Type Code
River Feature Type Name
Cartographic Display Rank
River Coincidence Flag
Adjoining Country 1 Code
Adjoining Country 2 Code
Adjoining Country Names
Adjoining Region Abbrev.
Adjoining Continent Abbrev.
TYPE
RIVER_TYPE
RIVER_RANK
RIV_COINC
COUNTRY1
COUNTRY2
CNTRY_NAME
REGION
CONTINENT
Begin
Column
80
81
101
103
104
106
108
149
158
Column
Definition
1,N,0
20,C,0
2,N,0
1,N,0
2,C,0
2,C,0
41,C,0
9,C,0
7,C,0
INFO Items
Begin
Column
29
30
50
52
53
55
57
98
107
Item
Definition
1,1,I
20,20,C
2,2,I
1,1,I
2,2,C
2,2,C
41,41,C
9,9,C
7,7,C
Roads
Coverage Name:
Layer Type:
RDS3M, RDS3M_E, RDS3M_W
Line
Arc Attribute Table
dBASE Columns
Item Description
Item Name
Road Type Code
Road Type Name
Cartographic Display Scale
Country FIPS Code
Country Name
World Region Name
Continent Name
TYPE
ROAD_TYPE
DISP_SCALE
COUNTRY
CNTRY_NAME
REGION
CONTINENT
July 1992
Begin
Column
80
81
101
103
105
145
166
Column
Definition
1,N,0
20,C,0
2,N,0
2,C,0
40,C,0
21,C,0
13,C,0
INFO Items
Begin
Column
29
30
50
52
54
94
115
Item
Definition
1,1,I
20,20,C
2,2,I
2,2,C
40,40,C
21,21,C
13,13,C
B-7
Appendix B—ArcWorld 1:3M index layers
Landsat Scene Index
Coverage Name:
Layer Type:
SAT_BND, SAT_PT
Line and Point
Arc Attribute Table
dBASE Columns
Item Description
Item Name
Path Number
Row Number
Scene Center Location
Country FIPS Code One
Country Name One
Country FIPS Code Two
Country Name Two
Country FIPS Code Three
Country Name Three
Country FIPS Code Four
Country Name Four
Country FIPS Code Five
Country Name Five
Country FIPS Code Six
Country Name Six
PATH
ROW
SCN_CENTER
COUNTRY1
CNTRY_NAM1
COUNTRY2
CNTRY_NAM2
COUNTRY3
CNTRY_NAM3
COUNTRY4
CNTRY_NAM4
COUNTRY5
CNTRY_NAM5
COUNTRY6
CNTRY_NAM6
B-8
Begin
Column
80
84
88
109
111
151
153
193
195
235
237
277
279
319
321
Column
Definition
4,C,0
4,C,0
21,C,0
2,C,0
40,C,0
2,C,0
40,C,0
2,C,0
40,C,0
2,C,0
40,C,0
2,C,0
40,C,0
2,C,0
40,C,0
INFO Items
Begin
Column
29
33
37
58
60
100
102
142
144
184
186
226
228
268
270
Item
Definition
4,4,C
4,4,C
21,21,C
2,2,C
40,40,C
2,2,C
40,40,C
2,2,C
40,40,C
2,2,C
40,40,C
2,2,C
40,40,C
2,2,C
40,40,C
ArcWorld User's Guide and Data Reference
Appendix B—ArcWorld 1:3M index layers
Landsat Scene Index (continued)
Point Attribute Table
dBASE Columns
Item Description
Item Name
Path Number
Row Number
Scene Center Location
Country FIPS Code One
Country Name One
Country FIPS Code Two
Country Name Two
Country FIPS Code Three
Country Name Three
Country FIPS Code Four
Country Name Four
Country FIPS Code Five
Country Name Five
Country FIPS Code Six
Country Name Six
PATH
ROW
SCN_CENTER
COUNTRY1
CNTRY_NAM1
COUNTRY2
CNTRY_NAM2
COUNTRY3
CNTRY_NAM3
COUNTRY4
CNTRY_NAM4
COUNTRY5
CNTRY_NAM5
COUNTRY6
CNTRY_NAM6
Begin
Column
49
53
57
78
80
120
122
162
164
204
206
246
248
288
290
Column
Definition
4,C,0
4,C,0
21,C,0
2,C,0
40,C,0
2,C,0
40,C,0
2,C,0
40,C,0
2,C,0
40,C,0
2,C,0
40,C,0
2,C,0
40,C,0
INFO Items
Begin
Column
17
21
25
46
48
88
90
130
132
172
174
214
216
256
258
Item
Definition
4,4,C
4,4,C
21,21,C
2,2,C
40,40,C
2,2,C
40,40,C
2,2,C
40,40,C
2,2,C
40,40,C
2,2,C
40,40,C
2,2,C
40,40,C
Latitude/Longitude Grids
Coverage Name:
Layer Type:
LTLG5, LTLG10, LTLG20
Line
Arc Attribute Table
dBASE Columns
Item Description
Item Name
Latitude
Longitude
Land/Water Indicator
LATITUDE
LONGITUDE
LAND_WATER
July 1992
Begin
Column
80
84
88
Column
Definition
4,C,0
4,C,0
1,N,0
INFO Items
Begin
Column
29
33
37
Item
Definition
4,4,C
4,4,C
1,1,I
B-9
Appendix B—ArcWorld 1:3M index layers
Operational Navigation Chart (ONC) Index
Coverage Name:
Layer Type:
ONC_IDX
Polygon
Polygon Attribute Table
dBASE Columns
Item Description
Item Name
Chart Identification Code
MAP_ID
B-10
Begin
Column
49
Column
Definition
6,C,0
INFO Items
Begin
Column
17
Item
Definition
6,6,C
ArcWorld User's Guide and Data Reference
Appendix B—ArcWorld 1:3M country statistical attribute layers
Economic and Industrial Indicators
Coverage Name:
Layer Type:
ECONIND
Polygon and Line
Polygon Attribute Table
dBASE Columns
Begin
Column
Column
Definition
INFO Items
Begin
Column
Item
Definition
Item Description
Item Name
Country FIPS Code
Country Name
World Region Name
Continent Name
Land/Water Identifier
Island Carto. Display Rank
Statistical Flag
European Econ. Community
Food and Agriculture Org.
UN General Assembly
COUNTRY
CNTRY_NAME
REGION
CONTINENT
LAND_OCEAN
ISLND_RANK
STAT_FLAG
EEC
FAO
GA
49
51
91
112
125
134
135
136
137
138
2,C,0
40,C,0
21,C,0
13,C,0
9,C,0
1,N,0
1,N,0
1,N,0
1,N,0
1,N,0
17
19
59
80
93
102
103
104
105
106
2,2,C
40,40,C
21,21,C
13,13,C
9,9,C
1,1,I
1,1,I
1,1,I
1,1,I
1,1,I
UN Gen. Assembly (year)
Int. Atomic Energy Agency
Int. Recon. Dev. (World Bank)
Int. Monetary Fund
Org. of Petrol. Exp. Countries
United Nations Sec. Council
UN Ed., Sci. and Cult. Org.
World Health Organization
World Meteorological Orga.
World Bank Country Code
GA_MEMB_YR
IAEA
IBRD
IMF
OPEC
SC
UNESCO
WHO
WMO
WB_CNTRY
139
143
144
145
146
147
148
149
150
151
4,N,0
1,N,0
1,N,0
1,N,0
1,N,0
1,N,0
1,N,0
1,N,0
1,N,0
3,C,0
107
111
112
113
114
115
116
117
118
119
4,4,I
1,1,I
1,1,I
1,1,I
1,1,I
1,1,I
1,1,I
1,1,I
1,1,I
3,3,C
GNP per Capita, 1965
GNP per Capita, 1970
GNP per Capita, 1975
GNP per Capita, 1980
GNP per Capita, 1985
GNP per Capita, 1989
% Income to Top 10% Hhlds 65
% Inc. to Top 10% Hhlds 70
% Inc. to Top 10% Hhlds 75
% Inc. to Top 10% Hhlds 80
GNP_CAP65
GNP_CAP70
GNP_CAP75
GNP_CAP80
GNP_CAP85
GNP_CAP89
INCTOP1065
INCTOP1070
INCTOP1075
INCTOP1080
154
159
164
169
174
179
184
190
196
202
5,N,0
5,N,0
5,N,0
5,N,0
5,N,0
5,N,0
6,N,2
6,N,2
6,N,2
6,N,2
122
127
132
137
142
147
152
158
164
170
5,5,I
5,5,I
5,5,I
5,5,I
5,5,I
5,5,I
6,6,N,2
6,6,N,2
6,6,N,2
6,6,N,2
% Inc. to Top 10% Hhlds 85
% Inc. to Top 10% Hhlds 89
% Inc. to Top 20% Hhlds 65
% Inc. to Top 20% Hhlds 70
INCTOP1085
INCTOP1089
INCTOP2065
INCTOP2070
208
214
220
226
6,N,2
6,N,2
6,N,2
6,N,2
176
182
188
194
6,6,N,2
6,6,N,2
6,6,N,2
6,6,N,2
continued . . .
July 1992
B-11
Appendix B—ArcWorld 1:3M country statistical attribute layers
Economic and Industrial Indicators (continued)
Polygon Attribute Table (cont.)
dBASE Columns
Column
Definition
INFO Items
Item Description
Item Name
Begin
Column
Begin
Column
Item
Definition
% Income to Top 20% Hhlds 75
% Income to Top 20% Hhlds 80
% Income to Top 20% Hhlds 85
% Income to Top 20% Hhlds 89
% Income to Bot 40%, 65
% Income to Bot 40%, 70
% Income to Bot 40%, 75
% Income to Bot 40%, 80
% Income to Bot 40%, 85
% Income to Bot 40%, 89
INCTOP2075
INCTOP2080
INCTOP2085
INCTOP2089
INCBOT4065
INCBOT4070
INCBOT4075
INCBOT4080
INCBOT4085
INCBOT4089
232
238
244
250
256
262
268
274
280
286
6,N,2
6,N,2
6,N,2
6,N,2
6,N,2
6,N,2
6,N,2
6,N,2
6,N,2
6,N,2
200
206
212
218
224
230
236
242
248
254
6,6,N,2
6,6,N,2
6,6,N,2
6,6,N,2
6,6,N,2
6,6,N,2
6,6,N,2
6,6,N,2
6,6,N,2
6,6,N,2
% Income to Bot 20%, 65
% Income to Bot 20%, 70
% Income to Bot 20%, 75
% Income to Bot 20%, 80
% Income to Bot 20%, 85
% Income to Bot 20%, 89
Percent of GDP for Food, 1970
Percent of GDP for Food, 1975
Percent of GDP for Food, 1980
Percent of GDP for Food, 1985
INCBOT2065
INCBOT2070
INCBOT2075
INCBOT2080
INCBOT2085
INCBOT2089
EXPFOODS70
EXPFOODS75
EXPFOODS80
EXPFOODS85
292
298
304
310
316
322
328
334
340
346
6,N,2
6,N,2
6,N,2
6,N,2
6,N,2
6,N,2
6,N,2
6,N,2
6,N,2
6,N,2
260
266
272
278
284
290
296
302
308
314
6,6,N,2
6,6,N,2
6,6,N,2
6,6,N,2
6,6,N,2
6,6,N,2
6,6,N,2
6,6,N,2
6,6,N,2
6,6,N,2
Percent of GDP for Food, 1989
Percent of GDP on Staples, 75
Percent of GDP on Staples, 80
Percent of GDP on Staples, 85
Percent of GDP on Staples, 89
Percent of GDP on Protein, 75
Percent of GDP on Protein, 80
Percent of GDP on Protein, 85
Percent of GDP on Protein, 89
% GDP Fixed Invst Hsg, 75
EXPFOODS89
EXPSTAPL75
EXPSTAPL80
EXPSTAPL85
EXPSTAPL89
EXPPROTN75
EXPPROTN80
EXPPROTN85
EXPPROTN89
INVSTHSE75
352
358
364
370
376
382
388
394
400
406
6,N,2
6,N,2
6,N,2
6,N,2
6,N,2
6,N,2
6,N,2
6,N,2
6,N,2
6,N,2
320
326
332
338
344
350
356
362
368
374
6,6,N,2
6,6,N,2
6,6,N,2
6,6,N,2
6,6,N,2
6,6,N,2
6,6,N,2
6,6,N,2
6,6,N,2
6,6,N,2
% GDP Fixed Invst Hsg, 80
% GDP Fixed Invst Hsg, 85
% GDP Fixed Invst Hsg, 89
Percent of GDP on Energy, 75
Percent of GDP on Energy, 80
Percent of GDP on Energy, 85
Percent of GDP on Energy, 89
INVSTHSE80
INVSTHSE85
INVSTHSE89
EXPENRGY75
EXPENRGY80
EXPENRGY85
EXPENRGY89
412
418
424
430
436
442
448
6,N,2
6,N,2
6,N,2
6,N,2
6,N,2
6,N,2
6,N,2
380
386
392
398
404
410
416
6,6,N,2
6,6,N,2
6,6,N,2
6,6,N,2
6,6,N,2
6,6,N,2
6,6,N,2
continued . . .
B-12
ArcWorld User's Guide and Data Reference
Appendix B—ArcWorld 1:3M country statistical attribute layers
Economic and Industrial Indicators (continued)
Polygon Attribute Table (cont.)
dBASE Columns
Begin
Column
Column
Definition
INFO Items
Begin
Column
Item
Definition
Item Description
Item Name
Energy Consum per Capita, 65
Energy Consum per Capita, 70
Energy Consum per Capita, 75
Energy Consum per Capita, 80
Energy Consum per Capita, 85
Energy Consum per Capita, 89
% GDP on Trans & Comm, 70
% GDP on Trans & Comm, 75
% GDP on Trans & Comm, 80
% GDP on Trans & Comm, 85
ENRG_CAP65
ENRG_CAP70
ENRG_CAP75
ENRG_CAP80
ENRG_CAP85
ENRG_CAP89
EXPTRCM70
EXPTRCM75
EXPTRCM80
EXPTRCM85
454
462
470
478
486
494
502
508
514
520
8,N,2
8,N,2
8,N,2
8,N,2
8,N,2
8,N,2
6,N,2
6,N,2
6,N,2
6,N,2
422
430
438
446
454
462
470
476
482
488
8,8,N,2
8,8,N,2
8,8,N,2
8,8,N,2
8,8,N,2
8,8,N,2
6,6,N,2
6,6,N,2
6,6,N,2
6,6,N,2
% GDP on Trans & Comm, 89
Persons per Passenger Car, 65
Persons per Passenger Car, 70
Persons per Passenger Car, 75
Persons per Passenger Car, 80
Persons per Passenger Car, 85
Persons per Passenger Car, 89
% GDP on Trans Equip., 75
% GDP on Trans Equip., 80
% GDP on Trans Equip., 85
EXPTRCM89
POP_CAR65
POP_CAR70
POP_CAR75
POP_CAR80
POP_CAR85
POP_CAR89
INVSTTR75
INVSTTR80
INVSTTR85
526
532
538
544
550
556
562
568
574
580
6,N,2
6,N,1
6,N,1
6,N,1
6,N,1
6,N,1
6,N,1
6,N,2
6,N,2
6,N,2
494
500
506
512
518
524
530
536
542
548
6,6,N,2
6,6,N,1
6,6,N,1
6,6,N,1
6,6,N,1
6,6,N,1
6,6,N,1
6,6,N,2
6,6,N,2
6,6,N,2
% GDP on Trans Equip., 89
Persons per Telephone, 75
Persons per Telephone, 80
Persons per Telephone, 85
Persons per Telephone, 89
Percent of GDP on Housing, 65
Percent of GDP on Housing, 70
Percent of GDP on Housing, 75
Percent of GDP on Housing, 80
Percent of GDP on Housing, 85
Percent of GDP on Housing, 89
INVSTTR89
POP_TELE75
POP_TELE80
POP_TELE85
POP_TELE89
EXPHOUSE65
EXPHOUSE70
EXPHOUSE75
EXPHOUSE80
EXPHOUSE85
EXPHOUSE89
586
592
598
604
610
616
622
628
634
640
646
6,N,2
6,N,1
6,N,1
6,N,1
6,N,1
6,N,2
6,N,2
6,N,2
6,N,2
6,N,2
6,N,2
554
560
566
572
578
584
590
596
602
608
614
6,6,N,2
6,6,N,1
6,6,N,1
6,6,N,1
6,6,N,1
6,6,N,2
6,6,N,2
6,6,N,2
6,6,N,2
6,6,N,2
6,6,N,2
July 1992
B-13
Appendix B—ArcWorld 1:3M country statistical attribute layers
Economic and Industrial Indicators (continued)
Arc Attribute Table
dBASE Columns
Item Description
Item Name
Boundary Type Code
Boundary Type Name
Int. Boundary Status
Boundary Coincidence
Adjoining Country 1 Code
Adjoining Country 2 Code
Adjoining Country Names
Adjoining Region Abbrev.
Adjoining Continent Abbrev.
TYPE
BND_TYPE
BND_STATUS
BND_COINC
COUNTRY1
COUNTRY2
CNTRY_NAME
REGION
CONTINENT
Begin
Column
80
81
91
92
93
95
97
138
147
Column
Definition
1,N,0
10,C,0
1,N,0
1,N,0
2,C,0
2,C,0
41,C,0
9,C,0
7,C,0
INFO Items
Begin
Column
Item
Definition
29
30
40
41
42
44
46
87
96
1,1,I
10,10,C
1,1,I
1,1,I
2,2,C
2,2,C
41,41,C
9,9,C
7,7,C
Education and Literacy
Coverage Name:
Layer Type:
EDU_LIT
Polygon and Line
Polygon Attribute Table (cont.)
dBASE Columns
Begin
Column
Column
Definition
INFO Items
Begin
Column
Item
Definition
Item Description
Item Name
Country FIPS Code
Country Name
World Region Name
Continent Name
Land/Water Identifier
Island Carto. Display Rank
Statistical Flag
European Econ. Community
Food and Agriculture Org.
UN General Assembly
COUNTRY
CNTRY_NAME
REGION
CONTINENT
LAND_OCEAN
ISLND_RANK
STAT_FLAG
EEC
FAO
GA
49
51
91
112
125
134
135
136
137
138
2,C,0
40,C,0
21,C,0
13,C,0
9,C,0
1,N,0
1,N,0
1,N,0
1,N,0
1,N,0
17
19
59
80
93
102
103
104
105
106
2,2,C
40,40,C
21,21,C
13,13,C
9,9,C
1,1,I
1,1,I
1,1,I
1,1,I
1,1,I
UN Gen. Assembly (year)
Int. Atomic Energy Agency
Int. Recon. Dev. (World Bank)
Int. Monetary Fund
GA_MEMB_YR
IAEA
IBRD
IMF
139
143
144
145
4,N,0
1,N,0
1,N,0
1,N,0
107
111
112
113
4,4,I
1,1,I
1,1,I
1,1,I
continued . . .
B-14
ArcWorld User's Guide and Data Reference
Appendix B—ArcWorld 1:3M country statistical attribute layers
Education and Literacy (continued)
Polygon Attribute Table (cont.)
dBASE Columns
Column
Definition
INFO Items
Item Description
Item Name
Begin
Column
Begin
Column
Item
Definition
Org. of Petrol. Exp. Countries
United Nations Sec. Council
UN Ed., Sci. and Cult. Org.
World Health Organization
World Meteorological Orga.
World Bank Country Code
Percent GDP for Education, 70
Percent GDP for Education, 75
Percent GDP for Education, 80
Percent GDP for Education, 85
OPEC
SC
UNESCO
WHO
WMO
WB_CNTRY
EXPEDUC70
EXPEDUC75
EXPEDUC80
EXPEDUC85
146
147
148
149
150
151
154
160
166
172
1,N,0
1,N,0
1,N,0
1,N,0
1,N,0
3,C,0
6,N,2
6,N,2
6,N,2
6,N,2
114
115
116
117
118
119
122
128
134
140
1,1,I
1,1,I
1,1,I
1,1,I
1,1,I
3,3,C
6,6,N,2
6,6,N,2
6,6,N,2
6,6,N,2
Percent GDP for Education, 89
% Children in Primary Schl, 65
% Children in Primary Schl, 70
% Children in Primary Schl, 75
% Children in Primary Schl, 80
% Children in Primary Schl, 85
% Children in Primary Schl, 89
% Females in Primary Schl, 65
% Females in Primary Schl, 70
% Females in Primary Schl, 75
EXPEDUC89
P_PRIMRY65
P_PRIMRY70
P_PRIMRY75
P_PRIMRY80
P_PRIMRY85
P_PRIMRY89
P_PRI_F65
P_PRI_F70
P_PRI_F75
178
184
190
196
202
208
214
220
226
232
6,N,2
6,N,2
6,N,2
6,N,2
6,N,2
6,N,2
6,N,2
6,N,2
6,N,2
6,N,2
146
152
158
164
170
176
182
188
194
200
6,6,N,2
6,6,N,2
6,6,N,2
6,6,N,2
6,6,N,2
6,6,N,2
6,6,N,2
6,6,N,2
6,6,N,2
6,6,N,2
% Females in Primary Schl, 80
% Females in Primary Schl, 85
% Females in Primary Schl, 89
% Children in Sec. Schl, 65
% Children in Sec. Schl, 70
% Children in Sec. Schl, 75
% Children in Sec. Schl, 80
% Children in Sec. Schl, 85
% Children in Sec. Schl, 89
% Females in Sec. Schl, 65
P_PRI_F80
P_PRI_F85
P_PRI_F89
P_SECNDY65
P_SECNDY70
P_SECNDY75
P_SECNDY80
P_SECNDY85
P_SECNDY89
P_SEC_F65
238
244
250
256
262
268
274
280
286
292
6,N,2
6,N,2
6,N,2
6,N,2
6,N,2
6,N,2
6,N,2
6,N,2
6,N,2
6,N,2
206
212
218
224
230
236
242
248
254
260
6,6,N,2
6,6,N,2
6,6,N,2
6,6,N,2
6,6,N,2
6,6,N,2
6,6,N,2
6,6,N,2
6,6,N,2
6,6,N,2
% Females in Sec. Schl, 70
% Females in Sec. Schl, 75
% Females in Sec..Schl, 80
% Females in Sec. Schl, 85
% Females in Sec. Schl, 89
% Science & Eng. Students, 65
% Science & Eng. Students, 70
P_SEC_F70
P_SEC_F75
P_SEC_F80
P_SEC_F85
P_SEC_F89
P_SCIENG65
P_SCIENG70
298
304
310
316
322
328
334
6,N,2
6,N,2
6,N,2
6,N,2
6,N,2
6,N,2
6,N,2
266
272
278
284
290
296
302
6,6,N,2
6,6,N,2
6,6,N,2
6,6,N,2
6,6,N,2
6,6,N,2
6,6,N,2
continued . . .
July 1992
B-15
Appendix B—ArcWorld 1:3M country statistical attribute layers
Education and Literacy (continued)
Polygon Attribute Table (cont.)
dBASE Columns
Begin
Column
Column
Definition
INFO Items
Begin
Column
Item
Definition
Item Description
Item Name
% Science & Eng. Students, 75
% Science & Eng. Students, 80
% Science & Eng. Students, 85
% Science & Eng. Students, 89
Prim. Pupil/Teacher Ratio, 65
Prim. Pupil/Teacher Ratio, 70
Prim. Pupil/Teacher Ratio, 75
Prim. Pupil/Teacher Ratio, 80
Prim. Pupil/Teacher Ratio, 85
Prim. Pupil/Teacher Ratio, 89
P_SCIENG75
P_SCIENG80
P_SCIENG85
P_SCIENG89
PUPTCH_P65
PUPTCH_P70
PUPTCH_P75
PUPTCH_P80
PUPTCH_P85
PUPTCH_P89
340
346
352
358
364
367
370
373
376
379
6,N,2
6,N,2
6,N,2
6,N,2
3,N,0
3,N,0
3,N,0
3,N,0
3,N,0
3,N,0
308
314
320
326
332
335
338
341
344
347
6,6,N,2
6,6,N,2
6,6,N,2
6,6,N,2
3,3,I
3,3,I
3,3,I
3,3,I
3,3,I
3,3,I
Secnd. Pupil/Teacher Ratio, 65
Secnd. Pupil/Teacher Ratio, 70
Secnd. Pupil/Teacher Ratio, 75
Secnd. Pupil/Teacher Ratio, 80
Secnd. Pupil/Teacher Ratio, 85
Secnd. Pupil/Teacher Ratio, 89
% of Pupils Reaching Grd 4, 75
% of Pupils Reaching Grd 4, 80
% of Pupils Reaching Grd 4, 85
% of Pupils Reaching Grd 4, 89
PUPTCH_S65
PUPTCH_S70
PUPTCH_S75
PUPTCH_S80
PUPTCH_S85
PUPTCH_S89
PUP_GR4_75
PUP_GR4_80
PUP_GR4_85
PUP_GR4_89
382
388
394
400
406
412
418
424
430
436
6,N,2
6,N,2
6,N,2
6,N,2
6,N,2
6,N,2
6,N,2
6,N,2
6,N,2
6,N,2
350
356
362
368
374
380
386
392
398
404
6,6,N,2
6,6,N,2
6,6,N,2
6,6,N,2
6,6,N,2
6,6,N,2
6,6,N,2
6,6,N,2
6,6,N,2
6,6,N,2
% of Repeat Prim. Pupils, 65
% of Repeat Prim. Pupils, 70
% of Repeat Prim. Pupils, 75
% of Repeat Prim. Pupils, 80
% of Repeat Prim. Pupils, 85
% of Repeat Prim. Pupils, 89
% of Persons Illiterate, 65
% of Persons Illiterate, 70
% of Persons Illiterate, 75
% of Persons Illiterate, 80
REPEAT_P65
REPEAT_P70
REPEAT_P75
REPEAT_P80
REPEAT_P85
REPEAT_P89
ILLITER65
ILLITER70
ILLITER75
ILLITER80
442
448
454
460
466
472
478
484
490
496
6,N,2
6,N,2
6,N,2
6,N,2
6,N,2
6,N,2
6,N,2
6,N,2
6,N,2
6,N,2
410
416
422
428
434
440
446
452
458
464
6,6,N,2
6,6,N,2
6,6,N,2
6,6,N,2
6,6,N,2
6,6,N,2
6,6,N,2
6,6,N,2
6,6,N,2
6,6,N,2
% of Persons Illiterate, 85
% of Persons Illiterate, 89
% of Females Illiterate, 85
% of Females Illiterate, 89
Newspapers per 1,000, 65
Newspapers per 1,000, 70
ILLITER85
ILLITER89
ILLIT_F85
ILLIT_F89
NEWSPAPR65
NEWSPAPR70
502
508
514
520
526
532
6,N,2
6,N,2
6,N,2
6,N,2
6,N,1
6,N,1
470
476
482
488
494
500
6,6,N,2
6,6,N,2
6,6,N,2
6,6,N,2
6,6,N,1
6,6,N,1
continued . . .
B-16
ArcWorld User's Guide and Data Reference
Appendix B—ArcWorld 1:3M country statistical attribute layers
Education and Literacy (continued)
Polygon Attribute Table (cont.)
dBASE Columns
Item Description
Item Name
Newspapers per 1,000, 75
Newspapers per 1,000, 80
Newspapers per 1,000, 85
Newspapers per 1,000, 89
NEWSPAPR75
NEWSPAPR80
NEWSPAPR85
NEWSPAPR89
Begin
Column
538
544
550
556
Column
Definition
6,N,1
6,N,1
6,N,1
6,N,1
INFO Items
Begin
Column
506
512
518
524
Item
Definition
6,6,N,1
6,6,N,1
6,6,N,1
6,6,N,1
Arc Attribute Table
dBASE Columns
Item Description
Item Name
Boundary Type Code
Boundary Type Name
Int. Boundary Status
Boundary Coincidence
Adjoining Country 1 Code
Adjoining Country 2 Code
Adjoining Country Names
Adjoining Region Abbrev.
Adjoining Continent Abbrev.
TYPE
BND_TYPE
BND_STATUS
BND_COINC
COUNTRY1
COUNTRY2
CNTRY_NAME
REGION
CONTINENT
July 1992
Begin
Column
80
81
91
92
93
95
97
138
147
Column
Definition
1,N,0
10,C,0
1,N,0
1,N,0
2,C,0
2,C,0
41,C,0
9,C,0
7,C,0
INFO Items
Begin
Column
Item
Definition
29
30
40
41
42
44
46
87
96
1,1,I
10,10,C
1,1,I
1,1,I
2,2,C
2,2,C
41,41,C
9,9,C
7,7,C
B-17
Appendix B—ArcWorld 1:3M country statistical attribute layers
Food Production and Nutrition
Coverage Name:
Layer Type:
AGRICUL
Polygon and Line
Polygon Attribute Table
dBASE Columns
Begin
Column
Column
Definition
INFO Items
Begin
Column
Item
Definition
Item Description
Item Name
Country FIPS Code
Country Name
World Region Name
Continent Name
Land/Water Identifier
Island Carto. Display Rank
Statistical Flag
European Econ. Community
Food and Agriculture Org.
UN General Assembly
COUNTRY
CNTRY_NAME
REGION
CONTINENT
LAND_OCEAN
ISLND_RANK
STAT_FLAG
EEC
FAO
GA
49
51
91
112
125
134
135
136
137
138
2,C,0
40,C,0
21,C,0
13,C,0
9,C,0
1,N,0
1,N,0
1,N,0
1,N,0
1,N,0
17
19
59
80
93
102
103
104
105
106
2,2,C
40,40,C
21,21,C
13,13,C
9,9,C
1,1,I
1,1,I
1,1,I
1,1,I
1,1,I
UN Gen. Assembly (year)
Int. Atomic Energy Agency
Int. Recon. Dev. (World Bank)
Int. Monetary Fund
Org. of Petrol. Exp. Countries
United Nations Sec. Council
UN Ed., Sci. and Cult. Org.
World Health Organization
World Meteorological Orga.
World Bank Country Code
GA_MEMB_YR
IAEA
IBRD
IMF
OPEC
SC
UNESCO
WHO
WMO
WB_CNTRY
139
143
144
145
146
147
148
149
150
151
4,N,0
1,N,0
1,N,0
1,N,0
1,N,0
1,N,0
1,N,0
1,N,0
1,N,0
3,C,0
107
111
112
113
114
115
116
117
118
119
4,4,I
1,1,I
1,1,I
1,1,I
1,1,I
1,1,I
1,1,I
1,1,I
1,1,I
3,3,C
Percent of Agri. Land, 65
Percent of Agri. Land, 70
Percent of Agri. Land, 75
Percent of Agri. Land, 80
Percent of Agri. Land, 85
Percent of Agri. Land, 89
Agri. Population Density, 65
Agri. Population Density, 70
Agri. Population Density, 75
Agri. Population Density, 80
P_AGLAND65
P_AGLAND70
P_AGLAND75
P_AGLAND80
P_AGLAND85
P_AGLAND89
POPDNSAG65
POPDNSAG70
POPDNSAG75
POPDNSAG80
154
160
166
172
178
184
190
203
216
229
6,N,2
6,N,2
6,N,2
6,N,2
6,N,2
6,N,2
13,N,2
13,N,2
13,N,2
13,N,2
122
128
134
140
146
152
158
171
184
197
6,6,N,2
6,6,N,2
6,6,N,2
6,6,N,2
6,6,N,2
6,6,N,2
13,13,N,2
13,13,N,2
13,13,N,2
13,13,N,2
Agri. Population Density, 85
Agri. Population Density, 89
Forest Area (K sq. km), 65
Forest Area (K sq. km), 70
POPDNSAG85
POPDNSAG89
FORESTS65
FORESTS70
242
255
268
278
13,N,2
13,N,2
10,N,0
10,N,0
210
223
236
246
13,13,N,2
13,13,N,2
10,10,I
10,10,I
continued . . .
B-18
ArcWorld User's Guide and Data Reference
Appendix B—ArcWorld 1:3M country statistical attribute layers
Food Production and Nutrition (continued)
Polygon Attribute Table (cont.)
dBASE Columns
Begin
Column
Column
Definition
INFO Items
Begin
Column
Item
Definition
Item Description
Item Name
Forest Area (K sq. km), 75
Forest Area (K sq. km), 80
Forest Area (K sq. km), 85
Forest Area (K sq. km), 89
Net Deforestation Rate, 65
Net Deforestation Rate, 70
Net Deforestation Rate, 75
Net Deforestation Rate, 80
Net Deforestation Rate, 85
Net Deforestation Rate, 89
FORESTS75
FORESTS80
FORESTS85
FORESTS89
NETDEFOR65
NETDEFOR70
NETDEFOR75
NETDEFOR80
NETDEFOR85
NETDEFOR89
288
298
308
318
328
334
340
346
352
358
10,N,0
10,N,0
10,N,0
10,N,0
6,N,2
6,N,2
6,N,2
6,N,2
6,N,2
6,N,2
256
266
276
286
296
302
308
314
320
326
10,10,I
10,10,I
10,10,I
10,10,I
6,6,N,2
6,6,N,2
6,6,N,2
6,6,N,2
6,6,N,2
6,6,N,2
Cereal Food Imports, 65
Cereal Food Imports, 70
Cereal Food Imports, 75
Cereal Food Imports, 80
Cereal Food Imports, 85
Cereal Food Imports, 89
Food Aid in Cereals, 70
Food Aid in Cereals, 75
Food Aid in Cereals, 80
Food Aid in Cereals, 85
IMPTCERL65
IMPTCERL70
IMPTCERL75
IMPTCERL80
IMPTCERL85
IMPTCERL89
AIDCERLB70
AIDCERLB75
AIDCERLB80
AIDCERLB85
364
374
384
394
404
414
424
434
444
454
10,N,0
10,N,0
10,N,0
10,N,0
10,N,0
10,N,0
10,N,0
10,N,0
10,N,0
10,N,0
332
342
352
362
372
382
392
402
412
422
10,10,I
10,10,I
10,10,I
10,10,I
10,10,I
10,10,I
10,10,I
10,10,I
10,10,I
10,10,I
Food Aid in Cereals, 89
Food Production per Capita, 65
Food Production per Capita, 70
Food Production per Capita, 75
Food Production per Capita, 80
Food Production per Capita, 85
Food Production per Capita, 89
% of GDP in Agriculture, 65
% of GDP in Agriculture, 70
% of GDP in Agriculture, 75
AIDCERLB89
FOODPROD65
FOODPROD70
FOODPROD75
FOODPROD80
FOODPROD85
FOODPROD89
P_AGGDPB65
P_AGGDPB70
P_AGGDPB75
464
474
480
486
492
498
504
510
516
522
10,N,0
6,N,2
6,N,2
6,N,2
6,N,2
6,N,2
6,N,2
6,N,2
6,N,2
6,N,2
432
442
448
454
460
466
472
478
484
490
10,10,I
6,6,N,2
6,6,N,2
6,6,N,2
6,6,N,2
6,6,N,2
6,6,N,2
6,6,N,2
6,6,N,2
6,6,N,2
% of GDP in Agriculture, 80
% of GDP in Agriculture, 85
% of GDP in Agriculture, 89
Calories per Person (Daily), 65
Calories per Person (Daily), 70
Calories per Person (Daily), 75
Calories per Person (Daily), 80
P_AGGDPB80
P_AGGDPB85
P_AGGDPB89
CAL_CAP65
CAL_CAP70
CAL_CAP75
CAL_CAP80
528
534
540
546
552
558
564
6,N,2
6,N,2
6,N,2
6,N,1
6,N,1
6,N,1
6,N,1
496
502
508
514
520
526
532
6,6,N,2
6,6,N,2
6,6,N,2
6,6,N,1
6,6,N,1
6,6,N,1
6,6,N,1
continued . . .
July 1992
B-19
Appendix B—ArcWorld 1:3M country statistical attribute layers
Food Production and Nutrition (continued)
Polygon Attribute Table (cont.)
dBASE Columns
Item Description
Item Name
Calories per Person (Daily), 85
Calories per Person (Daily), 89
Protein per Person (Daily), 65
Protein per Person (Daily), 70
Protein per Person (Daily), 75
Protein per Person (Daily), 80
Protein per Person (Daily), 85
Protein per Person (Daily), 89
CAL_CAP85
CAL_CAP89
PROT_CAP65
PROT_CAP70
PROT_CAP75
PROT_CAP80
PROT_CAP85
PROT_CAP89
Begin
Column
570
576
582
588
594
600
606
612
Column
Definition
6,N,1
6,N,1
6,N,1
6,N,1
6,N,1
6,N,1
6,N,1
6,N,1
INFO Items
Begin
Column
538
544
550
556
562
568
574
580
Item
Definition
6,6,N,1
6,6,N,1
6,6,N,1
6,6,N,1
6,6,N,1
6,6,N,1
6,6,N,1
6,6,N,1
Arc Attribute Table
dBASE Columns
Item Description
Item Name
Boundary Type Code
Boundary Type Name
Int. Boundary Status
Boundary Coincidence
Adjoining Country 1 Code
Adjoining Country 2 Code
Adjoining Country Names
Adjoining Region Abbrev.
Adjoining Continent Abbrev.
TYPE
BND_TYPE
BND_STATUS
BND_COINC
COUNTRY1
COUNTRY2
CNTRY_NAME
REGION
CONTINENT
B-20
Begin
Column
80
81
91
92
93
95
97
138
147
Column
Definition
1,N,0
10,C,0
1,N,0
1,N,0
2,C,0
2,C,0
41,C,0
9,C,0
7,C,0
INFO Items
Begin
Column
Item
Definition
29
30
40
41
42
44
46
87
96
1,1,I
10,10,C
1,1,I
1,1,I
2,2,C
2,2,C
41,41,C
9,9,C
7,7,C
ArcWorld User's Guide and Data Reference
Appendix B—ArcWorld 1:3M country statistical attribute layers
Health and Vital Statistics
Coverage Name:
Layer Type:
HEALTH
Polygon and Line
Polygon Attribute Table
dBASE Columns
Begin
Column
Column
Definition
INFO Items
Begin
Column
Item
Definition
Item Description
Item Name
Country FIPS Code
Country Name
World Region Name
Continent Name
Land/Water Identifier
Island Carto. Display Rank
Statistical Flag
European Econ. Community
Food and Agriculture Org.
UN General Assembly
COUNTRY
CNTRY_NAME
REGION
CONTINENT
LAND_OCEAN
ISLND_RANK
STAT_FLAG
EEC
FAO
GA
49
51
91
112
125
134
135
136
137
138
2,C,0
40,C,0
21,C,0
13,C,0
9,C,0
1,N,0
1,N,0
1,N,0
1,N,0
1,N,0
17
19
59
80
93
102
103
104
105
106
2,2,C
40,40,C
21,21,C
13,13,C
9,9,C
1,1,I
1,1,I
1,1,I
1,1,I
1,1,I
UN Gen. Assembly (year)
Int. Atomic Energy Agency
Int. Recon. Dev. (World Bank)
Int. Monetary Fund
Org. of Petrol. Exp. Countries
United Nations Sec. Council
UN Ed., Sci. and Cult. Org.
World Health Organization
World Meteorological Orga.
World Bank Country Code
GA_MEMB_YR
IAEA
IBRD
IMF
OPEC
SC
UNESCO
WHO
WMO
WB_CNTRY
139
143
144
145
146
147
148
149
150
151
4,N,0
1,N,0
1,N,0
1,N,0
1,N,0
1,N,0
1,N,0
1,N,0
1,N,0
3,C,0
107
111
112
113
114
115
116
117
118
119
4,4,I
1,1,I
1,1,I
1,1,I
1,1,I
1,1,I
1,1,I
1,1,I
1,1,I
3,3,C
Access to Safe Water, 70
Access to Safe Water, 75
Access to Safe Water, 80
Access to Safe Water, 85
Access to Safe Water, 89
Urban Access to Safe H2O, 70
Urban Access to Safe H2O, 75
Urban Access to Safe H2O, 80
Urban Access to Safe H2O, 85
Urban Access to Safe H2O, 89
SAFEH2O70
SAFEH2O75
SAFEH2O80
SAFEH2O85
SAFEH2O89
SAFH2OUB70
SAFH2OUB75
SAFH2OUB80
SAFH2OUB85
SAFH2OUB89
154
160
166
172
178
184
190
196
202
208
6,N,2
6,N,2
6,N,2
6,N,2
6,N,2
6,N,2
6,N,2
6,N,2
6,N,2
6,N,2
122
128
134
140
146
152
158
164
170
176
6,6,N,2
6,6,N,2
6,6,N,2
6,6,N,2
6,6,N,2
6,6,N,2
6,6,N,2
6,6,N,2
6,6,N,2
6,6,N,2
Rural Access to Safe H2O, 65
Rural Access to Safe H2O, 70
Rural Access to Safe H2O, 75
Rural Access to Safe H2O, 80
SAFH2ORB65
SAFH2ORB70
SAFH2ORB75
SAFH2ORB80
214
220
226
232
6,N,2
6,N,2
6,N,2
6,N,2
182
188
194
200
6,6,N,2
6,6,N,2
6,6,N,2
6,6,N,2
continued . . .
July 1992
B-21
Appendix B—ArcWorld 1:3M country statistical attribute layers
Health and Vital Statistics (continued)
Polygon Attribute Table (cont.)
dBASE Columns
Begin
Column
Column
Definition
INFO Items
Begin
Column
Item
Definition
Item Description
Item Name
Rural Access to Safe H2O, 85
Rural Access to Safe H2O, 89
Preval. of Malnutrition, 65
Preval. of Malnutrition, 70
Preval. of Malnutrition, 75
Preval. of Malnutrition, 80
Preval. of Malnutrition, 85
Preval. of Malnutrition, 89
% GDP for Medical Care, 70
% GDP for Medical Care, 75
SAFH2ORB85
SAFH2ORB89
P_MLNUTR65
P_MLNUTR70
P_MLNUTR75
P_MLNUTR80
P_MLNUTR85
P_MLNUTR89
EXP_MED70
EXP_MED75
238
244
250
256
262
268
274
280
286
292
6,N,2
6,N,2
6,N,2
6,N,2
6,N,2
6,N,2
6,N,2
6,N,2
6,N,2
6,N,2
206
212
218
224
230
236
242
248
254
260
6,6,N,2
6,6,N,2
6,6,N,2
6,6,N,2
6,6,N,2
6,6,N,2
6,6,N,2
6,6,N,2
6,6,N,2
6,6,N,2
% GDP for Medical Care, 80
% GDP for Medical Care, 85
% GDP for Medical Care, 89
Doctors per Person, 65
Doctors per Person, 70
Doctors per Person, 75
Doctors per Person, 80
Doctors per Person, 85
Doctors per Person, 89
Nurses per Person, 65
EXP_MED80
EXP_MED85
EXP_MED89
POP_DOCT65
POP_DOCT70
POP_DOCT75
POP_DOCT80
POP_DOCT85
POP_DOCT89
POP_NURS65
298
304
310
316
326
336
346
356
366
376
6,N,2
6,N,2
6,N,2
10,N,0
10,N,0
10,N,0
10,N,0
10,N,0
10,N,0
10,N,0
266
272
278
284
294
304
314
324
334
344
6,6,N,2
6,6,N,2
6,6,N,2
10,10,I
10,10,I
10,10,I
10,10,I
10,10,I
10,10,I
10,10,I
Nurses per Person, 70
Nurses per Person, 75
Nurses per Person, 80
Nurses per Person, 85
Nurses per Person, 89
Hospital Beds per Person, 65
Hospital Beds per Person, 70
Hospital Beds per Person, 75
Hospital Beds per Person, 80
Hospital Beds per Person, 85
POP_NURS70
POP_NURS75
POP_NURS80
POP_NURS85
POP_NURS89
POP_HBED65
POP_HBED70
POP_HBED75
POP_HBED80
POP_HBED85
386
396
406
416
426
436
446
456
466
476
10,N,0
10,N,0
10,N,0
10,N,0
10,N,0
10,N,0
10,N,0
10,N,0
10,N,0
10,N,0
354
364
374
384
394
404
414
424
434
444
10,10,I
10,10,I
10,10,I
10,10,I
10,10,I
10,10,I
10,10,I
10,10,I
10,10,I
10,10,I
Hospital Beds per Person, 89
Crude Birth Rate, 65
Crude Birth Rate, 70
Crude Birth Rate, 75
Crude Birth Rate, 80
Crude Birth Rate, 85
POP_HBED89
BIR_RATE65
BIR_RATE70
BIR_RATE75
BIR_RATE80
BIR_RATE85
486
496
502
508
514
520
10,N,0
6,N,1
6,N,1
6,N,1
6,N,1
6,N,1
454
464
470
476
482
488
10,10,I
6,6,N,1
6,6,N,1
6,6,N,1
6,6,N,1
6,6,N,1
continued . . .
B-22
ArcWorld User's Guide and Data Reference
Appendix B—ArcWorld 1:3M country statistical attribute layers
Health and Vital Statistics (continued)
Polygon Attribute Table (cont.)
dBASE Columns
Begin
Column
Column
Definition
INFO Items
Begin
Column
Item
Definition
Item Desc ription
Item Name
Crude Birth Rate, 89
Fertility Rate (per Woman), 65
Fertility Rate (per Woman), 70
Fertility Rate (per Woman), 75
Fertility Rate (per Woman), 80
Fertility Rate (per Woman), 85
Fertility Rate (per Woman), 89
Contraception Preval., 70
Contraception Preval., 75
Contraception Preval., 80
BIR_RATE89
FERTILTY65
FERTILTY70
FERTILTY75
FERTILTY80
FERTILTY85
FERTILTY89
CONTRCPF70
CONTRCPF75
CONTRCPF80
526
532
538
544
550
556
562
568
574
580
6,N,1
6,N,2
6,N,2
6,N,2
6,N,2
6,N,2
6,N,2
6,N,2
6,N,2
6,N,2
494
500
506
512
518
524
530
536
542
548
6,6,N,1
6,6,N,2
6,6,N,2
6,6,N,2
6,6,N,2
6,6,N,2
6,6,N,2
6,6,N,2
6,6,N,2
6,6,N,2
Contraception Preval., 85
Contraception Preval., 89
Urban Child/Woman Ratio, 65
Urban Child/Woman Ratio, 70
Urban Child/Woman Ratio, 75
Urban Child/Woman Ratio, 80
Urban Child/Woman Ratio, 85
Urban Child/Woman Ratio, 89
Rural Child/Woman Ratio, 65
Rural Child/Woman Ratio, 70
CONTRCPF85
CONTRCPF89
CHLD_W_U65
CHLD_W_U70
CHLD_W_U75
CHLD_W_U80
CHLD_W_U85
CHLD_W_U89
CHLD_W_R65
CHLD_W_R70
586
592
598
604
610
616
622
628
634
640
6,N,2
6,N,2
6,N,1
6,N,1
6,N,1
6,N,1
6,N,1
6,N,1
6,N,1
6,N,1
554
560
566
572
578
584
590
596
602
608
6,6,N,2
6,6,N,2
6,6,N,1
6,6,N,1
6,6,N,1
6,6,N,1
6,6,N,1
6,6,N,1
6,6,N,1
6,6,N,1
Rural Child/Woman Ratio, 75
Rural Child/Woman Ratio, 80
Rural Child/Woman Ratio, 85
Rural Child/Woman Ratio, 89
Crude Death Rate, 65
Crude Death Rate, 70
Crude Death Rate, 75
Crude Death Rate, 80
Crude Death Rate, 85
Crude Death Rate, 89
CHLD_W_R75
CHLD_W_R80
CHLD_W_R85
CHLD_W_R89
DTH_RATE65
DTH_RATE70
DTH_RATE75
DTH_RATE80
DTH_RATE85
DTH_RATE89
646
652
658
664
670
676
682
688
694
700
6,N,1
6,N,1
6,N,1
6,N,1
6,N,1
6,N,1
6,N,1
6,N,1
6,N,1
6,N,1
614
620
626
632
638
644
650
656
662
668
6,6,N,1
6,6,N,1
6,6,N,1
6,6,N,1
6,6,N,1
6,6,N,1
6,6,N,1
6,6,N,1
6,6,N,1
6,6,N,1
Infant Mortality Rate, 65
Infant Mortality Rate, 70
Infant Mortality Rate, 75
Infant Mortality Rate, 80
Infant Mortality Rate, 85
Infant Mortality Rate, 89
INF_DTH65
INF_DTH70
INF_DTH75
INF_DTH80
INF_DTH85
INF_DTH89
706
712
718
724
730
736
6,N,2
6,N,2
6,N,2
6,N,2
6,N,2
6,N,2
674
680
686
692
698
704
6,6,N,2
6,6,N,2
6,6,N,2
6,6,N,2
6,6,N,2
6,6,N,2
continued . . .
July 1992
B-23
Appendix B—ArcWorld 1:3M country statistical attribute layers
Health and Vital Statistics (continued)
Polygon Attribute Table (cont.)
dBASE Columns
Item Description
Item Name
Under 5 Death Rate, 85
Under 5 Death Rate, 89
Life Expectancy (at birth), 65
Life Expectancy (at birth), 70
Life Expectancy (at birth), 75
Life Expectancy (at birth), 80
Life Expectancy (at birth), 85
Life Expectancy (at birth), 89
Life Expectancy (Females), 65
Life Expectancy (Females), 70
Life Expectancy (Females), 75
Life Expectancy (Females), 80
Life Expectancy (Females), 85
Life Expectancy (Females), 89
DTHUND5_85
DTHUND5_89
LIFE_EXP65
LIFE_EXP70
LIFE_EXP75
LIFE_EXP80
LIFE_EXP85
LIFE_EXP89
LIFEXP_F65
LIFEXP_F70
LIFEXP_F75
LIFEXP_F80
LIFEXP_F85
LIFEXP_F89
Begin
Column
742
748
754
760
766
772
778
784
790
796
802
808
814
820
Column
Definition
6,N,2
6,N,2
6,N,2
6,N,2
6,N,2
6,N,2
6,N,2
6,N,2
6,N,2
6,N,2
6,N,2
6,N,2
6,N,2
6,N,2
INFO Items
Begin
Column
710
716
722
728
734
740
746
752
758
764
770
776
782
788
Item
Definition
6,6,N,2
6,6,N,2
6,6,N,2
6,6,N,2
6,6,N,2
6,6,N,2
6,6,N,2
6,6,N,2
6,6,N,2
6,6,N,2
6,6,N,2
6,6,N,2
6,6,N,2
6,6,N,2
Arc Attribute Table
dBASE Columns
Item Description
Item Name
Boundary Type Code
Boundary Type Name
Int. Boundary Status
Boundary Coincidence
Adjoining Country 1 Code
Adjoining Country 2 Code
Adjoining Country Names
Adjoining Region Abbrev.
Adjoining Continent Abbrev.
TYPE
BND_TYPE
BND_STATUS
BND_COINC
COUNTRY1
COUNTRY2
CNTRY_NAME
REGION
CONTINENT
B-24
Begin
Column
80
81
91
92
93
95
97
138
147
Column
Definition
1,N,0
10,C,0
1,N,0
1,N,0
2,C,0
2,C,0
41,C,0
9,C,0
7,C,0
INFO Items
Begin
Column
Item
Definition
29
30
40
41
42
44
46
87
96
1,1,I
10,10,C
1,1,I
1,1,I
2,2,C
2,2,C
41,41,C
9,9,C
7,7,C
ArcWorld User's Guide and Data Reference
Appendix B—ArcWorld 1:3M country statistical attribute layers
Labor Force Characteristics
Coverage Names:
Layer Type:
LABOR
Polygon and Line
Polygon Attribute Table
dBASE Columns
Begin
Column
Column
Definition
INFO Items
Begin
Column
Item
Definition
Item D escription
Item Name
Country FIPS Code
Country Name
World Region Name
Continent Name
Land/Water Identifier
Island Carto. Display Rank
Statistical Flag
European Econ. Community
Food and Agriculture Org.
UN General Assembly
COUNTRY
CNTRY_NAME
REGION
CONTINENT
LAND_OCEAN
ISLND_RANK
STAT_FLAG
EEC
FAO
GA
49
51
91
112
125
134
135
136
137
138
2,C,0
40,C,0
21,C,0
13,C,0
9,C,0
1,N,0
1,N,0
1,N,0
1,N,0
1,N,0
17
19
59
80
93
102
103
104
105
106
2,2,C
40,40,C
21,21,C
13,13,C
9,9,C
1,1,I
1,1,I
1,1,I
1,1,I
1,1,I
UN Gen. Assembly (year)
Int. Atomic Energy Agency
Int. Recon. Dev. (World Bank)
Int. Monetary Fund
Org. of Petrol. Exp. Countries
United Nations Sec. Council
UN Ed., Sci. and Cult. Org.
World Health Organization
World Meteorological Orga.
World Bank Country Code
GA_MEMB_YR
IAEA
IBRD
IMF
OPEC
SC
UNESCO
WHO
WMO
WB_CNTRY
139
143
144
145
146
147
148
149
150
151
4,N,0
1,N,0
1,N,0
1,N,0
1,N,0
1,N,0
1,N,0
1,N,0
1,N,0
3,C,0
107
111
112
113
114
115
116
117
118
119
4,4,I
1,1,I
1,1,I
1,1,I
1,1,I
1,1,I
1,1,I
1,1,I
1,1,I
3,3,C
Total Labor Force, 65
Total Labor Force, 70
Total Labor Force, 75
Total Labor Force, 80
Total Labor Force, 85
Total Labor Force, 89
% of Labor Force in Agri., 65
% of Labor Force in Agri., 70
% of Labor Force in Agri., 75
% of Labor Force in Agri., 80
LABORFOR65
LABORFOR70
LABORFOR75
LABORFOR80
LABORFOR85
LABORFOR89
P_AGRIC65
P_AGRIC70
P_AGRIC75
P_AGRIC80
154
164
174
184
194
204
214
227
240
253
10,N,0
10,N,0
10,N,0
10,N,0
10,N,0
10,N,0
13,N,6
13,N,6
13,N,6
13,N,6
122
132
142
152
162
172
182
186
190
194
10,10,I
10,10,I
10,10,I
10,10,I
10,10,I
10,10,I
4,8,F,2
4,8,F,2
4,8,F,2
4,8,F,2
% of Labor Force in Agri., 85
% of Labor Force in Agri., 89
% Labor Force in Indust., 65
% Labor Force in Indust., 70
P_AGRIC85
P_AGRIC89
P_INDUS65
P_INDUS70
266
279
292
305
13,N,6
13,N,6
13,N,6
13,N,6
198
202
206
210
4,8,F,2
4,8,F,2
4,8,F,2
4,8,F,2
continued . . .
July 1992
B-25
Appendix B—ArcWorld 1:3M country statistical attribute layers
Labor Force Characteristics (continued)
Polygon Attribute Table (cont.)
dBASE Columns
Begin
Column
Column
Definition
INFO Items
Begin
Column
Item
Definition
Item Description
Item Name
% Labor Force in Indust., 75
% Labor Force in Indust., 80
% Labor Force in Indust., 85
% Labor Force in Indust., 89
% of Labor Force, Female, 65
% of Labor Force, Female, 70
% of Labor Force, Female, 75
% of Labor Force, Female, 80
% of Labor Force, Female, 85
% of Labor Force, Female, 89
P_INDUS75
P_INDUS80
P_INDUS85
P_INDUS89
P_FEMALE65
P_FEMALE70
P_FEMALE75
P_FEMALE80
P_FEMALE85
P_FEMALE89
318
331
344
357
370
376
382
388
394
400
13,N,6
13,N,6
13,N,6
13,N,6
6,N,2
6,N,2
6,N,2
6,N,2
6,N,2
6,N,2
214
218
222
226
230
236
242
248
254
260
4,8,F,2
4,8,F,2
4,8,F,2
4,8,F,2
6,6,N,2
6,6,N,2
6,6,N,2
6,6,N,2
6,6,N,2
6,6,N,2
Urban Female/Male Ratios, 65
Urban Female/Male Ratios, 70
Urban Female/Male Ratios, 75
Urban Female/Male Ratios, 80
Urban Female/Male Ratios, 85
Urban Female/Male Ratios, 89
Rural Female/Male Ratios, 65
Rural Female/Male Ratios, 70
Rural Female/Male Ratios, 75
Rural Female/Male Ratios, 80
FEM_URB65
FEM_URB70
FEM_URB75
FEM_URB80
FEM_URB85
FEM_URB89
FEM_RUR65
FEM_RUR70
FEM_RUR75
FEM_RUR80
406
412
418
424
430
436
442
448
454
460
6,N,1
6,N,1
6,N,1
6,N,1
6,N,1
6,N,1
6,N,1
6,N,1
6,N,1
6,N,1
266
272
278
284
290
296
302
308
314
320
6,6,N,1
6,6,N,1
6,6,N,1
6,6,N,1
6,6,N,1
6,6,N,1
6,6,N,1
6,6,N,1
6,6,N,1
6,6,N,1
Rural Female/Male Ratios, 85
Rural Female/Male Ratios, 89
Labor Participation Rate, 65
Labor Participation Rate, 70
Labor Participation Rate, 75
Labor Participation Rate, 80
Labor Participation Rate, 85
Labor Participation Rate, 89
Female Labor Part. Rate, 65
Female Labor Part. Rate, 70
FEM_RUR85
FEM_RUR89
PARTICIP65
PARTICIP70
PARTICIP75
PARTICIP80
PARTICIP85
PARTICIP89
PARTCP_F65
PARTCP_F70
466
472
478
484
490
496
502
508
514
520
6,N,1
6,N,1
6,N,2
6,N,2
6,N,2
6,N,2
6,N,2
6,N,2
6,N,2
6,N,2
326
332
338
344
350
356
362
368
374
380
6,6,N,1
6,6,N,1
6,6,N,2
6,6,N,2
6,6,N,2
6,6,N,2
6,6,N,2
6,6,N,2
6,6,N,2
6,6,N,2
Female Labor Part. Rate, 75
Female Labor Part. Rate, 80
Female Labor Part. Rate, 85
Female Labor Part. Rate, 89
PARTCP_F75
PARTCP_F80
PARTCP_F85
PARTCP_F89
526
532
538
544
6,N,2
6,N,2
6,N,2
6,N,2
386
392
398
404
6,6,N,2
6,6,N,2
6,6,N,2
6,6,N,2
B-26
ArcWorld User's Guide and Data Reference
Appendix B—ArcWorld 1:3M country statistical attribute layers
Labor Force Characteristics (continued)
Arc Attribute Table
dBASE Columns
Item Description
Item Name
Boundary Type Code
Boundary Type Name
Int. Boundary Status
Boundary Coincidence
Adjoining Country 1 Code
Adjoining Country 2 Code
Adjoining Country Names
Adjoining Region Abbrev.
Adjoining Continent Abbrev.
TYPE
BND_TYPE
BND_STATUS
BND_COINC
COUNTRY1
COUNTRY2
CNTRY_NAME
REGION
CONTINENT
July 1992
Begin
Column
80
81
91
92
93
95
97
138
147
Column
Definition
1,N,0
10,C,0
1,N,0
1,N,0
2,C,0
2,C,0
41,C,0
9,C,0
7,C,0
INFO Items
Begin
Column
Item
Definition
29
30
40
41
42
44
46
87
96
1,1,I
10,10,C
1,1,I
1,1,I
2,2,C
2,2,C
41,41,C
9,9,C
7,7,C
B-27
Appendix B—ArcWorld 1:3M country statistical attribute layers
Natural Resources and the Environment
Coverage Names:
Layer Type:
WRI_3M
Polygon and Line
Polygon Attribute Table
dBASE Columns
Begin
Column
Column
Definition
INFO Items
Begin
Column
Item
Definition
Item Description
Item Name
Country FIPS Code
Country Name
World Region Name
Continent Name
Land/Water Identifier
Island Carto. Display Rank
Statistical Flag
European Econ. Community
Food and Agriculture Org.
UN General Assembly
COUNTRY
CNTRY_NAME
REGION
CONTINENT
LAND_OCEAN
ISLND_RANK
STAT_FLAG
EEC
FAO
GA
49
51
91
112
125
134
135
136
137
138
2,C,0
40,C,0
21,C,0
13,C,0
9,C,0
1,N,0
1,N,0
1,N,0
1,N,0
1,N,0
17
19
59
80
93
102
103
104
105
106
2,2,C
40,40,C
21,21,C
13,13,C
9,9,C
1,1,I
1,1,I
1,1,I
1,1,I
1,1,I
UN Gen. Assembly (year)
Int. Atomic Energy Agency
Int. Recon. Dev. (World Bank)
Int. Monetary Fund
Org. of Petrol. Exp. Countries
United Nations Sec. Council
UN Ed., Sci. and Cult. Org.
World Health Organization
World Meteorological Orga.
World Res. Inst. Country Code
GA_MEMB_YR
IAEA
IBRD
IMF
OPEC
SC
UNESCO
WHO
WMO
WRI_CNTRY
139
143
144
145
146
147
148
149
150
151
4,N,0
1,N,0
1,N,0
1,N,0
1,N,0
1,N,0
1,N,0
1,N,0
1,N,0
2,C,0
107
111
112
113
114
115
116
117
118
119
4,4,I
1,1,I
1,1,I
1,1,I
1,1,I
1,1,I
1,1,I
1,1,I
1,1,I
2,2,C
Agri. percentage of GDP
Indust. percentage of GDP
Services, % of GDP
Govt. Expenditure % of GDP
Govt. Expenditure per Capita
Govt. Expenditure for Defense
Govt. Expend. for Education
Govt. Expenditure for Health
Gov. Exp. SocS/Welf./Houses
Govt. Exp. Recrea/Cult/Relig
P_AGGDPR88
P_INDGDP88
P_SERGDP88
P_GVTGDP89
GVT_CAP89
GVDEFENS89
GVEDUCAT89
GVHEALTH89
GVWLFHSE89
GVRECCLR89
153
163
173
183
193
203
213
223
233
243
10,N,2
10,N,2
10,N,2
10,N,2
10,N,2
10,N,2
10,N,2
10,N,2
10,N,2
10,N,2
121
131
141
151
161
171
181
191
201
211
10,10,N,2
10,10,N,2
10,10,N,2
10,10,N,2
10,10,N,2
10,10,N,2
10,10,N,2
10,10,N,2
10,10,N,2
10,10,N,2
Gov. Exp. Agr/For./Fish/Hunt
Gov. Exp. for Trans./Comm.
Availabil. Safe Urban Water
Availabil. Safe Rural Water
GVAGFORF89
GVTRNCOM89
SAFH2OUR88
SAFH2ORR88
253
263
273
283
10,N,2
10,N,2
10,N,2
10,N,2
221
231
241
251
10,10,N,2
10,10,N,2
10,10,N,2
10,10,N,2
continued . . .
B-28
ArcWorld User's Guide and Data Reference
Appendix B—ArcWorld 1:3M country statistical attribute layers
Natural Resources and the Environment (continued)
Polygon Attribute Table (cont.)
dBASE Columns
Item Description
Item Name
Begin
Column
Column
Definition
INFO Items
Begin
Column
Item
Definition
Available Urban Sanitation
SANITATU80
Available Rural Sanitation
SANITATR80
Available Health Services
HLTHSERV88
% Females Finishing Prim Schl PRIMRY_F89
% Male Finishing Primary Schl PRIMRY_M89
% Fem. with Some Second Schl POSTSECF89
% Male with Some Second Schl POSTSECM89
% Oral Rehydro/Diarrhea Use
ORTUSE_R88
% TB Immunized (age 1 year)
IMMUN_TB90
% DPT Immunized (age 1 year) IM_DPT90
293
303
313
323
333
343
353
363
373
383
10,N,2
10,N,2
10,N,2
10,N,2
10,N,2
10,N,2
10,N,2
10,N,2
10,N,2
10,N,2
261
271
281
291
301
311
321
331
341
351
10,10,N,2
10,10,N,2
10,10,N,2
10,10,N,2
10,10,N,2
10,10,N,2
10,10,N,2
10,10,N,2
10,10,N,2
10,10,N,2
% Polio Immunized (age 1 year)
% Measles Immun. (age 1 year)
Couples Using Birth Control
Percent of Wilderness Area
Persons per Household
Non-Electric Households
Total Roads per 1K sq. km
Paved Roads per 1K sq. km
Number of Public Airports
Amount of Cropland
IM_POLIO90
IM_MEASL90
CONTRCEP89
WILDERNS88
HHLDSIZR86
HHWOELEC82
TOTROADS89
PAVEDRDS89
AIRPORTS89
CROPLAND89
393
403
413
423
433
443
453
463
473
483
10,N,2
10,N,2
10,N,2
10,N,2
10,N,2
10,N,2
10,N,2
10,N,2
10,N,2
10,N,2
361
371
381
391
401
411
421
431
441
451
10,10,N,2
10,10,N,2
10,10,N,2
10,10,N,2
10,10,N,2
10,10,N,2
10,10,N,2
10,10,N,2
10,10,N,2
10,10,N,2
Annual Fertilizer Use
Cereal Food Aid Received
Land with "No Soil Limits"
Total Closed Forest Area
Total Open Forest Area
Total Forest Plantation Area
Total Other Wooded Area
Annual Deforest/Closed Forest
% Deforested/Closed Forest
Annual Deforest/Total Forest
FERTILZE89
AIDCERLR89
NOSOILCN89
CLOSEFOR80
OPENFOR80
PLANTATN80
OTHWOODS80
DEFORCLO85
P_DEFCLO85
DEFORTOT85
493
503
513
523
533
543
553
563
573
583
10,N,2
10,N,2
10,N,2
10,N,2
10,N,2
10,N,2
10,N,2
10,N,2
10,N,2
10,N,2
461
471
481
491
501
511
521
531
541
551
10,10,N,2
10,10,N,2
10,10,N,2
10,10,N,2
10,10,N,2
10,10,N,2
10,10,N,2
10,10,N,2
10,10,N,2
10,10,N,2
% Deforested/Total Forest
Most Recent Deforested Est.
Reforestation Area
Managed Closed Forest Area
Protected Closed Forest Area
% National Land Protected
No. Marine/Coastal Protected
P_DEFTOT85
ESTDEFOR89
REFOREST85
MANGCLOF80
PROTCLOF80
P_PROTLN90
PRMARINE90
593
603
613
623
633
643
653
10,N,2
10,N,2
10,N,2
10,N,2
10,N,2
10,N,2
10,N,2
561
571
581
591
601
611
621
10,10,N,2
10,10,N,2
10,10,N,2
10,10,N,2
10,10,N,2
10,10,N,2
10,10,N,2
continued . . .
July 1992
B-29
Appendix B—ArcWorld 1:3M country statistical attribute layers
Natural Resources and the Environment (continued)
Polygon Attribute Table (cont.)
dBASE Columns
Begin
Column
Column
Definition
INFO Items
Begin
Column
Item
Definition
Item Description
Item Name
Area Marine/Coastal Protected
No. of Biosphere Reserves
Area of Biosphere Reserves
No. Intnl. Significant Wetlands
Area. Intnl. Signif. Wetlands
No. Known Mammal Species
No. Endangered Mam. Species
No. of Known Bird Spec.
No. Endangered Bird Spec.
No. of Known Reptile Spec.
PRMARN_A90
BIORESRV90
BIORES_A90
WETLANDS90
WETLND_A90
MAMLSPEC90
MAMLTHRT89
BIRDSPEC89
BIRDTHRT89
REPTSPEC89
663
673
683
693
703
713
723
733
743
753
10,N,2
10,N,2
10,N,2
10,N,2
10,N,2
10,N,2
10,N,2
10,N,2
10,N,2
10,N,2
631
641
651
661
671
681
691
701
711
721
10,10,N,2
10,10,N,2
10,10,N,2
10,10,N,2
10,10,N,2
10,10,N,2
10,10,N,2
10,10,N,2
10,10,N,2
10,10,N,2
No. Endangered Reptile Spec.
No. of Known Amphib. Spec.
No. Endang Amphibian Spec
No. Known Fresh. Fish Spec
No. Endanger Fresh. Fish Sp.
Number of Known Plant Tax
Percentage of Endemic Flora
Number Endang. Plant Taxa.
No. Threatened Plants/1k Taxa.
Threat Plant Taxa/1K sq. km
REPTTHRT89
AMPHSPEC89
AMPHTHRT89
FFSHSPEC89
FFSHTHRT89
PLANTAXA91
P_ENDMFL91
PLANTHRT91
PLTHR_1K91
PLTHR_KM91
763
773
783
793
803
813
823
833
843
853
10,N,2
10,N,2
10,N,2
10,N,2
10,N,2
10,N,2
10,N,2
10,N,2
10,N,2
10,N,2
731
741
751
761
771
781
791
801
811
821
10,10,N,2
10,10,N,2
10,10,N,2
10,10,N,2
10,10,N,2
10,10,N,2
10,10,N,2
10,10,N,2
10,10,N,2
10,10,N,2
Energy Production/Solid Fuel
Energy Product./Liquid Fuel
Energy Product./Gaseous Fuel
Energy Prod./Geotherm./Wind
Energy Production/Hydro
Energy Production/Nuclear
Energy Production/Total
Total Energy Consumption
Enrg. Consump. Cons. 87$
Energy Imports/% of Consump.
PROD_SOL89
PROD_LIQ89
PROD_GAS89
PRDGEOWN89
PRDHYDRO89
PRDNUCLR89
PROD_TOT89
CONS_TOT89
CONS_87_89
ENRG_IMP89
863
873
883
893
903
913
923
933
943
953
10,N,2
10,N,2
10,N,2
10,N,2
10,N,2
10,N,2
10,N,2
10,N,2
10,N,2
10,N,2
831
841
851
861
871
881
891
901
911
921
10,10,N,2
10,10,N,2
10,10,N,2
10,10,N,2
10,10,N,2
10,10,N,2
10,10,N,2
10,10,N,2
10,10,N,2
10,10,N,2
Traditional Fuels Consumption
Trad. Fuels/% of Total Required
Indust. Energy Inten. (joules/$)
Agri. Energy Inten. (joules/$)
Annual Urban Waste per Capita
Avg. Annual Marine Catch
Total Aquaculture Production
TRFLCONS89
P_TRFUEL89
ENRINTIN89
ENRINTAG89
MUNWASTE89
MRNCATCH89
AQCULTPR89
963
973
983
993
1003
1013
1023
10,N,2
10,N,2
10,N,2
10,N,2
10,N,2
10,N,2
10,N,2
931
941
951
961
971
981
991
10,10,N,2
10,10,N,2
10,10,N,2
10,10,N,2
10,10,N,2
10,10,N,2
10,10,N,2
continued . . .
B-30
ArcWorld User's Guide and Data Reference
Appendix B—ArcWorld 1:3M country statistical attribute layers
Natural Resources and the Environment (continued)
Polygon Attribute Table (cont.)
dBASE Columns
Item Description
Item Name
Fish % Food Supply/per Capita
Ind. CO2 Emis. - Sol. Fuels
CO2 Emissions - Liquid Fuels
Ind. CO2 Emis. - Gas Fuels
CO2 Emissions - Gas Flarings
CO2 Emissions - Cement Mfg.
Ind. CO2 Emissions - Total
Ind. CO2 Emissions - per Cap.
CO2 Emissions - Deforestation
Total Methane Emissions
Total CFC Emissions
Sulphur Dioxide Emissions
FOODFISH88
CO2_SOL89
CO2_LIQ89
CO2_GAS89
CO2GASFL89
CO2CEMNT89
CO2_TOT70
CO2_CAP89
CO2DEFOR89
METHANE89
CFC89
SO2_89
Begin
Column
1033
1043
1053
1063
1073
1083
1093
1103
1113
1123
1133
1143
Column
Definition
10,N,2
10,N,2
10,N,2
10,N,2
10,N,2
10,N,2
10,N,2
10,N,2
10,N,2
10,N,2
10,N,2
10,N,2
INFO Items
Begin
Column
1001
1011
1021
1031
1041
1051
1061
1071
1081
1091
1101
1111
Item
Definition
10,10,N,2
10,10,N,2
10,10,N,2
10,10,N,2
10,10,N,2
10,10,N,2
10,10,N,2
10,10,N,2
10,10,N,2
10,10,N,2
10,10,N,2
10,10,N,2
Arc Attribute Table
dBASE Columns
Item Description
Item Name
Boundary Type Code
Boundary Type Name
Int. Boundary Status
Boundary Coincidence
Adjoining Country 1 Code
Adjoining Country 2 Code
Adjoining Country Names
Adjoining Region Abbrev.
Adjoining Continent Abbrev.
TYPE
BND_TYPE
BND_STATUS
BND_COINC
COUNTRY1
COUNTRY2
CNTRY_NAME
REGION
CONTINENT
July 1992
Begin
Column
80
81
91
92
93
95
97
138
147
Column
Definition
1,N,0
10,C,0
1,N,0
1,N,0
2,C,0
2,C,0
41,C,0
9,C,0
7,C,0
INFO Items
Begin
Column
Item
Definition
29
30
40
41
42
44
46
87
96
1,1,I
10,10,C
1,1,I
1,1,I
2,2,C
2,2,C
41,41,C
9,9,C
7,7,C
B-31
Appendix B—ArcWorld 1:3M country statistical attribute layers
Population Characteristics
Coverage Name:
Layer Type:
POP_GEO
Polygon and Line
Polygon Attribute Table
dBASE Columns
Begin
Column
Column
Definition
INFO Items
Begin
Column
Item
Definition
Item Description
Item Name
Country FIPS Code
Country Name
World Region Name
Continent Name
Land/Water Identifier
Island Carto. Display Rank
Statistical Flag
European Econ. Community
Food and Agriculture Org.
UN General Assembly
COUNTRY
CNTRY_NAME
REGION
CONTINENT
LAND_OCEAN
ISLND_RANK
STAT_FLAG
EEC
FAO
GA
49
51
91
112
125
134
135
136
137
138
2,C,0
40,C,0
21,C,0
13,C,0
9,C,0
1,N,0
1,N,0
1,N,0
1,N,0
1,N,0
17
19
59
80
93
102
103
104
105
106
2,2,C
40,40,C
21,21,C
13,13,C
9,9,C
1,1,I
1,1,I
1,1,I
1,1,I
1,1,I
UN Gen. Assembly (year)
Int. Atomic Energy Agency
Int. Recon. Dev. (World Bank)
Int. Monetary Fund
Org. of Petrol. Exp. Countries
United Nations Sec. Council
UN Ed., Sci. and Cult. Org.
World Health Organization
World Meteorological Orga.
World Bank Country Code
GA_MEMB_YR
IAEA
IBRD
IMF
OPEC
SC
UNESCO
WHO
WMO
WB_CNTRY
139
143
144
145
146
147
148
149
150
151
4,N,0
1,N,0
1,N,0
1,N,0
1,N,0
1,N,0
1,N,0
1,N,0
1,N,0
3,C,0
107
111
112
113
114
115
116
117
118
119
4,4,I
1,1,I
1,1,I
1,1,I
1,1,I
1,1,I
1,1,I
1,1,I
1,1,I
3,3,C
Total Population, 65
Total Population, 70
Total Population, 75
Total Population, 80
Total Population, 85
Total Population, 89
% Pop. Ages 0 to 14 Yrs., 65
% Pop. Ages 0 to 14 Yrs., 70
% Pop. Ages 0 to 14 Yrs., 75
% Pop. Ages 0 to 14 Yrs., 80
TOTPOP65
TOTPOP70
TOTPOP75
TOTPOP80
TOTPOP85
TOTPOP89
P_0_14_65
P_0_14_70
P_0_14_75
P_0_14_80
154
167
180
193
206
219
232
238
244
250
13,N,0
13,N,0
13,N,0
13,N,0
13,N,0
13,N,0
6,N,2
6,N,2
6,N,2
6,N,2
122
135
148
161
174
187
200
206
212
218
13,13,I
13,13,I
13,13,I
13,13,I
13,13,I
13,13,I
6,6,N,2
6,6,N,2
6,6,N,2
6,6,N,2
% Pop. Ages 0 to 14 Yrs., 85
% Pop. Ages 0 to 14 Yrs., 89
% Pop. Ages 15 to 64 Yrs., 65
% Pop. Ages 15 to 64 Yrs., 70
P_0_14_85
P_0_14_89
P_15_64_65
P_15_64_70
256
262
268
274
6,N,2
6,N,2
6,N,2
6,N,2
224
230
236
242
6,6,N,2
6,6,N,2
6,6,N,2
6,6,N,2
continued . . .
B-32
ArcWorld User's Guide and Data Reference
Appendix B—ArcWorld 1:3M country statistical attribute layers
Population Characteristics (continued)
Polygon Attribute Table (cont.)
dBASE Columns
Begin
Column
Column
Definition
INFO Items
Begin
Column
Item
Definition
Item Description
Item Name
% Pop. Ages 15 to 64 Yrs., 75
% Pop. Ages 15 to 64 Yrs., 80
% Pop. Ages 15 to 64 Yrs., 85
% Pop. Ages 15 to 64 Yrs., 89
Age Dependency Ratio, 65
Age Dependency Ratio, 70
Age Dependency Ratio, 75
Age Dependency Ratio, 80
Age Dependency Ratio, 85
Age Dependency Ratio, 89
P_15_64_75
P_15_64_80
P_15_64_85
P_15_64_89
AGERATIO65
AGERATIO70
AGERATIO75
AGERATIO80
AGERATIO85
AGERATIO89
280
286
292
298
304
310
316
322
328
334
6,N,2
6,N,2
6,N,2
6,N,2
6,N,2
6,N,2
6,N,2
6,N,2
6,N,2
6,N,2
248
254
260
266
272
278
284
290
296
302
6,6,N,2
6,6,N,2
6,6,N,2
6,6,N,2
6,6,N,2
6,6,N,2
6,6,N,2
6,6,N,2
6,6,N,2
6,6,N,2
Urban Population (percent), 65
Urban Population (percent), 70
Urban Population (percent), 75
Urban Population (percent), 80
Urban Population (percent), 85
Urban Population (percent), 89
Female/100 Males (Urban), 65
Female/100 Males (Urban), 70
Female/100 Males (Urban), 75
Female/100 Males (Urban), 80
P_URBAN65
P_URBAN70
P_URBAN75
P_URBAN80
P_URBAN85
P_URBAN89
FEM_URB65
FEM_URB70
FEM_URB75
FEM_URB80
340
346
352
358
364
370
376
382
388
394
6,N,2
6,N,2
6,N,2
6,N,2
6,N,2
6,N,2
6,N,1
6,N,1
6,N,1
6,N,1
308
314
320
326
332
338
344
350
356
362
6,6,N,2
6,6,N,2
6,6,N,2
6,6,N,2
6,6,N,2
6,6,N,2
6,6,N,1
6,6,N,1
6,6,N,1
6,6,N,1
Female/100 Males (Urban), 85
Female/100 Males (Urban), 89
Female/100 Males (Rural), 65
Female/100 Males (Rural), 70
Female/100 Males (Rural), 75
Female/100 Males (Rural), 80
Female/100 Males (Rural), 85
Female/100 Males (Rural), 89
Annual Pop. Growth Rate, 65
Annual Pop. Growth Rate, 70
FEM_URB85
FEM_URB89
FEM_RUR65
FEM_RUR70
FEM_RUR75
FEM_RUR80
FEM_RUR85
FEM_RUR89
GRW_RATE65
GRW_RATE70
400
406
412
418
424
430
436
442
448
454
6,N,1
6,N,1
6,N,1
6,N,1
6,N,1
6,N,1
6,N,1
6,N,1
6,N,2
6,N,2
368
374
380
386
392
398
404
410
416
422
6,6,N,1
6,6,N,1
6,6,N,1
6,6,N,1
6,6,N,1
6,6,N,1
6,6,N,1
6,6,N,1
6,6,N,2
6,6,N,2
Annual Pop. Growth Rate, 75
Annual Pop. Growth Rate, 80
Annual Pop. Growth Rate, 85
Annual Pop. Growth Rate, 89
Urban Pop. Growth Rate, 65
Urban Pop. Growth Rate, 70
Urban Pop. Growth Rate, 75
GRW_RATE75
GRW_RATE80
GRW_RATE85
GRW_RATE89
URBGRWRT65
URBGRWRT70
URBGRWRT75
460
466
472
478
484
490
496
6,N,2
6,N,2
6,N,2
6,N,2
6,N,2
6,N,2
6,N,2
428
434
440
446
452
458
464
6,6,N,2
6,6,N,2
6,6,N,2
6,6,N,2
6,6,N,2
6,6,N,2
6,6,N,2
continued . . .
July 1992
B-33
Appendix B—ArcWorld 1:3M country statistical attribute layers
Population Characteristics (continued)
Polygon Attribute Table (cont.)
dBASE Columns
Begin
Column
Column
Definition
INFO Items
Begin
Column
Item
Definition
Item Desc ription
Item Name
Urban Pop. Growth Rate, 80
Urban Pop. Growth Rate, 85
Urban Pop. Growth Rate, 89
Urb./Rural Grwth. Different, 65
Urb./Rural Grwth. Different, 70
Urb./Rural Grwth. Different, 75
Urb./Rural Grwth. Different, 80
Urb./Rural Grwth. Different, 85
Urb./Rural Grwth. Different, 89
Project Year 2000 Population
URBGRWRT80
URBGRWRT85
URBGRWRT89
U_R_DIFF65
U_R_DIFF70
U_R_DIFF75
U_R_DIFF80
U_R_DIFF85
U_R_DIFF89
POP2000_89
502
508
514
520
526
532
538
544
550
556
6,N,2
6,N,2
6,N,2
6,N,1
6,N,1
6,N,1
6,N,1
6,N,1
6,N,1
13,N,0
470
476
482
488
494
500
506
512
518
524
6,6,N,2
6,6,N,2
6,6,N,2
6,6,N,1
6,6,N,1
6,6,N,1
6,6,N,1
6,6,N,1
6,6,N,1
13,13,I
Stationary Population Size
Total Land Area, 65
Total Land Area, 70
Total Land Area, 75
Total Land Area, 80
Total Land Area, 85
Total Land Area, 89
Pop. Density (sq. km), 65
Pop. Density (sq. km), 70
Pop. Density (sq. km), 75
STATPOP89
LANDAREA65
LANDAREA70
LANDAREA75
LANDAREA80
LANDAREA85
LANDAREA89
POPDNSTY65
POPDNSTY70
POPDNSTY75
569
582
592
602
612
622
632
642
655
668
13,N,0
10,N,0
10,N,0
10,N,0
10,N,0
10,N,0
10,N,0
13,N,2
13,N,2
13,N,2
537
550
560
570
580
590
600
610
623
636
13,13,I
10,10,I
10,10,I
10,10,I
10,10,I
10,10,I
10,10,I
13,13,N,2
13,13,N,2
13,13,N,2
Pop. Density (sq. km), 80
Pop. Density (sq. km), 85
Pop. Density (sq. km), 89
Average Household Size, 65
Average Household Size, 70
Average Household Size, 75
Average Household Size, 80
Average Household Size, 85
Average Household Size, 89
Avg. Urban Household Size, 65
POPDNSTY80
POPDNSTY85
POPDNSTY89
HHLDSIZE65
HHLDSIZE70
HHLDSIZE75
HHLDSIZE80
HHLDSIZE85
HHLDSIZE89
HHLDSIZE_U65
681
694
707
720
726
732
738
744
750
756
13,N,2
13,N,2
13,N,2
6,N,2
6,N,2
6,N,2
6,N,2
6,N,2
6,N,2
6,N,2
649
662
675
688
694
700
706
712
718
724
13,13,N,2
13,13,N,2
13,13,N,2
6,6,N,2
6,6,N,2
6,6,N,2
6,6,N,2
6,6,N,2
6,6,N,2
6,6,N,2
Avg. Urban Household Size, 70
Avg. Urban Household Size, 75
Avg. Urban Household Size, 80
Avg. Urban Household Size, 85
Avg. Urban Household Size, 89
HHLDSIZE_U70
HHLDSIZE_U75
HHLDSIZE_U80
HHLDSIZE_U85
HHLDSIZE_U89
762
768
774
780
786
6,N,2
6,N,2
6,N,2
6,N,2
6,N,2
730
736
742
748
754
6,6,N,2
6,6,N,2
6,6,N,2
6,6,N,2
6,6,N,2
B-34
ArcWorld User's Guide and Data Reference
Appendix B—ArcWorld 1:3M country statistical attribute layers
Population Characteristics (continued)
Arc Attribute Table
dBASE Columns
Item Description
Item Name
Boundary Type Code
Boundary Type Name
Int. Boundary Status
Boundary Coincidence
Adjoining Country 1 Code
Adjoining Country 2 Code
Adjoining Country Names
Adjoining Region Abbrev.
Adjoining Continent Abbrev.
TYPE
BND_TYPE
BND_STATUS
BND_COINC
COUNTRY1
COUNTRY2
CNTRY_NAME
REGION
CONTINENT
July 1992
Begin
Column
80
81
91
92
93
95
97
138
147
Column
Definition
1,N,0
10,C,0
1,N,0
1,N,0
2,C,0
2,C,0
41,C,0
9,C,0
7,C,0
INFO Items
Begin
Column
Item
Definition
29
30
40
41
42
44
46
87
96
1,1,I
10,10,C
1,1,I
1,1,I
2,2,C
2,2,C
41,41,C
9,9,C
7,7,C
B-35
Appendix B—ArcWorld 1:25M and Browse Map layers
Country Boundaries
Coverage Name:
Layer Type:
CTRY25M
Polygon and Line
Polygon Attribute Table
dBASE Columns
Item Description
Item Name
Country FIPS Code
Country Name
World Region Name
Continent Name
Land/Water Identifier
Island Carto. Display Rank
Statistical Flag
European Econ. Community
Food and Agriculture Org.
UN General Assembly
UN Gen. Assembly (year)
Int. Atomic Energy Agency
Int. Recon. Dev. (World Bank)
Internat. Monetary Fund
Org. of Petrol. Exp. Countries
United Nations Sec. Council
UN Ed., Sci. and Cult. Org.
World Health Organization
World Meteorological Orga.
COUNTRY
CNTRY_NAME
REGION
CONTINENT
LAND_OCEAN
ISLND_RANK
STAT_FLAG
EEC
FAO
GA
GA_MEMB_YR
IAEA
IBRD
IMF
OPEC
SC
UNESCO
WHO
WMO
Begin
Column
49
51
91
112
125
134
135
136
137
138
139
143
144
145
146
147
148
149
150
Column
Definition
2,C,0
40,C,0
21,C,0
13,C,0
9,C,0
1,N,0
1,N,0
1,N,0
1,N,0
1,N,0
4,N,0
1,N,0
1,N,0
1,N,0
1,N,0
1,N,0
1,N,0
1,N,0
1,N,0
INFO Items
Begin
Column
17
19
59
80
93
102
103
104
105
106
107
111
112
113
114
115
116
117
118
Item
Definition
2,2,C
40,40,C
21,21,C
13,13,C
9,9,C
1,1,I
1,1,I
1,1,I
1,1,I
1,1,I
4,4,I
1,1,I
1,1,I
1,1,I
1,1,I
1,1,I
1,1,I
1,1,I
1,1,I
Annotation: Country names
Arc Attribute Table
dBASE Columns
Item Description
Item Name
Boundary Type Code
Boundary Type Name
Int. Boundary Status
Adjoining Country 1 Code
Adjoining Country 2 Code
Adjoining Country Names
Adjoining Region Abbrev.
Adjoining Continent Abbrev.
TYPE
BND_TYPE
BND_STATUS
COUNTRY1
COUNTRY2
CNTRY_NAME
REGION
CONTINENT
B-36
Begin
Column
80
81
91
92
94
96
137
146
Column
Definition
1,N,0
10,C,0
1,N,0
2,C,0
2,C,0
41,C,0
9,C,0
7,C,0
INFO Items
Begin
Column
Item
Definition
29
30
40
41
43
45
86
95
1,1,I
10,10,C
1,1,I
2,2,C
2,2,C
41,41,C
9,9,C
7,7,C
ArcWorld User's Guide and Data Reference
Appendix B—ArcWorld 1:25M and Browse Map layers
Latitude/Longitude Grid
Coverage Names:
Layer Type:
LTLG20, LTLG_BR
Line
Arc Attribute Table
dBASE Columns
Item Description
Item Name
Latitude
Longitude
Land/Water Indicator
LATITUDE
LONGITUDE
LAND_WATER
Begin
Column
80
84
88
Column
Definition
4,C,0
4,C,0
1,N,0
INFO Items
Begin
Column
29
33
37
Item
Definition
4,4,C
4,4,C
1,1,I
Major Cities
Coverage Name:
Layer Type:
CITY25M, CITY_BR (Note that some attributes in the table below are not
present in CITY_BR, so the begin columns will not be the same.)
Point
Point Attribute Table
dBASE Columns
Item Description
Item Name
City Name (English)
Capital City Flag
Major City Flag
Country FIPS Code
Country Name
World Region Name
Continent Name
City Name (Native)
Diacritical Mark Flag
NAME
CAPITAL
MAJ_CITY
COUNTRY
CNTRY_NAME
REGION
CONTINENT
LOCAL_NAME
DIACR_FLAG
Begin
Column
49
89
90
91
93
133
154
167
207
Column
Definition
40,C,0
1,N,0
1,N,0
2,C,0
40,C,0
21,C,0
13,C,0
40,C,0
1,N,0
INFO Items
Begin
Column
17
57
58
59
61
101
122
135
175
Item
Definition
40,40,C
1,1,I
1,1,I
2,2,C
40,40,C
21,21,C
13,13,C
40,40,C
1,1,I
Annotation: City names
July 1992
B-37
Appendix B—ArcWorld 1:25M and Browse Map layers
Map Elements
Coverage Name:
Layer Type:
SC_25M
Polygon and line
Polygon Attribute Table
dBASE Columns
Item Description
Item Name
Fill Area Code
FILL
Begin
Column
49
Column
Definition
2,N,0
INFO Items
Begin
Column
17
Item
Definition
1,1,I
Annotation: Includes labels for scale bar and display title.
Arc Attribute Table
dBASE Columns
Item Description
Item Name
Begin
Column
Column
Definition
INFO Items
Begin
Column
Item
Definition
All items are ARC/INFO generated.
Rivers and Water Bodies
Coverage Name:
Layer Type:
RIV25M
Polygon and Line
Polygon Attribute Table
dBASE Columns
Item Description
Item Name
Water Feature Type Code
Water Feature Type Name
Country FIPS Code
Country Name
World Region Name
Continent Name
TYPE
WATER_TYPE
COUNTRY
CNTRY_NAME
REGION
CONTINENT
B-38
Begin
Column
49
50
70
72
112
133
Column
Definition
1,N,0
20,C,0
2,C,0
40,C,0
21,C,0
13,C,0
INFO Items
Begin
Column
17
18
38
40
80
101
Item
Definition
1,1,I
20,20,C
2,2,C
40,40,C
21,21,C
13,13,C
ArcWorld User's Guide and Data Reference
Appendix B—ArcWorld 1:25M and Browse Map layers
Rivers and Water Bodies (continued)
Arc Attribute Table
dBASE Columns
Item Description
Item Name
River Feature Type Code
River Feature Type Name
Adjoining Country 1 Code
Adjoining Country 2 Code
Adjoining Country Names
Adjoining Region Abbrev.
Adjoining Continent Abbrev.
TYPE
RIVER_TYPE
COUNTRY1
COUNTRY2
CNTRY_NAME
REGION
CONTINENT
Begin
Column
80
81
101
103
105
146
155
Column
Definition
1,N,0
20,C,0
2,C,0
2,C,0
41,C,0
9,C,0
7,C,0
INFO Items
Begin
Column
29
30
50
52
54
95
104
Item
Definition
1,1,I
20,20,C
2,2,C
2,2,C
41,41,C
9,9,C
7,7,C
Selected Statistical Attributes
Coverage Name:
Layer Type:
STAT25M, STAT_BR (Note: For the STAT_BR coverage, column and item
definitions are correct in the polygon attribute table below, but begin columns
will not correspond due to some deleted attributes.)
Polygon and Line
Polygon Attribute Table
dBASE Columns
Begin
Column
Column
Definition
INFO Items
Begin
Column
Item
Definition
Item Description
Item Name
Country FIPS Code
Country Name
World Region Name
Continent Name
Land/Water Identifier
Island Carto. Display Rank
Statistical Flag
European Econ. Community
Food and Agriculture Org.
UN General Assembly
COUNTRY
CNTRY_NAME
REGION
CONTINENT
LAND_OCEAN
ISLND_RANK
STAT_FLAG
EEC
FAO
GA
49
51
91
112
125
134
135
136
137
138
2,C,0
40,C,0
21,C,0
13,C,0
9,C,0
1,N,0
1,N,0
1,N,0
1,N,0
1,N,0
17
19
59
80
93
102
103
104
105
106
2,2,C
40,40,C
21,21,C
13,13,C
9,9,C
1,1,I
1,1,I
1,1,I
1,1,I
1,1,I
UN Gen. Assembly (year)
Int. Atomic Energy Agency
Int. Recon. Dev. (World Bank)
International Monetary Fund
GA_MEMB_YR
IAEA
IBRD
IMF
139
143
144
145
4,N,0
1,N,0
1,N,0
1,N,0
107
111
112
113
4,4,I
1,1,I
1,1,I
1,1,I
continued . . .
July 1992
B-39
Appendix B—ArcWorld 1:25M and Browse Map layers
Selected Statistical Attributes (continued)
Polygon Attribute Table (cont.)
dBASE Columns
Begin
Column
Column
Definition
INFO Items
Begin
Column
Item
Definition
Item Descript ion
Item Name
Org. of Petrol. Exp. Countries
United Nations Sec. Council
UN Ed., Sci. and Cult. Org.
World Health Organization
World Meteorological Orga.
World Bank Country Code
Total Population, 89
% Pop. Ages 0 to 14 Years
% Pop. Ages 15 to 64 Years
Annual Pop. Growth Rate
OPEC
SC
UNESCO
WHO
WMO
WB_CNTRY
TOTPOP89
P_0_14_89
P_15_64_89
GRW_RATE89
146
147
148
149
150
151
154
167
173
179
1,N,0
1,N,0
1,N,0
1,N,0
1,N,0
3,C,0
13,N,0
6,N,2
6,N,2
6,N,2
114
115
116
117
118
119
122
135
141
147
1,1,I
1,1,I
1,1,I
1,1,I
1,1,I
3,3,C
13,13,I
6,6,N,2
6,6,N,2
6,6,N,2
Urban Pop. Growth Rate
Urban/Rural Grwth Different
Projected Year 2000 Pop.
Total Land Area
Population Density (sq. km)
Crude Birth Rate
Crude Death Rate
Infant Mortality Rate
Life Expectancy (at birth)
Access to Safe Water
URBGRWRT89
U_R_DIFF89
POP2000_89
LANDAREA85
POPDNSTY85
BIR_RATE89
DTH_RATE89
INF_DTH89
LIFE_EXP89
SAFEH2O85
185
191
197
210
220
233
239
245
251
257
6,N,2
6,N,1
13,N,0
10,N,0
13,N,2
6,N,1
6,N,1
6,N,2
6,N,2
6,N,2
153
159
165
178
188
201
207
213
219
225
6,6,N,2
6,6,N,1
13,13,I
10,10,I
13,13,N,2
6,6,N,1
6,6,N,1
6,6,N,2
6,6,N,2
6,6,N,2
% GDP for Medical Care
Doctors per Person, 80
Hospital Beds per Person
Percent of Agri. Land
Agri. Population Density
Forest Area (K sq. km)
Net Deforestation Rate
Food Production per Capita
Calories per Person (Daily)
Protein per Person (Daily)
EXP_MED85
POP_DOCT80
POP_HBED80
P_AGLAND85
POPDNSAG85
FORESTS85
NETDEFOR85
FOODPROD89
CAL_CAP85
PROT_CAP85
263
269
279
289
295
308
318
324
330
336
6,N,2
10,N,0
10,N,0
6,N,2
13,N,2
10,N,0
6,N,2
6,N,2
6,N,1
6,N,1
231
237
247
257
263
276
286
292
298
304
6,6,N,2
10,10,I
10,10,I
6,6,N,2
13,13,N,2
10,10,I
6,6,N,2
6,6,N,2
6,6,N,1
6,6,N,1
Total Labor Force, 1989
% of Labor Force in Agri.
% of Labor Force, Female
Labor Participation Rate
Female Labor Part. Rate
GNP per Capita
Percent of GDP for Food
LABORFOR89
P_AGRIC80
P_FEMALE89
PARTICIP89
PARTCP_F89
GNP_CAP89
EXPFOODS85
342
352
365
371
377
383
388
10,N,0
13,N,6
6,N,2
6,N,2
6,N,2
5,N,0
6,N,2
310
320
324
330
336
342
347
10,10,I
4,8,F,2
6,6,N,2
6,6,N,2
6,6,N,2
5,5,I
6,6,N,2
continued . . .
B-40
ArcWorld User's Guide and Data Reference
Appendix B—ArcWorld 1:25M and Browse Map layers
Selected Statistical Attributes (continued)
Polygon Attribute Table (cont.)
dBASE Columns
Begin
Column
Column
Definition
INFO Items
Begin
Column
Item
Definition
Item Description
Item Name
Energy Consum. per Capita
Persons per Passenger Car
Persons per Telephone
Percent GDP for Education
% Children in Primary School
% Children in Secondary School
% Science & Eng. Students
Primary Pupil/Teacher Ratio
% of Illiterate Persons
Agri. as a Percentage of GDP
ENRG_CAP85
POP_CAR80
POP_TELE80
EXPEDUC85
P_PRIMRY85
P_SECNDY85
P_SCIENG85
PUPTCH_P85
ILLITER85
P_AGGDPR88
394
402
408
414
420
426
432
438
441
447
8,N,2
6,N,1
6,N,1
6,N,2
6,N,2
6,N,2
6,N,2
3,N,0
6,N,2
10,N,2
353
361
367
373
379
385
391
397
400
406
8,8,N,2
6,6,N,1
6,6,N,1
6,6,N,2
6,6,N,2
6,6,N,2
6,6,N,2
3,3,I
6,6,N,2
10,10,N,2
Industry, Percentage of GDP
Services % of GDP
Govt. Expenditure % of GDP
Availabil. Safe Urban Water
Availabil. Safe Rural Water
% DPT Immunized (age 1 year)
% Measles Immun. (age 1 year)
Couples Using Birth Control
Percent of Wilderness Area
Persons per Household
P_INDGDP88
P_SERGDP88
P_GVTGDP89
SAFH2OUR88
SAFH2ORR88
IM_DPT90
IM_MEASL90
CONTRCEP89
WILDERNS88
HHLDSIZR86
457
467
477
487
497
507
517
527
537
547
10,N,2
10,N,2
10,N,2
10,N,2
10,N,2
10,N,2
10,N,2
10,N,2
10,N,2
10,N,2
416
426
436
446
456
466
476
486
496
506
10,10,N,2
10,10,N,2
10,10,N,2
10,10,N,2
10,10,N,2
10,10,N,2
10,10,N,2
10,10,N,2
10,10,N,2
10,10,N,2
Households Without Electricity
Agriculture, % of GDP
Industry, % of GDP
Services, % of GDP
Govt. Expenditure % of GDP
No. Known Mammal Species
No. Endangered Mammal Spec.
Number Endangered Plant Taxa
No. Threat. Plants/1K Taxa.
Threat Plant Taxa/1K sq. km
HHWOELEC82
CROPLAND89
NOSOILCN89
DEFORTOT85
P_PROTLN90
MAMLSPEC90
MAMLTHRT89
PLANTHRT91
PLTHR_1K91
PLTHR_KM91
557
567
577
587
597
607
617
627
637
647
10,N,2
10,N,2
10,N,2
10,N,2
10,N,2
10,N,2
10,N,2
10,N,2
10,N,2
10,N,2
516
526
536
546
556
566
576
586
596
606
10,10,N,2
10,10,N,2
10,10,N,2
10,10,N,2
10,10,N,2
10,10,N,2
10,10,N,2
10,10,N,2
10,10,N,2
10,10,N,2
Enrg. Consump. Const. 87$
CONS_87_89
Energy Imports/% of Consump. ENRG_IMP89
Trad. Fuels/% of Total Required P_TRFUEL89
Annual Urban Waste per Capita MUNWASTE89
Fish % Food Supply/per Capita FOODFISH88
Ind. CO2 Emissions - per Capita CO2_CAP89
CO2 Emissions - Deforestation CO2DEFOR89
Total Methane Emissions
METHANE89
Total CFC Emissions
CFC89
657
667
677
687
697
707
717
727
737
10,N,2
10,N,2
10,N,2
10,N,2
10,N,2
10,N,2
10,N,2
10,N,2
10,N,2
616
626
636
646
656
666
676
686
696
10,10,N,2
10,10,N,2
10,10,N,2
10,10,N,2
10,10,N,2
10,10,N,2
10,10,N,2
10,10,N,2
10,10,N,2
July 1992
B-41
Appendix B—ArcWorld 1:25M and Browse Map layers
Selected Statistical Attributes (continued)
Arc Attribute Table
dBASE Columns
Item Description
Item Name
Boundary Type Code
Boundary Type Name
Int. Boundary Status
Adjoining Country 1 Code
Adjoining Country 2 Code
Adjoining Country Names
Adjoining Region Abbrev.
Adjoining Continent Abbrev.
TYPE
BND_TYPE
BND_STATUS
COUNTRY1
COUNTRY2
CNTRY_NAME
REGION
CONTINENT
Begin
Column
80
81
91
92
94
96
137
146
Column
Definition
1,N,0
10,C,0
1,N,0
2,C,0
2,C,0
41,C,0
9,C,0
7,C,0
INFO Items
Begin
Column
Item
Definition
29
30
40
41
43
45
86
95
1,1,I
10,10,C
1,1,I
2,2,C
2,2,C
41,41,C
9,9,C
7,7,C
Browse Map statistical attribute coverages
Coverage Names:
ECONIND, EDU_LIT, AGRICUL, HEALTH, LABOR, WRI_BR, POP_GEO
Please refer to the ArcWorld 1:3M attribute tables for column and item
definitions in these coverages. Note that the begin columns will not be the
same because some attributes have been omitted from the Browse Map
statistical attribute coverages.
B-42
ArcWorld User's Guide and Data Reference
Appendix C
Continent, region, and
country codes
Federal Information Processing Standards (FIPS) codes are standard international
codes that have been developed to facilitate the transfer of information between
systems, to reduce data coding error, and to reduce waste in data storage by
eliminating duplication. The codes were developed by the National Computer
Systems Laboratory at the National Institute of Standards and Technology.
The following lists provide the codes used in the ArcWorld database. Continent
and region codes were developed by ESRI. The country codes are the FIPS codes
that are outlined in FIPS publication 10-3, except that codes beginning with X were
developed by ESRI to identify disputed areas.
July 1992
C-1
Appendix C—Continent, region, and country codes
Codes
for continents
AFR
ANT
ASA
-
Africa
Antarctica
Asia
AUS
EUR
N_A
-
Australia
Europe
North America
OCN S_A -
European (former USSR)
Melanesia
Micronesia
Middle Africa
Northern Africa
Northern America
Northern Europe
Polynesia
S_AM
SE_A
S_AF
S_AS
S_EU
W_AF
W_AS
W_EU
Burma
Burundi
Byelarus
Cambodia
Cameroon
Canada
Cape Verde
Cayman Islands
Central African
Republic
Chad
Chad (claimed by
Libya)
Chile
China
Chinese Control
Claimed by India
Cocos (Keeling)
Islands
Colombia
Comoros
Congo
Cook Islands
Costa Rica
Cuba
Cyprus
Czechoslovakia
Denmark
Djibouti
Dominica
Dominican Republic
Ecuador
Egypt
XO
-
ES
EK
EN
ET
FA
-
FO
FM
-
FJ
FI
FR
FG
FP
FS
-
GB
GA
GZ
GG
GM
GH
GO
GR
GL
GJ
GP
GQ
GT
GK
GV
PU
-
Oceania
South America
Codes
for regions
ANTA
SU_A
A_NZ
CARB
C_AM
E_AF
E_AS
E_EU
-
Antarctica
Asian (former USSR)
Australia/New Zealand
Caribbean
Central America
Eastern Africa
Eastern Asia
Eastern Europe
SU_E
MELA
MICR
M_AF
N_AF
N_AM
N_EU
POLY
-
-
South America
Southeastern Asia
Southern Africa
Southern Asia
Southern Europe
Western Africa
Western Asia
Western Europe
FIPS codes
for countries
AF
AL
AG
AQ
AN
AO
AV
AY
AC
AR
AM
AS
AU
AJ
BF
BA
FQ
BG
BB
BE
BH
BN
BD
BT
BL
BC
BV
BR
IO
-
VI
BX
BU
UV
-
C-2
Afghanistan
Albania
Algeria
American Samoa
Andorra
Angola
Anguilla
Antarctica
Antigua and Barbuda
Argentina
Armenia
Australia
Austria
Azerbaijan
Bahamas, The
Bahrain
Baker Island
Bangladesh
Barbados
Belgium
Belize
Benin
Bermuda
Bhutan
Bolivia
Botswana
Bouvet Island
Brazil
British Indian Ocean
Territory
British Virgin Islands
Brunei
Bulgaria
Burkina Faso
BM
BY
BO
CB
CM
CA
CV
CJ
CT
-
CD
XM
-
CI
CH
XG
-
CK
-
CO
CN
CF
CW
CS
CU
CY
CZ
DA
DJ
DO
DR
EC
EG
-
Egypt (administered
by Sudan)
El Salvador
Equatorial Guinea
Estonia
Ethiopia
Falkland Islands
(Islas Malvinas)
Faroe Islands
Federated States of
Micronesia
Fiji
Finland
France
French Guiana
French Polynesia
French Southern and
Antarctic Lands
Gabon
Gambia, The
Gaza Strip
Georgia
Germany
Ghana
Glorioso Islands
Greece
Greenland
Grenada
Guadeloupe
Guam
Guatemala
Guernsey
Guinea
Guinea–Bissau
ArcWorld User's Guide and Data Reference
Appendix C—Continent, region, and country codes
GY
HA
HM
-
HO
HK
HQ
HU
IC
IN
XL
-
XH
-
XI
-
XJ
-
XK
-
ID
IR
IZ
IY
-
EI
IS
IT
IV
JM
JN
JA
DQ
JE
JQ
JO
JU
KZ
KE
KR
KN
-
KS
KU
KG
LA
LG
LE
LT
LI
LY
LS
LH
LU
MC
MA
MI
MY
-
July 1992
Guyana
Haiti
Heard Island and
McDonald Islands
Honduras
Hong Kong
Howland Island
Hungary
Iceland
India
India (claimed by
China)
Indian control
(claimed by China)
Indian control
(claimed by China)
Indian control
(claimed by China)
Indian control
(claimed by China)
Indonesia
Iran
Iraq
Iraq–Saudi Arabia
neutral zone
Ireland
Israel
Italy
Ivory Coast
Jamaica
Jan Mayen
Japan
Jarvis Island
Jersey
Johnston Atoll
Jordan
Juan De Nova Island
Kazakhstan
Kenya
Kiribati
Korea, Democratic
People's Republic of
Korea, Republic of
Kuwait
Kyrgyzstan
Laos
Latvia
Lebanon
Lesotho
Liberia
Libya
Liechtenstein
Lithuania
Luxembourg
Macau
Madagascar
Malawi
Malaysia
MV
ML
MT
IM
MB
MR
MP
MF
MX
MQ
MD
MN
MG
MH
MO
MZ
WA
NR
NP
NL
NA
NC
NZ
NU
NG
NI
NE
NF
CQ
-
NO
XA
XB
XC
XD
XE
MU
PK
PM
PP
PF
PA
PE
RP
PC
PL
PO
RQ
QA
RE
RO
RS
RW
SM
TP
-
SA
SG
-
Maldives
Mali
Malta
Man, Isle of
Martinique
Mauritania
Mauritius
Mayotte
Mexico
Midway Islands
Moldova
Monaco
Mongolia
Montserrat
Morocco
Mozambique
Namibia
Nauru
Nepal
Netherlands
Netherlands Antilles
New Caledonia
New Zealand
Nicaragua
Niger
Nigeria
Niue
Norfolk Island
Northern Mariana
Islands
Norway
Occupied by Israel
Occupied by Israel
Occupied by Israel
Occupied by Israel
Occupied by Israel
Oman
Pakistan
Panama
Papua New Guinea
Paracel Islands
Paraguay
Peru
Philippines
Pitcairn Islands
Poland
Portugal
Puerto Rico
Qatar
Reunion
Romania
Russia
Rwanda
San Marino
Sao Tome and
Principe
Saudi Arabia
Senegal
SE
SL
SN
BP
SO
SF
SP
PG
CE
SH
SC
ST
SB
-
VC
-
SU
XN
-
XS
-
XU
-
NS
SV
WZ
SW
SZ
SY
TW
TI
TZ
-
TH
TO
TL
TN
TD
TS
TU
TX
TK
-
TV
UG
UI
TC
UK
US
UY
UZ
NH
VE
VM
VQ
WQ
WF
WE
-
Seychelles
Sierra Leone
Singapore
Solomon Islands
Somalia
South Africa
Spain
Spratly Islands
Sri Lanka
St. Helena
St. Kitts and Nevis
St. Lucia
St. Pierre and
Miquelon
St. Vincent and the
Grenadines
Sudan
Sudan (administered
by Egypt)
Sudan (administered
by Kenya)
Sudan (administered
by Kenya)
Suriname
Svalbard
Swaziland
Sweden
Switzerland
Syria
Taiwan
Tajikistan
Tanzania, United
Republic of
Thailand
Togo
Tokelau
Tonga
Trinidad and Tobago
Tunisia
Turkey
Turkmenistan
Turks and Caicos
Islands
Tuvalu
Uganda
Ukraine
United Arab Emirates
United Kingdom
United States
Uruguay
Uzbekistan
Vanuatu
Venezuela
Vietnam
Virgin Islands
Wake Island
Wallis and Futuna
West Bank
C-3
Appendix C—Continent, region, and country codes
WI
WS
YM
-
Western Sahara
Western Samoa
Yemen
YO
CG
ZA
-
Yugoslavia
Zaire
Zambia
ZI
-
Zimbabwe
Territorial assignments in the
country statistical attribute layers
The attributes COUNTRY and CNTRY_NAME contain the codes and names listed above.
This list uniquely identifies individual territories, such as disputed territories. In the attributes
WB_CNTRY and WRI_CNTRY, however, ESRI has assigned these territories to a particular
country in order to enhance the visual appearance of data displays. These assignments are as
follows:
Country code
(COUNTRY)
XA
XB
XC
XD
XE
XG
XH
XI
XJ
XK
XL
XM
XN
XO
XS
XU
Description
(CNTRY_NAME)
Occupied by Israel
Occupied by Israel
Occupied by Israel
Occupied by Israel
Occupied by Israel
Chinese Control Claimed by India
Indian Control, Claimed by China
Indian Control, Claimed by China
Indian Control, Claimed by China
Indian Control, Claimed by China
India, Claimed by China
Chad, Claimed by Libya
Sudan, Administered by Egypt
Egypt, Administered by Sudan
Sudan, Administered by Kenya
Sudan, Administered by Kenya
Country assigned for
statistical attributes
(WB_CNTRY and WRI_CNTRY)
Israel
Israel
Israel
Israel
Israel
China
India
India
India
India
India
Chad
Sudan
Egypt
Sudan
Sudan
Also, some additional territories are uniquely identified in the FIPS 10-3 scheme, but assigned
to a different country by the World Bank, as follows:
Country code
(COUNTRY)
BV
GO
GZ
JN
JU
SV
Description
(CNTRY_NAME)
Bouvet Island
Glorioso Islands
Gaza Strip
Jan Mayan
Juan de Nova Island
Svalbard
Country assigned for
statistical attributes
(WB_CNTRY and WRI_CNTRY)
Norway
Reunion
Israel
Norway
Reunion
Norway
Statistical data for the West Bank are reported with either Israel or Jordan and vary on an
attribute-by-attribute basis. Because of this inconsistency the West Bank could not be assigned
to one of the two countries. See Chapter 6 for more information on the assignment of codes
for the STAT_FLAG item.
C-4
ArcWorld User's Guide and Data Reference
Appendix D
Incomplete coverage areas
This appendix lists major countries that do not contain features in the ArcWorld 1:3M database for
roads, railroads, or internal administrative divisions. The reason for the absence of data in these
countries may either be because data were not collected about these features, or because these
features do not actually exist.
Major countries without internal administrative division data
Armenia
Austria
Bahrain
Bangladesh
Bhutan
Brunei
Burundi
Denmark
Dominican Republic
Equatorial Guinea
Estonia
Greece
Haiti
Iceland
Indonesia
Kuwait
Latvia
Lithuania
Moldavia
Mongolia
Nepal
New Zealand
Papua New Guinea
Puerto Rico
Qatar
Rwanda
Swaziland
Switzerland
Taiwan
Major countries without railroad data
Bahrain
Belize
Bhutan
Brunei
Burundi
Cent. African Republic
Chad
Cyprus
Equatorial Guinea
French Guiana
Gambia, The
Guinea–Bissau
Iceland
Kuwait
Laos
Libya
Niger
Oman
Papua New Guinea
Puerto Rico
Qatar
Rwanda
Somalia
United Arab
Emirates
Yemen
New Zealand
Papua New Guinea
Paraguay
Puerto Rico
United States
Uruguay
Major countries without road data
Argentina
Australia
Canada
Cuba
July 1992
Dominican Republic
Haiti
Iceland
Japan
D-1
Appendix E
Bibliography
Source data
The following publications contain further information about the data sources
for this database:
Anderson, D. E., J. L. Angel, and A. J. Gorny, World Data Bank II: Content,
Structure and Application, 1977, Harvard University, First International
Symposium on Topological Data Structures of GIS, Cambridge, MA.
Social Indicators of Development 1990, A World Bank Publication, The John
Hopkins University Press, Baltimore, Maryland.
Standard Index Chart. March 1988. ONC Index SIC-3, Edition 4 (Stock
Number SICXX03). Available from DMA Combat Support Center, ATTN:
PMSR, Washington, D.C. 20315-0020.
STARS World Bank Data on Diskette, 1990–91: User’s Guide. Washington,
D. C.: prepared by the International Economics Department of the World
Bank.
World Resources 1992-93: A Guide to the Global Environment—Toward
Sustainable Development. A Report by The World Resources Institute in
collaboration with The United Nations Environment Programme and The
United Nations Development Programme, 1992, Oxford University Press,
New York, New York.
World Resources 1992-1993 Database Diskette: User's Guide. Washington,
D. C.: World Resources Institute.
National Bureau of Standards. American National Standard Codes For The
Representation of Names of Countries, Dependencies, and Areas of Special
Sovereignty for Informational Interchange. Springfield, VA.: U.S.
Department of Commerce. [Federal Information Processing Standards (FIPS)
Publication 10-3.]
July 1992
E-1
Appendix E—Bibliography
United Nations Department of International Economic and Social Affairs,
Statistical Office, 1982. Standard Country or Area Codes for Statistical Use.
New York: United Nations. [Series M, No. 49, Rev. 2.]
Reference data
The following printed publications were used as technical reference materials or
to verify the accuracy and consistency of the database:
Defense Intelligence Agency. March 1984. Data Standard No. 5. Geopolitical
Data Elements and Related Features, Defense Intelligence Agency: Washington
D.C. [DIAM 65-18.]
Douglas, D. H. and T. K. Peucker, “Algorithms for the Reduction of the
Number of Points Required to Represent a Digitized Line or its Caricature.”
The Canadian Cartographer vol. 10, no. 2, December 1973, pp 112-122.
Information Please Almanac 1990—43rd Edition 1990. Boston: Houghton
Mifflin Company.
National Geographic Atlas of the World—Sixth Edition. 1990.
Washington, D.C.: National Geographic Society.
The New International Atlas. 1987. Chicago: Rand McNally & Company.
Snead, R. E. 1972. Atlas of World Physical Features. New York: John
Wiley & Sons, Inc.
The Times Atlas of the World—Eighth Comprehensive Edition. 1990. New
York: Random House.
USSR Energy Atlas. 1985. Central Intelligence Agency.
Webster's New Geographical Dictionary. 1988. Springfield, Massachusetts:
Merriam-Webster Inc.
World Almanac and Book of Facts. 1988. New York: Pharos Books.
World Fact Book 1989. 1989. Central Intelligence Agency.
E-2
ArcWorld User's Guide and Data Reference
Appendix E—Bibliography
Further reading
All materials listed below are available from ESRI Book Sales, 380 New York
Street, Redlands, California 92373. Telephone: (714) 793-2853.
Aronoff, S., ed. 1989. Geographic Information Systems: A Management
Perspective. Ottawa: WDL Publications.
Burrough, P. A. 1986. Principles of Geographical Information Systems for
Land Resources Assessment. New York: Oxford University Press.
Buttenfield, B., and R. McMaster. 1991. Map Generalization: Making Rules
for Knowledge Representation. New York: John Wiley & Sons.
Cressie, N. 1991. Statistics for Spatial Data. New York: John Wiley &
Sons.
ESRI. 1992. ArcView User's Guide. Redlands, Calif.: Environmental
Systems Research Institute, Inc.
ESRI. 1991a. ARC/INFO User’s Guide: Map Projections & Coordinate
Management. 1991. Redlands, Calif.: Environmental Systems Research
Institute, Inc.
ESRI. 1991b. ARC/INFO 6.0 User's Guide: ARC/INFO Data Model,
Concepts, & Key Terms. Redlands, Calif.: Environmental Systems Research
Institute, Inc.
ESRI. 1990. Understanding GIS: The ARC/INFO Method. Redlands, Calif.:
Environmental Systems Research Institute, Inc.
Goodchild, M., and S. Gopal, eds. 1989. Accuracy of Spatial Databases.
New York: Taylor & Francis. [Detailed treatment of error and accuracy,
particularly of modeling uncertainty and reliability, testing accuracy, and the
practical implications for use of spatial data.]
Huxhold, W. E. 1991. Introduction to Urban Geographic Information
Systems. New York: Oxford University Press. [Basic concepts and
applications of GIS in local government. Useful for students and practitioners.]
Maguire, D. J., M. F. Goodchild, and D. W. Rhind. 1991. Geographical
Information Systems: Principles and Applications. New York: John Wiley &
Sons.
Monmonier, M., and G. A. Schnell. 1988. Map Appreciation. Englewood
Cliffs, N.J.: Prentice Hall.
July 1992
E-3
Appendix E—Bibliography
Mounsey, H., ed. 1988. Building Databases for Global Science. New York:
Taylor & Francis. [Proceedings of the first meeting of the International
Geophysical Union Global Database Planning Project. Roger Tomlinson, gen.
ed.]
Onsrud, H. J., and D. W. Cook. 1990. Geographic and Land Information
Systems for Practicing Surveyors: A Compendium. Bethesda, Md.: American
Congress on Surveying and Mapping.
Peuquet, D., and D. Marble. 1990. Introductory Readings in Geographic
Information Systems. New York: Taylor & Francis.
Raper, J., ed. 1989. Three Dimensional Applications in Geographical
Information Systems. New York: Taylor & Francis.
Ripple, W. J., ed. 1989. Fundamentals of Geographic Information Systems:
A Compendium. Bethesda, Md.: American Congress on Surveying and
Mapping. [Collection of papers.]
Ripple, W., ed. 1987. GIS for Resource Management: A Compendium.
Bethesda, Md.: American Congress on Surveying and Mapping.
Star, J. L., and J. E. Estes. 1990. Geographic Information Systems: An
Introduction. Englewood Cliffs, N.J.: Prentice Hall.
Tomlin, D. 1990. Geographic Information Systems and Cartographic
Modelling. Englewood Cliffs, N.J.: Prentice Hall.
E-4
ArcWorld User's Guide and Data Reference
Appendix F
Sources of other data
Additional data or information can be obtained from the sources listed below:
ArcData
The ArcDataSM Catalog, published by ESRI, is a handy reference to high-quality
database products distributed in ARC/INFO-compatible format. It includes
database products published by ESRI and those offered by premier data
publishers under the auspices of the ArcData publishing program. The Landsat
satellite imagery indexed in the ArcWorld database can be obtained through the
ArcData program. To obtain a copy of this valuable data guide, contact the
ESRI Regional Office nearest you or call the ESRI Marketing Department in
Redlands, California, at 714-793-2853.
DMA Operational Navigation Charts
The Defense Mapping Agency (DMA) Operational Navigation Charts (ONCs)
indexed in the ArcWorld 1:3M database can be purchased in the United States
and foreign countries from agents for the sale of Defense Mapping Agency
aeronautical charts and publications. They can also be purchased by writing
to the DMA Combat Support Center, ATTN: PMSR, Washington, D.C.
20315-0020.
Copies of the DMA Public Sale Catalog and additional information on DMA
products may be obtained from the DMA Customer Assistance Office at: DMA
Combat Support Center, ATTN: PMA, Washington D.C., 20315-0010
(telephone 301-227-2495).
July 1992
F-1
Appendix F—Sources of other data
The World Bank data
Social Indicators of Development data are available in hard copy and in the
*STARS* diskette version from The World Bank. Inquiries should be
addressed to World Bank Publications, P.O. Box 7247, Philadelphia, PA
19101-9630.
World Resources Institute data
The World Resources 1992-1993 database can be acquired from the World
Resources Institute, 1790 New York Avenue, Washington, D.C. 20006.
F-2
ArcWorld User's Guide and Data Reference
Index
Access, database xi
Access to safe water attributes 4-70 to 4-71
Agricultural land attributes 4-63; see also
Agriculture and forestry attributes
Agriculture and forestry attributes 4-89 to 4-90,
5-26 to 5-27; see also Agricultural land
attributes, Forest attributes
Alphabetic codes 3-11
Animal and plant life attributes 5-32 to 5-33
ArcWorld database; see also Attributes
applications ix
data sources and currency (table) 3-17
item definitions B-1 to B-38
modifications made to source data A-6 to A-8
positional accuracy A-10, A-19
production processes A-5 to A-7, A-16 to A-22
quality assurance review procedures for source
data A-7; see also Data quality review
procedures
regions 1-2, 3-4
saving data from 6-5
scale 3-6
units of measure used 6-6 to 6-7
use with other software 6-5 to 6-6
Annotation, display of 6-4
Area, defined 3-1, 3-3
Aquaculture attributes 4-94
Atmospheric emission attributes 4-94
Arc attribute table
explanation of columns in B-2 to B-3
use of 3-4
ArcData program F-1
ARC/INFO-generated attributes 3-4 to 3-5, B-1 to
B-3
ArcView
displaying annotation with 6-4
saving data using 6-5
use with ArcWorld xii
ArcWorld 1:3M data layers 4-1 to 4-104
characteristics 3-7, 4-1, A-3 to A-4 (table)
listed 1-4 to 1-7, 4-3, 4-31, 4-41, A-3
resolution A-3
ArcWorld 1:25M data layers 5-1 to 5-35
characteristics 3-7 to 3-8, 5-1, A-12 to A-13
(table)
listed 1-8 to 1-9, 5-2, A-12
resolution A-12
use to optimize performance 6-2
Attributes 3-8 to 3-14; see also ArcWorld database
accuracy A-10, A-22
alphabetic, use of 3-11
cartographic 3-13 to 3-14
classification, defined 3-13
code, defined 3-11
comparability of statistical 6-3 to 6-4
completeness and consistency 6-3, A-21
flag See Flag attributes
geographic reference
defined 3-12 to 3-13
listed 3-13
used for lines 4-11, 5-8
used for polygons 4-7, 5-5
measurement
defined 3-8 to 3-9
missing 3-9 to 3-10, 4-42, 5-22
standardization of 3-8
statistical analyses using 3-10, 3-11 to 3-12
name 3-12
numeric 3-11
repetitive 3-11
thematic groups for 3-12
Bivariate mapping 2-19, 6-10
July 1992
Index-1
Index
Boundaries, political; see also
Coastlines, First- and second-order country
internal divisions, Rivers and political
boundaries
coding across water bodies 4-24, 5-16
currency 4-5, 4-42
display of country internal 4-12
display of together with rivers 6-8
Code attributes 3-11
Browse Map; see also Browse Map Selected
Statistical Attributes layer
characteristics (table) A-14 to A-15
coverages in 1-8 to 1-9, 3-8, 5-2, A-14
generation of 3-19, 5-36, A-16, A-17, A-20,
A-21
introduced 1-1
projection for 1-3
scale of 3-6
use of 5-1, 6-1
Country Boundaries layer (1:3M) 4-5 to 4-11
currency 4-5
data sources 3-17, 3-18
production procedures A-6
Browse Map Selected Statistical Attributes layer
5-36 to 5-39; see also Browse Map
attributes omitted from 5-38, A-17
generation of A-17, A-21
CAM (Cartographic Automatic Mapping) format
files 3-17 to 3-18
Cartographic data layers (1:3M) 4-3 to 4-30
characteristics 3-7
generation of A-5 to A-7
listed 1-4, 4-3
source and currency 3-17
Cartographic significance attributes
defined 3-13
used for islands and water features 4-7 to 4-8,
4-23, 4-25, 5-5
used for railroads, roads 4-20, 4-29
Central government expenditure attributes 4-87
Choroplethic mapping 6-9
Classification attributes
defined 3-12
used in cartographic layers 4-9 to 4-10, 4-14,
4-16, 4-19, 4-23, 4-24, 4-29
used in statistical attribute layers 4-50
Coordinate precision 3-21, A-4, A-13, A-15
Coordinate system 3-20 to 3-21; see also
Projection systems
defined 3-2
used for ArcWorld data 1-3
Country Boundaries layer (1:25M) 5-3 to 5-8
generation of A-17 to A-18
Country Internal Divisions layer (1:3M) 4-12 to
4-14
completeness of data for 6-3, D-1
data quality review procedures for A-8
data source 3-17, 3-18
display of 4-12
production procedures A-5 to A-6
Coverages; see also ArcWorld 1:3M data layers,
ArcWorld 1:25M data layers
defined 3-2
in ArcWorld database (tables) 1-4 to 1-9
Data See ArcWorld database
Data documentation views 2-24
Data quality review procedures
for accuracy of attribution A-10, A-22
for completeness A-11, A-23
for County Boundaries layer (1:25M) A-18
for logical consistency A-10, A-20
for Major Cities layer (1:25M) A-20
for Major Cities layer (Browse Map) A-20
for mathematically generated indexes A-8, A-20
for positional accuracy A-10, A-19
for Rivers and Water Bodies layer (1:25M) A-19
Data sources 3-16 to 3-19, A-4 to A-9, A-16 to
A-17
table listing 3-17
Coastlines
and country internal divisions 4-12 to 4-13
and country boundaries 4-11, 4-12 to 4-13
Index -2
ArcWorld User's Guide and Data Reference
Index
Database size x, 1-4 to 1-9
Datums 3-20 to 3-21, A-4
Decimal degrees See Projection systems
Diacritical marks 3-12, 4-15, 4-17, 5-11
Disk space requirements for ArcWorld database x
Display, optimizing See Graphics, optimizing
Flag attributes
defined 3-11 to 3-12
generating statistics using 6-4
used in Browse Map Selected Statistical
Attributes layer 5-37
used in Country Boundaries layer 4-5, 4-8, 5-3,
5-6
used in Selected Statistical Attributes layer
(1:25M) 5-22
used in statistical attribute layers (1:3M) 4-42,
4-45
Downloading the database See ArcWorld database
Food import and aid attributes 4-64
Economic development attributes 5-28 to 5-29,
5-30
Food production and nutrition attributes 5-27
Economic and Industrial Indicators layer (1:3M)
4-43 to 4-51
data source 4-43
Food Production and Nutrition layer (1:3M) 4-60
to 4-66
data source 4-60
Education attributes 5-29 to 5-30
Food production and supply attributes 4-64 to 4-65
Education and Literacy layer (1:3M) 4-52 to 4-59
data source 4-52
Forest attributes 4-64; see also Agriculture and
forestry attributes, Wilderness area attribute
Educational expenditure attributes 4-55
Gauge, standard railroad, definition of 4-20
Energy attributes 5-33
General infrastructure attributes 4-89
Energy production and consumption attributes
4-92 to 4-94
Geographic coordinates See Projection systems
EOSAT (Earth Observation Satellite Company)
3-18; see also Landsat Nominal Scene Index
layer
Expenditures and indicators of wealth attributes
4-48
Feature attribute tables 3-4
Feature classes 3-2
Geographic reference attributes
defined 3-12 to 3-13
listed 3-13
used for lines 4-11, 5-8
used for polygons 4-7, 5-5
Graphics, optimizing 6-8 to 6-9; see also Grid
lines
through data selection 6-8
through feature drawing order 6-8 to 6-9
through use of data ranges 6-9
FIPS codes
listed C-1 to C-4
use for countries 3-11, 4-5, 4-6, 6-2
use for statistical attribute layers C-4
use of "X" codes 3-10, 3-11, 4-6 to 4-7, C-4
Grid lines
coding for 4-24, 5-7, 5-18
how to turn off 5-7
First- and second-order country internal divisions,
defined 4-12; see also Boundaries, political
Gross national product attributes 4-47
Gross domestic product attributes 4-87
Hardware requirements x
July 1992
Index-3
Index
Health and Vital Statistics layer (1:3M) 4-67 to
4-75
data source for 4-67
Health attributes 5-26, 5-30 to 5-31
Health care expenditure and availability attributes
4-71 to 4-72
display over land and water 4-36
relationship between grid interval and map scale
4-36
Latitude/Longitude Grid layer (1:25M) 5-9 to 5-10
generation of A-20
Layer, defined 3-5; see also ArcWorld 1:3M data
layers, ArcWorld 1:25M data layers
"Hide Legend" option 2-19
Layer summary tables 1-4 to 1-9
Household income attributes 4-47
Line, defined 3-1, 3-3
Housing attributes 5-31
Line feature table B-2 to B-3
Identification attributes 4-35, 4-38, 4-40
Literacy attributes 4-57
Incomplete coverage areas D-1
Index data layers (1:3M) 4-31 to 4-40
characteristics 3-7, 4-37
generation of A-7 to A-8
listed 1-5, 4-31
source and currency 3-17
Infrastructure attributes 4-89
Logical consistency See Data quality review
procedures
Major Cities layer (1:3M) 4-15 to 4-17
data source 3-17, 3-18
generation A-8
Major Cities layer (1:25M) 5-11 to 5-13
generation A-19
International Board of Geographic Names See
Spelling of place names
Malnutrition attributes 4-71
International boundary status attributes 4-10
Map Elements layer (1:25M) 5-14 to 5-15
Islands, ranking of codes for 4-7 to 4-8
Marine catch and aquaculture attributes 4-94
Jet Navigation Charts, use of 4-39, 4-40
Measurement attributes See Attributes,
measurement
Labor force attributes 4-79 to 4-80, 5-28
Labor Force Characteristics layer (1:3M) 4-76 to
4-82
data sources 4-76
Membership in organizations See World
organizations
Missing measurement values 3-9 to 3-10, 4-42,
5-22
Land attributes 5-31 to 5-32
Land/ocean indicator attributes 4-7, 5-5
Landsat Nominal Scene Index layer (1:3M) 4-33 to
4-35
coding for scene center points 4-35
generation of 3-18
relationship to Thematic Mapper and
Multispectral Scanner data 4-33
Latitude/Longitude Grid layer (1:3M) 4-36 to 4-38
Index -4
Multispectral Scanner data See Landsat Nominal
Scene Index layer
Municipal waste attributes 5-34
Name attributes
functions of 3-12
used in Major Cities layer 4-16, 4-17
Naming conventions used for coverages and
attributes 3-14 to 3-16
ArcWorld User's Guide and Data Reference
Index
Natural Resources and the Environment layer
(1:3M) 4-83 to 4-96
data sources 4-83
Population Characteristics layer (1:3M), 4-97 to
4-104
data sources 4-97
Population density attributes 4-102 to 4-103
Negative numbers, meaning of 3-9 to 3-10, 4-42
Nominal scene center points See Scene center
points
Nominal scene footprints See Scene footprints
Nominal scene index See Landsat Nominal Scene
Index layer
Numeric codes, use of 3-11
Operational Navigation Chart Index layer (1:3M)
3-19, 4-39 to 4-40
Population growth rates and projection attributes
4-101 to 4-102
Positional accuracy of database See Data quality
review procedures
Primary school attributes 4-57
Projection systems
conversion capability 3-20
definition of 3-2
used for ArcWorld database 1-3, 3-6, 3-20
Protected land area attributes 4-91
Operational navigation charts, availability of F-1
Pupil–teacher ratio attributes 4-56
Package components ix
Performance, optimizing 6-1 to 6-2
by normalizing the database 6-2
by reducing number of attributes 6-2
by reducing number of features 6-1
by using Browse Map and 1:25M data 6-1
by using simple selection statements 6-2
Point attribute table
explanation of columns in B-1 to B-3
use of 3-4
Point, defined 3-1, 3-3
Political boundaries See Boundaries, political
Polygon attribute table
explanation of columns in B-1 to B-3
use of 3-4
Polygons
"background" 3-11
closure of across adjacent water bodies 4-24
defined 3-3
use of to represent countries 4-5
Population attributes 5-24 to 5-25
Population by age, sex, and situation attributes
4-100 to 4-101
July 1992
Railroads layer (1:3M) 4-18 to 4-20
completeness of data for 6-3, D-1
data sources 3-17, 3-18
production procedures for A-5 to A-6
References xi, E-1 to E-4; see also Sources of
additional information
Regions in ArcWorld
coding for 4-7, 4-11, 4-14
dividing line for eastern and western coverages in
Rivers and Water Bodies layer (1:3M) 3-4,
4-21
dividing line for eastern and western coverages in
Roads layer (1:3M) 3-4, 4-27
map of 1-2
Resolution, database A-3, A-12, A-14
Rivers and political boundaries; see also
Boundaries, political
attributes used for coincident 4-10, 4-25
simultaneous display of 6-8
Rivers and Water Bodies layer (1:3M) 4-21 to
4-26; see also Boundaries, political and Rivers
and political boundaries
generation of 3-17 to 3-18
production procedures A-7
sources 3-17, 3-18
Index-5
Index
Rivers and Water Bodies layer (1:25M) 5-16 to
5-19
production procedures for A-18 to A-19
Source data See Data sources
Roads layer (1:3M) 4-27 to 4-29
completeness of data for 6-3, D-1
data sources 3-17, 3-18
production procedures for A-5 to A-6
Species diversity and status attributes 4-91 to 4-92
Sources of additional information F-1
Spelling of place names 4-15, 4-16, 4-17, 5-11
Standardizing data 3-9
Robinson projection See Projection systems
"stat_flag" attribute See Flag attributes
Safe water attributes 4-70 to 4-71
STAT_FLAG attribute See Flag attributes
Sanitation attributes 4-87
Saving data See ArcWorld database
Scale bar 5-14, 5-15
Scene center points; see also Landsat Nominal
Scene Index layer (1:3M)
defined 3-18, 4-33
coding of latitude and longitude for 4-35
query using 4-34
Scene footprints 4-33, 4-34; see also Landsat
Nominal Scene Index layer (1:3M)
School age, defined 4-55
School enrollment attributes 4-55
Selected Statistical Attributes layer (1:25M) 5-20
to 5-35; see also Browse Map Selected
Statistical Attributes layer, Statistical attribute
layers
currency of country boundaries in 5-20
generation of A-21 to A-22
Selection statements See Performance, optimizing
SID (Social Indicators of Development) database
See World Bank Social Indicators of
Development database
Software, compatible with ArcWorld data 6-5 to
6-6
Software-generated attributes See ARC/INFOgenerated attributes
Software requirements x
Index -6
Statistical attribute layers (1:3M) 4-41 to 4-104;
see also Selected Statistical Attributes layer
(1:25M), Browse Map Selected Statistical
Attributes layer
cartographic components in 4-42, C-4
characteristics 3-7
generation of A-9
lists of 1-6 to 1-7, 4-41
source and currency 3-17, 3-19, 4-41, 4-42
use of "X" codes in C-4
Statistical flag attribute See Flag attribute
Success in primary school attributes See Primary
school attributes
Thematic Mapper See Landsat Nominal Scene
Index layer
Title, map 5-14
Units of measure used in data layers 6-6 to 6-7
Views xii
Vital statistics attributes 4-72 to 4-73, 5-25 to
5-26
Wilderness area attribute 4-89; see also Forest
attributes
World Bank Social Indicators of Development
database
attribute groups used in Selected Statistical
Attributes layer 5-24 to 5-30
availability of F-2
country code attribute for 4-47
use as data source 3-18 to 3-19, 4-41, 4-43,
4-52, 4-60, 4-67, 4-76, 4-97, A-21 to A-22
ArcWorld User's Guide and Data Reference
Index
World Data Bank II
use as data source 3-17 to 3-18
World organizations, membership in
attributes 4-8 to 4-9
use of flag attributes to indicate 3-11
World Resources Institute World Resources 1992–
1993 Data Base
attribute groups used in Selected Statistical
Attributes layer 5-30 to 5-34
country code attribute for 4-86
use as data source 3-19, 4-41, 4-83, A-21 to
A-22
"X" codes
selection statement including 6-4
use of for countries 3-10, 3-11, 4-6 to 4-7
Zero values 3-10
July 1992
Index-7