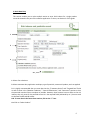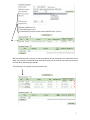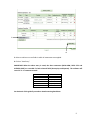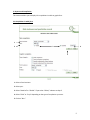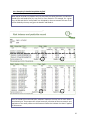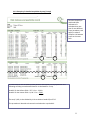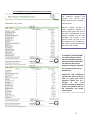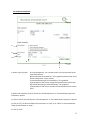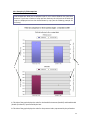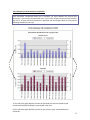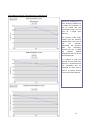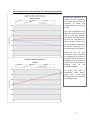
1
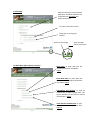
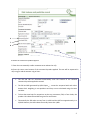
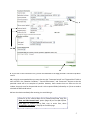
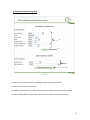
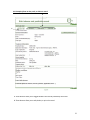
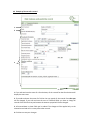
QPRI Express
User Guide
Illustrated User Guide for QPRI Express
DISCLAIMER
Users are solely responsible for their utilization of QPRI Express . No ministry or
government organization may be held responsible for the application of results generated
by QPRI Express .
Table of Contents
1. HOME PAGE
2
1.1 MAIN MENU (AFTER OPENING A SESSION)
2
2. DATA ENTRY
3
3. BATCH DATA ENTRY
6
3. REPORTS AND COMPILATION
9
3.1 COMPILATION IN TABLE FORM
3.1.1 EXAMPLE OF A DETAILED COMPILATION BY FIELD
3.1.2 EXAMPLE OF A DETAILED COMPILATION BY CROP (2 CROPS)
3.1.3 GLOBAL PORTRAIT OF ONE FARM BUSINESS OVER TWO YEARS
3.2 GRAPHIC COMPILATION
3.2.1 EXAMPLE OF A FIELD COMPARISON
3.2.2 EXAMPLE OF A FARM BUSINESSES COMPARISON
3.2.3 EXAMPLE OF ANNUAL RISK MONITORING OF A FARM BUSINESS
3.2.4 EXAMPLE OF ANNUAL RISK MONITORING OFA NUMBER OF FARM BUSINESSES
9
10
11
12
13
14
15
16
17
4. VIEWING AND EDITING ENTERED DATA
18
4.1 EXAMPLE OF HOW TO VIEW, EDIT, OR DELETE A RECORD
4.2 EXAMPLE OF HOW TO EDIT A RECORD
19
20
1
1. Home Page
General information on the software
application: foreword and disclaimer,
comprehensive user guide, and
update information
To create a new user account
To log into an existing user
account
Return to top of page
1.1 Main Menu (after opening a session)
Return to QPRI
Express main menu
Data Entry: to enter data into the
record and calculate risk indexes
Page 3
Batch Data Entry: to enter data into
the record more quickly and calculate
risk indexes Page 6
Page 4
Compilation and Reports: to view all
entered data in table or graph form. This
section provides an easy way to monitor
risk evolution. Page 9
View and Edit Entered Data: to view,
edit, print, or delete entered data.
Page 18
2
2. Data Entry
1
1
2
3
4
5
1. Select or add a new farm business. Select or add a treated field and its area.
2. Select this field’s crop type.
3. Enter treatment date. If you have multiyear data to enter, begin with earliest year. Note that it is not
possible to enter data for years prior to 2000.
4. Select an application technique (type of sprayer or seed treatment, etc.).
5. View commercial product list in one of four product categories provided (fungicides, herbicides,
insecticides, other). Then select registered pesticides for the targeted pest(s) (next page).
To add a product that is not in the list: Select this command only when using the QPRI Express
as
a pesticide registry. Risk indexes cannot be calculated for products that were not in the initial list.
N.B. If you wish to include an procedure that is not a pest control treatment, you can add it here. For
example, enter “mechanical weeding” as a “new product.”
3
6
7
8
6. Select the commercial product applied.
7. Enter the area treated (a smaller treatment area reduces the risk).
8. Enter the rate or total amount of the commercial product applied. The rate will be expressed in
ml/ha org/ha and the amount in kg or liters.
·
The ERI and HRI are calculated automatically once the amount of the selected
commercial product applied is entered.
·
cannot be compared with each other
The ERI and HRI generated by QPRI Express
because their weighting is not equivalent and they are not calculated using the same
variables.
·
To have the same basis for comparison at the crop, treatment, field, or farm levels, the
product risk indexes ERI and HRI are given for one hectare.
·
Theoretically the ERI value can vary from 1 to 961 and the HRI from approximately 1 to
23,040. However, the HRI indexes are usually lower than 1,000.
4
9
10
11
9. If you click on the information icon, you will be redirected to the SAgE pesticide “commercial product”
record.
10. It is highly recommended that you enter data into the “Treatment Period” and “Targeted Pest” fields as
well as those in the “Weather Conditions,” “Control Effectiveness,” and “Comments” sections so that the
pesticide record will be as complete as possible. However, these sections have no effect on the risk
indexes; they only serve for the pesticide record. It is the required fields (indicated by an *) that are used to
calculate the ERI and HRI values.
11. Save the data immediately after entering it to avoid losing it.
Comment: All the entered data can be viewed and printed using the
“View and Edit Entered Data” option (Page 18) on the QPRI Express
home page. To monitor risk by field, crop, or entire farm, select
“Compilation and Reports” (Page 9) on the home page.
5
3. Batch Data Entry
This section enables you to make multiple entries at once. Risk indexes for a single product
cannot be viewed in this part of the software application. To do so, see Section 2 of this guide.
1
2
3
2
3
4a
1. Select a farm business.
2. Select treatment date, application technique, type of pesticide, commercial product, and rate applied.
3. It is highly recommended that you enter data into the “Treatment Period” and “Targeted Pest” fields
as well as those in the “Weather Conditions,” “Control Effectiveness,” and “Comments” sections so that
the pesticide record will be as complete as possible. However, these sections have no effect on the risk
indexes; they only serve for the pesticide record. It is the required fields (indicated by an *) that are used
to calculate the ERI and HRI values.
N.B. To enter data in the latter three sections, click on the “+” icon.
4 a. Click on “Select Product.”
6
4b
4b. The selected product and part of the entered data will be displayed in the “Selected Product”
table. The previously completed fields inside the brackets will be reset so that another product can
be entered by repeating steps 2 to 4a.
The following is an example of a triple product entry.
7
5
5
6
5. Select or add one or more fields in which all treatments were applied.
3. Compilation et rapport
6. Click on “Save Entry.”
IMPORTANT: When the above entry is saved, the three treatments (NOVA 40W, DECIS 5 EC and
INTREPID 240F) are recorded for both selected fields (Honeycrisp and Spartan). The software will
record 3 * 2 = 6 treatment records:
Product
SUPRA CAPTAN WDG
SUPRA CAPTAN WDG
DECIS FL
DECIS FL
INTREPID 240F
INTREPID 240F
Field
Honeycrisp
Spartan
Honeycrisp
Spartan
Honeycrisp
Spartan
See Section 4 of this guide if you make a mistake entering batch data.
8
3. Reports and Compilation
This section enables you to display risk compilations in table or graph form.
3.1 Compilation in table form
1
2
1
3
4
5
1. Select a farm business.
2. Select year.
3. Select “Detailed” or “Global.” If you select “Global,” advance to Step 5.
4. Select “Field” or “Crop” depending on the type of compilation you want.
5. Click on “Run.”
9
3.1.1 Example of a detailed compilation by field
When the ERI and HRI are related to the area cultivated, the QPRI generates risk indicators
(PestRI-E/ha and PestRI-S/ha) by crop, field, or farm business. For example, for a given
crop, the ERI and HRI for each product are multiplied by the area treated. The sum of the
results divided by the crop area gives the PestRI-E and PestRI-S.
Here the PestRI-E/ha and PestRI-S/ha indicators represent the total risk for each field in
the selected year. They express the risk per hectare as a function of the area treated―one
application of the same product on 10 hectares will affect the indicator less than if applied
on 20 hectares.
10
3.1.2 Example of a detailed compilation by crop (2 crops)
Here the PestRI-E/ha
and PestRI-S/ha
indicators are
calculated over one
year for two different
crops (strawberry and
apple) in order to
compare risk between
crops on the same
farm.
Risk indicators for two strawberry fields (Orléans and Veestar) are displayed here. The
following will help you understand how risk is calculated for a crop:
PestRI-E for the Orléans field = 377 * 6 ha = 2,262 +
PestRI-E for the Veestar field = 1,126 * 5 ha = 5,630
7,892
The total, 7,892, is then divided by 11 ha to obtain a PestRI-E/ha of 717.
This procedure is identical to that used to calculate the crop PestRI-S.
11
3.1.3 Global portrait of one farm business over two years
A global compilation summarizes
risk indicators (PestRI-E and
PestRI-S) over several years
and/or several farms, resulting in
a shorter table.
Pressure indexes (amount of
active ingredient applied per
hectare) help explain the level of
risk. Risk is affected both by the
amounts applied and by how
hazardous the product is. The
pressure index can give you an
idea whether it is the products or
the amounts used that contribute
the most to the risk level.
To summarize, the ERI and HRI
risk indexes help you choose
the least hazardous pesticides,
while the PestRI-E and PestRI-S
risk indicators allow you to
analyze the change in pesticide
risk in relation to the scale of
pesticide use.
PestRI-E/ha and PestRI-S/ha
represent the total risk for the
farm in a given year. These
indicators express risk as a
function
of
the
area
treated―treatments applied to
larger areas contribute more to
the PestRI-E/ha and PestRIS/ha indicators.
12
3.2 Graphical compilation
1
2
3
4
5
1. Select a type of graph:
a) “Field Comparison,” for a portrait of the risk in various fields of the
same farm business.
b) “Farm Businesses Comparison,” for a graphical portrait of the risk of
the farm businesses in your account.
c) “Annual Monitoring of a Farm Business,” for a graphical
representation of the risk for a single farm business over several year
d) “Annual Monitoring of Farm Businesses,” for a graphical
representation of the risk of a number of farm businesses over several
years
2. Select a farm business if you’ve chosen the “Field Comparison” or “Annual Monitoring of Farm
Businesses” options.
3 . Select a year if you’ve chosen the “Field Comparison” or “Farm Businesses Comparison” options.
4 . Click on “All,” to obtain all fields, farm businesses, or crops, or on “Select” to choose particular
fields, farm businesses, or crops.
5 . Click on “Run.”
13
3.2.1 Example of a field comparison
Field comparisons allow you to compare levels of risk in various fields for the same farm
business. If you have a number of crops per farm business, the risk levels in all fields and
crops are displayed and are then broken down by crop (see the following example for
one crop).
2
1
1. This side of the graph displays the scale for the PestRI-Environment (PestRI-E) and PestRI-Health
(PestRI-S) indicators, represented by the bars.
2. This side of the graph displays the scale for the pressure index, represented by the yellow dot.
14
3.2.2 Example of a farm businesses comparison
Farm businesses comparisons allow you to compare risk levels between the various farm
businesses in your account for a particular year. If you have a number of crops per farm business,
the risk for all crops and farm businesses is displayed and then broken down by crop (see the
following example for one crop).
1
2
1. This side of the graph displays the scale for the PestRI-Environment (PestRI-E) and
PestRI-Health (PestRI-S) indicators, represented in bar form.
2. This side of the graph displays the scale for the pressure index, represented by the
yellow dot.
15
3.2.3 Example of annual risk monitoring of a farm business
Annual risk monitoring of a
farm business enables you
to follow the evolution of
risk to health and the
environment from year to
year for a single farm
business.
The pressure index helps
explain how the amounts
applied affect the level of
risk.
For
example,
decreasing the amounts
does
not
necessarily
diminish the risk. In 2008
the
amounts
applied
dropped but the risk to the
environment rose.
If a number of crops are
entered for the same farm
business, a separate annual
risk assessment will be
displayed for each crop as
well as an overall portrait
for the entire farm business.
16
3.2.4 Example of annual risk monitoring of a number of farm businesses
Farm 1
Farm 2
Farm 3
Farm 4
Annual risk monitoring of a
number of farm businesses
also allows you to follow the
evolution of health and
environmental risk from year
to year.
This type of compilation only
takes into account the overall
risk for each farm business
and cannot be broken down
by crop. For information on
how to compile risks by crop,
see the graphical compilation
of annual monitoring of a
farm business (3.2.3, page 16)
Farm 2
Farm 1
Farm 4
Farm 3
Note that the “all farm
businesses” curve represents
an average of the risk and the
pressure index for all the farm
businesses in your account. It
enables you to compare one
business
with
all
the
businesses together.
To display this type of
compilation more clearly,
select only a few farm
businesses at a time to avoid
overlapping curves.
17
4. Viewing and Editing Entered Data
1
2
3
4
1. Select search criteria to find the records you want to view, edit, or delete.
2. Click on “Find” to launch the search.
3. To delete a batch data entry, select the farm business and batch entry you want to delete.
4. Click on “Delete Data Entry Records” to delete all the records in the batch data entry.
18
4.1 Example of how to view, edit, or delete a record
2
1
1. These buttons allow you to toggle between the records provided by the search.
2. These buttons allow you to edit, delete, or print the record.
19
4.2 Example of how to edit a record
1
2
3
4
1. If you edit and save the name of a farm business, all the records for that farm business will
display the new name.
2. If you edit and save the name of a field or the crop typed, all the records from that year
will be changed. If you edit and save the area of cultivated field, you have to change all
records of the field for that year because the amount sprayed will not be changed.
3. All entered data in these fields can be edited. The changes will be applied only to the
selected record and will in no way affect other records.
4. Click here to save your changes.
20
QPRI methodology document
Download it at:
http://www.inspq.qc.ca/pdf/publications/750_IRPeQ_anglaisHauteRes.pdf
Registered Pesticides
For a list of registered pesticides for the selected crop and target pest(s), visit the following
websites:
SAgE pesticides
www.sagepesticides.qc.ca
Pest Management Regulatory Agency
http://www.hc-sc.gc.ca/cps-spc/pest/index-eng.php
Contact us if you have any questions about QPRI Express
for the agricultural sector
Pierre-Antoine Thériault
Direction de l'agroenvironnement et du développement durable
200, chemin Ste-Foy, Québec
(Québec) G1R 4X6
Tel.: 418-380-2150, ext. 3178
Fax: 418-380-2163
Email: [email protected]
or
Raymond-Marie Duchesne
200, chemin Ste-Foy, Québec
(Québec) G1R 4X6
Tel.: 418-380-2150, ext. 3181
Fax: 418-380-2163
Email: [email protected]
21