1
Catalogue no. 21F0001XCB
Extraction System of Agricultural
Statistics (ESAS)
User’s Guide – 2005
A Product of the Whole Farm Data Projects
Extraction System of
Agricultural Statistics (ESAS)
2005
User's Guide
21F0001XCB
Version: 12.0
Standards of service to the public
Statistics Canada is committed to serving its clients in a prompt, reliable and courteous manner and in the official language of their choice. To this end, the Agency has developed standards of service that its employees
observe in serving its clients. To obtain a copy of these service standards, please contact Statistics Canada toll
free at 1 800 263-1136. The service standards are also published on www.statcan.ca under About Statistics
Canada > Providing services to Canadians.
Table of contents
1.
2.
Preface
5
Introduction
6
Installation
7
1.1
1.2
7
7
Getting started
2.1
2.2
2.3
2.4
2.5
2.6
2.7
2.8
3.
9
Starting ESAS
Accessing on-line HELP
Primary options
Menu bar
Drop-down menus
Hot keys
Manuals
Quitting ESAS
9
9
10
10
10
11
11
11
Tabulation creation
12
3.1
12
12
13
13
15
15
16
16
3.2
4.
Hardware requirements
Installation instructions
Pre-established tabulation
3.1.1 Data
3.1.2 Year
3.1.3 Province
3.1.4 Farm type
3.1.5 Revenue class
Custom tabulation
3.2.1 Multiple selections
Output and display options
17
4.1
17
18
Pre-established tabulation
4.1.1 Types of reports
I
Revenues and expenses (unincorporated and
incorporated sectors)
II
Off-farm income of farm operators
(unincorporated sector)
III
Off-farm income (unincorporated and
incorporated sectors)
IV
Additions and disposals (unincorporated and
incorporated sectors)
V
Off-farm income of farm families
(unincorporated sector)
VI
Crops
VII
Livestock
VIII
Assets and liabilities
IX
Capital
3
18
19
19
19
20
20
20
20
21
Table of contents – concluded
4.
Output and display options – concluded
4.1.2
4.2
Types of output
I
Viewing
II
Printing
III
Browsing
IV
Creating a disk file
V
Creating a record layout
VI
Creating a print image file
Custom tabulation
4.2.1 Report
4.2.2 Types of output
I
Viewing
II
Printing
III
Browsing
IV
Reorganizing your report
V
Performing a calculation
VI
Calculating a percentage change
VII
Creating a graph
VIII
Creating a disk file
IX
Creating a record layout
X
Creating a print image file
21
21
22
22
23
24
24
25
25
26
26
27
27
27
29
30
32
34
34
35
5.
Quitting ESAS
36
6.
Tutorials
37
6.1
6.2
37
41
7.
Pre-established tabulation tutorial
Custom tabulation tutorial
Glossary and symbols
52
7.1
7.2
52
53
Glossary of commonly used terms
Symbols used within ESAS tabulations
Appendix
A.
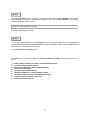
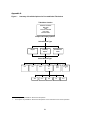
Summary of tabulation options
Figure 1
Figure 2
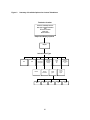
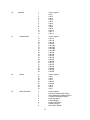
B.
Summary of options for pre-established tabulations
Summary of options for custom tabulations
ESAS codes for custom tabulations
54
55
56
4
Preface
Agriculture and Agri-Food Canada and Statistics Canada are pleased to provide you with this CDROM product available from the Whole Farm Data Projects (WFDP). The Extraction System of
Agricultural Statistics (ESAS) provides users with an extensive collection of the most commonly
requested physical and financial farm data, available in pre-established or custom formats.
This User's Guide and its accompanying CD-ROM were made possible by the efforts of numerous
individuals within both Statistics Canada and Agriculture and Agri-Food Canada. Coordination and
guidance were provided by Denis Chartrand, Paul Paradis and Jacques Lemieux from Agriculture
Division of Statistics Canada and by Dave Culver of Agriculture and Agri-Food Canada. Michelle
Desjardins and Linda Bonenfant from Statistics Canada contributed valuable technical expertise to
develop this version of ESAS and Noreen Jones and Louise Larouche updated the documentation.
Mélanie Lefebvre, Lina Di Piétro and Lucie Pilon also contributed to this project. The realization of this
project would not have been possible without the contribution and guidance provided by the various
provincial governments and farm organizations throughout Canada.
5
Introduction
The Extraction System of Agricultural Statistics (ESAS) is a computerized system that enables
users to extract predetermined whole farm data estimates by region, farm type, and revenue class.
This guide offers step-by-step instructions on how to install and use ESAS. A brief outline of the
various options available is also included. ESAS is one in a series of products and services offered by
the Whole Farm Data Projects. For more information about this project, consult the Extraction System
of Agricultural Statistics – Reference Manual.
This User's guide will help to:
•
verify that you have the necessary hardware to install ESAS on your computer system;
•
acquaint you with the capabilities of the extraction system;
•
demonstrate how to use the various system features.
The ESAS User's Guide is both a training tool and a reference guide which will guide you through the
system. Additional help can be found through an on-line Help menu which was developed in
conjunction with this user's guide.
The guide covers a wide variety of topics in seven chapters:
Installation describes the minimum hardware required to run your version of ESAS. Once you have
verified that your hardware meets the minimum requirements, you can move on to the easy-to-follow
installation instructions.
Getting Started introduces you to the special features of ESAS, and explains how to start-up the
system. Remember that help is only a keystroke away.
Tabulation Creation outlines the commands and options available on ESAS to select and extract
variables in order to create pre-established or custom tabulations. Each of the five available selection
criteria is described in a sub-section of the chapter.
Output and Display Options explains each of the output and display options, including reports,
summary reports, and distributional tables. Attention is also given to on-screen display, printing,
reorganizing the report, performing calculations including calculating percentage changes, creating
graphs, as well as to the creation of disk files and print image files.
Quitting ESAS explains how you can exit ESAS completely or switch from the pre-established to the
custom tabulation mode and back.
Tutorials show you how to operate ESAS with step-by-step examples. Some of the features
described in the other chapters are demonstrated.
Glossary and Symbols lists and defines a selection of the most commonly used terms found within
this guide and familiarizes you with standard symbols used by Statistics Canada.
6
1.
Installation
Because of the volume of data in ESAS, the speed of the system will vary according to the CD-ROM
reader and the available memory capacity of your computer system. The minimum hardware
requirements and installation instructions for the ESAS CD-ROM are outlined below.
1.1
Hardware requirements
The minimum hardware necessary to run the ESAS CD-ROM are:
•
IBM compatible computer PC/486 or better
•
16 Mb of RAM
•
30 Mb of free space on the hard drive (maximum free hard disk space will enable you to extract
more records when producing custom tables)
•
Microsoft Windows95 or higher
•
CD-ROM reader drive with appropriate controller and interface cable
•
Colour or monochrome monitor
•
Mouse recommended
•
Printer recommended
1.2
Installation instructions
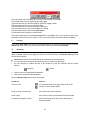
To install ESAS:
•
Insert the ESAS CD-ROM into your CD-ROM reader.
•
Click on Start and Run. In the Browse window, select from the CD-ROM the directory ESAS2005,
and the file SETUP.EXE. Click on OK and OK again in the Run Window or type X:\ESAS2005
\SETUP.EXE, where X is your compact disc drive letter, then choose OK.
•
After reading the Welcome screen, click on OK. Type your name and the information concerning
your organization on the second screen and click on OK. On the third screen, click on OK to
continue or on Change to go back to the previous screen.
•
Destination: The next screen lets you select the drive and directory in which to install ESAS. The
default directory is C:\ESAS2005. Click on OK to continue or click on Change if you want to select
a different directory (it is important to select the new directory on that screen instead of the next
one, even if it is possible to do so). In the next screen, click on the large button that looks like a
monitor.
7
•
When the message Installation is complete appears, click on OK to terminate the installation.
•
Upon completion of the installation, it is advisable to re-start Windows to allow this change to take
effect.
Warning!
In order to update ESAS, you will have to reinstall it by following the steps listed on the previous
page.
To make sure that you are using the latest version, it would be preferable to delete the directories
created during previous installations.
Note: We suggest that you use only the last version of ESAS because the data from
previous versions may have been revised.
8
2.
Getting started
This chapter will show you how to:
•
•
•
•
•
•
2.1
start ESAS,
access on-line HELP,
choose the best tabulation option,
use the special features (such as hot keys),
access the manuals on-line, and
exit ESAS.
Starting ESAS
To start ESAS:
1. Ensure that both your computer and the CD-ROM drive are turned on and that the CD-ROM disc
is in the drive.
2. From the Start menu, select Programs, Statistics_Statistique Canada and the ESAS_SESA
2005 item that was created during the installation.
A standard Statistics Canada screen will appear offering you a choice of either English or French
texts. This will be followed by two screens outlining the Limited Use Data Product Licence
Agreement. This agreement includes all the rules and regulations regarding the use of this
Statistics Canada data product. First-time users should read it carefully before indicating their
compliance. If you have any questions or require any additional information about this agreement,
a telephone number is provided.
3. When first installing ESAS, in the CD-ROM reader drive window, click on Select. From the Select
Directory window, click on Select or Cancel to go back to the previous screen, and then click on
Select or Continue. If ESAS cannot find the Acrobat Reader, then in the Software Acrobat
Reader window, select the working language to start the installation of the software.
4. If ESAS cannot find the data base files, you will be prompted to provide the necessary information.
When ESAS recognizes the data base files, the presentation screen will appear. Press Continue
to access ESAS.
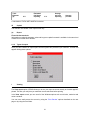
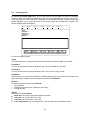
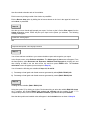
2.2
Accessing on-line HELP
The on-line HELP function consists of a series of screens designed to provide you with important
background information and practical guidance wherever necessary.
1. To activate the HELP function, press F1 : HELP.
2. To exit the HELP function and return to your activity, you can either click on the upper right close
box of the help window or click once on the question mark and then on Close, or press Esc.
close box
9
2.3
Primary options
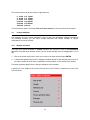
The Extraction System of Agricultural Statistics (ESAS) was developed to serve you in two unique
ways. Using standard output formats, ESAS compiles pre-established tables featuring the
disaggregated physical and financial data that is characteristic of the Whole Farm Data Base (WFDB).
If the pre-established tables do not satisfy your particular needs, ESAS provides you with the option of
creating a custom tabulation. This option allows you to rapidly look at specific data by enabling you to
select only the variables you require. Custom tabulation allows you to produce tables by combining the
available data types or data variables such as years, regions, farm types, and revenue classes.
Click on the type of tabulation you wish to produce.
2.4
Menu bar
Once you have determined your tabulation requirements, the system will display the main menu bar
along the top of the screen with a status box listing the current selections.
The menu bar controls the search, display and output selections of the system. The same menu bar is
used for both pre-established and custom tabulations.
It can be accessed in a number of ways. You can simply click on the menu item you wish to access.
Otherwise, press the Alt key to activate the first function on the menu bar and then use the left and
right arrow keys () followed by the ENTER key. You can access a specific menu function by
pressing the Alt key plus the underlined letter of the desired menu item (for example, Alt Y will
activate the Year function).
2.5
Drop-down menus
Drop-down menus are selection boxes which appear when you choose an item from the main menu
bar. Each menu lists the options available for that particular menu choice. Choosing an item from the
drop-down menu may initiate a subsequent drop-down menu and another choice.
10
Specific items in each drop-down menu can be selected by clicking on them with your mouse, moving
to them with the up and down arrow keys (), or by using hot keys (described in section 2.6).
2.6
Hot keys
ESAS has been designed with a number of hot keys for quick and easy access to the main menu bar,
the drop-down menus, and the various screens. The hot keys are either letters or numbers and are
easily identified because they are underlined.
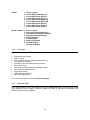
The hot keys for the main menu bar are:
Data
(D)
2.7
Year
(Y)
Province
(P)
Farm Type
(F)
Revenue Class
(R)
Output
(O)
Quit
(Q)
Manuals
(M)
Manuals
In addition to the HELP function, you now have access to the ESAS Reference Manual and the ESAS
User’s Guide directly from ESAS. Select the desired document from the Manuals function on the
menu bar by clicking on the function itself or by pressing Alt M.
Then click on Reference Manual or press the hot key R to access the ESAS Reference Manual. Click
on User’s Guide or press the hot key G to access the ESAS User’s Guide.
The ESAS Reference Manual is designed to familiarize users of ESAS with the structure and quality of
its data, as well as with other WFDB products and services.
The ESAS User’s Guide is both a training tool and a reference guide which will guide you through the
system with its many chapters and tutorials.
In order to have access to these manuals online, you must have the Acrobat Reader software on your
computer.
2.8
Quitting ESAS
To leave the system:
1.
2.
3.
4.
Select the QUIT option on the menu bar.
From the drop-down menu select Yes.
Press ENTER.
You will be prompted to confirm this choice with the message Are you sure? and the options to
select Yes or Cancel.
11
3.
Tabulation creation
By combining the variables offered, you can create a large variety of pre-established and custom
tables.
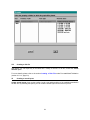
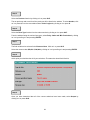
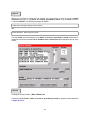
3.1
Pre-established tabulation
A status box on the screen will keep track of all of your current selections:
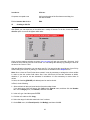
3.1.1
Data
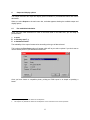
ESAS contains many types of data. When Data is selected, a drop-down menu (for pre-established
tables) or a window (for custom tables), similar to the one below, appears listing the available types of
data.
12
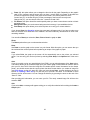
3.1.2
Year
For some types of data, ESAS can provide data as far back as 1993. A message will appear indicating
if data are not available for a chosen year. The years and provinces for which data are not available
are listed below by type of data.
3.1.3
Province
The Province drop-down menu lists 11 options: data for the ten provinces and a total. Information for
all provinces, except Newfoundland and Labrador and Prince Edward Island, is available at the
Census Agricultural Regions (CARs) level. This more detailed breakdown is indicated by an arrow
after the province. A message will appear indicating when data are not available for a chosen province
or region. The breakdowns for each of the provinces are:
Nova Scotia
a
b
c
d
e
f
Total of regions
Census Agricultural Region 1
Census Agricultural Region 2
Census Agricultural Region 3
Census Agricultural Region 4
Census Agricultural Region 5
New Brunswick
a
b
c
d
e
Total of regions
Census Agricultural Region 1
Census Agricultural Region 2
Census Agricultural Region 3
Census Agricultural Region 4
Québec
a
b
c
d
Total of regions
Bas-Saint-Laurent
Saguenay, Lac-Saint-Jean, Côte-Nord
Québec
13
e
f
g
h
i
j
k
l
m
n
o
Mauricie
Estrie
Montréal, Laval
Lanaudière
Outaouais
Laurentides
Abitibi-Témiscamingue, Nord-du-Québec
Gaspésie, Îles-de-la-Madeleine
Chaudière, Appalaches
Montérégie
Centre-du-Québec
Ontario
a
b
c
d
e
f
Total of regions
Southern Ontario Region
Western Ontario Region
Central Ontario Region
Eastern Ontario Region
Northern Ontario Region
Manitoba
a
b
c
d
e
f
g
h
i
j
k
l
m
Total of regions
Census Agricultural Region 1
Census Agricultural Region 2
Census Agricultural Region 3
Census Agricultural Region 4
Census Agricultural Region 5
Census Agricultural Region 6
Census Agricultural Region 7
Census Agricultural Region 8
Census Agricultural Region 9
Census Agricultural Region 10
Census Agricultural Region 11
Census Agricultural Region 12
Saskatchewan
a
b
c
d
e
f
g
h
i
j
k
l
m
n
o
p
q
r
s
t
u
Total of regions
Census Agricultural Region 1A
Census Agricultural Region 1B
Census Agricultural Region 2A
Census Agricultural Region 2B
Census Agricultural Region 3AN
Census Agricultural Region 3AS
Census Agricultural Region 3BN
Census Agricultural Region 3BS
Census Agricultural Region 4A
Census Agricultural Region 4B
Census Agricultural Region 5A
Census Agricultural Region 5B
Census Agricultural Region 6A
Census Agricultural Region 6B
Census Agricultural Region 7A
Census Agricultural Region 7B
Census Agricultural Region 8A
Census Agricultural Region 8B
Census Agricultural Region 9A
Census Agricultural Region 9B
14
Alberta
a
b
c
d
e
f
g
h
i
British Columbia a
b
c
d
e
f
g
h
i
3.1.4
Total of regions
Census Agricultural Region 1
Census Agricultural Region 2
Census Agricultural Region 3
Census Agricultural Region 4A
Census Agricultural Region 4B
Census Agricultural Region 5
Census Agricultural Region 6
Census Agricultural Region 7
Total of regions
Vancouver Island-Coast Region
Lower Mainland-Southwest Region
Thompson-Okanagan Region
Kootenay Region
Cariboo Region
North Coast Region
Nechako Region
Peace River Region
Farm type
ESAS offers a selection of 11 farm types to choose from:
•
•
•
•
•
•
•
•
•
•
•
Oilseed and grain farming
Potato farming
Other vegetable (except potato) and melon farming
Fruit and tree nut farming
Greenhouse, nursery and floriculture production
Other crop farming
Beef cattle ranching and farming, including feedlots
Dairy cattle and milk production
Hog and pig farming
Poultry and egg production
Other animal production
You also have the option of selecting Total of farm types.
3.1.5
Revenue Class
ESAS provides data for farms with reported revenues of $10,000 and over. These farms are divided
using standard revenue classes. Revenue includes the sales of agricultural commodities plus
agricultural payments and subsidies.
15
The revenue levels used by the Census of Agriculture are:
$ 10,000
$ 25,000
$ 50,000
$ 100,000
$ 250,000
$ 500,000
to $ 24,999
to $ 49,999
to $ 99,999
to $ 249,999
to $ 499,999
and over
You also have the option of selecting Total of revenue classes for the sum of all revenue classes.
3.2
Custom tabulation
The advantage of using "Custom tabulation" is that for all the pre-established variables described in
the preceding sections, you can make multiple selections and choose variables in specific
combinations to meet your needs.
3.2.1
Multiple selections
The main menu options available for Custom tabulation are identical to those for Pre-established
tabulation. Using the same selection criteria, you can choose multiple items for disaggregation. To do
this:
1. click on the chosen menu item or move your cursor to the menu item and press ENTER.
2. A window will appear listing all of the separate variables offered for that particular menu choice. If
you wish to choose all of the items, press Esc to exit the window or click outside of the window.
The same procedure applies when a selection initiates a second window.
A status box in the middle of the screen will keep track of the number of selections for each of the
menu functions.
16
4.
Output and display options
This chapter describes the output and display options available for pre-established tables and custom
tabulations.
When you select Output on the main menu bar, a window appears showing the available output and
display options.
4.1
Pre-established tabulation
Once you have made selections for each of the items listed in the status box, you are ready to
produce either:
•
•
•
a report,
a summary report1, or
a distributional table2.
The availability of the output formats varies according to the type of data selected.
This is where the Print Setup option will appear which will let you select a printer if you don’t want to
use the default printer in your Windows environment.
Once you have chosen a compatible printer, printing an ESAS report is as simple as pressing a
button.
1.
2.
This output is only available for “Revenues and Expenses”.
This output is only available for “Revenues and Expenses” and for “Off-Farm Income of Farm Operators”.
17
4.1.1
Types of reports
I
Revenues and expenses (unincorporated and incorporated sectors)
If you select Revenues and Expenses all three types of reports are available.
(a)
Report
Statement of revenues and expenses
Both pages of this report are headed with a list of your selection criteria as it appeared in the status
box. A detailed breakdown of farm revenues and expenses for the selected criteria is presented. The
estimates are shown in the following format:
Total
Estimate
($)
(b)
C.V.
Estimated
# of farms
reporting
C.V.
Average
per farm
reporting
Average
per farm
Summary report
Summary of revenues and expenses
A summary report is also available for revenues and expenses. It combines subtotals from the
Statement of Revenues and Expenses with a calculation of NET OPERATING INCOME (before
depreciation).
(c)
Distributional table
Distribution of net operating income
This table presents a series of breakdowns using the revenue classes and predetermined levels of net
farm operating income.
The net operating income levels used for disaggregation purposes are:
$0
$1
$10,000
$25,000
$50,000
or less
to $ 9,999
to $ 24,999
to $ 49,999
and over.
The distributional table provides the following calculations:
•
Average revenue per revenue class in the following categories:
$ 10,000
$ 25,000
$ 50,000
$ 100,000
to $ 24,999
to $ 49,999
to $ 99,999
and over.
•
Breakdown of the number of farms in each revenue class by net operating income
•
Total operating expenses per $ of farm revenue
•
Total operating expenses (less interest) per $ of farm revenue
18
II
Off-farm income of farm operators (unincorporated sector)
The Report and the Distributional Table are available when you select off-farm income of farm
operators.
(a)
Report
Summary of the off-farm income and the statement of revenues and expenses for farm
operators.
The report is a breakdown of the elements that make up off-farm income. In addition, summary totals
of revenues and expenses are presented for comparison purposes. The estimates are presented in
the following format:
Total
Estimate
(b)
C.V.
Average
per farm
Distributional table
Distribution of total income of operators involved in a single operation, unincorporated sector.
This table makes use of the same net operating levels and predetermined revenue classes used in the
Distribution of Net Operating Incomes table (section 4.1.1 I (c), page 18). In this case, average offfarm incomes are compared to average net operating incomes.
III
Off-farm income (unincorporated and incorporated sectors)
This selection is available in the report format only.
(a)
Report
Summary of the off-farm income (unincorporated and incorporated sectors).
The report is a breakdown of the elements that make up off-farm income and is presented in the
following format:
Total
Estimate
IV
C.V.
Average
per farm
Additions and disposals (unincorporated and incorporated sectors)
This selection is available in the report format only.
(a)
Report
Additions and disposals of depreciable assets
This report is a breakdown of the additions and disposals of assets by classes determined by Canada
Customs and Revenue Agency, presented in the same report format.
19
V
Off-farm income of farm families (unincorporated sector)
This selection is available in the report format only.
(a)
Report
Summary of the off-farm income and the statement of revenues and expenses for farm families
involved in a single operation, unincorporated sector.
This report is identical in format to that described for the report for Off-Farm Income of Farm Operators
(section 4.1.1 II (a), page 19). The elements of off-farm income as well as summary totals of revenues
and expenses are presented for single farm families.
VI
Crops
This section is available in the report format only.
(a)
Report
Physical characteristics
The report provides the following details about land use for a number of crops:
Total
Estimate
(acres)
VII
C.V.
Estimated
# of farms
reporting
C.V.
Average
per farm
reporting
Average
per farm
Livestock
Similar to crops, livestock data are available in the report format only.
(a)
Report
Physical characteristics
The report provides the following details for various animal categories.
Total
Estimate
(# of animals) C.V.
VIII
Estimated
# of farms
reporting
C.V.
Average
per farm
reporting
Average
per farm
Assets and liabilities
These data are available in the report format only:
(a)
Report
Financial characteristics
The report provides details on current, long-term, other, and non-farm assets and liabilities, in the
following format:
20
Total
Estimate
($)
C.V.
Estimated
# of farms
reporting
C.V.
Average
per farm
reporting
Average
per farm
A calculation of TOTAL NET WORTH is included.
IX
Capital
This selection is available in the report format only.
(a)
Report
Financial characteristics
Information on capital investments, sales and long-term capital borrowed is available in the same level
of detail as for Assets and Liabilities.
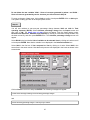
4.1.2
Types of output
Once you have chosen an output option and the system has processed your selection, a screen will
appear offering these options:
I
Viewing
The View report option of ESAS allows you to see your report on-screen exactly as it would appear if
printed. This lets you verify that you made the correct selections before printing.
In the View report screen you can use all of the Windows options such as minimize, maximize and
resize a window.
You can move easily across the screen by using the “Print Preview” options described on the next
page or by using the scroll bars.
21
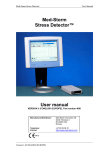
From left to right, the first button lets you return to the first page of the report.
The second button lets you display the preceding page.
The third button lets you choose a page by specifying a page number.
The fourth button lets you move to the next page.
The fifth button lets you view the last page of the report.
The sixth button lets you select a percentage for viewing.
The next button lets you exit from the View report.
The last button lets you print the viewed report.
There are several ways to exit the View report screen: press Esc; click on the close box on the righthand side of the “Print Preview” screen; or click once on the Report Generator and then on Close.
II
Printing
If you select Print report, the report is automatically sent to the printer you selected earlier. From the
Output drop-down menu, you can verify your printer selection by choosing Print Setup.
III
Browsing
The Browse data option allows you to move more easily through the data than the View report
option, although reports do not appear on-screen in their final format. The Browse data option has
several useful features:
•
•
•
title locks allows you to scroll the data while maintaining the identifying titles,
you can manoeuver throughout the report and return to where you first began,
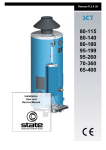
you can maximize or restore the size of the window by using the maximize and the restore
buttons,
maximize
•
•
restore
columns can be compressed and expanded,
rows can be compressed and expanded.
Using the Browse data option is quick and simple.
In order to:
Click on:
Zoom in or out
the maximize button in the upper right corner of the
window or on the restore button
Scroll up, down, left and right
the scroll arrows on the scroll bars
Scroll quickly
the scroll box on the vertical and horizontal scroll bars
Compress or expand a column
the line at the edge of the title column and drag it to
the desired width
22
In order to:
Click on:
Compress or expand a row
the line at the edge of the first data row and drag it to
the desired width.
Exit the browse data window
ESC.
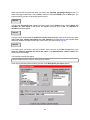
IV
Creating a disk file
With ESAS, you can export any of the tables into a variety of formats. To do this, choose the Create
disk file option. A screen will appear which asks:
Once you have made a selection, a screen (see next page) will ask you to provide a file name. It will
indicate in which directory the file will be saved. You can change the directory by pressing the arrow at
the end of the “Save in:” field.
After providing this information, you can save your file. You can review the record layout of your file by
either viewing it on-screen or printing it. These choices are available on the Output screen.
Note: Once a Lotus or Excel file has been created, it may be necessary to enlarge the column widths
in order to view the various field codes. Also, Lotus and Excel will read the estimates as labels;
therefore, if you need to use the estimates in calculations it is first necessary to convert them to
values.
In Lotus, the function @VALUE (cell address) can be used to do this.
In Excel, do the following:
1 Select a blank cell that you know has the General number format.
If you aren’t sure of the cell format, click Cells on the Format menu, and then click the Number
tab. In the Category box, click General, and then click OK.
2 In the cell, type 1 and then press ENTER.
3 Click the cell, and then click Copy.
4 Select the range of cells that contain the “text” numbers.
5 On the Edit menu, click Paste Special, click Multiply, and then click OK.
23
V
Creating a record layout
Create record layout gives you the position, length, type and description of the variables presented in
the disk file. By selecting this option, you can view the record layout of a report or distributional table
on the screen or you can print it.
VI
Creating a print image file
If you do not wish to print your report directly from ESAS, you can take advantage of the Create a
print image file option. This feature allows you to create an image file of your chosen report on disk
which can later be used to print your file from DOS. Since the image file will contain specific control
characters for the chosen printer, you should ensure that the correct printer has been chosen before
you create an image file (see Print Setup on the next page). Once you have chosen Create a print
image file, a screen similar to the one in section IV Creating a Disk File will ask you to provide a file
name. It will indicate in which directory the file will be saved. You can change the directory by pressing
the arrow at the end of the “Save in:” field.
24
After providing this information, you can save your file. The newly created Print Image file will have the
extenstion .PRT.
4.2
Custom tabulation
When creating custom tabulations, you can select more than one item offered in the main menu
options, or you can limit your selections to only the variables that you need. For example, you might
choose to extract a few elements among those that make up operating revenues and expenses, and
off-farm income of farm operators and tabulate these data by province, by farm type or by multiple
revenue class. Once you have determined all of the criteria for your custom tabulation, your selections
will be produced by ESAS in a report form.
After making your selections for each of the items shown in the status box, you are ready to choose
one of the following options:
•
•
Select or
Reset selections.
This is where the Print Setup option will appear which will let you select a printer if you don’t want to
use the default printer in your Windows environment.
Once you have chosen a compatible printer, printing an ESAS report is as simple as pressing a
button.
4.2.1
Report
Summary tabulation of the extraction system of agricultural statistics (ESAS)
This report describes:
Data type
Data variable description
Year
Province
CAR (Census Agricultural Region)
Type of farm
25
Revenue class
Total estimate + C.V.
Estimated number of reporting* + C.V.
Average per reporting*
A footnote applicable only to off-farm income has been included on all custom tabulation reports.
* Farms, families or operators depending on the type of report selected.
4.2.2
Types of output
Once you have chosen Select, ESAS offers you the following options in the window:
I
Viewing
The View report option allows you to see your report on-screen exactly as it would appear if printed.
This lets you verify that the correct selections were chosen before printing.
In the View report screen you can use all of the Windows options such as minimize, maximize and
resize the screen.
You can move easily across the screen by using the “Print Preview” options described in the Viewing
section of the pre-established tables (section 4.1.2 I, page 21) or by using the scroll bars.
26
II
Printing
If you select Print report, the report is automatically sent to the printer you selected earlier. From the
Output drop-down menu, you can verify your printer selection by choosing Print Setup.
III
Browsing
All of the Browse data commands apply to both the pre-established and custom tabulation options.
However, an additional option has been included in order to decode the data.
Because custom tabulations contain a wide range of data, we used codes to simplify their
presentation. By using the option Column definitions, each data cell can be easily decoded. This
option can be accessed by using the hot key Alt C or your mouse.
For more details, please refer to the section Browsing under Pre-established Tabulation (section
4.1.2 III, page 22).
IV
Reorganizing your report
The Reorganize your report option allows you to create a report that better meets your needs. Here
are the options available under Reorganize your report:
•
•
Select the variables for your report
Modify the sort for your report.
Select the variables for your report
ESAS allows you to select the variables you want to include in your custom tabulation report and to
give the report a title. To do so, choose Select the variables for your report. The Selection of
variables screen, as shown on the next page, will then appear.
You can modify your custom tabulation report by choosing the variables you require from the ones
available. The selected variables will appear in the column below the title Selected variables that will
appear on the report. You can further modify your selection by deleting some or all of the selected
variables. You can add or delete a variable by clicking on it twice or scrolling to it and then pressing
ENTER, or by scrolling to the variable and pressing Add or Delete.
At the bottom of the Selection of variables screen, you can choose OK to proceed with the selection
of the variables chosen; or Cancel, to return to the previous screen.
ESAS stores the variables you have selected in its memory during your work session.
27
Modify the sort of your report
Modify the sort of your report allows you to sort the contents of your custom tabulation report. From
the List of variables for the sort column that appears on the screen, you can choose the ones that
will be used to sort the contents of your report. You can add variables, delete some or delete all of
them.
28
After choosing your variables, select OK. To cancel your selection, choose Cancel.
ESAS stores in its memory during your work session the variables you have selected for sorting the
contents of your report.
V
Performing a calculation
Perform calculation allows you to create new variables. If more than one type of data has been
selected, the Select type of data screen will appear to allow you to choose the type of data for which
you wish to perform calculations.
Only the types of data you have selected will be highlighted. If you selected only one type of data, the
Select type of data screen will not appear and the Perform calculation screen (see next page) will
appear.
List of variables to be selected from
This list displays all the variables that have been selected for a type of data. To perform a calculation,
click twice on the desired variable and its code will appear in the Calculation box.
Operators
You can carry out basic mathematical operations by selecting the desired operator. By clicking twice
on the symbol, it will appear in the Calculation box.
Decimal
This option allows you to choose the number of decimal points for the variables created. You can
choose between 0 or 2 decimals by clicking once on your preferred option.
Numeric constants
If you want to do such mathematical operations as calculate percentages, you can use Numeric
constants. Click once on the designated box to bring the cursor to this point. Type in the figure to be
used in the calculation selected. Press ENTER and the figure will appear in the Calculation box. If
your constant has 12 figures, it will automatically be placed in the Calculation box.
Calculation
The mathematical operation you have completed will appear in the Calculation box. You have three
options: Recall, Erase or Create new variables.
29
Use Recall to bring into the Calculation box the mathematical operations of the variable which you
have created or deleted. You can create a new variable by selecting one of the variables already
created which will appear in a pop-up window. To create your new variable, click twice on your choice
so that it appears in the Calculation box.
Variable description
Variable description allows you to name the new variable. It is important to identify the variable
before selecting the Create option so that it is easier to read the report.
View created variables
The View created variables option will give you a list of the variables created and the mathematical
operations selected for each.
Delete created variables
You can use Delete created variables to eliminate the variables you have created. The code and
description of each new variable will be displayed. Select the variable or variables you want to delete
and click on Delete created variables.
ESAS stores in its memory during your work session all of the mathematical operations for the
variables you have created.
VI
Calculating a percentage change
Calculate percentage change allows you to calculate year-over-year percentage changes. If more
than one type of data has been selected, the Select type of data screen will appear (the same screen
as for Perform a Calculation, see above) to allow you to choose the type of data for which you wish
to calculate percentage changes.
30
Only the types of data you selected will be highlighted. If you selected only one type of data, the
screen Select type of data will not appear and the Calculate percentage change screen will appear.
List of variables to be selected from
This list displays all the variables that have been selected for a type of data. To calculate a percentage
change, click twice on the desired variable and its code will appear in the Selected variables box.
You can select more than one variable.
Year compared to year
To calculate a percentage change, you must select two reference years. From the left box under Year
compared to Year, click twice on the year you want to select. (The year selected from this box must
be more recent than the year to be selected from the right box.) The selected year will appear in the
box underneath. Repeat the same action to select a year from the right box.
Selected variables
The codes of the selected variables will appear in this box. Three options are available: Erase, Create
or Quit.
Use Create once you have selected at least one variable and two years of comparison. The Erase
option will allow you to delete the variables selected.
View calculated percentage change
The View calculated percentage change option will give you a list of the variables created (i.e.,
variables for which a percentage change is calculated) and their description.
Delete calculated percentage change
You can use Delete calculated percentage change to eliminate the variables you have created. The
code and description of each variable created will be displayed. Select the variable or variables you
want to delete and click on Delete calculated percentage change.
ESAS will store in its memory until your next selection all percentage changes you have created.
31
VII
Creating a graph
By choosing the Create graph option, you can view, print or save your data in a linear or a bar graph,
or as a pie chart. Once you have chosen this option, the system will display the menu bar as well as a
status box listing the current selections. Depending on the variables and type of graph selected, the
options displayed on the menu bar of the screen shown below will not always be available. The
options available will be highlighted.
Graph
Parameter 1
Graph
Parameter 1
Parameter 2
Parameter 3
Estimate
Parameter 2
Parameter 3
Estimate
Options
Manuals
:
:
:
:
:
Reset
Draw
Print
Save
Quit
Here are the options offered:
Graph
This option allows you to select a linear graph, a horizontal or vertical bar graph or a pie chart.
Parameter 1
You can use this option to select a variable for the X axis or the label for a pie chart.
Parameter 2
You can use this option to select a variable for the Y axis or piece of the pie chart.
Parameter 3
With this option you can select a variable for a third dimension (the Z axis) of linear or bar graphs. This
option will only be available if just one variable is selected for Parameter 2.
Estimate
Here are the possible choices under Estimate:
• Total estimates
• Average per reporting (farm, operator or farm family)
• Average per farm
Options
Here are the available Options:
• Graph title: you can give the graph a title and a subtitle
• X axis title: you can give the X axis a title
• Y axis title: you can give the Y axis a title
• Y axis segmentation: you can segment the Y axis into minimum and maximum values
32
•
•
•
•
Fonts (%): this option allows you to change the font size for the graph. Depending on the graphic
card in your computer and the screen size you have, you will have to increase or decrease the
font size to improve the quality of the graph on the screen. The value by default is 100%.
Current font (%)?: a window will give you the percentage of the font size currently used.
Change font (%): you can choose a font size – between 50 and 120%.
Fill Pattern: this option should be used especially when you have a monochrome monitor or black
and white printer
Background color: you can choose a background color among 11 pre-established colors
Print Setup: this option allows you to select a printer or to verify your current selection
If you choose Draw, the Grouping screen (see next page) will appear only if you have to make more
than one selection for at least one of the variables. You must make only one selection for each of the
remaining variables.
You can either Reset your selection, Draw, Print or Save the graph or Quit.
Reset
The Reset option allows you to make another selection.
Draw
Use Draw to see the graph on the screen in a print format. With this option, you can ensure that you
have selected the correct options before producing an output of the graph on paper.
Print
If you select Print, the graph on the screen will be automatically sent to the printer you selected
earlier. You can verify your choice of printer by selecting Print Setup in the Options item of the menu
bar.
Save
If you do not wish to print your graph directly from ESAS, you can take advantage of the Save option.
This feature allows you to create an image file of your chosen graph on disk which can later be used to
print your file from DOS. Since the image file will contain specific control characters for the chosen
printer, you should ensure that the correct printer has been chosen before you create an image file
(see Print Setup, section 4.2, page 25). Once you have chosen Save, a screen similar to the one in
section IV Creating a Disk File (p. 23) will ask you to provide a file name. It will indicate in which
directory the file will be saved. You can change the directory by pressing the arrow at the end of the
“Save in:” field.
After providing this information, you can save your file. The newly created image file will have the
extention .PRT.
Quit
If you select Quit, a message will appear asking you to verify this selection before exiting the Create a
Graph option.
33
VIII
Creating a disk file
With ESAS, you can export any of the tables into a variety of formats. To do this, choose the Create
disk file option.
For more details, please refer to the section Creating a Disk File under Pre-established Tabulation
(section 4.1.2 IV, page 23).
IX
Creating a record layout
Create record layout gives you the position, length, type and description of the variables presented in
the disk file. By selecting this option, you can view the record layout on the screen or print it.
34
X
Creating a print image file
If you do not wish to print your report directly from ESAS, you can take advantage of the Create a
print image file option. This feature allows you to create on disk an image file of your chosen report
which can later be used to print your file from DOS.
For more details, please refer to the section Creating a Print Image File under Pre-established
Tabulation (section 4.1.2 VI, page 24).
35
5.
Quitting ESAS
The last function offered on the main menu bar is Quit. It allows you to:
•
•
quit the system and
switch to either custom or pre-established tabulation.
To quit the system, select Yes from the menu. A message will appear asking you to verify this
selection.
ESAS also allows you to switch from pre-established to custom tabulation and back without restarting
the system. If you wish to switch options, select either Pre-established or Custom and the system
will change to your selection.
36
6.
Tutorials
Now that you are familiar with the many features of ESAS, you are ready to put your knowledge to
work with these easy to follow step-by-step tutorials.
6.1
Pre-established tabulation tutorial
This tutorial will show you how you can:
•
select criteria for a pre-established tabulation,
•
choose the summary report format to output your tabulation,
•
view and browse your report, and
•
export your data in a Lotus file.
Step 1
Once you have installed ESAS, start the system by selecting ESAS_SESA 2005 from the Start,
Programs, Statistics_Statistique Canada group created when you installed ESAS; the screen
prompts for choice of language, choose either English or French. The ESAS Licence Agreement
screen appears. To go to the next screen, scroll through the Licence Agreement and click on Accept.
At the Welcome screen, click on Continue.
Step 2
ESAS will ask you to choose either Pre-established tabulations or Custom tabulations. Select Preestablished by clicking on it or scroll to it and press ENTER.
Step 3
The main menu bar and status box will appear. You are now ready to select your criteria. Click on
Data with your mouse or press Alt D on your keyboard.
From the window that will appear, select Revenues & Expenses by clicking on it with your mouse or
by scrolling to it and pressing ENTER. You will note that this selection will now appear in the status
box in the middle of the screen.
Step 4
Select the Year function by clicking on it or press Alt Y.
A window will appear listing the years that are available. Select 2001 by clicking on it or scroll to it and
press ENTER.
37
Step 5
Select the Province function by clicking on it or press Alt P.
The ten provinces and a total for all the provinces will be listed in the window. To select Quebec, click
on it or press Q. From the next window select Total of regions by clicking on it or press A.
Step 6
Select the Farm Type function from the main menu bar by clicking on it or press Alt F.
From the window listing the various farm types, select Dairy Cattle and Milk Production by clicking
on it or by scrolling to it and pressing ENTER.
Step 7
The final variable to be selected is the Revenue Class. Click on it or press Alt R.
Select the revenue class $50,000 - $99,999 by clicking on it or by scrolling to it and pressing ENTER.
Step 8
At this point you should review all of your selections. The status box should look like this:
Step 9
Once you have determined that all of the correct selections have been made, select Output by
clicking on it or press Alt O.
38
Choose the Summary Report by clicking on it or press S. The following message will appear on the
screen:
Please wait ... Searching the database ...
Step 10
When the system has located all of the selected records, you will be prompted to select an output
type.
In order to ensure that the base has retrieved the correct data, you should first choose to View report.
Either click on this selection followed by OK or scroll to the selection and press ENTER and click on
OK.
Verify your selection criteria on the new screen. The record content can be checked by using the scroll
bars to scroll across the screen and back. To check the data or variables on the lower half of the
report, move the scroll box in the scroll bars. There are many ways to exit the view screen: click on the
button with a door in the screen "Print Preview"; click on the close box in the upper right corner; or
press Esc. The system will return to the output type menu.
Step 11
You are now ready to Browse data. Select this option in the same way you selected View report. The
screen that will appear contains all of your data but in a different format than that of the final output.
Click on the final record at the bottom of the report or use the down arrow key to scroll to the bottom of
the report. Go to the Avg. per farm column by clicking on the scroll arrow in the bottom right corner of
the horizontal scroll bar or press the Tab key.
Exit the Browse data option by holding the left mouse button on the icon in the upper left corner and
select Next, or press Esc.
Step 12
Now that you have returned to the output selection screen, it is possible to create a Lotus file from
your selected data.
Select Create disk file by clicking on it with your mouse and then click on OK or press C and then O.
From the selection screen that appears, choose to create a Lotus file then click on Lotus and on OK
or use the hot keys L and O.
Step 13
The next screen will prompt you to name your Lotus file and indicate the drive you want to save it on.
Name this file Lotest and save it on your C:\ by clicking on the Save button.
39
The following message appears:
LOTUS file has been saved... Press any key to continue
Press any key as prompted. Click on Quit to exit the Create a disk file and click on Quit again to exit
the Output screen.
Congratulations! You have now completed the Pre-established Tabulation Tutorial. During this
exercise you:
•
•
•
•
selected a pre-established tabulation,
manoeuvered throughout the system using a mouse, arrow keys, and hot keys,
viewed and browsed a report, and
saved a report as a Lotus file.
40
6.2
Custom tabulation tutorial
This tutorial will allow you to:
•
make multiple selections from the available selection criteria,
•
view and browse your extracted data,
•
perform a calculation,
•
calculate a percentage change,
•
reorganize your custom tabulation report,
•
print a hard copy version of your chosen custom tabulation report, and
•
create and view a graph.
If you are entering this tutorial directly from the previous one, select the Custom option from the Quit
function of the menu bar and go directly to step 3.
Step 1
Once you have installed ESAS, start the system by selecting ESAS_SESA 2005 from the Start,
Programs, Statistics_Statistique Canada group created when you installed ESAS; the screen
prompts for choice of language, choose either English or French. The ESAS Licence Agreement
screen appears. To go to the next screen, scroll through the Licence Agreement and click on Accept.
At the Welcome screen, click on Continue.
Step 2
You will be prompted to choose either Pre-established tabulations or Custom tabulations. Select
Custom by clicking on it or scroll to it and press ENTER.
Step 3
The main menu bar and status box will appear (see Section 3.2.1, page 16). You are now ready to
select your data. Click on Data with your mouse or press Alt D on your keyboard.
Step 4
From the window, select Revenues & Expenses by clicking on it or scroll to it and press ENTER. A
window will appear listing all of the data variables available from this selection. Select R000
Estimated number of farms by clicking on it or press ENTER. Continue to scroll the list and select
the following data variables:
R400
R405
All Wheat,
Canola (Rapeseed),
41
R2005
R2040
R2105
R2140
Total Grains & Oilseeds,
Total Operating Revenues,
Total Crop Expenses, and
Total Operating Expenses.
Exit this window by clicking outside of it or press Esc.
Step 5
You are now in the data selection window. Select Crops as described in Step 4. A window will appear
listing all of the available data variables for this data type. Select the following data variables using the
same method as described in Step 4:
C1010
C1100
Total Grains & Oilseeds, and
Total Area of Farms.
Exit this window by clicking outside of it or press Esc. Exit the Data window in the same manner.
Step 6
To continue, access the Year function by clicking on it or press Alt Y. From the years listed in the
window, select 1994, 1995 and 1996 by clicking on them or scroll to them and press ENTER.
Exit this option by clicking outside of the window or press Esc.
Step 7
Access the next function by clicking on Province or by pressing Alt P. Select Saskatchewan by
clicking on it or scroll to it and press ENTER. A window will appear listing all of the Census Agricultural
Regions (CARs) found in Saskatchewan, including the option Total of regions at the top of the list.
Select this option by clicking on it or scroll to it and press ENTER.
Exit this option by clicking outside of the window or by pressing Esc twice.
Step 8
Select Farm Type by clicking on this function or by pressing Alt F. From the subsequent list, select
Grain & Oilseed by clicking on it or by scrolling to it and pressing ENTER.
Exit this function by clicking outside of the window or by pressing Esc.
Step 9
The final variable to be selected is the Revenue Class. Access this function by clicking on it or by
pressing Alt R. Select Total of revenue classes by clicking on it or scroll to it and press ENTER.
Exit this function by clicking outside of the window or by pressing Esc.
42
Step 10
At this point you should review all of your selections. The status box should look like this:
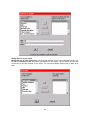
Step 11
Once you have determined that all of the correct selections have been made, you must select Output
by clicking on it or by pressing Alt O. Because custom tabulations can only be output in one report
format, the window that appears is slightly different from that for the pre-established tabulations.
Before you ask ESAS to extract your data, you need to select a printer with the Printer Setup if you
want to use a printer that is not the default printer in your Windows environment. Choose the desired
printer by pressing the down arrow at the end of the field “Name:” and click on OK.
43
Step 12
Select once again the Output function to produce a report. Click on the Select option or scroll to it and
press ENTER. The following message will appear:
Retrieving in progress: Type of data
Year
Step 13
Once the system has located all of the records you selected for the extraction, you will be prompted to
select an output type.
In order to ensure that the base has retrieved the correct data, select View report. Either click on this
selection followed by OK or move to the selection and press ENTER and then move to OK and press
ENTER again.
The View report screen will appear. Verify that Total of classes was selected by scrolling to the right
until you reach the Revenue Class.
There are many ways to exit the view screen: click on the button with a door in the screen "Print
Preview"; click on the close box in the upper right corner; or press Esc. The system will bring you back
to the output type menu.
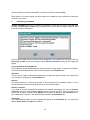
Step 14
You are now ready to Browse data. Select this option the same way that you selected View report in
Step 13. The screen that will appear contains all your data but they appear in a different format than
that of the final output. Most of the data contained within the Browse format have been encoded due to
space constraints. Use the Column definitions option to decode and understand the data as you
browse.
Click on the final record at the bottom of the report or use your down arrow key to scroll to the bottom
of the report. You will decode this record.
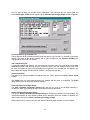
Step 15
There are columns labelled Prov., CAR, F.T., R.C., C.V. and T.D. The applicable province, census
agricultural region, farm type, revenue class and type of data have each been assigned a numeric
code. These items can all be easily decoded online by simply clicking on the Column definitions
option which can be found in the upper left hand corner of the screen, or press Alt C and access the
applicable drop-down menu. For example: the province and CAR have been defined by number 47
and 0 respectively. From the menu for Column definitions choose Province. You will see that a
window will appear listing the provinces and that number 47 corresponds to Saskatchewan. By
selecting Saskatchewan, another window will appear listing the CARs within that province and you will
see that 0 corresponds to Total of regions.
44
Use this method to decode each of the variables.
Exit this menu by clicking outside of the window or press Esc.
Exit the Browse data option by holding the left mouse button on the icon in the upper left corner and
select Next, or press Esc.
Step 16
Now that you have viewed and browsed your report, it is time to print it. Select Print report from the
Output destination screen. ESAS will print your report on the printer you selected. The following
message will appear:
Please wait... Printing report...
and
Report has been printed... Press any key to continue
Step 17
You will now add new variables to your custom tabulation report and reorganize your report.
In the Output screen, select Perform calculation. The Select type of data screen will appear. From
the listed options, select Revenues and Expenses, Additions and Disposals by clicking on it and
then clicking on OK or use the down arrow key and then press ENTER twice. The Perform
calculation screen will appear (see an exemple in Step 19).
You will create the following two variables in Steps 18, 19 and 20:
1) Percentage of total grain and oilseed revenues generated by wheat (R400 / R2005)*100
2) Percentage of total grain and oilseed revenues generated by canola (R405 / R2005)*100
Step 18
Creating the first variable: (R400 / R2005)*100.
Select the symbol "(" by clicking on it twice. Do the same thing to select the variable R400 All wheat,
the "/" operator, the variable R2005 Total, grains and oilseeds and the symbols ")" and "*". To
complete the process, scroll to the box Numeric constants, type 100 and then press ENTER.
Note that the symbols and variable codes will appear in the Calculation box as shown in Step 19.
45
Step 19
Before you ask ESAS to create the new variable, you should name it. Click on the box Variable
description or scroll to it. Type Share of revenues generated by wheat. Click on Create or scroll to
it and press ENTER. The following messages will appear:
Please wait for message indicating end of calculation
and
End of calculation... Press any key to continue
The code X1001 and the description of the Share of revenues generated by wheat variable will be
displayed in the column entitled List of variables to be selected from which appears at the left of the
screen.
Step 20
Creating the second variable : (R405 / R2005)*100.
Create the variable X1002 - Share of revenues generated by canola by using the method described
in Steps 18 and 19.
46
Do not delete the new variables X1001 - Share of revenues generated by wheat - and X1002 Share of revenues generated by canola - because you will use them in Step 29.
To return to the type of data menu, click on Quit or scroll to it and press ENTER. Click on Quit again.
The system will bring you back to the Output options screen.
Step 21
You will now calculate a year-over-year percentage change between 1995 and 1996 for Total
operating expenses (R2140). Select Calculate percentage change from the Output screen and
then click on OK. The Select type of data screen will appear. From the listed options, select
Revenues and Expenses, Additions and Disposals by clicking on it and then clicking on OK or use
the down arrow key and then press ENTER twice. The Calculate percentage change screen will
appear.
Select R2140 in the box labelled List of variables to be selected from by clicking on it twice or scroll
to it and press ENTER. Note that the variable is now displayed in the Selected variables box.
Select 1996 in the first box of Year compared to Year by clicking on it twice. Select 1995 in the
second box in the same manner. Note that both years are now displayed in the boxes as shown in the
screen below.
Click on Create or scroll to it and press ENTER. The following messages will appear:
Please wait for message indicating end of calculating percentage changes...
and
End of calculating percentage changes... Press any key to continue
47
Press any key and the system will bring you back to the Calculate percentage change screen. To
return to the type of data menu, click on Quit or scroll to it and press ENTER. Click on Quit again. The
system will bring you back to the Output options screen.
Step 22
You can now Reorganize your report. Select this option on the Output screen. Choose Select the
variables for your report on the screen that appears and then click on OK. The Selection of
variables pop-up will appear.
Step 23
From the column entitled List of variables to choose from displayed at the left of the screen, select
Year, Farm type, Variable description and Total estimate by clicking twice on each variable. Note
that these variables will appear at the right of the screen (see the screen in Step 24).
Step 24
You need to give your report a title and a subtitle. On the first line of the Title of report box, type
Share of revenues generated by wheat and canola. Type Saskatchewan, 1994 to 1996 on the
second line and press OK.
The following message will appear:
Specific variables have been selected... Press any key to continue
Press any key and the system will bring you back to the Reorganize your report screen.
48
Step 25
Select Modify the sort of your report and then click on OK. The Sort report window will appear (see
screen below). Select Year and Variable sequence under List of variables for the sort by clicking
twice on each one of the variables. Select OK.
The following message will appear:
The report has been sorted... Press any key to continue
Press any key and the system will bring you back to the Reorganize your report screen. To return to
the output type menu, click on Quit.
Step 26
You can now View the report by following the method outlined in Step 13. The screen that appears
will display the elements you selected in Step 23: Year, Farm type, Variable description and Total
estimate. Note that the content of the report is sorted according to the variables selected in Step 25:
Year and Variable sequence.
When you are finished Viewing the report, press Esc to exit this screen and return to the Output
screen.
49
Step 27
The last exercise shows you how to create and view a graph. Select Create graph in the Output
screen. The menu bar and status box (described in section 4.2.2 VII, page 32) will appear and you can
begin selecting your criteria. Begin with the Graph option by clicking on it or you can activate the first
option on the menu bar by pressing the Alt key followed by ENTER. You can access the other options
on the menu bar by pressing Alt, using the left and right arrow keys (), and then pressing ENTER.
Select Bar and then Vertical by clicking on it. Note that your choice is immediately displayed in the
status box and that the Parameter 1 and Parameter 2 options are highlighted.
Step 28
Select Parameter 1 from the menu bar. Select Year by clicking on it or scroll to it and press ENTER.
Do not make any other selection because the three listed years - 1994, 1995 and 1996 - have already
been selected. To return to the previous screen, click outside the window or press Esc.
Step 29
Select Parameter 2, then select X1001 and X1002 from the variables listed as shown in the screen
displayed below. To return to the previous screen, click outside the window or press Esc.
50
Step 30
Now choose Estimate. From the types of estimates offered, select Total estimates. You are now
ready to Draw your graph by clicking on this option or scroll to it and press ENTER. The following
message will appear on the screen:
Please wait... graph preparation in progress
The graph appears on the screen.
Step 31
Try the other options offered or exit the Graph screen by clicking on Quit. You will be prompted to
confirm this choice with the message Are you sure? and the options to select Yes or Cancel. Select
Yes to return to the Output options screen.
Click on Quit to exit the Output screen.
Congratulations! You have completed the Custom Tabulation Tutorial. During this exercise, you
have:
•
•
•
•
•
•
•
•
•
made multiple selections to create a custom tabulation report,
viewed a custom tabulation report,
browsed and decoded a custom tabulation report,
performed a calculation,
calculated a percentage change,
selected variables for a custom tabulation report,
sorted the contents of your custom tabulation report,
printed a custom tabulation report, and
created and viewed a graph.
51
7.
Glossary and symbols
7.1
Glossary of commonly used terms
ASCII – American Standard Code for Information Interchange. This is an unformatted file that contains
only text. Files of this type often have a .TXT extension.
Criteria – variables chosen to create tabulations in ESAS.
Custom tabulation – an option of the ESAS system whereby the user can customize the tabulation
content by choosing any combination from the available variables.
DBF – file extention used to denote database files. These files can be used in both dBase and Foxpro
softwares.
DIF – extension used to denote Data Interchange Format. File format where columns become fields
and rows become records. These files are used by VisiCalc.
Disaggregation – separation or break-down of data to provide increased detail.
Distributional tables – output option of the ESAS system (see 4.1.1 for description).
Drop-down menu – menu which appears to be dropped from the top line of the menu bar allowing the
selection of a subcommand.
DOS – common micro computer operating system used to allocate memory, organize files, etc.
Excel – is a spreadsheet software. Fields in the database will become columns in the spreadsheet
and records become rows. Spreadsheet files created in Excel are given the extension .XLS.
Export – transforming and saving ESAS created tabulations into formats for use in other computer
applications.
Hot key – can be a letter or a number which allows the user quick and easy access to commands and
functions. The hot key is underlined.
Image file – is a file of a chosen report created for later printing. It can be identified by the
extension .PRT.
Installation – this is the process that initiates the program which will allow ESAS to operate on your
computer system.
Lotus – is a spreadsheet software. Fields in the database will become columns in Lotus and records
will become rows. Lotus files can be identified by the extension .WK?, depending on the software
version in use.
Menu bar – the bar across the top of the screen which lists the primary options of the system.
Pop-up menu – box listing options that appears on the screen after a selection is made from the
menu bar.
52
Pre-established tabulation – is an option of the ESAS system whereby a user selects a tabulation
using preset variables.
Record – a one-row collection of information about one item in a table, eg. variable name, province,
estimate, number of farms, C.V.
Report – output option offered by the ESAS system (see 4.1.1 for description).
Screen – what appears on the monitor during an ESAS session, including the menu bar, the status
box and the actual data windows.
Select – command prompting you to choose a menu item by highlighting it and pressing ENTER or by
pressing the applicable hot key.
Status box – box that appears in the middle of the screen describing the current conditions of the
programs, i.e. current tabulation selections.
Summary report – output option offered by the ESAS system (see 4.1.1 for description).
Text file – a file on disk in ASCII format.
Window – operating environment used by ESAS that allows easy access and manoeuvrability
throughout the system.
7.2
Symbols used within ESAS tabulations
In some cases the following symbols have replaced data within ESAS tabulations. These are standard
Statistics Canada symbols that are used in all catalogued publications. They are defined below:
-
nil or zero
x
data suppressed because of quality or to meet secrecy requirements of the Statistics Act
..
figures not available
... figures not appropriate or not applicable
--
amount too small to be expressed
53
Appendix A
Figure 1
Summary of Available Options for Pre-established Tabulations
Tabulation Creation
Selection of Criteria
Data Type
Year
Province and CAR
Farm Type
Revenue Class
Output and Display Options
Select Report Type
Report
Distributional
Table**
Summary
Report*
Select Output Type
View
Print
ASCII
*
**
Create
disk
file
Browse
Lotus
DBF
Create
record
layout
DIF
Create a
print image
file
Excel
This output is only available for "Revenues and Expenses".
This output is only available for "Revenues and Expenses" and for "Off-Farm Income of Farm Operators".
54
Figure 2
Summary of Available Options for Custom Tabulations
Tabulation Creation
Selection of Multiple Criteria
Data Type and Data Variables
Year
Province and CAR
Farm Type
Revenue Class
Output and Display Options
Report
Select Output Type
View
Print
Browse
ASCII
Create
disk
file
Calculate
percentage
change
Reorganize
your report
Perform
calculation
Lotus
55
Create
record
layout
Create
graph
DBF
Create a
print image
file
DIF
Excel
Appendix B
ESAS Codes for Custom Tabulations
Provinces and Census Agricultural Region (CAR) Codes
Code
Province
Code
CAR
0
Total provinces
0
Total of regions
10
Newfoundland and Labrador 0
Total of regions
11
P.E.I.
0
Total of regions
12
Nova Scotia
0
1
2
3
4
5
Total of regions
CAR 1
CAR 2
CAR 3
CAR 4
CAR 5
13
New Brunswick
0
1
2
3
4
Total of regions
CAR 1
CAR 2
CAR 3
CAR 4
24
Quebec
0
1
2
3
4
5
6
7
8
9
10
11
12
13
14
Total of regions
Bas-Saint-Laurent
Saguenay, Lac-Saint-Jean, Côte-Nord
Québec
Mauricie
Estrie
Montréal, Laval
Lanaudière
Outaouais
Laurentides
Abitibi-Témiscamingue, Nord-du-Québec
Gaspésie, Îles-de-la-Madeleine
Chaudière, Appalaches
Montérégie
Centre-du-Québec
35
Ontario
0
1
2
3
4
5
Total of regions
Southern Ontario
Western Ontario
Central Ontario
Eastern Ontario
Northern Ontario
56
46
Manitoba
0
1
2
3
4
5
6
7
8
9
10
11
12
Total of regions
CAR 1
CAR 2
CAR 3
CAR 4
CAR 5
CAR 6
CAR 7
CAR 8
CAR 9
CAR 10
CAR 11
CAR 12
47
Saskatchewan
0
10
11
20
21
30
31
32
33
40
41
50
51
60
61
70
71
80
81
90
91
Total of regions
CAR 1A
CAR 1B
CAR 2A
CAR 2B
CAR 3AN
CAR 3AS
CAR 3BN
CAR 3BS
CAR 4A
CAR 4B
CAR 5A
CAR 5B
CAR 6A
CAR 6B
CAR 7A
CAR 7B
CAR 8A
CAR 8B
CAR 9A
CAR 9B
48
Alberta
0
10
20
30
40
41
50
60
70
Total of regions
CAR 1
CAR 2
CAR 3
CAR 4A
CAR 4B
CAR 5
CAR 6
CAR 7
59
British Columbia
0
1
2
3
4
5
6
7
8
Total of regions
Vancouver Island-Coast Region
Lower Mainland-Southwest Region
Thompson-Okanagan Region
Kootenay Region
Cariboo Region
North Coast Region
Nechako Region
Peace River Region
57
Farm Type Codes
WFDB NAICS
Codes
Farm Types
1111
111211
111219
1113
1114
1119
112110
112120
112210
1123
112888
Oilseed and grain farming
Potato farming
Other vegetable (except potato) and melon farming
Fruit and tree nut farming
Greenhouse, nursery and floriculture production
Other crop farming
Beef cattle ranching and farming, including feedlots
Dairy cattle and milk production
Hog and pig farming
Poultry and egg production
Other animal production
Revenue Class Codes
Code
0
2
3
4
5
6
7
Revenue Class
Total of revenue classes
$ 10,000 - $ 24,999
$ 25,000 - $ 49,999
$ 50,000 - $ 99,999
$ 100,000 - $ 249,999
$ 250,000 - $ 499,999
$ 500,000 and over
Type of Data
Code
Type of Data
11
12
13
14
16
17
18
Revenues and Expenses (Unincorporated and Incorporated Sectors)
Off-Farm Income (Unincorporated Sector)
Additions and Disposals (Unincorporated and Incorporated Sectors)
Revenues and Expenses (Unincorporated Sector)
Off-Farm Income (Unincorporated and Incorporated Sector)
Revenues and Expenses (Farm families)
Off-Farm Income (Farm families)
21
22
Crops
Livestock
31
32
Assets and Liabilities
Capital
58
Rating the C.V.
The following rating system is suggested when using figures within a specific C.V. range.
C.V.
Rating
0.00% to 4.99%
5.00% to 9.99%
10.00% to 14.99%
15.00% to 24.99%
25.00% to 34.99%
>=35.00%
Excellent
Very Good
Good
Acceptable
Use with caution
Too unreliable to be published
59