1
User’s Guide
Doc ID 9399-2SE32UG
Contacting Rockwell
Software
Technical Support Telephone—440-646-7800
Technical Support Fax—440-646-7801
World Wide Web Support Library—www5.software.rockwell.com
Copyright Notice
K1999 Rockwell Software Inc., a Rockwell Automation Company. All rights reserved.
Printed in the United States of America.
Portions copyrighted by the Allen-Bradley Company, LLC, a Rockwell Automation Company.
This manual and any accompanying Rockwell Software products are copyrighted by Rockwell
Software Inc. Any reproduction and/or distribution without prior written consent from
Rockwell Software Inc. is strictly prohibited. Please refer to the license agreement for details.
VBA and DCOM, Copyright 1996, 1997 Microsoft Corporation. All rights reserved.
Trademark Notices
WINtelligent Series is a registered trademark. The Rockwell Software logo, RSAssistant,
RSBatch, RSData, RSEmulate 5, RSEmulate 500, RSGuardian, RSHarmony, RSKeys, RSLinx,
RSLogix 5, RSLogix 500, RSPower, RSPowerCFG, RSPowerRUN, RSServer32, RSServer,
RSServerToolkit, RSSql, RSToolbox, RSTrainer, RSTrend, RSTune, RSView32, RSView32
Resource Kit, RSView, RSWire, A.I. Series, Advanced Interface (A.I.) Series, AdvanceDDE,
ControlGuardian, ControlView, INTERCHANGE, Object Smart Path, Packed DDE,
WINtelligent, WINtelligent EMULATE 5, WINtelligent EMULATE 500, WINtelligent
LOGIC 5, WINtelligent VIEW, WINtelligent RECIPE, WINtelligent VISION, WINtelligent
VISION2, and RSTools are trademarks of Rockwell Software Inc.
PLC, PLC-2, PLC-3, and PLC-5 are registered trademarks, and Data Highway Plus, DH+,
DHII, DTL, Network DTL, Pyramid Integrator, PanelBuilder, PanelView, PLC-5/250,
PLC-5/20E, PLC-5/40E, PLC-5/80E, SLC, SLC 5/01, SLC 5/02, SLC 5/03, SLC 5/04, SLC
5/05, SLC 500, ControlLogix 5550, and SoftLogix are trademarks of the Allen-Bradley
Company, Inc.
AutoCAD is a registered trademark of Autodesk, Inc. dBASE IV is a registered trademark of
Borland International, Inc. Ethernet is a registered trademark of Digital Equipment Corporation,
Intel, and Xerox Corporation. IBM is a registered trademark, and AIX, PowerPC, Power Series,
and RISC System/6000 are trademarks of International Business Machines Corporation.
Microsoft, MS-DOS, Visual Basic, and Windows are registered trademarks, and ActiveX,
Microsoft Access, Visual FoxPro, and Windows NT are trademarks of the Microsoft
Corporation. Modicon is a registered trademark of Groupe Schneider. OPC is a trademark of the
OPC Foundation. Seagate Crystal Reports is a trademark of Seagate Technology, Inc. or one of
its subsidiaries. TrueType is a trademark of Apple Computer, Inc. UNIX is a registered
trademark in the United States and other countries, licensed exclusively through X/Open
Company Limited. Visio is a registered trademark of Visio Corporation. Sybase is a registered
trademark of Sybase Inc. Oracle is a registered trademark of Oracle Corporation.
All other trademarks are the property of their respective holders and are hereby acknowledged.
Warranty
This Rockwell Software product is warranted in accord with the product license. The product’s
performance will be affected by system configuration, the application being performed, operator
control and other related factors. The product’s implementation may vary among users.
This manual is as up-to-date as possible at the time of printing; however, the accompanying
software may have changed since that time. Rockwell Software reserves the right to change any
information contained in this manual or the software at any time without prior notice.
The instructions in this manual do not claim to cover all the details of variations in the
equipment, procedure, or process described, nor to provide directions for meeting every possible
contingency during installation, operation, or maintenance.
Doc ID 9399-2SE32UG
March 1999
Contents
Preface
About the documentation . . . . . . . . . . . . . . . . . . . . . . . . . . . .
Technical support services . . . . . . . . . . . . . . . . . . . . . . . . . . . .
When you call . . . . . . . . . . . . . . . . . . . . . . . . . . . . . . . . . .
P-1
P-2
P-2
Chapter 1: Working with projects
What is a project? . . . . . . . . . . . . . . . . . . . . . . . . . . . . . . . . . . .
Project files . . . . . . . . . . . . . . . . . . . . . . . . . . . . . . . . . . . .
Working in the Project Manager . . . . . . . . . . . . . . . . . . . . . . .
Component . . . . . . . . . . . . . . . . . . . . . . . . . . . . . . . . . . . .
Viewing component locations . . . . . . . . . . . . . . . . . . . . .
Adding components to a project . . . . . . . . . . . . . . . . . . . . . . .
Renaming, removing, and deleting components . . . . . . . . . .
Renaming a component . . . . . . . . . . . . . . . . . . . . . . . . . .
Removing a component . . . . . . . . . . . . . . . . . . . . . . . . . .
Deleting a component and file . . . . . . . . . . . . . . . . . . . .
Naming files . . . . . . . . . . . . . . . . . . . . . . . . . . . . . . . . . . . . . . .
Printing . . . . . . . . . . . . . . . . . . . . . . . . . . . . . . . . . . . . . . . . . . .
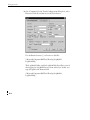
Selecting a printer . . . . . . . . . . . . . . . . . . . . . . . . . . . . . . .
Selecting printer setup options . . . . . . . . . . . . . . . . . . . .
Selecting a network printer . . . . . . . . . . . . . . . . . . . . . . .
Printing at runtime . . . . . . . . . . . . . . . . . . . . . . . . . . . . . .
1-1
1-2
1-3
1-3
1-4
1-4
1-6
1-6
1-7
1-7
1-8
1-8
1-9
1-10
1-10
1-10
1
1
1
1
&RQWHQWV
Chapter 2: Setting Up Direct Driver Communications
Overview of direct driver communications . . . . . . . . . . . . . .
Communication channel . . . . . . . . . . . . . . . . . . . . . . . . .
Communication device . . . . . . . . . . . . . . . . . . . . . . . . . .
Communication driver . . . . . . . . . . . . . . . . . . . . . . . . . .
Node (control device) . . . . . . . . . . . . . . . . . . . . . . . . . . .
Setting up direct driver communication to
programmable controllers . . . . . . . . . . . . . . . . . . . . . . . . . . . .
Setting up communications without hardware
or software . . . . . . . . . . . . . . . . . . . . . . . . . . . . . . . . . . . .
Summary of steps . . . . . . . . . . . . . . . . . . . . . . . . . . . . . . .
Configuring RSLinx drivers . . . . . . . . . . . . . . . . . . . . . . . . . .
Using the drivers . . . . . . . . . . . . . . . . . . . . . . . . . . . . . . .
Selecting a driver in RSView32 . . . . . . . . . . . . . . . . . . . .
Configuring channels . . . . . . . . . . . . . . . . . . . . . . . . . . . . . . . .
Changing the channel configuration . . . . . . . . . . . . . . .
Switching communication drivers at runtime . . . . . . . . . . . .
Commands for switching drivers . . . . . . . . . . . . . . . . . .
Switching drivers automatically . . . . . . . . . . . . . . . . . . .
Switching drivers manually . . . . . . . . . . . . . . . . . . . . . . .
Creating a node . . . . . . . . . . . . . . . . . . . . . . . . . . . . . . . . . . . . .
Changing node information at runtime . . . . . . . . . . . . . . . . .
Scanning for new tag values . . . . . . . . . . . . . . . . . . . . . . . . . . .
RSView32 scan classes . . . . . . . . . . . . . . . . . . . . . . . . . . .
Guidelines for configuring scan classes . . . . . . . . . . . . .
Monitoring communications . . . . . . . . . . . . . . . . . . . . . . . . . .
Developing your project without a communication network
2-2
2-2
2-2
2-3
2-3
2-3
2-3
2-4
2-5
2-5
2-5
2-6
2-10
2-10
2-10
2-11
2-11
2-12
2-15
2-15
2-16
2-16
2-18
2-19
Chapter 3: Setting Up OPC and DDE Communications
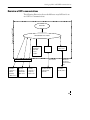
Overview of OPC communications . . . . . . . . . . . . . . . . . . . .
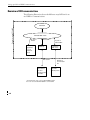
Overview of DDE communications . . . . . . . . . . . . . . . . . . . .
Summary of steps . . . . . . . . . . . . . . . . . . . . . . . . . . . . . . . . . . .
Creating an OPC node . . . . . . . . . . . . . . . . . . . . . . . . . . . . . . .
Creating a DDE node . . . . . . . . . . . . . . . . . . . . . . . . . . . . . . . .
Changing node information at runtime . . . . . . . . . . . . . . . . .
Scanning for new tag values . . . . . . . . . . . . . . . . . . . . . . . . . . .
1
1
1
2
3-3
3-4
3-5
3-5
3-11
3-14
3-15
&RQWHQWV
Chapter 4: Creating Tags
Tags and the tag database . . . . . . . . . . . . . . . . . . . . . . . . . . . . .
Tag types . . . . . . . . . . . . . . . . . . . . . . . . . . . . . . . . . . . . . . . . . .
Data sources . . . . . . . . . . . . . . . . . . . . . . . . . . . . . . . . . . . . . . . .
Device . . . . . . . . . . . . . . . . . . . . . . . . . . . . . . . . . . . . . . . .
Memory . . . . . . . . . . . . . . . . . . . . . . . . . . . . . . . . . . . . . . .
Organizing tags . . . . . . . . . . . . . . . . . . . . . . . . . . . . . . . . . . . . .
Naming tags . . . . . . . . . . . . . . . . . . . . . . . . . . . . . . . . . . .
Using folders to group tags . . . . . . . . . . . . . . . . . . . . . . .
The tag database editor . . . . . . . . . . . . . . . . . . . . . . . . . . . . . . .
Using the Accept and Discard buttons . . . . . . . . . . . . .
Using the form . . . . . . . . . . . . . . . . . . . . . . . . . . . . . . . . . . . . .
Using the query box . . . . . . . . . . . . . . . . . . . . . . . . . . . . . . . . .
Using the folder hierarchy . . . . . . . . . . . . . . . . . . . . . . . . . . . .
Creating a folder . . . . . . . . . . . . . . . . . . . . . . . . . . . . . . . .
Opening a folder . . . . . . . . . . . . . . . . . . . . . . . . . . . . . . .
Adding tags to a folder . . . . . . . . . . . . . . . . . . . . . . . . . .
Nesting a folder . . . . . . . . . . . . . . . . . . . . . . . . . . . . . . . .
Duplicating a folder . . . . . . . . . . . . . . . . . . . . . . . . . . . . .
Deleting a folder . . . . . . . . . . . . . . . . . . . . . . . . . . . . . . . .
Using the spreadsheet . . . . . . . . . . . . . . . . . . . . . . . . . . . . . . . .
Moving through the spreadsheet . . . . . . . . . . . . . . . . . .
Resizing columns and rows . . . . . . . . . . . . . . . . . . . . . . .
Adding a tag . . . . . . . . . . . . . . . . . . . . . . . . . . . . . . . . . . .
Duplicating a tag . . . . . . . . . . . . . . . . . . . . . . . . . . . . . . . .
Editing a tag . . . . . . . . . . . . . . . . . . . . . . . . . . . . . . . . . . .
Deleting a tag . . . . . . . . . . . . . . . . . . . . . . . . . . . . . . . . . .
Configuring tag type . . . . . . . . . . . . . . . . . . . . . . . . . . . . . . . .
Configuring an analog tag . . . . . . . . . . . . . . . . . . . . . . . .
Configuring a digital tag . . . . . . . . . . . . . . . . . . . . . . . . .
Configuring a string tag . . . . . . . . . . . . . . . . . . . . . . . . . .
Specifying a data source . . . . . . . . . . . . . . . . . . . . . . . . . . . . . .
Specifying device as the data source . . . . . . . . . . . . . . . .
Specifying memory as the data source . . . . . . . . . . . . . .
4-1
4-2
4-2
4-2
4-3
4-3
4-3
4-4
4-4
4-5
4-6
4-6
4-7
4-7
4-8
4-9
4-9
4-10
4-11
4-11
4-11
4-11
4-11
4-12
4-12
4-12
4-13
4-13
4-16
4-17
4-18
4-18
4-20
1
1
3
1
&RQWHQWV
Other methods for creating tags . . . . . . . . . . . . . . . . . . . . . . .
Creating tags in a third-party application . . . . . . . . . . .
Creating tags as needed in other RSView32 editors . . .
Using the Tag Browser . . . . . . . . . . . . . . . . . . . . . . . . . .
Importing tags from a PLC database . . . . . . . . . . . . . . .
Using the Database Import & Export Wizard . . . . . . .
Creating tags using the RSView32 Object Model
and VBA . . . . . . . . . . . . . . . . . . . . . . . . . . . . . . . . . . . . . .
Adding alarms to tags . . . . . . . . . . . . . . . . . . . . . . . . . . . . . . . .
Logging tag values . . . . . . . . . . . . . . . . . . . . . . . . . . . . . . . . . .
Using the tag monitor . . . . . . . . . . . . . . . . . . . . . . . . . . . . . . . .
Creating a tag monitor object . . . . . . . . . . . . . . . . . . . . .
Creating a tag monitor file . . . . . . . . . . . . . . . . . . . . . . . .
Selecting tags . . . . . . . . . . . . . . . . . . . . . . . . . . . . . . . . . . .
Understanding what you see . . . . . . . . . . . . . . . . . . . . . .
Changing what you see . . . . . . . . . . . . . . . . . . . . . . . . . .
Viewing details . . . . . . . . . . . . . . . . . . . . . . . . . . . . . . . . .
4-20
4-21
4-21
4-22
4-23
4-25
4-26
4-26
4-27
4-27
4-28
4-29
4-29
4-31
4-32
4-34
Chapter 5: Creating Derived Tags
How to use derived tags . . . . . . . . . . . . . . . . . . . . . . . . . . . . . .
How to use multiple derived tag files . . . . . . . . . . . . . . . . . . .
Summary of steps . . . . . . . . . . . . . . . . . . . . . . . . . . . . . . . . . . .
The Derived Tags editor . . . . . . . . . . . . . . . . . . . . . . . . . . . . . .
Using the Accept and Discard buttons . . . . . . . . . . . . .
Setting up the evaluation interval . . . . . . . . . . . . . . . . . . . . . .
Creating derived tags . . . . . . . . . . . . . . . . . . . . . . . . . . . . . . . .
Editing derived tags . . . . . . . . . . . . . . . . . . . . . . . . . . . . . . . . .
Starting and stopping derived tag processing . . . . . . . . . . . . .
Ways to start derived tag processing . . . . . . . . . . . . . . .
Ways to stop derived tag processing . . . . . . . . . . . . . . .
1
1
1
4
5-2
5-2
5-2
5-3
5-3
5-4
5-5
5-6
5-7
5-7
5-8
&RQWHQWV
Chapter 6: Configuring Alarms
Summary of features . . . . . . . . . . . . . . . . . . . . . . . . . . . . . . . . .
Key concepts . . . . . . . . . . . . . . . . . . . . . . . . . . . . . . . . . . . . . . .
Alarms for analog tags . . . . . . . . . . . . . . . . . . . . . . . . . . .
Alarms for digital tags . . . . . . . . . . . . . . . . . . . . . . . . . . .
Alarm severity . . . . . . . . . . . . . . . . . . . . . . . . . . . . . . . . . .
Alarm messages . . . . . . . . . . . . . . . . . . . . . . . . . . . . . . . . .
Alarm log file . . . . . . . . . . . . . . . . . . . . . . . . . . . . . . . . . .
Alarm displays . . . . . . . . . . . . . . . . . . . . . . . . . . . . . . . . .
Alarm system tags . . . . . . . . . . . . . . . . . . . . . . . . . . . . . .
Alarm acknowledgment . . . . . . . . . . . . . . . . . . . . . . . . . .
Alarm suppression . . . . . . . . . . . . . . . . . . . . . . . . . . . . . .
Running commands, macros, or VBA programs in
response to alarms . . . . . . . . . . . . . . . . . . . . . . . . . . . . . .
Alarm expressions . . . . . . . . . . . . . . . . . . . . . . . . . . . . . .
Acknowledge bit (globally acknowledging alarms) . . .
Handshake bit . . . . . . . . . . . . . . . . . . . . . . . . . . . . . . . . . .
Alarm events . . . . . . . . . . . . . . . . . . . . . . . . . . . . . . . . . . .
Summary of steps . . . . . . . . . . . . . . . . . . . . . . . . . . . . . . . . . . .
The Alarm Setup editor . . . . . . . . . . . . . . . . . . . . . . . . . . . . . .
Specifying where to store alarm log files . . . . . . . . . . . . . . . .
Creating log files . . . . . . . . . . . . . . . . . . . . . . . . . . . . . . . . . . . .
Monitoring disk space . . . . . . . . . . . . . . . . . . . . . . . . . . .
Creating files periodically . . . . . . . . . . . . . . . . . . . . . . . .
Creating files at specified times . . . . . . . . . . . . . . . . . . . .
Creating files when a particular event occurs . . . . . . . .
Never creating new files . . . . . . . . . . . . . . . . . . . . . . . . . .
Deleting log files . . . . . . . . . . . . . . . . . . . . . . . . . . . . . . . . . . . .
About alarm log files . . . . . . . . . . . . . . . . . . . . . . . . . . . . . . . .
How log files are named . . . . . . . . . . . . . . . . . . . . . . . . .
Exporting alarm log files to ODBC format . . . . . . . . . . . . . .
Configuring alarm severity . . . . . . . . . . . . . . . . . . . . . . . . . . .
Configuring alarm messages . . . . . . . . . . . . . . . . . . . . . . . . . .
Types of messages . . . . . . . . . . . . . . . . . . . . . . . . . . . . . . .
Defining the content of the message . . . . . . . . . . . . . . . .
Adding remarks to the alarm log file at runtime . . . . . . . . . .
Specifying alarm conditions for analog and digital tags . . . .
When can I configure an alarm for a tag? . . . . . . . . . . .
6-1
6-2
6-2
6-7
6-7
6-8
6-8
6-9
6-11
6-12
6-12
6-13
6-15
6-16
6-18
6-18
6-21
6-22
6-23
6-24
6-24
6-25
6-26
6-27
6-27
6-28
6-29
6-29
6-30
6-32
6-34
6-34
6-35
6-38
6-39
6-40
1
1
5
1
&RQWHQWV
Configuring alarms for analog tags . . . . . . . . . . . . . . . . . . . . .
Alarm thresholds . . . . . . . . . . . . . . . . . . . . . . . . . . . . . . .
Alarm messages . . . . . . . . . . . . . . . . . . . . . . . . . . . . . . . . .
Advanced . . . . . . . . . . . . . . . . . . . . . . . . . . . . . . . . . . . . . .
Configuring alarms for digital tags . . . . . . . . . . . . . . . . . . . . .
Alarm states . . . . . . . . . . . . . . . . . . . . . . . . . . . . . . . . . . . .
Alarm messages . . . . . . . . . . . . . . . . . . . . . . . . . . . . . . . . .
Advanced . . . . . . . . . . . . . . . . . . . . . . . . . . . . . . . . . . . . . .
Viewing the alarm log file . . . . . . . . . . . . . . . . . . . . . . . . . . . . .
Creating an alarm summary . . . . . . . . . . . . . . . . . . . . . . . . . . .
Creating an alarm summary file . . . . . . . . . . . . . . . . . . .
Creating an alarm summary object . . . . . . . . . . . . . . . . .
The parts of an alarm summary . . . . . . . . . . . . . . . . . . .
Inserting headings . . . . . . . . . . . . . . . . . . . . . . . . . . . . . .
Choosing fonts . . . . . . . . . . . . . . . . . . . . . . . . . . . . . . . . .
Choosing colors and blink styles . . . . . . . . . . . . . . . . . .
Formatting buttons . . . . . . . . . . . . . . . . . . . . . . . . . . . . .
Choosing data . . . . . . . . . . . . . . . . . . . . . . . . . . . . . . . . . .
Filtering data . . . . . . . . . . . . . . . . . . . . . . . . . . . . . . . . . . .
Sorting data . . . . . . . . . . . . . . . . . . . . . . . . . . . . . . . . . . . .
Using alarm data with commands . . . . . . . . . . . . . . . . . .
Suppressing alarm printing . . . . . . . . . . . . . . . . . . . . . . . . . . .
Suppressing alarm monitoring . . . . . . . . . . . . . . . . . . . . . . . . .
Suppressing alarm monitoring for tags . . . . . . . . . . . . .
Viewing suppressed tags . . . . . . . . . . . . . . . . . . . . . . . . .
Using the Suppressed List . . . . . . . . . . . . . . . . . . . . . . . .
More RSView32 commands . . . . . . . . . . . . . . . . . . . . . .
Starting and stopping alarm monitoring . . . . . . . . . . . . . . . . .
Ways to start alarm monitoring . . . . . . . . . . . . . . . . . . .
Ways to stop alarm monitoring . . . . . . . . . . . . . . . . . . .
1
1
1
6
6-40
6-41
6-43
6-44
6-46
6-46
6-48
6-49
6-51
6-52
6-53
6-54
6-55
6-56
6-57
6-58
6-59
6-62
6-62
6-65
6-66
6-68
6-68
6-69
6-69
6-70
6-70
6-71
6-71
6-72
&RQWHQWV
Chapter 7: Configuring Data Logging
What is a model? . . . . . . . . . . . . . . . . . . . . . . . . . . . . . . . . . . . .
How to use multiple data log models . . . . . . . . . . . . . .
Summary of steps . . . . . . . . . . . . . . . . . . . . . . . . . . . . . . . . . . .
About data log storage formats . . . . . . . . . . . . . . . . . . . . . . . .
The .dbf file format . . . . . . . . . . . . . . . . . . . . . . . . . . . . . . . . . .
Narrow .dbf file format . . . . . . . . . . . . . . . . . . . . . . . . . .
Wide .dbf file format . . . . . . . . . . . . . . . . . . . . . . . . . . . .
Choosing between narrow and wide .dbf file formats .
How .dbf log files are named . . . . . . . . . . . . . . . . . . . . .
Long file names . . . . . . . . . . . . . . . . . . . . . . . . . . . . . . . . .
Short file names . . . . . . . . . . . . . . . . . . . . . . . . . . . . . . . .
Example of short file names for narrow .dbf format . .
Example of short file names for wide .dbf format . . . .
The ODBC storage format . . . . . . . . . . . . . . . . . . . . . . . . . . .
How ODBC tables are named . . . . . . . . . . . . . . . . . . . .
Using an existing ODBC data source . . . . . . . . . . . . . .
Creating a new ODBC data source . . . . . . . . . . . . . . . .
The Data Log Setup editor . . . . . . . . . . . . . . . . . . . . . . . . . . . .
Setting up a model . . . . . . . . . . . . . . . . . . . . . . . . . . . . . . . . . . .
Setting up logging paths . . . . . . . . . . . . . . . . . . . . . . . . . . . . . .
Switching logging paths . . . . . . . . . . . . . . . . . . . . . . . . . .
Specifying logging paths . . . . . . . . . . . . . . . . . . . . . . . . .
Using the DataLogSwitchBack command to switch
logging paths . . . . . . . . . . . . . . . . . . . . . . . . . . . . . . . . . . . . . . .
Using the DataLogMergeToPrimary command to move
secondary files to the primary path . . . . . . . . . . . . . . . . . . . . .
Creating .dbf log files . . . . . . . . . . . . . . . . . . . . . . . . . . . . . . . .
Monitoring disk space . . . . . . . . . . . . . . . . . . . . . . . . . . .
Creating files periodically . . . . . . . . . . . . . . . . . . . . . . . .
Creating files at specified times . . . . . . . . . . . . . . . . . . . .
Creating files when a particular event occurs . . . . . . . .
Never creating new files . . . . . . . . . . . . . . . . . . . . . . . . . .
Using the DataLogNewFile command to create files . . . . . .
Deleting ODBC database records and .dbf log files . . . . . . .
7-1
7-1
7-2
7-2
7-3
7-3
7-3
7-4
7-4
7-4
7-5
7-6
7-7
7-8
7-8
7-8
7-9
7-10
7-11
7-21
7-21
7-22
7-26
7-27
7-28
7-28
7-29
7-30
7-31
7-31
7-32
7-33
1
1
7
1
&RQWHQWV
Specifying when to log data . . . . . . . . . . . . . . . . . . . . . . . . . . .
Logging periodically . . . . . . . . . . . . . . . . . . . . . . . . . . . .
Logging on change . . . . . . . . . . . . . . . . . . . . . . . . . . . . . .
Logging on demand . . . . . . . . . . . . . . . . . . . . . . . . . . . . .
Using the DataLogSnapshot command . . . . . . . . . . . . .
Combining logging . . . . . . . . . . . . . . . . . . . . . . . . . . . . .
Providing operators with a way to log on demand . . .
Choosing the data to log . . . . . . . . . . . . . . . . . . . . . . . . . . . . .
Editing the data log model . . . . . . . . . . . . . . . . . . . . . . . . . . . .
Changing logging paths using RSView32 Runtime . . .
Changing logging paths using the DataLogPath
command . . . . . . . . . . . . . . . . . . . . . . . . . . . . . . . . . . . . . .
Making runtime changes without editing the data log model
Changing the log rate for periodic logging . . . . . . . . . .
Changing the log file identifier string . . . . . . . . . . . . . .
Displaying data in a trend . . . . . . . . . . . . . . . . . . . . . . . . . . . .
Starting and stopping data logging . . . . . . . . . . . . . . . . . . . . .
Ways to start data logging . . . . . . . . . . . . . . . . . . . . . . . .
Ways to stop data logging . . . . . . . . . . . . . . . . . . . . . . . .
7-36
7-37
7-37
7-38
7-39
7-40
7-40
7-41
7-42
7-42
7-43
7-44
7-44
7-45
7-45
7-46
7-46
7-47
Chapter 8: Configuring Activity Logging
Which activities can be logged? . . . . . . . . . . . . . . . . . . . . . . . .
Summary of steps . . . . . . . . . . . . . . . . . . . . . . . . . . . . . . . . . . .
The Activity Log Setup editor . . . . . . . . . . . . . . . . . . . . . . . . .
Specifying where to store activity log files . . . . . . . . . . . . . . .
Creating log files . . . . . . . . . . . . . . . . . . . . . . . . . . . . . . . . . . . .
Monitoring disk space . . . . . . . . . . . . . . . . . . . . . . . . . . .
Creating files periodically . . . . . . . . . . . . . . . . . . . . . . . .
Creating files at specified times . . . . . . . . . . . . . . . . . . . .
Creating files when a particular event occurs . . . . . . . .
Never creating new files . . . . . . . . . . . . . . . . . . . . . . . . . .
Deleting log files . . . . . . . . . . . . . . . . . . . . . . . . . . . . . . . . . . . .
About activity log files . . . . . . . . . . . . . . . . . . . . . . . . . . . . . . .
How log files are named . . . . . . . . . . . . . . . . . . . . . . . . .
Exporting activity log files to ODBC format . . . . . . . . . . . .
Specifying which activities to log . . . . . . . . . . . . . . . . . . . . . .
Editing activity log setup . . . . . . . . . . . . . . . . . . . . . . . . . . . . .
1
1
1
8
8-1
8-2
8-2
8-3
8-4
8-5
8-6
8-6
8-7
8-8
8-8
8-9
8-9
8-10
8-12
8-13
&RQWHQWV
Using the activity bar . . . . . . . . . . . . . . . . . . . . . . . . . . . . . . . .
Hiding, showing, and moving the activity bar . . . . . . .
Messages in the activity bar . . . . . . . . . . . . . . . . . . . . . . .
Using the Activity Log Viewer . . . . . . . . . . . . . . . . . . . . . . . .
Selecting a record . . . . . . . . . . . . . . . . . . . . . . . . . . . . . . .
Understanding records . . . . . . . . . . . . . . . . . . . . . . . . . .
Tracking system usage . . . . . . . . . . . . . . . . . . . . . . . . . . .
Starting and stopping activity logging . . . . . . . . . . . . . . . . . .
Ways to start activity logging . . . . . . . . . . . . . . . . . . . . .
Ways to stop activity logging . . . . . . . . . . . . . . . . . . . . .
8-14
8-14
8-15
8-16
8-16
8-17
8-17
8-18
8-18
8-18
Chapter 9: Configuring Events
How to use multiple event files . . . . . . . . . . . . . . . . . . . . . . . .
Summary of steps . . . . . . . . . . . . . . . . . . . . . . . . . . . . . . . . . . .
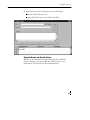
The Events editor . . . . . . . . . . . . . . . . . . . . . . . . . . . . . . . . . . .
Using the Accept and Discard buttons . . . . . . . . . . . . .
Setting up the evaluation interval . . . . . . . . . . . . . . . . . . . . . .
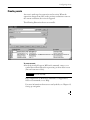
Creating events . . . . . . . . . . . . . . . . . . . . . . . . . . . . . . . . . . . . .
Editing events . . . . . . . . . . . . . . . . . . . . . . . . . . . . . . . . . . . . . .
Starting and stopping event processing . . . . . . . . . . . . . . . . .
Ways to start event processing . . . . . . . . . . . . . . . . . . . .
Ways to stop event processing . . . . . . . . . . . . . . . . . . . .
9-2
9-2
9-2
9-3
9-4
9-5
9-6
9-7
9-7
9-7
Chapter 10: Adding Security
About security . . . . . . . . . . . . . . . . . . . . . . . . . . . . . . . . . . . . . . 10-1
Summary of steps . . . . . . . . . . . . . . . . . . . . . . . . . . . . . . . . . . . 10-3
Before you begin . . . . . . . . . . . . . . . . . . . . . . . . . . . . . . . . . . . . 10-3
Configuring security codes . . . . . . . . . . . . . . . . . . . . . . . . . . . 10-3
Security codes . . . . . . . . . . . . . . . . . . . . . . . . . . . . . . . . . . 10-4
The default . . . . . . . . . . . . . . . . . . . . . . . . . . . . . . . . . . . . 10-5
Setting up security by inclusion . . . . . . . . . . . . . . . . . . . 10-5
Setting up security by exclusion . . . . . . . . . . . . . . . . . . . 10-6
Preventing access to the Security Codes and User
Accounts editors . . . . . . . . . . . . . . . . . . . . . . . . . . . . . . . . 10-6
Using strict security . . . . . . . . . . . . . . . . . . . . . . . . . . . . . . . . . 10-7
Turning off strict security . . . . . . . . . . . . . . . . . . . . . . . . 10-8
Assigning security to a graphic display . . . . . . . . . . . . . . . . . 10-9
Assigning security to an OLE object . . . . . . . . . . . . . . . . . . . 10-10
Assigning security to a tag . . . . . . . . . . . . . . . . . . . . . . . . . . . . 10-11
1
1
9
1
&RQWHQWV
Configuring user accounts . . . . . . . . . . . . . . . . . . . . . . . . . . . .
About the default user . . . . . . . . . . . . . . . . . . . . . . . . . . .
Ensuring you always have access . . . . . . . . . . . . . . . . . .
Creating user accounts . . . . . . . . . . . . . . . . . . . . . . . . . . .
Moving a project with Windows NT user accounts to a
Windows 9x computer . . . . . . . . . . . . . . . . . . . . . . . . . . .
Login and logout macros . . . . . . . . . . . . . . . . . . . . . . . . . . . . .
Securing the Project Manager . . . . . . . . . . . . . . . . . . . . . . . . .
Preventing users from going out of the RSView32 project . .
Logging in at runtime . . . . . . . . . . . . . . . . . . . . . . . . . . . . . . . .
Changing passwords at runtime . . . . . . . . . . . . . . . . . . . . . . .
10-12
10-13
10-13
10-13
10-16
10-17
10-18
10-18
10-19
10-20
Chapter 11: Creating Graphic Displays
About graphic displays and graphic objects . . . . . . . . . . . . .
The Graphic Display editor . . . . . . . . . . . . . . . . . . . . . . . . . . .
The editor’s main components . . . . . . . . . . . . . . . . . . . .
Mastering basic techniques . . . . . . . . . . . . . . . . . . . . . . . . . . . .
Using the context menu . . . . . . . . . . . . . . . . . . . . . . . . . .
Switching between normal and test modes . . . . . . . . . .
Using the toolbars . . . . . . . . . . . . . . . . . . . . . . . . . . . . . .
Selecting a drawing tool . . . . . . . . . . . . . . . . . . . . . . . . . .
Selecting colors . . . . . . . . . . . . . . . . . . . . . . . . . . . . . . . . .
Selecting and deselecting objects . . . . . . . . . . . . . . . . . . .
Using the grid . . . . . . . . . . . . . . . . . . . . . . . . . . . . . . . . . .
Using the Rotate tool . . . . . . . . . . . . . . . . . . . . . . . . . . . .
Zooming in and out . . . . . . . . . . . . . . . . . . . . . . . . . . . . .
Correcting mistakes . . . . . . . . . . . . . . . . . . . . . . . . . . . . .
Setting up the display . . . . . . . . . . . . . . . . . . . . . . . . . . . . . . . .
Saving the display settings . . . . . . . . . . . . . . . . . . . . . . . .
Creating a default . . . . . . . . . . . . . . . . . . . . . . . . . . . . . . .
Using the Display Settings dialog box . . . . . . . . . . . . . .
Specifying the display type . . . . . . . . . . . . . . . . . . . . . . .
Allowing multiple running copies . . . . . . . . . . . . . . . . .
Specifying caching . . . . . . . . . . . . . . . . . . . . . . . . . . . . . .
Specifying the title bar and other display attributes . . .
Preventing scroll bars on the RSView32 main window
Specifying display size . . . . . . . . . . . . . . . . . . . . . . . . . . .
Specifying resize behavior . . . . . . . . . . . . . . . . . . . . . . . .
Specifying display position . . . . . . . . . . . . . . . . . . . . . . .
1
1
1
10
11-1
11-2
11-2
11-3
11-3
11-4
11-4
11-5
11-6
11-7
11-8
11-9
11-10
11-10
11-11
11-11
11-12
11-12
11-13
11-14
11-15
11-16
11-18
11-19
11-19
11-20
&RQWHQWV
Setting up the display (continued)
Specifying a security code . . . . . . . . . . . . . . . . . . . . . . . .
Specifying background color . . . . . . . . . . . . . . . . . . . . .
Specifying startup and shutdown commands . . . . . . . .
Specifying colors for input fields5. . . . . . . . . . . . . . . . . .
Specifying the behavior of interactive objects . . . . . . . .
Specifying the behavior of objects with input focus . . .
Displaying the on-screen keyboard . . . . . . . . . . . . . . . .
Displaying graphics more quickly . . . . . . . . . . . . . . . . . . . . .
Removing displays from the cache . . . . . . . . . . . . . . . . .
Types of graphic objects . . . . . . . . . . . . . . . . . . . . . . . . . . . . . .
Creating simple objects . . . . . . . . . . . . . . . . . . . . . . . . . . . . . .
Drawing a rounded rectangle . . . . . . . . . . . . . . . . . . . . .
Drawing a rectangle or square . . . . . . . . . . . . . . . . . . . . .
Drawing an ellipse or circle . . . . . . . . . . . . . . . . . . . . . . .
Drawing a line . . . . . . . . . . . . . . . . . . . . . . . . . . . . . . . . . .
Drawing a polyline or polygon . . . . . . . . . . . . . . . . . . .
Drawing a freehand object . . . . . . . . . . . . . . . . . . . . . . .
Drawing an arc or wedge . . . . . . . . . . . . . . . . . . . . . . . . .
Creating text . . . . . . . . . . . . . . . . . . . . . . . . . . . . . . . . . . .
Font substitution at runtime . . . . . . . . . . . . . . . . . . . . . .
Reshaping simple objects . . . . . . . . . . . . . . . . . . . . . . . . . . . . .
Creating advanced objects . . . . . . . . . . . . . . . . . . . . . . . . . . . .
Objects described in other chapters . . . . . . . . . . . . . . . .
Using tag names . . . . . . . . . . . . . . . . . . . . . . . . . . . . . . . .
Using tag placeholders . . . . . . . . . . . . . . . . . . . . . . . . . . .
Using a parameter file to replace tag placeholders . . . .
Listing tag names to replace tag placeholders . . . . . . . .
Creating numeric and string input fields . . . . . . . . . . . .
Using input fields at runtime . . . . . . . . . . . . . . . . . . . . . . . . . .
Continuously updating tag values . . . . . . . . . . . . . . . . .
Keys . . . . . . . . . . . . . . . . . . . . . . . . . . . . . . . . . . . . . . . . . .
RSView32 commands . . . . . . . . . . . . . . . . . . . . . . . . . . . .
Using the on-screen keyboard . . . . . . . . . . . . . . . . . . . .
Creating numeric and string display fields . . . . . . . . . .
Creating labels . . . . . . . . . . . . . . . . . . . . . . . . . . . . . . . . .
Creating arrows . . . . . . . . . . . . . . . . . . . . . . . . . . . . . . . .
Creating buttons . . . . . . . . . . . . . . . . . . . . . . . . . . . . . . . .
Editing a button object . . . . . . . . . . . . . . . . . . . . . . . . . .
Reshaping a button object . . . . . . . . . . . . . . . . . . . . . . . .
11-21
11-21
11-22
11-23
11-23
11-24
11-25
11-27
11-27
11-28
11-28
11-29
11-29
11-30
11-30
11-31
11-32
11-32
11-33
11-35
11-35
11-36
11-37
11-37
11-37
11-38
11-40
11-42
11-46
11-46
11-47
11-47
11-48
11-49
11-52
11-53
11-55
11-58
11-59
1
1
11
1
&RQWHQWV
Using input fields at runtime (continued)
Creating a recipe field . . . . . . . . . . . . . . . . . . . . . . . . . . .
Creating a recipe file . . . . . . . . . . . . . . . . . . . . . . . . . . . . .
Using a recipe at runtime . . . . . . . . . . . . . . . . . . . . . . . . .
Replacing text associated with objects . . . . . . . . . . . . . . . . . .
Creating and editing OLE objects . . . . . . . . . . . . . . . . . . . . .
Other methods for inserting OLE objects . . . . . . . . . .
Converting OLE objects . . . . . . . . . . . . . . . . . . . . . . . . .
Creating and editing ActiveX objects . . . . . . . . . . . . . . . . . . .
Using the ActiveX Property Panel . . . . . . . . . . . . . . . . .
Using the ActiveX Toolbox . . . . . . . . . . . . . . . . . . . . . .
Naming graphic objects . . . . . . . . . . . . . . . . . . . . . . . . . . . . . .
Working with objects . . . . . . . . . . . . . . . . . . . . . . . . . . . . . . . .
Moving objects . . . . . . . . . . . . . . . . . . . . . . . . . . . . . . . . .
Copying objects . . . . . . . . . . . . . . . . . . . . . . . . . . . . . . . .
Duplicating objects . . . . . . . . . . . . . . . . . . . . . . . . . . . . .
Resizing objects . . . . . . . . . . . . . . . . . . . . . . . . . . . . . . . .
Arranging objects . . . . . . . . . . . . . . . . . . . . . . . . . . . . . . . . . . .
Grouping and ungrouping objects . . . . . . . . . . . . . . . . .
Performing group editing . . . . . . . . . . . . . . . . . . . . . . . .
Stacking objects . . . . . . . . . . . . . . . . . . . . . . . . . . . . . . . .
Aligning objects . . . . . . . . . . . . . . . . . . . . . . . . . . . . . . . .
Spacing objects . . . . . . . . . . . . . . . . . . . . . . . . . . . . . . . . .
Flipping objects . . . . . . . . . . . . . . . . . . . . . . . . . . . . . . . .
Applying colors . . . . . . . . . . . . . . . . . . . . . . . . . . . . . . . . . . . .
Applying fill patterns . . . . . . . . . . . . . . . . . . . . . . . . . . . . . . . .
Selecting fill patterns . . . . . . . . . . . . . . . . . . . . . . . . . . . .
Applying fill patterns . . . . . . . . . . . . . . . . . . . . . . . . . . . .
How colors and patterns work . . . . . . . . . . . . . . . . . . . .
Changing line properties . . . . . . . . . . . . . . . . . . . . . . . . . . . . .
Peeking at objects . . . . . . . . . . . . . . . . . . . . . . . . . . . . . . . . . . .
Creating a background for your display . . . . . . . . . . . . . . . .
Objects that cannot be converted . . . . . . . . . . . . . . . . . .
Importing graphic files from third-party applications . . . . .
Converting imported objects to RSView32
native objects . . . . . . . . . . . . . . . . . . . . . . . . . . . . . . . . . . .
Using bitmaps . . . . . . . . . . . . . . . . . . . . . . . . . . . . . . . . . . . . . .
When could a bitmap help? . . . . . . . . . . . . . . . . . . . . . . .
1
1
1
12
11-59
11-60
11-63
11-66
11-67
11-69
11-69
11-71
11-73
11-75
11-77
11-78
11-78
11-79
11-81
11-82
11-83
11-83
11-86
11-86
11-88
11-91
11-92
11-93
11-94
11-94
11-94
11-95
11-95
11-96
11-98
11-99
11-99
11-100
11-100
11-102
&RQWHQWV
Using graphic libraries . . . . . . . . . . . . . . . . . . . . . . . . . . . . . . . 11-102
Location of library files . . . . . . . . . . . . . . . . . . . . . . . . . . 11-103
Printing displays at runtime . . . . . . . . . . . . . . . . . . . . . . . . . . . 11-104
Chapter 12: Animating Graphic Objects
Types of animation . . . . . . . . . . . . . . . . . . . . . . . . . . . . . . . . . .
Which objects can have animation? . . . . . . . . . . . . . . . .
Using the Animation dialog box . . . . . . . . . . . . . . . . . . . . . . .
About the Animation dialog box . . . . . . . . . . . . . . . . . .
Using Object Smart Path to visually set animation . . .
Testing animation . . . . . . . . . . . . . . . . . . . . . . . . . . . . . . . . . . .
Using tag names and tag placeholders . . . . . . . . . . . . . . . . . . .
Tag names . . . . . . . . . . . . . . . . . . . . . . . . . . . . . . . . . . . . .
Tag placeholders . . . . . . . . . . . . . . . . . . . . . . . . . . . . . . . .
Using commands and macros . . . . . . . . . . . . . . . . . . . . . . . . .
Using expressions . . . . . . . . . . . . . . . . . . . . . . . . . . . . . . . . . . .
Setting minimum and maximum values . . . . . . . . . . . . . . . . .
Why specify minimum and maximum values? . . . . . . .
Defining a range of motion . . . . . . . . . . . . . . . . . . . . . . . . . . .
Objects that do not have a range of motion . . . . . . . . .
Using OSP (Object Smart Path) . . . . . . . . . . . . . . . . . . .
Configuring visibility animation . . . . . . . . . . . . . . . . . . . . . . .
Configuring color animation . . . . . . . . . . . . . . . . . . . . . . . . . .
The parts of the list box . . . . . . . . . . . . . . . . . . . . . . . . . .
Configuring fill animation . . . . . . . . . . . . . . . . . . . . . . . . . . . .
Configuring horizontal position animation . . . . . . . . . . . . . .
Configuring vertical position animation . . . . . . . . . . . . . . . .
Configuring width animation . . . . . . . . . . . . . . . . . . . . . . . . .
Configuring height animation . . . . . . . . . . . . . . . . . . . . . . . . .
Configuring rotation animation . . . . . . . . . . . . . . . . . . . . . . .
Configuring touch animation . . . . . . . . . . . . . . . . . . . . . . . . .
Configuring horizontal slider animation . . . . . . . . . . . . . . . .
Configuring vertical slider animation . . . . . . . . . . . . . . . . . . .
Configuring OLE verb animation . . . . . . . . . . . . . . . . . . . . .
Attaching other types of animation to OLE objects . .
12-2
12-2
12-3
12-4
12-6
12-6
12-6
12-6
12-7
12-7
12-7
12-8
12-8
12-9
12-9
12-9
12-12
12-13
12-13
12-17
12-19
12-20
12-21
12-23
12-24
12-27
12-28
12-30
12-31
12-32
1
1
13
1
&RQWHQWV
Configuring ActiveX control . . . . . . . . . . . . . . . . . . . . . . . . .
The object’s properties versus RSView32 animation . .
Naming an ActiveX object . . . . . . . . . . . . . . . . . . . . . . .
Attaching ActiveX control properties . . . . . . . . . . . . . .
Attaching ActiveX control events . . . . . . . . . . . . . . . .
Viewing ActiveX control methods . . . . . . . . . . . . . . . . .
Using the Invoke command to call an ActiveX method
Associating objects and displays with keys . . . . . . . . . . . . . .
Creating object keys . . . . . . . . . . . . . . . . . . . . . . . . . . . . . . . . .
Using index numbers . . . . . . . . . . . . . . . . . . . . . . . . . . . . . . . .
How index numbers are used . . . . . . . . . . . . . . . . . . . . .
Checking an object’s index number . . . . . . . . . . . . . . . .
Changing index numbers . . . . . . . . . . . . . . . . . . . . . . . . .
Creating a tab sequence . . . . . . . . . . . . . . . . . . . . . . . . . .
Using the Current [Tag] parameter . . . . . . . . . . . . . . . . . . . . .
Summary of steps . . . . . . . . . . . . . . . . . . . . . . . . . . . . . . .
Examples . . . . . . . . . . . . . . . . . . . . . . . . . . . . . . . . . . . . . .
Creating display keys . . . . . . . . . . . . . . . . . . . . . . . . . . . . . . . .
Editing display and object keys . . . . . . . . . . . . . . . . . . . . . . . .
Modifying a key . . . . . . . . . . . . . . . . . . . . . . . . . . . . . . . .
Removing a key . . . . . . . . . . . . . . . . . . . . . . . . . . . . . . . .
Removing all keys . . . . . . . . . . . . . . . . . . . . . . . . . . . . . .
Viewing the key list at runtime . . . . . . . . . . . . . . . . . . . . . . . .
Disabling the key list . . . . . . . . . . . . . . . . . . . . . . . . . . . .
Applying animation to groups . . . . . . . . . . . . . . . . . . . . . . . .
Checking the animation on objects . . . . . . . . . . . . . . . . . . . . .
Using the Animation menu and the Animation
dialog box . . . . . . . . . . . . . . . . . . . . . . . . . . . . . . . . . . . . .
Using Peek . . . . . . . . . . . . . . . . . . . . . . . . . . . . . . . . . . . .
Changing the animation on objects . . . . . . . . . . . . . . . . . . . .
Copying or duplicating objects with animation . . . . . . . . . .
Copying animation without copying objects . . . . . . . . . . . .
1
1
1
14
12-32
12-32
12-34
12-35
12-36
12-38
12-39
12-40
12-40
12-43
12-43
12-44
12-44
12-45
12-46
12-47
12-47
12-52
12-54
12-54
12-55
12-55
12-55
12-56
12-56
12-57
12-57
12-58
12-60
12-60
12-61
&RQWHQWV
Chapter 13: Configuring Trends
About trends . . . . . . . . . . . . . . . . . . . . . . . . . . . . . . . . . . . . . . .
Key concepts . . . . . . . . . . . . . . . . . . . . . . . . . . . . . . . . . . . . . . .
Trend object . . . . . . . . . . . . . . . . . . . . . . . . . . . . . . . . . . .
Trend dialog box . . . . . . . . . . . . . . . . . . . . . . . . . . . . . . .
Data source . . . . . . . . . . . . . . . . . . . . . . . . . . . . . . . . . . . .
Pens . . . . . . . . . . . . . . . . . . . . . . . . . . . . . . . . . . . . . . . . . .
Shading . . . . . . . . . . . . . . . . . . . . . . . . . . . . . . . . . . . . . . .
Legend . . . . . . . . . . . . . . . . . . . . . . . . . . . . . . . . . . . . . . . .
Control tags . . . . . . . . . . . . . . . . . . . . . . . . . . . . . . . . . . .
Summary of steps . . . . . . . . . . . . . . . . . . . . . . . . . . . . . . . . . . .
Creating a trend object . . . . . . . . . . . . . . . . . . . . . . . . . . . . . . .
Working in the Trend dialog box . . . . . . . . . . . . . . . . . . . . . .
Trend configuration . . . . . . . . . . . . . . . . . . . . . . . . . . . . . . . . .
Configuring the time axis . . . . . . . . . . . . . . . . . . . . . . . .
Configuring the vertical axis . . . . . . . . . . . . . . . . . . . . . .
Choosing a data source . . . . . . . . . . . . . . . . . . . . . . . . . .
Configuring control . . . . . . . . . . . . . . . . . . . . . . . . . . . . .
Creating a legend . . . . . . . . . . . . . . . . . . . . . . . . . . . . . . .
Pen configuration . . . . . . . . . . . . . . . . . . . . . . . . . . . . . . . . . . .
Configuring the tag or value . . . . . . . . . . . . . . . . . . . . . .
Configuring pen style . . . . . . . . . . . . . . . . . . . . . . . . . . .
Configuring pen scale . . . . . . . . . . . . . . . . . . . . . . . . . . .
Configuring shading . . . . . . . . . . . . . . . . . . . . . . . . . . . .
Creating a legend . . . . . . . . . . . . . . . . . . . . . . . . . . . . . . .
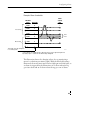
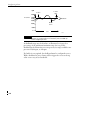
Ensuring realtime trends have data . . . . . . . . . . . . . . . . . . . . .
Comparing realtime and historical data . . . . . . . . . . . . . . . . .
Creating control for a trend . . . . . . . . . . . . . . . . . . . . . . . . . . .
Trend control tags . . . . . . . . . . . . . . . . . . . . . . . . . . . . . .
How the trend control tags work . . . . . . . . . . . . . . . . . .
Creating objects to animate a trend . . . . . . . . . . . . . . . .
Masking pens . . . . . . . . . . . . . . . . . . . . . . . . . . . . . . . . . .
Specifying a Start time . . . . . . . . . . . . . . . . . . . . . . . . . . .
Using the Trends graphic library . . . . . . . . . . . . . . . . . . . . . . .
Setting the name of the Control Tag folder . . . . . . . . . .
Choosing fonts, colors, and lines . . . . . . . . . . . . . . . . . . . . . .
13-1
13-2
13-2
13-2
13-3
13-3
13-4
13-4
13-4
13-5
13-5
13-6
13-7
13-7
13-12
13-13
13-15
13-17
13-18
13-19
13-19
13-21
13-22
13-25
13-26
13-27
13-27
13-28
13-30
13-31
13-32
13-33
13-35
13-35
13-37
1
1
15
1
&RQWHQWV
Using the trend at runtime . . . . . . . . . . . . . . . . . . . . . . . . . . . .
Selecting pens . . . . . . . . . . . . . . . . . . . . . . . . . . . . . . . . . .
Selecting points . . . . . . . . . . . . . . . . . . . . . . . . . . . . . . . . .
Changing the marker’s color . . . . . . . . . . . . . . . . . . . . . .
Editing a trend . . . . . . . . . . . . . . . . . . . . . . . . . . . . . . . . . . . . . .
Editing the trend object . . . . . . . . . . . . . . . . . . . . . . . . . .
Editing the trend configuration . . . . . . . . . . . . . . . . . . .
13-38
13-38
13-39
13-39
13-40
13-40
13-40
Chapter 14: Creating Expressions
About expressions . . . . . . . . . . . . . . . . . . . . . . . . . . . . . . . . . .
Expression components . . . . . . . . . . . . . . . . . . . . . . . . . .
Where you can use expressions . . . . . . . . . . . . . . . . . . . . . . . .
Using expressions in a command . . . . . . . . . . . . . . . . . .
Creating expressions . . . . . . . . . . . . . . . . . . . . . . . . . . . . . . . . .
Expression buttons . . . . . . . . . . . . . . . . . . . . . . . . . . . . .
Cutting, copying, and pasting expressions . . . . . . . . . . . . . . .
Formatting expressions . . . . . . . . . . . . . . . . . . . . . . . . . . . . . .
Using the = (Equal) command . . . . . . . . . . . . . . . . . . . . . . . . .
Using tag names and tag placeholders . . . . . . . . . . . . . . . . . . .
Using tag placeholders instead of tag names . . . . . . . . .
Constants . . . . . . . . . . . . . . . . . . . . . . . . . . . . . . . . . . . . . . . . . .
Arithmetic operators . . . . . . . . . . . . . . . . . . . . . . . . . . . . . . . .
String operands . . . . . . . . . . . . . . . . . . . . . . . . . . . . . . . . .
Relational operators . . . . . . . . . . . . . . . . . . . . . . . . . . . . . . . . .
How string operands are evaluated . . . . . . . . . . . . . . . .
Logical operators . . . . . . . . . . . . . . . . . . . . . . . . . . . . . . . . . . .
Bitwise operators . . . . . . . . . . . . . . . . . . . . . . . . . . . . . . . . . . .
Built-in functions . . . . . . . . . . . . . . . . . . . . . . . . . . . . . . . . . . .
Tag functions . . . . . . . . . . . . . . . . . . . . . . . . . . . . . . . . . . .
Time functions . . . . . . . . . . . . . . . . . . . . . . . . . . . . . . . . .
File functions . . . . . . . . . . . . . . . . . . . . . . . . . . . . . . . . . .
Math functions . . . . . . . . . . . . . . . . . . . . . . . . . . . . . . . . .
Evaluation order of operators . . . . . . . . . . . . . . . . . . . . . . . . .
If-then-else . . . . . . . . . . . . . . . . . . . . . . . . . . . . . . . . . . . . . . . . .
Nested if-then-else structure . . . . . . . . . . . . . . . . . . . . . .
1
1
1
16
14-1
14-2
14-2
14-2
14-3
14-3
14-4
14-5
14-6
14-8
14-8
14-9
14-9
14-10
14-10
14-10
14-11
14-12
14-14
14-14
14-16
14-19
14-20
14-20
14-23
14-24
&RQWHQWV
Chapter 15: Setting Up Navigation
Developing a hierarchy of displays . . . . . . . . . . . . . . . . . . . . .
Methods for moving among displays . . . . . . . . . . . . . . . . . . .
Commands for moving among displays . . . . . . . . . . . .
Reducing display call-up time . . . . . . . . . . . . . . . . . . . . .
Where to use RSView32 commands . . . . . . . . . . . . . . . .
Example of navigation methods . . . . . . . . . . . . . . . . . . . . . . .
The tools . . . . . . . . . . . . . . . . . . . . . . . . . . . . . . . . . . . . . . . . . .
Precedence . . . . . . . . . . . . . . . . . . . . . . . . . . . . . . . . . . . . .
Creating macros . . . . . . . . . . . . . . . . . . . . . . . . . . . . . . . . . . . .
Using parameters . . . . . . . . . . . . . . . . . . . . . . . . . . . . . . .
Nesting macros . . . . . . . . . . . . . . . . . . . . . . . . . . . . . . . . .
Creating a macro that starts when a project starts . . . .
Creating symbols . . . . . . . . . . . . . . . . . . . . . . . . . . . . . . . . . . .
Important guidelines . . . . . . . . . . . . . . . . . . . . . . . . . . . .
Key definitions . . . . . . . . . . . . . . . . . . . . . . . . . . . . . . . . . . . . .
General rules about precedence . . . . . . . . . . . . . . . . . . .
Precedence and the F1 key . . . . . . . . . . . . . . . . . . . . . . .
Precedence and embedded ActiveX objects . . . . . . . . . .
Precedence and embedded OLE objects . . . . . . . . . . . .
Reserved keys . . . . . . . . . . . . . . . . . . . . . . . . . . . . . . . . . .
Tips for using keys . . . . . . . . . . . . . . . . . . . . . . . . . . . . . .
Creating global keys . . . . . . . . . . . . . . . . . . . . . . . . . . . . . . . . .
Running global key files . . . . . . . . . . . . . . . . . . . . . . . . . . . . . .
15-1
15-2
15-3
15-4
15-4
15-5
15-7
15-7
15-7
15-10
15-11
15-11
15-12
15-13
15-14
15-14
15-15
15-15
15-16
15-17
15-19
15-19
15-21
Chapter 16: Sharing Data with Other Windows Applications
Methods for sharing data . . . . . . . . . . . . . . . . . . . . . . . . . . . . .
Retrieving historical data . . . . . . . . . . . . . . . . . . . . . . . . . . . . .
Retrieving tag names from data log files . . . . . . . . . . . .
Bringing logged dBASE IV data into Microsoft Excel . . . . .
Understanding the content of the log files . . . . . . . . . . . . . . .
Activity log files . . . . . . . . . . . . . . . . . . . . . . . . . . . . . . . .
Activity log—ODBC format . . . . . . . . . . . . . . . . . . . . .
Alarm log files . . . . . . . . . . . . . . . . . . . . . . . . . . . . . . . . . .
Alarm log files—ODBC format . . . . . . . . . . . . . . . . . . .
Data log files—narrow .dbf format . . . . . . . . . . . . . . . .
Data log files—wide .dbf format . . . . . . . . . . . . . . . . . . .
Data log—ODBC format . . . . . . . . . . . . . . . . . . . . . . . .
16-1
16-3
16-4
16-5
16-7
16-7
16-8
16-9
16-10
16-12
16-13
16-15
1
1
17
1
&RQWHQWV
Creating a pivot table in Microsoft Excel . . . . . . . . . . . . . . . .
Starting the PivotTable Wizard . . . . . . . . . . . . . . . . . . . .
Selecting the data source . . . . . . . . . . . . . . . . . . . . . . . . .
Joining tables and selecting data . . . . . . . . . . . . . . . . . . .
Organizing the pivot table . . . . . . . . . . . . . . . . . . . . . . . .
Creating a chart . . . . . . . . . . . . . . . . . . . . . . . . . . . . . . . .
Sharing tag values locally . . . . . . . . . . . . . . . . . . . . . . . . . . . . .
Providing tag values to local OPC or DDE clients . . . . . . . .
Enabling RSView32 as a server . . . . . . . . . . . . . . . . . . . .
Setting up a local OPC client application . . . . . . . . . . .
Setting up a local DDE client application . . . . . . . . . . .
Getting tag values from servers . . . . . . . . . . . . . . . . . . . . . . . .
Setting up RSView32 as the client . . . . . . . . . . . . . . . . . .
Enabling RSView32 for tag writes . . . . . . . . . . . . . . . . . . . . . .
Sending DDEExecute commands to other applications . . . .
16-17
16-17
16-18
16-20
16-22
16-23
16-24
16-24
16-24
16-24
16-25
16-26
16-26
16-27
16-28
Chapter 17: Using Networks
Sharing project components during development
and runtime . . . . . . . . . . . . . . . . . . . . . . . . . . . . . . . . . . . . . . . . 17-1
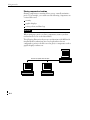
Sharing components during development . . . . . . . . . . . 17-1
Sharing components at runtime . . . . . . . . . . . . . . . . . . . 17-2
How to share components . . . . . . . . . . . . . . . . . . . . . . . 17-3
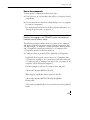
Using OPC for peer-to-peer network communications . . . . 17-5
Identifying the RSView32 server computer . . . . . . . . . . 17-6
Enabling an RSView32 OPC server for reading
and writing . . . . . . . . . . . . . . . . . . . . . . . . . . . . . . . . . . . . 17-6
Configuring the RSView32 OPC client application . . . 17-7
Connecting to RSLinx Gateway as a remote OPC server . . 17-10
Configuring RSLinx Gateway . . . . . . . . . . . . . . . . . . . . 17-10
Configuring RSView32 for use with RSLinx Gateway 17-10
1
1
1
18
&RQWHQWV
Chapter 18: Running Your Project
Summary of steps . . . . . . . . . . . . . . . . . . . . . . . . . . . . . . . . . . .
Specifying startup settings . . . . . . . . . . . . . . . . . . . . . . . . . . . .
Preferences . . . . . . . . . . . . . . . . . . . . . . . . . . . . . . . . . . . .
Startup . . . . . . . . . . . . . . . . . . . . . . . . . . . . . . . . . . . . . . . .
Setting up a project in a new location . . . . . . . . . . . . . . . . . . .
Setting the project path . . . . . . . . . . . . . . . . . . . . . . . . . . . . . . .
Changing application paths . . . . . . . . . . . . . . . . . . . . . . .
Changing the database path . . . . . . . . . . . . . . . . . . . . . . .
Specifying time, date, and number formats . . . . . . . . . . . . . .
Running a project . . . . . . . . . . . . . . . . . . . . . . . . . . . . . . . . . . .
Running a project automatically . . . . . . . . . . . . . . . . . . .
Monitoring disk space . . . . . . . . . . . . . . . . . . . . . . . . . . . . . . .
Stopping a project . . . . . . . . . . . . . . . . . . . . . . . . . . . . . . . . . . .
When a project stops . . . . . . . . . . . . . . . . . . . . . . . . . . . .
18-1
18-2
18-3
18-6
18-8
18-8
18-10
18-11
18-12
18-13
18-13
18-14
18-15
18-15
Appendix A: RSView32 Commands
Using RSView32 commands . . . . . . . . . . . . . . . . . . . . . . . . . .
Where to use commands . . . . . . . . . . . . . . . . . . . . . . . . .
How to use commands . . . . . . . . . . . . . . . . . . . . . . . . . .
Using placeholders in commands . . . . . . . . . . . . . . . . . .
Precedence . . . . . . . . . . . . . . . . . . . . . . . . . . . . . . . . . . . . .
Using the command line . . . . . . . . . . . . . . . . . . . . . . . . . . . . . .
Using the Command Wizard . . . . . . . . . . . . . . . . . . . . . . . . . .
Building a command string . . . . . . . . . . . . . . . . . . . . . . .
A-1
A-1
A-2
A-3
A-4
A-5
A-5
A-6
Appendix B: System Tags
Alarms . . . . . . . . . . . . . . . . . . . . . . . . . . . . . . . . . . . . . . . . . . . .
Communications . . . . . . . . . . . . . . . . . . . . . . . . . . . . . . . . . . . .
Graphics . . . . . . . . . . . . . . . . . . . . . . . . . . . . . . . . . . . . . . . . . . .
Time . . . . . . . . . . . . . . . . . . . . . . . . . . . . . . . . . . . . . . . . . . . . . .
Trends . . . . . . . . . . . . . . . . . . . . . . . . . . . . . . . . . . . . . . . . . . . . .
User . . . . . . . . . . . . . . . . . . . . . . . . . . . . . . . . . . . . . . . . . . . . . .
Windows memory resources . . . . . . . . . . . . . . . . . . . . . . . . . .
B-1
B-2
B-4
B-4
B-5
B-7
B-7
1
1
19
1
&RQWHQWV
Appendix C: Differences Between RSView32 and
ControlView
Importing ControlView projects . . . . . . . . . . . . . . . . . . . . . .
Activity log . . . . . . . . . . . . . . . . . . . . . . . . . . . . . . . . . . . . . . . .
Alarms . . . . . . . . . . . . . . . . . . . . . . . . . . . . . . . . . . . . . . . . . . . .
Alarm banner and alarm status display . . . . . . . . . . . . .
Alarm log . . . . . . . . . . . . . . . . . . . . . . . . . . . . . . . . . . . . .
Alarm summary . . . . . . . . . . . . . . . . . . . . . . . . . . . . . . . .
Commands . . . . . . . . . . . . . . . . . . . . . . . . . . . . . . . . . . . . . . . . .
Obsolete commands . . . . . . . . . . . . . . . . . . . . . . . . . . . . .
Renamed commands . . . . . . . . . . . . . . . . . . . . . . . . . . . .
Data log . . . . . . . . . . . . . . . . . . . . . . . . . . . . . . . . . . . . . . . . . . .
Derived tags . . . . . . . . . . . . . . . . . . . . . . . . . . . . . . . . . . . . . . . .
Events . . . . . . . . . . . . . . . . . . . . . . . . . . . . . . . . . . . . . . . . . . . . .
Global keys . . . . . . . . . . . . . . . . . . . . . . . . . . . . . . . . . . . . . . . .
Graphics . . . . . . . . . . . . . . . . . . . . . . . . . . . . . . . . . . . . . . . . . . .
Scan classes . . . . . . . . . . . . . . . . . . . . . . . . . . . . . . . . . . . . . . . . .
SLC addressing syntax . . . . . . . . . . . . . . . . . . . . . . . . . . . . . . .
Tag database . . . . . . . . . . . . . . . . . . . . . . . . . . . . . . . . . . . . . . . .
Trends . . . . . . . . . . . . . . . . . . . . . . . . . . . . . . . . . . . . . . . . . . . . .
ControlView features integrated into RSView32 . . . . . . . . . .
C-1
C-1
C-2
C-2
C-2
C-2
C-3
C-3
C-4
C-4
C-5
C-5
C-5
C-6
C-7
C-7
C-7
C-8
C-8
Appendix D: Addressing Syntax for Allen-Bradley
Programmable Controllers
PLC addressing syntax . . . . . . . . . . . . . . . . . . . . . . . . . . . . . . .
PLC-2 . . . . . . . . . . . . . . . . . . . . . . . . . . . . . . . . . . . . . . . .
PLC-3 data table sections . . . . . . . . . . . . . . . . . . . . . . . .
PLC-3 timers and counters . . . . . . . . . . . . . . . . . . . . . . .
PLC-5 data files . . . . . . . . . . . . . . . . . . . . . . . . . . . . . . . .
PLC-5 binary files: optional syntax . . . . . . . . . . . . . . . .
PLC-5 I/O and status files . . . . . . . . . . . . . . . . . . . . . . .
PLC-5 timers, counters, and control files . . . . . . . . . . .
PLC-5 (Enhanced) I/O and status files . . . . . . . . . . . . .
PLC-5 (Enhanced) binary, BCD, integer, ASCII, float,
and string files . . . . . . . . . . . . . . . . . . . . . . . . . . . . . . . . . .
PLC-5 (Enhanced) binary files: optional syntax . . . . . .
PLC-5 (Enhanced) timer, counter, control, SFC status,
message, PID, block transfer, and token data files . . . .
1
1
1
20
D-2
D-2
D-2
D-3
D-4
D-4
D-5
D-5
D-6
D-7
D-8
D-8
&RQWHQWV
SLC addressing syntax . . . . . . . . . . . . . . . . . . . . . . . . . . . . . . .
D-9
SLC 5 I/O files . . . . . . . . . . . . . . . . . . . . . . . . . . . . . . . . .
D-9
Important information for addressing SLC 5
I/O modules . . . . . . . . . . . . . . . . . . . . . . . . . . . . . . . . . . . D-10
SLC 5 status files . . . . . . . . . . . . . . . . . . . . . . . . . . . . . . . D-11
SLC 5 binary and integer files . . . . . . . . . . . . . . . . . . . . . D-11
SLC 5 binary files: optional syntax . . . . . . . . . . . . . . . . D-12
SLC 5 timer, counter, and control files . . . . . . . . . . . . . D-12
SLC 5 timer, counter, and control files bit member
addressing: optional syntax . . . . . . . . . . . . . . . . . . . . . . . D-13
SLC 5 timer, counter, and control files bit member
addressing by bit address: optional syntax . . . . . . . . . . D-13
SLC 5 timer, counter, and control files analog member
addressing: optional syntax . . . . . . . . . . . . . . . . . . . . . . . D-14
SLC 5 (Enhanced) I/O files . . . . . . . . . . . . . . . . . . . . . . . D-15
SLC 5 (Enhanced) status files . . . . . . . . . . . . . . . . . . . . . D-15
SLC 5 (Enhanced) binary, integer, float, ASCII, and
string files . . . . . . . . . . . . . . . . . . . . . . . . . . . . . . . . . . . . . D-16
SLC 5 (Enhanced) binary files: optional syntax . . . . . . D-17
SLC 5 (Enhanced) timer, counter, and control files . . . D-17
SLC 5 (Enhanced) timer, counter, and control files
bit member addressing: optional syntax . . . . . . . . . . . . D-18
SLC 5 (Enhanced) timer, counter, and control files
bit member addressing by bit address: optional syntax D-18
SLC 5 (Enhanced) timer, counter, and control files
analog member addressing: optional syntax . . . . . . . . . D-19
SoftLogix 5 addressing syntax . . . . . . . . . . . . . . . . . . . . . . . . . D-20
SoftLogix 5 I/O and status files . . . . . . . . . . . . . . . . . . . D-20
SoftLogix 5 binary, BCD, integer, long integer, ASCII,
float, and string files . . . . . . . . . . . . . . . . . . . . . . . . . . . . . D-21
SoftLogix 5 binary files: optional syntax . . . . . . . . . . . . D-21
SoftLogix 5 timer, counter, control, SFC status, message,
PID, block transfer, and token data files . . . . . . . . . . . . D-22
1
1
21
1
&RQWHQWV
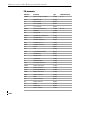
Mnemonic tables . . . . . . . . . . . . . . . . . . . . . . . . . . . . . . . . . . . .
Timer mnemonics . . . . . . . . . . . . . . . . . . . . . . . . . . . . . . .
Counter mnemonics . . . . . . . . . . . . . . . . . . . . . . . . . . . . .
Control mnemonics . . . . . . . . . . . . . . . . . . . . . . . . . . . . .
PID mnemonics . . . . . . . . . . . . . . . . . . . . . . . . . . . . . . . .
PID mnemonics (continued) . . . . . . . . . . . . . . . . . . . . . .
Message mnemonics . . . . . . . . . . . . . . . . . . . . . . . . . . . . .
Block transfer mnemonics . . . . . . . . . . . . . . . . . . . . . . . .
Token data mnemonics . . . . . . . . . . . . . . . . . . . . . . . . . .
SFC status mnemonics . . . . . . . . . . . . . . . . . . . . . . . . . . .
D-23
D-23
D-23
D-23
D-24
D-25
D-25
D-26
D-26
D-26
Appendix E: Station Addressing for Nodes Connecting to
Allen-Bradley Devices
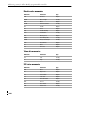
Local station addressing . . . . . . . . . . . . . . . . . . . . . . . . . . . . . .
Host name . . . . . . . . . . . . . . . . . . . . . . . . . . . . . . . . . . . . .
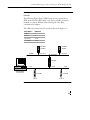
Remote station addressing . . . . . . . . . . . . . . . . . . . . . . . . . . . .
DH and DH+ networks bridged by a 1785-KA . . . . . .
DH+ and DH-485 networks bridged by a 1785-KA5 .
Multiple DH+ networks connected by a
Pyramid Integrator . . . . . . . . . . . . . . . . . . . . . . . . . . . . . .
DH and DH+ connected to a TCP/IP network by a
Pyramid Integrator . . . . . . . . . . . . . . . . . . . . . . . . . . . . . .
Glossary
Index
1
1
1
22
E-1
E-2
E-2
E-2
E-4
E-6
E-8
P
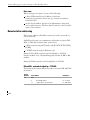
Preface
Thank you for choosing RSView32Z. RSView32 is an integrated
package for developing and running automation applications.
Designed for use with MicrosoftX Windows NTZ and
WindowsX 9x, RSView32 gives you all the tools you need to create
effective monitoring and supervisory control applications.
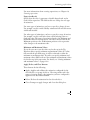
About the documentation
The RSView32 documentation set includes:
Getting Results with RSView32: A quick start guide to get you up
and running with RSView32.
RSView32 User’s Guide: Comprehensive information about
RSView32, procedures for creating and running an automation
application, and reference information.
RSView32 Runtime User’s Guide: Information on how to install,
start, and use RSView32 Runtime.
Help: Online procedures and reference information.
1
1
P-1 1
Preface
3UHIDFH
ReadMe File: Additional information about RSView32. Read this file
before you begin working with the software.
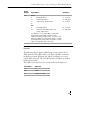
Technical support services
If you have questions about RSView32, please consult the user’s
guides or the Help.
If you can’t find the answer, contact Rockwell Software Technical
Support at:
Telephone:
440-646-7800
Fax:
440-646-7801
World Wide Web Support Library: www5.software.rockwell.com
Support staff are available Monday to Friday from 8 am to 5 pm
Eastern Standard Time, except during holidays.
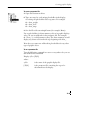
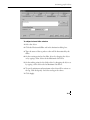
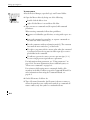
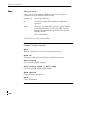
When you call
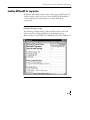
When you call, you should be at your computer and ready to give
the following information:
the product serial number
You’ll find this number on the Activation disk label and in the
help About dialog box that you access from the RSView32 Project
Manager.
the product version number
the type of hardware you are using
the exact wording of any messages that appeared on your screen
a description of what happened and what you were doing when
the problem occurred
a description of how you tried to solve the problem
1
1
1
P-2
1
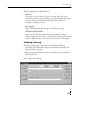
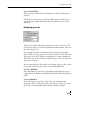
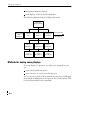
Working with projects
This chapter describes:
files and components
adding, renaming, removing, and deleting components
printing from editors
What is a project?
A project consists of a folder on your hard disk that contains, at a
minimum, the following items:
project file (.rsv)
tag folder
comprf (communications profile) folder
cache folder
The .rsv file contains general project information such as a list of
project components and their directory locations and version
numbers. By default, all project components are located locally in
folders under the project folder, but they can also be located in other
directories or on other computers.
1
1
1-1 1
Working with projects
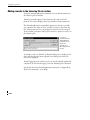
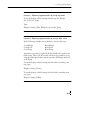
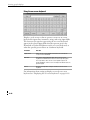
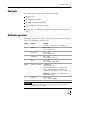
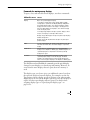
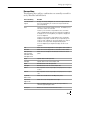
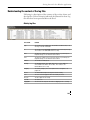
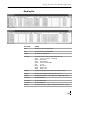
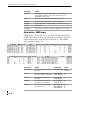
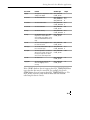
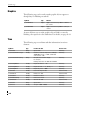
Project files
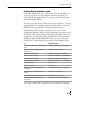
The following table lists the RSView32 folders and the types of files
they contain.
1
1
1
1-2
Folder
Contents
File extension(s)
Project name
RSView32 project file, system files,
and the folders described below
.rsv
System files: User accounts
Security command list
.act
.sec
Project name\Actlog
Activity log files
.dbf
Project name\Almlog
Alarm log files
.dbf
Project name\Als
Alarm summary files
.als
Project name\Cab
ActiveX control setup files
.cab
Project name\Cache
RSView32 internal files
.ctl, .dat, .idx
Project name\Comprf
Internal information on channels,
nodes, and scan classes
.csv, .ctl
Project name\Dlglog
Data log models
Data log files
Information for current file set
Information for historical file sets
.mdf
.dbf
.dns
.dlg
Project name\Dts
Derived tag files
.dts
Project name\Eds
Events files
.eds
Project name\Gfx
Graphic display files
.gfx
Project name\Key
Global key files
.key
Project name\Mcr
Macro files
.mcr
Project name\Par
Parameter files
.par
Project name\Rcp
Recipe files
.rcp
Project name\Tag
Tag database files
.db, .ctl, .dat
Tag cache file
.cac
Project name\Tgs
Tag monitor files
.tgs
Project name\Vba
VBA program files
.vba
Working with projects
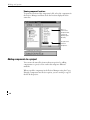
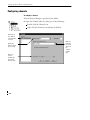
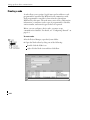
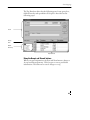
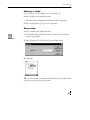
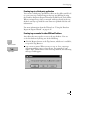
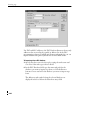
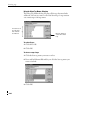
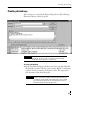
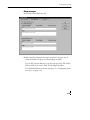
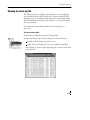
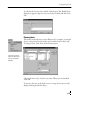
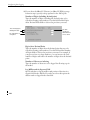
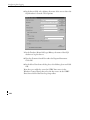
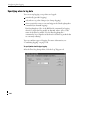
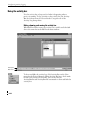
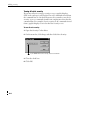
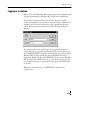
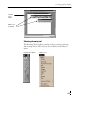
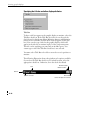
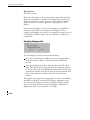
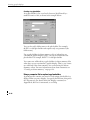
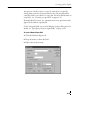
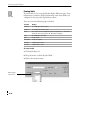
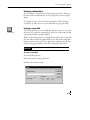
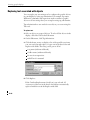
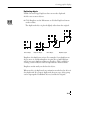
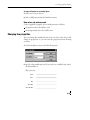
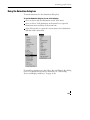
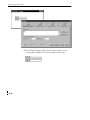
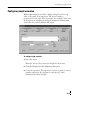
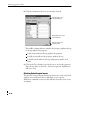
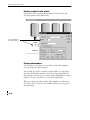
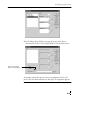
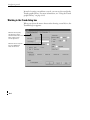
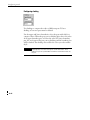
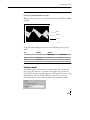
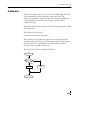
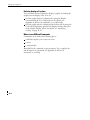
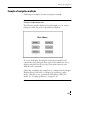
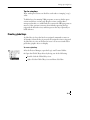
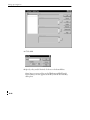
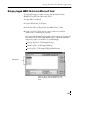
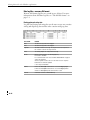
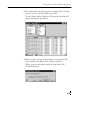
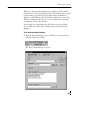
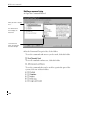
Working in the Project Manager
The Project Manager is the main tool for working with RSView32.
Each time you create a project, a Project Manager appears showing
the project name.
Project name
Component
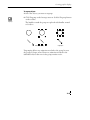
The Project Manager window is divided into two panes. When you
first create a project, the left pane appears with a series of folders and
the right pane is empty. As you create project components, they are
displayed in the right pane.
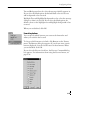
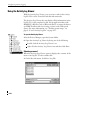
Component
The Project Manager manages components, not files. A component
is a file reference that is associated with the physical file’s name and
path. The file can be located in a folder under the project directory,
outside the project directory, or on another computer.
1
1
1-3 1
Working with projects
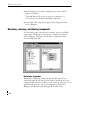
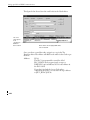
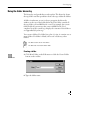
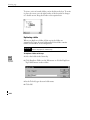
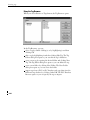
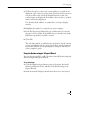
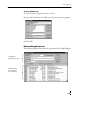
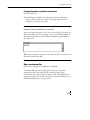
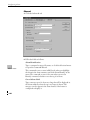
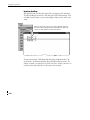
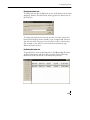
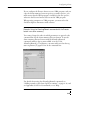
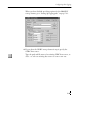
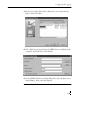
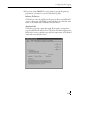
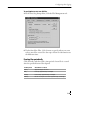
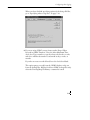
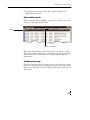
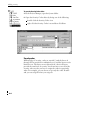
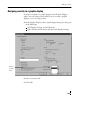
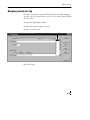
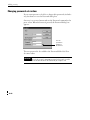
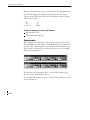
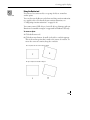
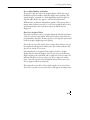
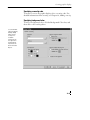
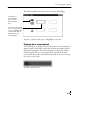
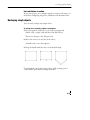
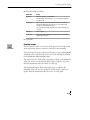
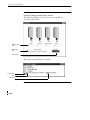
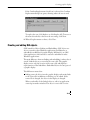
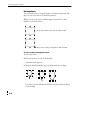
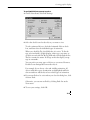
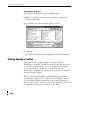
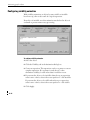
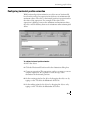
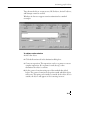
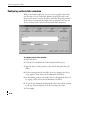
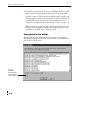
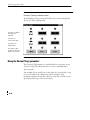
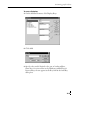
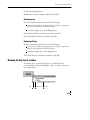
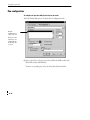
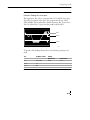
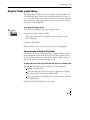
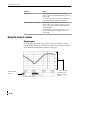
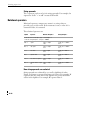
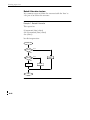
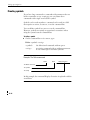
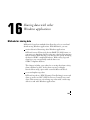
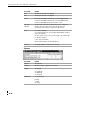
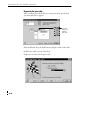
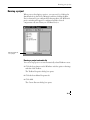
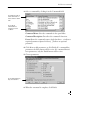
Viewing component locations
To view the location of the component’s file, select the component in
the Project Manager and then check the location displayed in the
status bar.
This is a
shortcut to a
component that
is not in the
default project
directory.
The path to the
selected
component . . .
. . . is displayed in the status bar.
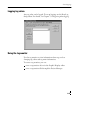
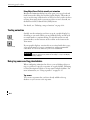
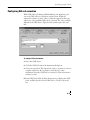
Adding components to a project
You can use the same files in more than one project by adding
components to a project. You can do this using two different
methods.
When you add a component in the Project Manager using the Copy
Existing Component into Project option, you are creating a copy of
the file in the project.
1
1
1
1-4
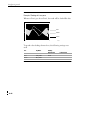
Working with projects
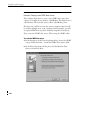
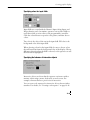
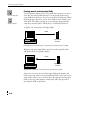
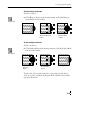
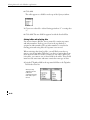
When you add a component using the second option, Create
Shortcut to Existing Component, you are not creating a copy of the
file in the project. Instead, you are creating a link to the file’s
location outside of the project. The advantage of using this option is
that there is only one copy of the file, and changes made to it are
available to all projects using the file. The disadvantage of using this
option is that it is more difficult to copy or move projects, because
the files are not all located in the same place.
If you copy a component into a project using the Windows Explorer,
you cannot add the component to the project using the Copy
Existing Component into Project option. Instead, use the Create
Shortcut to Existing Component option to add the component to the
Project Manager.
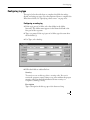
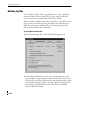
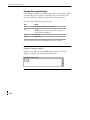
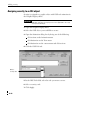
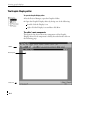
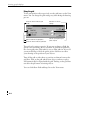
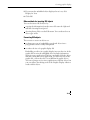
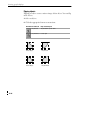
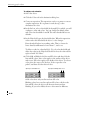
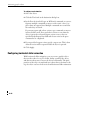
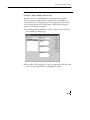
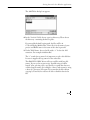
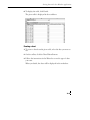
When you highlight the component in the right pane of the Project
Manager, the path to the file is displayed in the status bar. Files that
are located outside of the project have an arrow symbol on the
component icon, as shown above for the Detail component.
If you move or delete a file using Windows Explorer, the file
reference is broken and the component name is greyed out in the
Project Manager until the file reference is updated. To update the file
reference, use either the Copy Existing Component into Project
option or the Create Shortcut to Existing Component option.
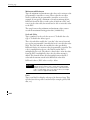
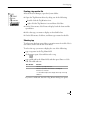
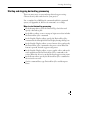
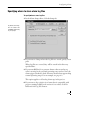
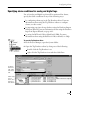
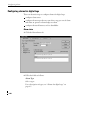
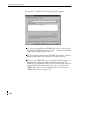
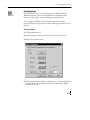
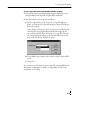
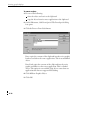
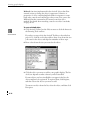
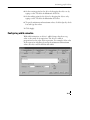
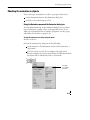
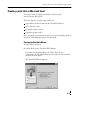
To add a component to a project or update its file reference:
1. Select the editor that was used to create the desired component.
For example, to add a graphic display component, highlight the
Graphic Display editor.
2. Right-click to display the context menu, and then click Copy
Existing Component into Project or click Create Shortcut to
Existing Component.
1
1
1-5 1
Working with projects
3. In the dialog box, locate the component you want to add or
update, and click it.
Click and Shift-click to select a group of components, or
Ctrl-click to select multiple individual components.
4. Click Open. The components appear in the right pane of the
Project Manager.
Renaming, removing, and deleting components
Use the items on the context menu to rename, remove, and delete
components. The Remove item removes a component from the
Project Manager. The Delete item deletes a component and its
associated file from disk.
Renaming a component
Renaming a component changes the physical file name. If you
change the name of a file that is referenced by another project, the
component (file reference) will be greyed out in the other project. To
update the file reference, select the component in the Project
Manager, click Rename, and then type the new file name.
1
1
1
1-6
Working with projects
To rename a component:
1. Select the component in the right pane of the Project Manager.
2. Right-click and then click Rename.
3. In the To field, type the new name.
4. Click OK.
Removing a component
If you no longer want to use a particular file in a project, you can
remove the component (file reference) from the project using the
Remove item on the context menu.
Removing a component removes the component from the Project
Manager. It does not affect the physical file.
To remove a component:
1. Select the component in the right pane of the Project Manager.
2. Right-click and then click Remove.
Deleting a component and file
If you no longer want to use a particular file in any project, you can
delete the component and its associated file using the Delete item on
the context menu. Deleting a component deletes both the file
reference and the physical file from disk.
1
1
1-7 1
Working with projects
To delete a component and file:
1. Select the component in the right pane of the Project Manager.
2. Right-click and then click Delete.
Naming files
RSView32 supports long file names. File names, including the path,
can be up to 200 characters long. For example, the following path
and file name contains 30 characters:
C:\Bakery1\Gfx\Bakery Overview
Some file servers do not support file names longer than eight
characters. If your server does not accept long file names and you
type a name longer than eight characters, you will receive a message.
To avoid problems when issuing commands, do not use command
names to name component files. For example, suppose you want to
call an alarm summary file Summary 5. To avoid confusion with the
Summary command, call the file Summary5.
File names can contain spaces. When using file names with spaces in
commands, you do not need to enclose the file names in double
quotes (“ ”) except when using the /P parameter with the Display
command. For details about commands, see Appendix A, RSView32
commands.
Printing
Each RSView32 editor has a Print item on its File menu.
To print selections:
1. Select the item you want to print. The item can be a record in an
editor’s spreadsheet or it can be an object in a graphic display.
2. On the File menu, click Print.
1
1
1
1-8
Working with projects
3. Under Print Range, click Selection.
4. Click OK.
To print the entire contents of the window:
1. On the File menu, click Print.
2. Under Print Range, click All.
3. Click OK.
Selecting a printer
You can select only a printer that has been installed on your system.
For information on installing a printer, see your Windows
documentation.
IMPORTANT The settings in the Print Setup dialog box do not affect runtime log
printing set up in the Activity Log Setup and Alarm Setup editors.
To select a printer:
1. On the File menu in any RSView32 editor, click Print Setup.
1
1
1-9 1
Working with projects
2. If you don’t want to use the default printer, specify another
printer.
3. Choose the appropriate orientation and paper options.
4. Click OK.
Selecting printer setup options
For detailed information about printer options, refer to your
Windows documentation.
Selecting a network printer
RSView32 can print to a network printer. For detailed information
about setting up network printers, refer to your Windows
documentation.
Printing at runtime
You can also print graphic displays at runtime using the PrintDisplay
command. You must provide the operator with a way to issue the
command when you create the display. For example, create a button
object, display key, or global key with the PrintDisplay command as
the press action, or provide a command line in the graphic display.
For more information about creating graphic displays, see
Chapter 11, Creating graphic displays.
When you use the PrintDisplay command RSView32 prints the
entire display, even if parts are covered by other displays. You can
also use the ScreenPrint command to print an image of whatever
shows on the monitor. For more information about these commands
see Appendix A, RSView32 commands.
1
1
1
1-10
2
Setting up direct driver
communications
RSView32 uses a direct connection to the drivers in RSLinxZ to
communicate with most Allen-Bradley devices, as well as
SoftLogixZ 5 devices. This chapter describes how to set up direct
driver communications.
You can also use DDE (Dynamic Data Exchange) or OPCZ (OLE
for Process Control) to connect to third-party devices or servers, as
described in Chapter 3, Setting up OPC and DDE communications.
You must use an OPC or DDE connection to handle unsolicited
messages and to communicate with the PLC-5/250Z or
ControlLogix 5550Z device. For instructions on using unsolicited
messages see RSView32 Technical Notes on the RSView32 Tools
menu.
1
1
2-1 1
Setting up direct driver communications
Overview of direct driver communications
Communication through direct drivers involves:
channels
communication devices
communication driver software (RSLinx)
nodes (control devices)
The following illustration shows an RSView32 station and its
channel and nodes.
RSView32
Communication channel
Network
Nodes
Programmable controller
Programmable controller
Communication channel
The communication channel is the connection from the RSView32
station to the network the programmable controllers are attached to.
Communication device
The communication device connects the communication channel to
the computer. You can use internal devices, such as the
1784-KT/KTX, or you can use external devices connected through
the serial port.
1
1
1
2-2
Setting up direct driver communications
Communication driver
The communication driver is the software that permits the computer
to communicate with the communication device. For
communication with most Allen-Bradley programmable controllers,
use RSLinx.
For communication with SoftLogix 5 programmable controllers, you
must use an RSLinx driver.
Node (control device)
The node is a programmable controller attached to a data highway or
network. Once the RSView32 station is set up, it must periodically
update its value table. This is done by scanning its nodes.
Setting up direct driver communication to programmable controllers
The instructions below summarize the steps for connecting to
Allen-Bradley or SoftLogix 5 devices.
IMPORTANT You cannot connect to an Allen-Bradley PLC-5/250 or
ControlLogix 5550 using direct drivers. To connect to these types of
programmable controllers, use OPC- or DDE-based communications as
described in Chapter 3, Setting up OPC and DDE communications.
Setting up communications without hardware or software
You can set up communications in RSView32, even if you do not
have one or both of the following:
RSLinx drivers installed
the appropriate communications hardware installed
To do so, follow the steps below, but skip step 1 and start with
step 2.
To test your project without the appropriate hardware installed, see
“Developing your project without a communication network” on
page 2-19.
1
1
2-3 1
Setting up direct driver communications
Summary of steps
Follow the steps below to set up direct driver communication with
Allen-Bradley or SoftLogix 5 programmable controllers.
1. Start RSLinx. Configure and load the appropriate communication
driver.
2. Start RSView32 and create or open a project.
3. In the Channel editor, select a channel and assign the appropriate
network type to it.
In the Primary Communication driver field, assign a driver to the
channel. If you do not have drivers loaded, click None Loaded.
For details, see “Configuring channels” on page 2-6.
4. In the Node editor, create nodes for each programmable controller
you wish to communicate with.
For details, see “Creating a node” on page 2-12.
5. If you want to change the default rate at which nodes are scanned,
open the Scan Class editor and edit the scan classes.
For details, see “Scanning for new tag values” on page 2-15.
6. In the Tag Database editor, create tags. For each tag, select Device
as the data source and assign the nodes and scan classes that you
have defined.
For details, see Chapter 4, Creating tags.
7. Monitor communications.
For details, see “Monitoring communications” on page 2-18.
1
1
1
2-4
Setting up direct driver communications
Configuring RSLinx drivers
RSLinx drivers provide a direct connection between RSView32 tags
and Allen-Bradley or SoftLogix 5 programmable controllers. For
details about configuring any of the RSLinx drivers, see your driver
documentation.
You can also use RSLinx with OPC and DDE communications, as
described in Chapter 3, Setting up OPC and DDE communications.
You must use an OPC or DDE connection to handle unsolicited
messages and to communicate with the PLC-5/250 or
ControlLogix 5550 device. For instructions on using unsolicited
messages see RSView32 Technical Notes on the RSView32 Tools
menu.8.
Using the drivers
To configure and use the RSLinx drivers with a direct connection,
the drivers must be installed on the same computer as RSView32.
Once the drivers are configured, RSView32 automatically starts the
driver software whenever communication with a programmable
controller is required—for example, to test run a graphic display or
to run a project.
IMPORTANT You must use the version of RSLinx that came with your RSView32
software. This version has been tested for compatibility with RSView32.
Other versions may not function correctly.
Selecting a driver in RSView32
To select a driver in RSView32, the driver must first be configured in
RSLinx. All configured drivers appear in the RSView32 Channel
editor Primary or Secondary Communication Driver fields.
If the Channel editor is open when you add a driver in RSLinx, close
the Driver list by clicking another part of the editor, and then
re-open the list.
1
1
2-5 1
Setting up direct driver communications
Configuring channels
To configure a channel:
1. In the Project Manager, open the System folder.
2. Open the Channel editor by doing one of the following:
double-click the Channel icon
right-click the Channel icon and then click Show
Define up to
four different
communication
channels.
Specify the
type of network
you are using.
When you
select a
network type,
these fields
become active.
1
1
1
2-6
Click here
to display
the list of
drivers for
the
selected
network
type.
Setting up direct driver communications
3. Select a channel and fill in the following information:
Network Type
Using the following table as a guide, select a network type:
To
Select
Communicate with programmable controllers on a ControlNet
network
ControlNet
Communicate with programmable controllers on local or remote
DH networks
DH
Communicate with programmable controllers on local or remote
DH+Z networks
DH+
or
Communicate with SLCZ controllers on remote DH-485
networks
or
Connect to Channel 0 of an Enhanced PLCX
Communicate with SLC controllers on local DH-485 networks
DH-485
or
Connect to an SLC with an RS-232 port
Communicate with EthernetX programmable controllers directly
connected to the TCP/IP network
TCP/IP
or
Communicate with SoftLogix 5 controllers
or
Communicate with SLC 5/05Z controllers
Communicate with programmable controllers through the
TCP/IP Bridge
Ethernet interface of a Pyramid IntegratorZ, or RSLinx Gateway
Not use a channel
None Loaded
or
Clear a channel configuration
1
1
2-7 1
Setting up direct driver communications
To set a configured channel’s network type to None Loaded, first
issue the ComStatusOff command. Because setting a configured
channel’s network type to None Loaded deletes all the comstatus
system tags from the tag database, you cannot set a configured
channel’s network type to None Loaded if the ComStatusOn
command has been issued.
IMPORTANT Of the four communication channels you can configure, only one can be
configured for TCP/IP. For example, you cannot configure one channel for
TCP/IP and another for a TCP/IP bridge.
To run a SoftLogix 5 controller with RSLinx and RSView32,
configure the TCP/IP channel and use the SOFT5 driver or the
AB_ETH driver.
For the SOFT5 driver, when configuring the SoftLogix 5 driver in
RSLinx, enter the IP address or UNC name of the SoftLogix 5
controller in the Internet Address Mapping table.
If the SoftLogix 5 controller is not running on the same computer
as RSLinx, the Windows NT user account that is running RSLinx
must be a member of the SoftLogix Administrators group on the
SoftLogix 5 computer.
For the AB_ETH driver, when configuring the Ethernet driver in
RSLinx, enter the IP address of the SoftLogix 5 controller in the
Internet Address Mapping table. You must also enable the
WinSock TCP/IP driver in SoftLogix 5.
Messages
Type a number between 1 and 10. This is the number of messages
RSView32 will send on a channel before requiring a reply. These
messages are stored in the buffers of the programmable controllers
on the channel (each controller has its own buffer). If a buffer
overflows at runtime, a communication error is generated. If this
happens, reduce the number of messages.
The Messages field applies to both the primary and secondary
communication drivers.
1
1
1
2-8
Setting up direct driver communications
Primary and Secondary Communication Drivers
The primary driver is the one your system will use most of the
time. By default, this driver is the active driver. The secondary
driver is a backup. Primary and secondary drivers must use the
same network type.
IMPORTANT Do not select a secondary communication driver for TCP/IP or
TCP/IP Bridge channels. To create communications redundancy, use
a second Ethernet card and configure each card uniquely in
Windows. Then use the NodeSwitch command at runtime to change
the IP number if communication errors are detected.
To specify a driver, select the appropriate driver from the list. This
list contains the drivers installed and running in RSLinx that are
valid for the selected network type.
To configure communications without the appropriate hardware
or software installed, select None Loaded as the driver.
To test your project without the appropriate hardware installed,
see “Developing your project without a communication network”
on page 2-19.
For details about configuring drivers, see “Configuring RSLinx
drivers” on page 2-5.
Active Driver
The active driver can be Primary, Secondary, or None. By default,
the Primary driver is active.
To disable a channel temporarily without removing its
configuration, click None.
At runtime, users can switch between drivers if necessary. For
details, see “Switching communication drivers at runtime” on page
2-10.
4. When you finish configuring channels, click OK.
1
1
2-9 1
Setting up direct driver communications
Changing the channel configuration
To change the channel configuration once nodes have been
assigned—for example, to move a project from a computer using
DH+ to a computer using TCP/IP—create a new channel of the
correct type. Re-assign the channel number for each node, then
delete the original channel configuration.
Switching communication drivers at runtime
If the primary network fails at runtime, your system can switch to a
driver on a pre-defined secondary network. You can set up your
project so drivers switch automatically, or so operators manually
switch the drivers.
Commands for switching drivers
Use the following commands to switch drivers:
DriverPrimary <channel>
Switches from the secondary driver to the primary driver on the
specified channel.
<channel>
The number of the channel (1 through 4) that is being
switched from its secondary to primary driver.
DriverSecondary <channel>
Switches from the primary driver to the secondary driver on the
specified channel.
<channel>
The number of the channel (1 through 4) that is being
switched from its primary to secondary driver.
DriverToggle <channel>
Switches from the current driver to the one not being used on the
specified channel.
<channel>
1
1
1
2-10
The number of the channel (1 through 4) that is being
switched from one driver to another.
Setting up direct driver communications
Switching drivers automatically
To switch drivers automatically, create an event in the Events editor.
In the Action field of the Events editor, type a driver command as
the action that will be triggered when an expression results to true.
In the Expression field, create an expression that will trigger the
action.
Example: An event for switching drivers
In the Events editor, use the following:
Action
DriverToggle 1
Expression
comm_err(tag1)
where tag1 is a tag that is configured with a node on channel 1.
When the expression evaluates to true, the action is triggered.
Switching drivers manually
To switch drivers manually, operators must have a way to issue a
driver command. Possible methods are:
creating a button and specifying one of the driver commands as
the press action. When the operator activates the button, the
driver on the specified channel is switched.
displaying a command line. When the operator enters a driver
command on the command line, the driver on the specified
channel is switched.
1
1
2-11 1
Setting up direct driver communications
Creating a node
A node allows you to assign a logical name and an address to each
programmable controller that RSView32 will communicate with.
Each programmable controller is then referred to throughout
RSView32 by this name. The node name carries all its configuration
information, so attributes such as type of programmable controller,
station number, and network type need not be repeated.
Before you can configure a device node, you must set up
communication channels. For details, see “Configuring channels” on
page 2-6.
To create a node:
1. In the Project Manager, open the System folder.
2. Open the Node editor by doing one of the following:
double-click the Node icon
right-click the Node icon and then click Show
1
1
1
2-12
Setting up direct driver communications
3. Fill in the following information for each node:
Data Source
Select Direct Driver.
For details about the OPC Server and DDE Server data sources,
see Chapter 3, Setting up OPC and DDE communications.
Name
Type a name of your choice up to 40 characters long. This name
represents the programmable controller. The name can have upper
and lower case letters, numbers, dashes, and underscores. Spaces
are not permitted.
Enabled
Normally nodes are enabled, allowing collection of values from
the programmable controller. However, during setup or
troubleshooting you might want to disable a node to prevent
communication timeouts or invalid data. When a node is disabled,
tag values can still be read and written, but the values are read
from and written to the value table instead of the programmable
controller.
When a tag uses a disabled node at runtime, the tag’s state will
change from valid to disabled. A tag’s state can be seen by viewing
the tag in the tag monitor.
To disable nodes, clear the Enabled check box.
You can also enable and disable nodes at runtime, using the
NodeEnable and NodeDisable commands. For more information
see Appendix A, RSView32 commands.
Channel
Select the channel number on which this node resides.
Station
Type the station address of the programmable controller. For
addressing syntax, see Appendix E, Station addressing for nodes
connecting to Allen-Bradley devices.
1
1
2-13 1
Setting up direct driver communications
If RSLinx 2.0 or later is installed and running on your computer,
click the ... button next to the Station field to open the RSWho
window that displays all active PLC stations for the selected
channel. When you select a station from the RSWho window, the
Station and Type fields are filled in automatically. RSView32
substitutes PLC-5 (Enhanced) for all PLC-5X series device types.
Change the entry in the Type field to PLC-5 if you are using the
PLC-5/10, 5/12, 5/15, or 5/25.
For the SOFT5 driver, enter the UNC name of the SoftLogix 5
controller without the backslashes. For example, if the UNC
computer name is \\ORION, type ORION. The computer name
must be 8 characters or less.
For SoftLogix 5 controllers using the AB_ETH driver, enter the
controller’s IP address.
Type
Select the type of device you are using.
For this device type
Select
PLC-2X
PLC-2
PLC-3X
PLC-3
PLC-5/10, PLC-5/12, PLC-5/15, PLC-5/25
PLC-5
PLC-5/11, PLC-5/20, PLC-5/30, PLC-5/40, PLC-5/60,
PLC-5/80
PLC-5 (Enhanced)
SLC 5, SLC 5/01Z, SLC 5/02Z, SLC 5/03Z (OS 300)
SLC 5
SLC 5/03 (OS 301), SLC 5/04Z, SLC 5/05
SLC 5 (Enhanced)
SoftLogix 5
SoftLogix 5
To communicate with a SoftLogix 5 device you must use an
RSLinx driver and a TCP/IP channel.
Timeout
Type the number of seconds you want RSView32 to wait before
reporting a communication error. A timeout period of three
seconds is usually enough.
1
1
1
2-14
Setting up direct driver communications
4. Click Accept to save the node configuration.
5. When you finish configuring nodes, click Close.
Changing node information at runtime
To permanently change a node’s station number at runtime, use the
NodeSwitch command. This command allows you to set up
node-level redundancy. That is, if the programmable controller that a
node is pointing to fails, you can immediately switch to another
programmable controller.
NodeSwitch <node name> <station>
<node name> The name of the node that you want to change to
another programmable controller address.
<station>
For device nodes, the physical address for the
programmable controller you want to change to.
When you use the NodeSwitch command to change a node’s
address, the change appears in the Node editor’s spreadsheet. If the
Node editor is open when you use the command, the change will not
appear until you have refreshed the display by closing and
re-opening the editor.
You can also enable and disable nodes at runtime, using the
NodeEnable and NodeDisable commands. For more information see
Appendix A, RSView32 commands.
Scanning for new tag values
When your RSView32 project is running, it must periodically update
its tag values in the value table. This is done by scanning.
For projects communicating through direct drivers, values are
updated by scanning the programmable controller address at the
foreground and background scan rates specified by the scan class.
1
1
2-15 1
Setting up direct driver communications
RSView32 scan classes
Any tag that communicates with Allen-Bradley or SoftLogix 5
programmable controllers through direct drivers must be assigned to
an RSView32 scan class. Each tag can then be assigned different
foreground and background scanning periods. In this way, you
determine how often a tag value is updated.
A scan class has two scan periods: the foreground period and the
background period. The foreground period applies to graphic
displays and the tag monitor. The background period applies to any
component that performs a continual background activity, such as
derived tags, events, alarms, and data log.
If the same tag is used by both a foreground and background
component, the tag is scanned at the faster period. If a value is not
required by a foreground or background component, its address is
not scanned, greatly reducing system overhead.
Guidelines for configuring scan classes
Set foreground scan periods to be shorter than or equal to
background scan periods.
A scan period of zero means scan as quickly as possible. You can
set foreground scan periods to zero, but never set background
scan periods to zero. For foreground periods, using zero is not
recommended because this setting can result in so much traffic
that overall system communication slows down.
Set scan periods for optimal efficiency. Specify a frequent scan rate
for tags representing fast-moving devices and a less frequent scan
rate for tags representing devices that change less often.
This approach optimizes system performance, providing
high-speed scanning where required and using less frequent
scanning, which saves system resources, where acceptable.
Set the scan period to match the expected rate of change for the
tag’s data. For example, if you scan every five seconds for a change
of state that occurs once an hour, the system is needlessly
burdened. Conversely, if you scan too slowly, the system cannot
monitor value changes that might occur between scans.
1
1
1
2-16
Setting up direct driver communications
To configure a scan class:
1. In the Project Manager, open the System folder.
2. Open the Scan Class editor by doing one of the following:
double-click the Scan Class icon
right-click the Scan Class icon and then click Show
3. Select a scan class and fill in a foreground and background period.
The period specifies, in seconds, how often the programmable
controller address is scanned when its value is required by a
foreground or background component. The foreground period
applies to graphic displays and the tag monitor. The background
period applies to any component that performs a continual
background activity, such as derived tags, events, alarms, and data
log.
To specify a period, type a number. You can use fractional
seconds. For example, if you type .6 the address is scanned every
six tenths of a second.
4. To save the configuration for a scan class without closing the
editor, select another scan class.
5. When you finish configuring scan classes, click OK.
1
1
2-17 1
Setting up direct driver communications
Monitoring communications
Use any of the following methods to monitor communications:
Activities—In the Activity Log Setup editor, ensure
communication errors, warnings, and remarks are enabled and are
set up to log to the log file and activity bar. At runtime,
information appears in the log file and activity bar, indicating any
problems.
Communication status—Ensure communication status is turned
on, otherwise communication errors will not be logged to the
activity log file or activity bar (even if they have been configured
to do so in the Activity Log Setup editor). By default,
communication status is turned off until you run the project. To
turn communication status on, use the ComStatusOn command.
Tag monitor—Use the tag monitor to check the communication
status for a device tag. The states are:
Disabled if the node has been disabled in the Node editor or
disabled using the NodeDisable command
Error if RSView32 has tried to acquire a value but could not
because of some kind of communication error, such as a node
not being available or a DDE server not running
Stale if the tag value has been acquired before but does not have
an updated value
Uninitialized if the value has never been acquired
Valid if RSView32 has a valid value for the tag
None if there is a problem with the tag definition such as it is
not a valid tag type or if the tag database has been accessed with
a third-party tool such as Microsoft AccessZ. If the underlying
tag type is valid, editing and saving the tag and then
redisplaying the tag monitor will fix the problem.
System\com tags—Use the system\com tags to receive a more
detailed error message. If the tag monitor reports an error, move
to an empty cell in the tag monitor, type system\com* and, when
the dialog box appears, click Select All. For a complete list of
system\com tags, see Appendix B, System tags.
1
1
1
2-18
Setting up direct driver communications
Developing your project without a communication network
You can develop your RSView32 project to use direct drivers
without having an Allen-Bradley network or programmable
controller. To do so, use the None Loaded driver type.
1. Open the Channel editor.
2. Select a channel and, in the Network Type field, select a network
for the channel.
3. In the Primary Communication Driver field, click None Loaded.
Using the None Loaded driver type allows you to add or change
tags without causing communication errors.
To set a configured channel’s network type to None Loaded, first
issue the ComStatusOff command. Because setting a configured
channel’s network type to None Loaded deletes all the comstatus
system tags from the tag database, you cannot set a configured
channel’s network type to None Loaded if the ComStatusOn
command has been issued.
4. Disable the node by clicking the Enabled check box to deselect it.
1
1
2-19 1
3
Setting up OPC and DDE
communications
OPC and DDE connections allow you to communicate with a wide
range of local and remote devices.
OPC is OLE for Process Control, used to connect RSView32 to
communication devices via vendor-specific OPC servers. DDE is
Dynamic Data Exchange, used with external DDE servers such as
the Rockwell Software RSServerZ products, or other third-party
servers, to connect RSView32 to communication devices. RSView32
supports the OPC 1.0a specification.
If you will be connecting to communication devices using direct
drivers, see Chapter 2, Setting up direct driver communications.
OPC servers provide a way to connect an RSView32 station (the
OPC client) to:
communication devices, using RSLinx as an OPC server
For details, see the topics in this chapter.
third-party communication devices, using vendor-specific OPC
servers (such as Siemens or ModiconX)
For details, see the topics in this chapter.
1
1
3-1 1
Setting up OPC and DDE communications
another RSView32 station acting as a remote OPC server on a
network. By connecting an RSView32 station set up as an OPC
client to another RSView32 station set up as an OPC server, you
achieve peer-to-peer communication of tag values across a
network.
For information about setting up RSView32 OPC peer-to-peer
communication on a network, see “Using OPC for peer-to-peer
network communications” on page 17-5.
a third-party application with OPC server support, either on the
same computer or on a network
For details about connecting to third-party applications on the
same computer, see “Sharing tag values locally” on page 16-24.
For information about connecting to third-party applications on a
network, see “Connecting to RSLinx Gateway as a remote OPC
server” on page 17-10.
DDE servers provide a way to connect an RSView32 station (the
DDE client) to:
communication devices such as Siemens or Modicon
For details, see the topics in this chapter.
a third-party DDE server such as Microsoft Excel or Visual BasicX
For details about connecting to third-party applications on the
same computer, see “Sharing tag values locally” on page 16-24.
1
1
1
3-2
Setting up OPC and DDE communications
Overview of OPC communications
The following illustration shows the different ways RSView32 can
use OPC for communications.
Computer running RSView32
RSView32
RSView32 OPC client module
Third-party
application
with OPC
server
support
OPC network link via DCOM
Remote
computer –
RSLinx
Gateway
(OPC server)
Remote
computer –
RSView32
OPC server
Remote
computer –
3rd-party
OPC server
RSServer
PLC network
Non-Allen-Bradley
programmable
controller
Third-party
OPC server
Network or
third-party
communication
link
Non-AllenBradley device
1
1
3-3 1
Setting up OPC and DDE communications
Overview of DDE communications
The following illustration shows the different ways RSView32 can
use DDE for communications.
Computer running RSView32
RSView32
RSView32 DDE module
CF_Text or
XLTable
Third-party
application,
such as
Microsoft
Excel
AdvanceDDEZ
RSServer
CF_Text or
AdvanceDDE*
Third-party
DDE server
PLC network
Modicon,
GE, Siemens,
or other
programmable
controller
Network or
communication
link
Other
non-AllenBradley device
* The third-party server can use AdvanceDDE format if
the server uses the Rockwell Software server toolkit.
1
1
1
3-4
Setting up OPC and DDE communications
Summary of steps
The instructions below summarize the steps for setting up RSView32
as an OPC or DDE client.
1. Start the OPC or DDE server.
2. Start RSView32 and create or open a project (the client).
3. In the Node editor, create nodes for each OPC or DDE server
and/or topic you wish to communicate with. In the node’s Data
Source field, select OPC Server or DDE Server.
For details, see “Creating an OPC node” below or “Creating a
DDE node” on page 3-11.
4. In the Tag Database editor, create tags and select Device as the
data source and assign the nodes that you have created.
For details, see Chapter 4, Creating tags.
Creating an OPC node
An OPC node allows you to assign a logical name, server name, and
update rate for each OPC server you want to communicate with.
The OPC node name can then be used throughout RSView32.
To create an OPC node:
1. In the Project Manager, open the System folder.
2. Open the Node editor by doing one of the following:
double-click the Node icon
right-click the Node icon and then click Show
3. Create a node by filling in the following information:
Data Source
Select OPC Server.
1
1
3-5 1
Setting up OPC and DDE communications
The Tag Database editor does not check addressing syntax for
programmable controllers that communicate through an OPC
server. If the syntax is invalid, an error will be generated at
runtime.
For details about the DDE Server data source, see “Creating a
DDE node” on page 3-11. For details about the Direct Driver data
source, see Chapter 2, Setting up direct driver communications.
Name
Type a name of your choice to represent the OPC node. The name
can be up to 40 characters long and can have upper and lower case
letters, numbers, dashes, and underscores. Spaces are not
permitted.
Enabled
Normally nodes are enabled, allowing collection of values from
the device. However, during setup or troubleshooting you might
want to disable a node to prevent communication timeouts or
invalid data. When a node is disabled, tag values can still be read
and written, but the values are read from and written to the value
table instead of the device.
When a tag uses a disabled node at runtime, the tag’s state will
change from valid to disabled. A tag’s state can be seen by viewing
the tag in the tag monitor.
To disable nodes, clear the Enabled check box.
You can also enable and disable nodes at runtime, using the
NodeEnable and NodeDisable commands. For more information
see Appendix A, RSView32 commands.
1
1
1
3-6
Setting up OPC and DDE communications
Server
Do one of the following:
Click ... beside the Name field and select a server from the list
of registered servers. RSView32 fills in the remaining Server
fields.
To use another RSView32 station as your OPC server, select
RSI.RSView32OPCTagServer. Select Remote as the Type, and
specify the Server Computer Name or Address as described
next.
Fill in the Server fields manually. You can fill in the fields for an
OPC server that has not been installed yet and install the server
later.
Name
Type the name of the OPC server that RSView32 will
communicate with, typically in this format:
<Vendor>.<DriverName>.<Version>
If the OPC server is RSView32 or RSLinx, you don’t need to
specify a version number. For RSLinx, you don’t need to
specify the vendor name, either.
Type
Select the OPC server type:
In-Process if the server is a .dll file.
Local if the server is an .exe file running on the same
computer as the OPC client.
Remote if the server is an .exe file running on a different
computer connected to the OPC client computer via a
network.
1
1
3-7 1
Setting up OPC and DDE communications
Server Computer Name or Address
If the OPC server is remote, type the server computer’s name
or address, or click ... and select a server computer from the list
that appears.
You can use these formats to specify the name or address:
Use this syntax
For this format
Example
\\ComputerName
UNC (Universal Naming
Convention)
\\DTB1
ComputerName.Domain.com
DNS (Domain Name
System)
DTB1.NET2.COM
XXX.XX.XXX.XXX
Raw TCP/IP address
134.87.167.148
You set up the computer’s name or address in the Windows
Control Panel, as described in “Identifying the RSView32
server computer” on page 17-6.
For more information about IP (Internet Protocol) addresses,
see page E-8.
Access Path
Use of this field is optional.
Use the access path field in the Node editor when:
you want to be able to switch between PLCs using the
NodeSwitch command for node redundancy
you want all tags in RSView32 to have the same update rate
You must leave the access path blank if you want to use different
update rates for different tags in the tag database. If you leave the
access path blank in the Node editor, specify the access path in the
Tag Database editor’s tag address field.
For information about the syntax for the access path, see your
OPC server documentation.
If you use this field, and you are communicating with RSView32
using OPC, the access path is the name of the current project on
the server.
1
1
1
3-8
Setting up OPC and DDE communications
If you use this field, and you are communicating with an RSLinx
OPC server, the access path is the name of a DDE/OPC topic on
the server. If you leave the access path blank, you must specify the
DDE/OPC topic as part of the tag’s address when you create the
tag using the Tag Database editor.
Update Rate
Specify the fastest rate at which the OPC server sends data to the
OPC client. The default is every 1 second.
The rate that the OPC server uses may be slower than the rate you
specify. Type 0 to specify that the server use the fastest possible
rate.
If the OPC server’s access path is a DDE/OPC topic, the update
rate should not be faster than the topic poll rate.
4. Click Accept to save the node configuration.
5. When you finish configuring nodes, click Close.
Example: Configuring an OPC node
The following example describes how to create a node to connect to
a local OPC server using RSLinx.
Server Name: RSLinx OPC Server or RSLinx Remote OPC Server.
If you are using RSLinx 2.0, the driver name is
RSLinx OPC Server. If you are using RSLinx 2.1, the
driver name is RSLinx Remote OPC Server. You
don’t need to specify a vendor or version number.
Access Path:
PLC_HVAC1
The access path is the DDE/OPC topic name in
RSLinx.
1
1
3-9 1
Setting up OPC and DDE communications
The figure below shows how the node looks in the Node editor.
The server
name appears
in the
spreadsheet’s
Station or
Server column.
Some columns do not apply to OPC nodes
and are left blank.
Once you have created the node, assign it to a tag in the Tag
Database editor. The address tells RSView32 where in the node to get
the data.
Address:
N7:12
The PLC-5 programmable controller called
PLC_HVAC1 has been previously set up as a
DDE/OPC topic in RSLinx; N7:12 is the address in
the PLC-5/250.
If you don’t include the Access Path when
configuring the node, you can enter the tag’s address
as [PLC_HVAC1]N7:12.
1
1
1
3-10
Setting up OPC and DDE communications
The figure below shows how the tag looks in the Tag editor.
Creating a DDE node
A DDE node allows you to assign a logical name for each DDE
application and topic you wish to communicate with. The DDE
node name can then be used throughout RSView32.
To create a DDE node:
1. In the Project Manager, open the System folder.
2. Open the Node editor by doing one of the following:
double-click the Node icon
right-click the Node icon and then click Show
3. Create a node by filling in the following information:
Data Source
Select DDE Server.
The Tag Database editor does not check addressing syntax for
programmable controllers that communicate through a DDE
server. If the syntax is invalid, an error will be generated at
runtime.
1
1
3-11 1
Setting up OPC and DDE communications
For details about the OPC Server data source, see “Creating an
OPC node” on page 3-5. For details about the Direct Driver data
source, see Chapter 2, Setting up direct driver communications.
Name
Type a name of your choice to represent the DDE node. The
name can be up to 40 characters long and can have upper and
lower case letters, numbers, dashes, and underscores. Spaces are
not permitted.
Enabled
Normally nodes are enabled, allowing collection of values from
the device. However, during setup or troubleshooting you might
want to disable a node to prevent communication timeouts or
invalid data. When a node is disabled, tag values can still be read
and written, but the values are read from and written to the value
table instead of the device.
When a tag uses a disabled node at runtime, the tag’s state will
change from valid to disabled. A tag’s state can be seen by viewing
the tag in the tag monitor.
To disable nodes, clear the Enabled check box.
You can also enable and disable nodes at runtime, using the
NodeEnable and NodeDisable commands. For more information
see Appendix A, RSView32 commands.
Application
Type the name of the DDE server or other Windows application
that RSView32 will communicate with. For example, if Microsoft
Excel is the server, type Excel.
Topic
Type the subject of the DDE communication. For example, if
Excel is the application, the topic is a particular Excel spreadsheet.
4. Click Accept to save the node configuration.
5. When you finish configuring nodes, click Close.
1
1
1
3-12
Setting up OPC and DDE communications
Example: Configuring a DDE node
The following example describes how to create a node to connect to
a GE programmable controller using the RSServer for GE Series 90
protocol.
Application:
SNPWIN
The application name is the server’s name.
Topic:
cpuid[@connection_ID][:poll_rate]
The topic name is made up of a CPU ID string, an
optional connection ID string (preceded by the @
character) and an optional poll rate (preceded by the :
character).
The figure below shows how the node looks in the Node editor. The
CPU ID is CPUID1, the connection ID is PORT5, and the poll rate
is 10.
The application
and topic
appear in the
spreadsheet’s
Station or
Server column,
separated by a
vertical bar.
Some columns do not apply to DDE nodes
and are left blank.
1
1
3-13 1
Setting up OPC and DDE communications
Changing node information at runtime
To change an OPC node’s server name and access path or a DDE
node’s application and topic at runtime, use the NodeSwitch
command. This command allows you to set up node-level
redundancy. That is, if the server that a node is pointing to fails, you
can immediately switch to another server.
NodeSwitch <node name> <parameter>
<node name> The name of the node that you want to change to
another server.
<parameter> One of the following:
<\\computer
name\server
name[|access
path]>
For OPC servers, the computer name, server name,
and access path (if in use) for the OPC server you
want to switch to. Separate the access path from the
server name with the | character.
<application
|topic>
For DDE servers, the application and topic, separated
by the | character, for the DDE server you want to
switch to.
When you use the NodeSwitch command to change a node’s server
information, the change appears in the Node editor’s spreadsheet. If
the Node editor is open when you use the command, the change will
not appear until you close and re-open the editor.
For more information about the NodeSwitch command, see
Appendix A, RSView32 commands, or see Help.
You can also enable and disable nodes at runtime, using the
NodeEnable and NodeDisable commands. For more information see
Appendix A, RSView32 commands.
1
1
1
3-14
Setting up OPC and DDE communications
Scanning for new tag values
When your RSView32 project is running, it must periodically update
its tag values in the value table.
For projects using OPC, values are updated by the OPC server at
the rate specified in the server product. The update rate you specify
in the Node editor is the requested data rate. The server uses this rate
to determine the fastest rate at which to notify your RSView32
project (the OPC client) of tag value changes, if there are any
changes. For more details about setting the poll rate, see your server
documentation.
For projects using DDE, values are updated by the server at the rate
specified in the server product. When the server detects a change, it
provides the changed value to RSView32. For more details about
setting the poll rate, see your server documentation.
Scan class rates have no effect on DDE or OPC communications.
They affect only direct driver communications.
1
1
3-15 1
4
Creating tags
This chapter describes:
tags and the tag database
the importance of organizing tags
how to create analog, digital, and string tags
Tags and the tag database
In the tag database, you define the data you want RSView32 to
monitor. Each entry in the database is called a tag. A tag is a logical
name for a variable in a device or in local memory (RAM). For
example, a tag can represent a process variable in a programmable
controller.
The current value of a tag, when required, is updated from the device
it is connected to and stored in computer memory—referred to as
the value table—so it is immediately accessible to all parts of
RSView32. For example, graphic displays use tag values to control
animation or update a trend, alarm monitoring compares current tag
values to pre-defined limits, and data logging stores tag values to
create a historical record.
1
1
4-1 1
Creating tags
Tag types
RSView32 uses the following types of tags:
Tag
Type of data stored
Analog
Range of values.
These tags can represent variable states such as temperature or the
position of rotary controls.
Digital
0 or 1.
These tags can represent devices that can only be on or off, such as
switches, contacts, and relays.
String
ASCII string, series of characters, or whole words (maximum of 82
characters).
These tags can represent devices that use text, such as a bar code
scanner which uses an alphanumeric product code.
System
Information generated while the system is running, including alarm
information, communication status, system time and date, and so on.
RSView32 creates system tags when it creates a project. The system
tags are stored in the folder called “system” in the tag database. You
cannot edit system tags. You can use system tags anywhere you would
use any other type of tag.
Data sources
When defining an analog, digital, or string tag, you must specify a
data source. The data source determines whether the tag receives its
values externally or internally.
Device
A tag with Device as its data source receives its data from a source
external to RSView32. The data can come from a direct
programmable controller driver or from an OPC or DDE server.
Tags with Device as the data source count toward the total tag limit
you purchased (150, 300, 1,500, and so on).
1
1
1
4-2
Creating tags
Memory
A tag with Memory as its data source receives its data from the
RSView32 internal value table. A memory tag can be used to store
values internally. Tags with Memory as the data source do not count
toward the total tag limit.
Organizing tags
Organizing tags makes database creation faster and simpler. To
organize tags:
establish naming conventions
Naming conventions enable you and operators to use the
RSView32 wildcards most effectively when searching for and
displaying tags during development and runtime.
use folders to group related tags
Naming tags
Tag names can be up to 40 characters long. If you create a folder, the
folder name becomes part of the tag name.
The tag name can contain the following characters:
A to Z
0 to 9
underscore (_) and dash (-)
The tag name can be mixed case. Tag names preserve upper and
lower case for readability but are not case sensitive. For example, the
tag name MixerValve1 is the same as mixervalve1.
1
1
4-3 1
Creating tags
When a tag name starts with a number or contains a dash, enclose the
name in braces { } when you use it in an expression, for example,
{N33-0}. Also use braces when using wildcards to represent multiple
tags in an expression, for example, {alarm*}. For more information
about using tags in expressions see Chapter 14, Creating expressions.
Using folders to group tags
To organize tags, create a folder and include tags that are related to
one another. To separate the folder name from the rest of the tag
name, use a backslash (\). For example, tags in the folder called Pump
would start with Pump\. For greater organization, you can nest
folders. For example, you can organize the tag database first by area,
then by machines in the area, and finally by devices in each machine.
The result might be Area1\Machine1\Pump.
The tag database editor
To open the Tag Database editor:
1. In the Project Manager, open the System folder.
2. Open the Tag Database editor by doing one of the following:
double-click the Tag Database icon
right-click the Tag Database icon and then click Show
1
1
1
4-4
Creating tags
The Tag Database editor has the following parts: form, query box,
folder hierarchy, and spreadsheet. Each part is described on the
following pages.
Form
Query
Box
Folder
Hierarchy
Spreadsheet
Using the Accept and Discard buttons
When you enter information, the Prev and Next buttons change to
Accept and Discard buttons. Click Accept to save tag and alarm
information. Click Discard to cancel changes to a tag.
1
1
4-5 1
Creating tags
Using the form
Use the form to create a tag. In the upper part of the form, define the
basic characteristics of the tag, such as tag name, type, security, and
specifics related to the tag type. In the lower part of the form, define
the data source (where the tag’s values will come from).
Select the Alarm check box to define alarm conditions for an analog
or digital tag. To edit alarms once they have been defined, click the
Alarm button.
Using the query box
Use the query box to select the tags you want displayed in the
spreadsheet. This allows you to edit tags in different folders without
browsing the folder hierarchy. You can:
select a single tag by typing the tag name
select multiple tags by typing wildcards. The wildcards are:
This character
Does this
?
Matches any single character.
*
Matches any number of characters, including the
backslash (\) character.
Use this wildcard by itself to display all the tags in the tag
database.
When you do searches, remember that the backslash in a folder
name counts as one character in the tag name.
1
1
1
4-6
Creating tags
Using the folder hierarchy
The hierarchy and spreadsheet work together. The hierarchy shows
the tag folders and the spreadsheet shows the tags within the folders.
A folder icon known as root is always present in the hierarchy
window, at the top of the folder hierarchy. This folder contains all
the tag folders you and RSView32 create. For example, the system
folder holds the system tags that come with RSView32. For a
complete list of the system tags, display the contents of the folder or
see Appendix B, System tags.
You can nest folders. If a folder has a plus (+) sign, it contains one or
more folders. If a folder is blank, it does not contain any other
folders.
This folder contains one or more folders.
This folder does not contain another folder.
Creating a folder
1. Click New Folder on the Edit menu or click the Create Folder
button on the toolbar.
Create Folder
2. Type the folder name.
1
1
4-7 1
Creating tags
3. Click OK.
The new folder appears in the hierarchy window.
Opening a folder
When you open a folder, its contents are displayed in the
spreadsheet.
To open a folder, do one of the following:
double-click the folder
select the folder and press Enter
To open multiple folders:
1. Select the folders by doing one of the following:
click a folder and then drag the mouse up or down
click a folder and Shift-click other folders immediately above or
below the first selected folder
click a folder and Ctrl-click other folders anywhere in the
hierarchy
2. Press Enter.
The tags in the selected folders are displayed in the spreadsheet.
1
1
1
4-8
Creating tags
Adding tags to a folder
Once you have created a folder, you can add tags to it.
1. Select a folder in the folder hierarchy.
The folder name is displayed in the Name field of the form.
2. After the backslash (\), type the new tag name.
Nesting a folder
1. Select a folder in the folder hierarchy.
2. Click New Folder on the Edit menu or click the Create Folder
button on the toolbar.
Create Folder
3. Type a backslash (\) followed by the new folder name.
4. Click OK.
When you nest folders, remember that the backslash in a folder name
counts as one character in the tag name.
1
1
4-9 1
Creating tags
To view a series of nested folders, resize the hierarchy box. To resize
it, place the cursor over the right border of the box until it changes
to a double arrow. Drag the border to the required size.
Duplicating a folder
When you duplicate a folder, all the tags in the folder are
automatically given the new folder name. If the folder contains
folders, those folders are also duplicated.
IMPORTANT Be sure to choose Duplicate Folder rather than Duplicate.
Duplicate only duplicates individual tags.
To duplicate a folder and its tags:
1. Select the folder in the hierarchy.
Duplicate
Tag Folder
2. Click Duplicate Folder on the Edit menu or click the Duplicate
Tag Folder button on the toolbar.
3. In the To field, type the new folder name.
4. Click OK.
1
1
1
4-10
Creating tags
Deleting a folder
1. Select one or more folders in the hierarchy.
Delete Folder
2. Click Delete Folder on the Edit menu or click the Delete Folder
button on the toolbar.
Using the spreadsheet
Use the spreadsheet to view tags. Use the query box or folder
hierarchy to select the tags you want to view.
Moving through the spreadsheet
To scroll through the spreadsheet rows, do one of the following:
use the Prev or Next buttons in the form area
use the up arrow and down arrow keys
use the scroll bars on the spreadsheet
To select a row, click anywhere in the row or click the row number.
Resizing columns and rows
To resize a column or row:
1. Place the cursor over the division between the column or row, in
the top or side border, until it changes to a double arrow.
2. Drag the column or row to the required size.
Adding a tag
To add a tag, do one of the following:
click the New button in the forms area. This inserts a new row
above the highlighted row.
Insert Row
click Insert Row on the Edit menu or click the Insert Row button
on the toolbar. This inserts a new row above the highlighted row.
1
1
4-11 1
Creating tags
Duplicating a tag
1. Select the tag you want to duplicate.
Duplicate
2. Click Duplicate on the Edit menu or click the Duplicate button
on the toolbar.
A new row is inserted below the highlighted row. The new row
contains all the same information except the tag name.
3. In the Tag Name field, type the name for the new tag.
4. Click Accept.
Editing a tag
You can edit all parts of a tag except the tag name and tag type.
1. Select the tag you want to edit.
The details of the tag appear in the form area.
2. Edit any details except the tag name or type.
Deleting a tag
Delete tags carefully. Once you click the Delete button, the tag is
deleted. There is no confirmation message and you cannot undo the
deletion.
1. Select the tag you want to delete.
Delete
2. Click Delete on the the Edit menu or click the Delete button on
the toolbar.
1
1
1
4-12
Creating tags
Configuring tag type
The topics below describe how to complete the fields for analog,
digital, and string tag types. For a description of how to complete the
Data Source fields, see “Specifying a data source” on page 4-18. 3.
Configuring an analog tag
1. If the tag is part of a folder, select that folder in the folder
hierarchy. The folder name appears in the Name field and is the
first part of the tag name.
2. Type a tag name. If the tag is part of a folder, type the name after
the backslash (\).
3. For Type, select Analog.
4. Fill in the fields as outlined below:
Security
To restrict access to this tag, select a security code. If access is
restricted, operators cannot change a tag value without the proper
security code. For detailed information about security, see
Chapter 10, Adding security.
Description
Type a description of this tag, up to 128 characters long.
1
1
4-13 1
Creating tags
Minimum and Maximum
Type the minimum and maximum values that can be written to the
programmable controller or server. These values do not affect
what is read from the programmable controller or server. For
example, if you specify a minimum of 0 and a maximum of 100,
RSView32 would be able to read a value of 200 from a PLC and
store it in the value table, but would not be able to write this value
to the PLC.
The range between the minimum and maximum values cannot
exceed the maximum floating point value (3.402823E38).
Scale and Offset
Type a number. For the scale, do not use 0. To disable the scale,
type 1. To disable the offset, type 0.
The scale and offset modify the “raw data” that comes from and
goes to the programmable controller before it is saved in the value
table. The scale and offset also modify the value specified in
RSView32 before it is written to the programmable controller. The
scale is a multiplication factor—the value from the PLC is
multiplied by the scale. The offset is a fixed value—after the value
from the PLC is multiplied by the scale, the offset amount is
added. This formula shows the relationship between the PLC
value and the amount stored in the RSView32 value table:
RSView32 value = (PLC value scale) + offset
IMPORTANT Values from the programmable controller are first scaled, then
added to the offset. When a value is written to the programmable
controller, the process is reversed: the offset is subtracted and the
scale is used for division. This ensures that the correct, unchanged
value is sent to the programmable controller.
Units
Type a text label, for display only, up to 20 characters long. This
specifies how the tag value is measured (for example, gallon, PSI,
min, sec).
1
1
1
4-14
Creating tags
Data Type
The data types are:
Data type
Description
Range
Default
Depends on the data source
and node type:
See below.
If Device is the data source,
for direct driver nodes
RSView32 matches the data
format specified by the
address, for example,
N7:0=Integer, F8:0=Floating
Point.
Do not use Default for OPC or
DDE nodes, as this might
produce unexpected results.
If Memory is the data source,
Default is Floating Point.
Unsigned Integer
Unsigned 16-bit integer
0 to 65,535
Integer
Signed 16-bit integer
-32,768 to 32,767
Long Integer
Signed 32-bit integer
-2,147,483,648 to
-2,147,483,647
Floating Point
Single-precision (32-bit)
floating point
-3.402823E+38 to
-1.175494E-38,
0,
1.175494E-38 to
3.402823E+38
Byte
Unsigned 8-bit integer
0 to 255
3-Digit BCD
3-digit binary-coded decimal
0 to 999
4-Digit BCD
4-digit binary-coded decimal
0 to 9,999
For tags with Device as the data source, select the data type that
matches the format of the data stored in the programmable
controller or Windows application. If you are using direct driver
nodes, use the Default data type to automatically match the data
format specified by the address.
If you are using OPC or DDE nodes, do not use the Default data
type because the default might not be as expected.
1
1
4-15 1
Creating tags
For tags with Memory as the data source, select the data type that
matches the format of the data you will store in the tag. Choosing
Default is the same as choosing Floating Point.
IMPORTANT For a tag with a Long Integer data type, if the minimum, maximum,
scale, offset, or initial value is used with a decimal point,
RSView32 stores the value in floating point format. This means
that the maximum value for the tag is 16,777,216, which is the
maximum integer value for single-precision floating point numbers.
Configuring a digital tag
1. If the tag is part of a folder, select the folder in the folder
hierarchy. The folder name appears in the Name field and is the
first part of the tag name.
2. Type a tag name. If the tag is part of a folder, type the name after
the backslash (\).
3. For Type, select Digital.
1
1
1
4-16
Creating tags
4. Fill in the fields as outlined below:
Security
To restrict access to this tag, select a security code. If access is
restricted, operators cannot change a tag value without the proper
security code. For detailed information about security, see
Chapter 10, Adding security.
Description
Type a description of this tag, up to 128 characters long.
Off Label and On Label
Type text up to 20 characters long that describes the off state
(value = 0) and on state (value = 1) of the tag. The off and on labels
must be different. One or the other, but not both, can be blank.
Configuring a string tag
1. If the tag is part of a folder, select the folder in the folder
hierarchy. The folder name appears in the Name field and is the
first part of the tag name.
2. Type a tag name. If the tag is part of a folder, type the name after
the backslash (\).
3. For Type, select String.
1
1
4-17 1
Creating tags
4. Fill in the fields as outlined below:
Security
To restrict access to this tag, select a security code. If access is
restricted, operators cannot change a tag value without the proper
security code. For details, see Chapter 10, Adding security.
Description
Type a description of this tag, up to 128 characters long.
Length
Type a number between 1 and 82 to specify the length of the
string tag in characters. RSView32 will accept only a length that is
a multiple of the size of the Allen-Bradley programmable
controller data element you are addressing.
Specifying a data source
The following topics describe how to complete the Data Source
fields. For details about configuring analog, digital, and string tag
types, see “Configuring tag type” on page 4-13.
Specifying device as the data source
A tag with device as its data source receives its data from a source
external to RSView32. The data can come from: 5.
6.
Allen-Bradley or SoftLogix 5 programmable controllers through
RSLinx direct drivers
programmable controllers through an OPC or DDE server
another Windows program through an OPC or DDE server
1
1
1
4-18
Creating tags
To specify device as the data source:
1. Click Device.
2. Supply a node name by doing one of the following:
type a node name
double-click in the Node Name field to add a new node
click
to open a selection list and select a node name
3. If you are connecting to Allen-Bradley or SoftLogix 5 devices
through direct drivers, select a scan class.
For more information about scan classes, see page 2-16.
4. In the Address field, do one of the following:
to connect to Allen-Bradley and SoftLogix 5 devices, specify
the physical memory location in the programmable controller.
The address syntax depends on the programmable controller.
For addressing syntax, see Appendix D, Addressing syntax for
Allen-Bradley programmable controllers.
to connect to other devices, specify the name of the tag in the
OPC server or specify the DDE item. If you are using an OPC
node, click the Browse button to select the OPC tag address. If
you are using a DDE node, the DDE item name and format
depend on the DDE server and are not validated by RSView32.
For more information, see your OPC or DDE server
documentation.
For more information about OPC or DDE see Chapter 3, Setting
up OPC and DDE communications. Also see “Sharing tag values
locally” on page 16-24 and “Using OPC for peer-to-peer network
communications” on page 17-5.
1
1
4-19 1
Creating tags
Specifying memory as the data source
1. Click Memory.
2. In the Initial Value field, type the tag’s starting value.
When you first run a project, a memory tag has the value defined
in the Initial Value field. All subsequent runs of the project use the
tag’s last value before the project stopped. To ensure a memory tag
uses a particular value when the project starts, use the Set or =
(Equal) commands in a startup macro to specify the tag’s value.
The value of a memory tag can also be set using derived tags,
events, or graphic objects.
Other methods for creating tags
In addition to creating tags in the Tag Database editor as described
earlier in this chapter, you can:
create tags in a third-party application and import them into
RSView32
create tags as needed in other RSView32 editors
import tags from a PLC or SLC database
create tags using the RSView32 Object Model and VBA
1
1
1
4-20
Creating tags
Creating tags in a third-party application
You can use a third-party spreadsheet editor such as Microsoft Excel
to create your tags, and then import the tags into RSView32 using
the Database Import & Export Wizard in the RSView32 Tools folder.
When you import tags, they are merged with tags already in the tag
database and any tags with the same name are updated with the new
information.
For more information about the Wizard, see “Using the Database
Import & Export Wizard” on page 4-25.
Creating tags as needed in other RSView32 editors
Any editor that uses tags has access to the tag database. You can
access the database by doing one of the following:
click the Browse button or the Tags button, whichever is available,
to open the Tag Browser
Browse button
Tags button
type a new tag name. When you try to save or close, a message
appears prompting you to create the tag. For example, if you
typed “Tag1” and it did not exist in the tag database, the following
message would appear:
1
1
4-21 1
Creating tags
Using the Tag Browser
When you click a Browse or Tags button, the Tag Browser opens.1.
In the Tag Browser, you can:
select a tag by double-clicking it, or by highlighting it and then
clicking OK
edit a tag by highlighting it and then clicking Edit Tag. The Tag
Editor dialog box opens so you can edit the tag’s definition.
create a new tag by opening the desired folder and clicking New
Tag. The Tag Editor dialog box opens so you can define the tag.
create a new folder by clicking New Folder. The New Folder
dialog box opens so you can create the folder.
import tags from a PLC or SLC database and copy them into the
RSView32 tag database by clicking Other DB. The PLC Database
Browser opens so you can specify the tags to import.
1
1
1
4-22
Creating tags
Importing tags from a PLC database
Button in Tag Browser
DB Browser
Button in Tag
Database editor
To open the PLC Database Browser, click the Other DB button in
the Tag Browser or click the DB Browser button on the toolbar in
the Tag Database editor.
Use the PLC Database Browser to selectively import tags from an
Allen-Bradley PLC database into the RSView32 tag database. Tags
imported in this way are copied into the database—they are not
shared with the source database. This means changes to tags in
RSView32 do not affect the database from which they have been
imported and vice versa.
You can import tags from any of these databases:
legacy PLC databases, created using WINtelligent LOGIC 5Z or
A.I.Z 5, with file extension .dsc
RSLogix 5/500, saved as an external database, with file extension
.ctd
RSLogix 5 internal database, with file extension .rsp
RSLogix 500 internal database, with file extension .rss
RSLogix Frameworks database, with file extension .fma or .fmb
1
1
4-23 1
Creating tags
For PLC and SLC addresses, the PLC Database Browser shows only
addresses that are used in the symbol or address list of the PLC
programming software. For RSLogix Frameworks symbols, you can
import Frameworks global symbols for use with DDE nodes.
To import tags from a PLC database:
1. Specify the data source for the tag by typing the node name and
scan class if the node type is direct driver.
2. In the PLC Database field, type the name and path for the
database you want to import tags from, or click the Browse
button to locate and select the database you want to import tags
from.
The addresses and symbols from the selected database are
displayed in the box below the Filter data entry field.
1
1
1
4-24
Creating tags
3. To filter the tag list so that only certain addresses or symbols are
displayed, type a character string, then click Search. If you want to
search on names only, check the Symbols button so that only
symbol names are displayed. If an address does not have a symbol
name it will not be displayed.
Use the filter if the address or symbol list is too big to display
entirely.
4. Highlight the symbol, or symbols you want to import.
5. In the Put Tags into Folder field, type a folder name if you want
the tags to be in a folder. If the folder does not already exist in the
RSView32 tag database it will be created.
6. Click OK.
The selected symbols are added to the tag database for the current
project and displayed in the tag list. If you have already imported
a particular symbol, you are prompted to change its name if you
want to import it again.
Using the Database Import & Export Wizard
You can also import PLC or SLC databases into RSView32 using the
Database Import & Export Wizard. J
To use the wizard:
1. Click the Windows Start button, point to Programs, Rockwell
Software, RSView32 Tools, and then click Database Import &
Export Wizard.
2. Read the wizard’s Help for details about how to use the wizard.
1
1
4-25 1
Creating tags
Creating tags using the RSView32 Object Model and VBA
You can use the RSView32 Object Model with programming
languages like Visual Basic or VBA to create tags. For more
information about using the RSView32 Object Model, see Help.
Adding alarms to tags
Analog and digital tags can have alarms associated with them. At
runtime, RSView32 scans the tag values in the tag database and
compares them to the limits you set for the tags. If a tag value crosses
a limit, an alarm is triggered.
When a tag has an alarm configured for it, an X appears in the Alm
column of the Tag Database editor’s spreadsheet and the Alarm
button in the editor’s form is highlighted (enabled).
For details about alarms, see Chapter 6, Configuring alarms.
1
1
1
4-26
Creating tags
Logging tag values
Any tag value can be logged. To set up logging, use the Data Log
Setup editor. For details, see Chapter 7, Configuring data logging.
Using the tag monitor
Use the tag monitor to view information about tags, such as
changing tag values and tag status information.
To create a tag monitor, you can:
create a tag monitor object in the Graphic Display editor
create a tag monitor file through the Project Manager
1
1
4-27 1
Creating tags
Creating a tag monitor object
1. Open the Graphic Display editor.
2. Open the Tag Monitor editor by doing one of the following:
on the Objects menu, click Advanced Objects, and then click
Tag Monitor
click
on the Drawing Tools toolbox
The cursor changes to the tag monitor drawing tool:
3. Drag the mouse to create a box the size you want for the tag
monitor.
When you release the mouse, a tag monitor appears. The Graphic
Display editor’s menu bar changes to the menu bar for the tag
monitor. Select the tags you want to use in the display as described
in “Selecting tags” on page 4-29.
4. Edit the tag monitor object as you would any other graphic
object. You can move it, resize it, and so on. You can also use this
object in other graphic displays by dragging it from one display
and dropping it into another.
For detailed information about graphic objects, see Chapter 11,
Creating graphic displays.
5. When you are finished, save the graphic display.
1
1
1
4-28
Creating tags
Creating a tag monitor file
1. In the Project Manager, open the System folder.
2. Open the Tag Monitor editor by doing one of the following:
double-click the Tag Monitor icon
right-click the Tag Monitor icon and then click New
3. On the View menu, click Form to display both the form and the
spreadsheet.
4. Select the tags you want to display as described below.
5. On the File menu, click Save, and then type a name for the file.
Selecting tags
To select tags, the form part of the tag monitor must be visible. If it is
not visible, click Form on the View menu.
To select the tags you want to display, do one of the following: 6.
type a tag name in the Tag Name field
click
to open a list and then select a tag
type a wildcard in the Name field, and then press Enter or click
OK. The wildcards are:
This character
Does this
?
Matches any single character.
*
Matches any number of characters, including the
backslash (\) character.
Use this wildcard by itself to display all the tags in the tag
database.
If you use a wildcard, the Select Tag Names dialog box opens.
1
1
4-29 1
Creating tags
Using the Select Tag Names dialog box
The Select Tag Names dialog box lists all the tags that matched a
wildcard. You can use some or all of the listed tags. A tag monitor
can contain up to 100 tag names.
This box lists all
the tag names
that matched
the wildcard.
Click this button to
select all the listed
tags.
To select all tags:
1. Click Select All.
2. Click OK.
To select a range of tags:
1. Click the first tag name you want to select.
2. Press and hold down Shift while you click the last tag name you
want to include.
3. Click OK.
1
1
1
4-30
Creating tags
To select individual tags:
1. Click the first tag name you want to select.
2. Press and hold down Ctrl while you click one or more tag names.
3. Click OK.
Understanding what you see
The following illustration shows the tag monitor file called Hopper1.
A single tag is
displayed in the form.
All selected tags
are displayed in
the spreadsheet.
1
1
4-31 1
Creating tags
The following table describes the columns in the spreadsheet:
This field
Displays
?
Y if the tag name is valid.
N if the tag name is not valid (in other words, the tag has not been
created in the tag database).
Tag Name
The tag name, whether valid or not, as entered in the tag database.
Value
The current value of the tag.
State
Disabled if the node has been disabled in the Node editor or by using the
NodeDisable command.
Error if RSView32 has tried to acquire a value but could not because of
some kind of communication error, such as a node not being available or
a DDE server not running.
Stale if the tag value has been acquired before but does not have an
updated value.
Uninitialized if the value has never been acquired.
Valid if RSView32 has a valid value for the tag.
None if there is a problem with the tag definition.
Description
The description of the tag, as entered in the tag database.
Changing what you see
Use the commands on the View menu to change what you see in the
tag monitor.
1
1
1
4-32
Creating tags
To show or hide the form and spreadsheet:
On the View menu, click Spreadsheet or Form. A check mark means
the form or spreadsheet is visible.
To change the spreadsheet font:
1. On the View menu, click Spreadsheet Font.
2. Select the font, style, and size you want.
To change the color of the font, click Spreadsheet Colors on the
View menu, as described next.
3. Click OK.
To change the color of text in the tag monitor spreadsheet:
1. On the View menu, click Spreadsheet Colors.
2. Select the item for which you want to specify a color. The items
are:
Normal for all tags in the spreadsheet
In Alarm for tags that are in alarm
Undefined for tags that have not been defined in the tag
database
1
1
4-33 1
Creating tags
3. In the Color dialog box, click the desired color.
4. Click OK.
Viewing details
To see more detailed information about a tag:
1. Select a tag by clicking it in the spreadsheet or by clicking the
Next and Prev buttons until the tag is displayed in the form
section of the tag monitor.
2. Click Show Details on the View menu or click the Details button
in the form section of the tag monitor.
The Tag Details dialog box opens.
To see the details for another tag, select the tag. You do not have
to close the Tag Details dialog box.
1
1
1
4-34
5
Creating derived tags
A derived tag is a tag whose value is the result of an expression. The
expression can be made up of mathematical operations, tag values
from the value table, if-then-else logic, and other special functions.
You should not write to derived tags, because the derived tag is only
evaluated when the expression changes. For example, if the derived
tag tag3 has the expression of tag1 + tag2, and if you set tag3 = 0, the
value of tag3 becomes zero, and will only be updated when the value
of tag2 or tag3 changes.
The value table is the part of memory that stores current tag values
when RSView32 is running. The current value of the derived tag is
stored in an analog, digital, or string tag in the value table. Derived
tags can be device tags or memory tags.
1
1
5-1 1
Creating derived tags
How to use derived tags
Here is an example of how a derived tag can be used. Suppose there
are five weight sensors on a conveyor belt. The tag database contains
one tag for each sensor, so the weight at each point on the conveyor
belt is monitored. If the weight at any point is excessive, RSView32
triggers an alarm.
However, what happens if no individual sensor detects an excessive
weight, but the total of all five sensors is too high? In this case, you
could set up a derived tag to sum the weights of all five sensors and
store the result in the value table. Then, if this total is too high,
RSView32 can trigger an alarm.
How to use multiple derived tag files
You can create multiple derived tag files. At runtime, up to 20
derived tag files containing a maximum of 1,000 tags can run
simultaneously.
Use multiple derived tag files to:
group derived tags that need to be evaluated at different rates
group derived tags that are active only when a particular graphic
display is active
Summary of steps
The main steps for configuring derived tags are:
set up the evaluation interval for the the derived tag file in the
Derived Tag Setup dialog box
create the derived tags in the Derived Tags editor
1
1
1
5-2
Creating derived tags
The Derived Tags editor
To open the Derived Tags editor:
1. In the Project Manager, open the Logic and Control folder.
2. Open the Derived Tags editor by doing one of the following:
double-click the Derived Tags icon
right-click the Derived Tags icon and then click New
Using the Accept and Discard buttons
When you enter information in the editor, the Prev and Next
buttons change to Accept and Discard. Click Accept to save
information. Click Discard to discard information.
1
1
5-3 1
Creating derived tags
Setting up the evaluation interval
To set up the evaluation interval for the derived tag file:
1. On the menu bar, click Setup, and then click Derived Tag Setup.
2. In the Derived Tag Setup dialog box, type a brief description of
the derived tag file. This description is for your information
only—it does not appear anywhere else.
For example, if you were creating a derived tag file for a certain
area of your plant, you might type “West Wing Assembly Line”
to identify the area.
3. Choose a type of evaluation to specify how often to evaluate
expressions at runtime. When the evaluation interval expires,
RSView32 evaluates the expressions that contain tags with values
that have changed.
To have expressions evaluated as quickly as possible, click
Continuous. To have expressions evaluated at a particular interval,
click Periodic, and then type a number in the Evaluation Interval
field. You can use fractional seconds. For example, if you type .6,
the expression will be evaluated every six tenths of a second. Do
not specify an evaluation interval faster than the scan class
background period, DDE server polling rate, or OPC server
update rate.
4. Click OK.
1
1
1
5-4
Creating derived tags
Creating derived tags
Derived tags are created in the Derived Tags editor. The following
illustration shows a derived tag file.
IMPORTANT Do not create derived tags that depend on the results of other
derived tags. At runtime, tags are not processed sequentially
and the time it takes to process a tag can vary.
To create a derived tag:
1. In the Tag Name field, specify the name of the tag that will hold
the derived tag value. This tag can be analog, digital, or string and
can have device or memory as the data source. The tag name is
also the name of the derived tag file.
IMPORTANT Limit the use of tags with device as their data source. If the
system is continuously writing the derived value to the device, it
can flood the communication channel with traffic. Also, if writing
occurs too often the buffer for the communication channel can
overflow and generate communication errors.
1
1
5-5 1
Creating derived tags
2. In the Description field, type a brief description of the derived
tag’s function. This description is for your information only—it
does not appear anywhere else.
3. In the Expression area, create the expression that will determine
the derived tag value.
For more information on expressions, see Chapter 14, Creating
expressions.
4. Click Accept.
5. Repeat Steps 1 through 4 to create more derived tags.
Use the Next button to move to a new record in the spreadsheet.
Editing derived tags
You can edit derived tags during development or runtime.
1. Open the derived tag file you want to edit.
2. Use the Prev and Next buttons to move among derived tags. Make
the required changes.
3. Click Accept to save the changes.
If you change the derived tag file at runtime, the changes do not take
effect until you stop running the file and then start it again.
1
1
1
5-6
Creating derived tags
Starting and stopping derived tag processing
There are many ways to start and stop derived tag processing.
Choose the way that works best for your project.
For a complete list of RSView32 commands and their command
syntax, see Appendix A, RSView32 commands, or see Help.
Ways to start derived tag processing
In the Startup editor, select the Derived Tags check box and
specify a derived tag file.
In the Macro editor, create a startup or login macro that includes
the DerivedOn <file> command.
In the Graphic Display editor, specify the DerivedOn <file>
command in the Startup field in the Display Settings dialog box.
In the Graphic Display editor, create a button object and specify
the DerivedOn <file> command as the press action. When the
button is pressed, derived tag processing starts.
In the Graphic Display editor, create a graphic object and attach
touch animation with the DerivedOn <file> command as the
action. When the object is touched, derived tag processing starts.
In the Events editor, specify the DerivedOn <file> command as
the action for an event.
On the command line, type DerivedOn <file> and then press
Enter.
1
1
5-7 1
Creating derived tags
Ways to stop derived tag processing
When a project stops, derived tag processing stops as well. To stop
derived tag processing without stopping the project, use any of the
methods below.
In the Graphic Display editor, specify the DerivedOff <file>
command in the Shutdown field in the Display Settings dialog
box. When the display closes derived tag processing stops.
Note that if the display is cached using the Always Updating
option, the DerivedOff command won’t be executed until the
display is removed from the cache (for example, by using the
FlushCache command).
In the Graphic Display editor, create a button object and specify
the DerivedOff <file> command as the press action. When the
button is pressed, derived tag processing stops.
In the Graphic Display editor, create a graphic object and attach
touch animation with the DerivedOff <file> command as the
action. When the object is touched, derived tag processing stops.
In the Events editor, specify the DerivedOff <file> command as
the action for an event.
On the command line, type DerivedOff <file> and then press
Enter.
1
1
1
5-8
6
Configuring alarms
In RSView32, you can set up a complete alarm system. Alarms are an
important part of most plant control applications because an
operator must know the instant something goes wrong. It is often
equally important to have a record of the alarm and whether the
alarm was acknowledged.
Summary of features
With the RSView32 alarm system, you can:
monitor any analog and digital tag for alarms (to a maximum of
10,000 tags)
display the last 1000 alarms in an alarm summary
define up to eight different severity levels to distinguish alarms
visually
use system default messages or create unique messages to describe
an alarm
log messages to a file, to a printer, or to both
suppress alarms for maintenance and tuning purposes
associate a macro with an alarm to provide custom handling of the
alarm
1
1
6-1 1
Configuring alarms
share alarm information with other RSView32 components
set up global alarm monitoring
use the AlarmEvent command to respond to your own alarm
detection algorithms for annunciation, logging, printing, and for
display in alarm summaries
Key concepts
An alarm occurs when something goes wrong. It can signal that a
device or process has ceased operating within acceptable, predefined
limits or it can indicate breakdown, wear, or a process malfunction.
Set up a system of alarms in the Tag Database editor by linking
alarms to tags you want monitored. When the tag values are updated
in the value table, they are compared to the limits you assigned when
you configured the alarm. If a tag value exceeds the configured
limits, an alarm of a preset severity is triggered.
Alarms for analog tags
An analog tag can trigger a number of alarms when it crosses various
predefined threshold levels (unlike a digital tag, which is either on or
off).
Thresholds
When defining an analog tag, you can assign up to eight alarm
thresholds with different levels of alarm severity to indicate the
alarm’s importance. The lowest threshold is one and the highest is
eight. You do not have to use all eight thresholds for a tag, but the
ones you use must be configured in ascending order. For example,
you can assign thresholds one, two, and eight as long as you assign
them in that order.
Thresholds can be increasing—monitoring for a rising value that
crosses the threshold, or decreasing—monitoring for a falling value
that crosses the threshold. The following illustration shows a tag
with both increasing and decreasing thresholds. In this example, the
deadband setting is zero.
1
1
1
6-2
Configuring alarms
Example: Alarm thresholds
Increasing
Thresholds
5,000
6
;; *
1
4,000
5
; ;*
4
3,000
4
2,000
3
1,000
Decreasing
Alarm
severity
level
Threshold
values
;
2
8
; 2
Safe
zone
8
2
6
1
Thresholds must be configured
in ascending order.
1
time
4
42217
* These alarms are triggered only if ´Generate alarms when approaching normal
operating rangeµ is selected in the Alarm Setup dialog box.
The illustration shows the changing values of a tag monitoring a
motor’s revolutions per minute (rpm). With the threshold settings
illustrated, the motor must run between 2,000 rpm and 3,000 rpm, or
an alarm is triggered. In the illustration, an X shows when the tag
goes into alarm and an O shows when the tag goes out of alarm.
1
1
6-3 1
Configuring alarms
If the motor speed
It triggers an alarm of this severity
exceeds 3,000 rpm
8
exceeds 4,000 rpm
4
exceeds 5,000 rpm
1
falls below 5,000 rpm *
4
falls below 4,000 rpm *
8
falls below 2,000 rpm
8
falls below 1,000 rpm
6
falls below 1 rpm
4
* These alarms are triggered only if ´Generate alarms when approaching normal
operating rangeµ is selected in the Alarm Setup dialog box.
You can specify whether or not to generate alarms when an analog
tag value is moving back to normal operating range and recrosses the
alarm trigger threshold. If you choose to generate alarms when the
motor is moving back towards normal operating range, an alarm
would be triggered when the motor speed falls below 5,000 rpm and
4,000 rpm, and when it rises above 1 rpm and 1,000 rpm. If you
don’t want to generate these alarms, make sure “Generate alarms
when approaching normal operating range” is deselected, in the
Setup tab of the Alarm Setup editor.
Variable thresholds
Threshold values can be constant or variable. The above example
uses constant thresholds. A variable threshold can change, because its
value is taken from another tag value, not a constant number. You
define a variable threshold by naming a tag in the appropriate field in
the editor. That tag’s value is the threshold for the alarm; as the tag
changes, the threshold changes.
Variable thresholds require more system resources than constant
thresholds. This is due to the continuous scanning of threshold
values and to the processing necessary to detect alarm faults.
1
1
1
6-4
Configuring alarms
Alarm faults
A variable threshold must not become higher than the threshold
above it or lower than the threshold below it. If this happens, an
alarm fault is generated for the monitored tag. To correct an alarm
fault, you must reconfigure the variable threshold so it does not
overlap either of its neighbors. This can become complex when the
neighboring thresholds are themselves variable, because these
boundaries are determined dynamically at runtime.
When an alarm fault is generated, the following actions occur:
the tag’s alarm status stays where it was before the alarm fault
an alarm fault is reported to all configured alarm reporting
devices, such as the alarm log file and printer
the alarm fault status bit for the tag is set in the value table, which
notifies other applications that an alarm fault has been generated
the Alarm Type column in the alarm summary states that the tag is
in “Alarm Fault”
When the faulty thresholds are returned to their normal operating
range, the alarm fault condition is cleared. The out-of-alarm-fault
status is generated and logged, and alarms for that tag resume normal
operation.
Deadband
With certain kinds of measured values, such as line pressure, tag
values can fluctuate rapidly above and below a critical threshold.
Where such conditions exist, you can create a deadband as a buffer to
prevent the fluctuations from triggering and retriggering unnecessary
alarms. If the threshold is increasing—monitoring rising values—the
deadband range lies below the threshold. If the threshold is
decreasing—monitoring falling values—the deadband lies above the
threshold. 4.
The following illustration shows an increasing threshold of
4,000 rpm with a deadband value of 500 rpm. In this example, the
rpm would have to fall to 3,500, and then rise above 4,000 rpm
before it would retrigger the alarm.
1
1
6-5 1
Configuring alarms
rpm
In alarm
again
In alarm
5,000
Threshold
4,000
3,500
3,000
Deadband
Out of
alarm
2,000
1,000
0
time
n
40218
IMPORTANT Use the deadband carefully in safety-critical applications. In the above
example, the variable would have to fluctuate by more than 500 rpm
before retriggering an alarm.
A deadband range may be absolute, as illustrated, or it may be a
percentage of the minimum/maximum range for a tag. If the
deadband in the illustration was two percent, its range would be two
percent of 5,000 rpm, or 100 rpm.
If a buffer is not required, the deadband must be configured to zero.
With a deadband of zero, alarms will be triggered as soon as the tag
value crosses any of its thresholds.
1
1
1
6-6
Configuring alarms
Alarms for digital tags
Digital tags are either on or off. Therefore, alarms for digital tags do
not have thresholds. They have alarm states. 5.
The alarm states are:
On
Triggers an alarm when a tag has a value of 1.
Off
Triggers an alarm when a tag has a value of 0.
Any Change*
Triggers an alarm when a tag value changes from 0 to 1 or from
1 to 0.
Changes to
On*
Triggers an alarm only when a tag value changes from 0 to 1.
Changes to
Off*
Triggers an alarm only when a tag value changes from 1 to 0.
IMPORTANT The * indicates change-of-state types. These types are considered out of
alarm immediately after the change of state.
Alarm severity
Alarms can range in severity from one to eight to indicate different
levels of importance. One is most severe, eight is least severe. For
example, a level-four alarm might warn that a vat is half full of liquid
while a level-one alarm indicates that the vat is about to overflow.
Both alarms monitor the same tag but have different severity levels.
When you configure alarm severity, you specify what severity levels
mean and what actions they will trigger. Severity determines the
destination of alarm messages. It also determines the color of the text
in the alarm summary and the order in which alarms are displayed in
an alarm banner.
1
1
6-7 1
Configuring alarms
Alarm messages
Alarm messages report information about alarms. There are three
types of messages:
In Alarm message: generated when a tag goes into alarm
Out of Alarm message: generated when a tag goes out of alarm
Acknowledged message: generated when an operator
acknowledges an alarm
For each message, you can use the default message or create your
own message, and you can selectively route alarm messages to a log
file and/or printer.
Alarm log file
The alarm log file records alarm incidents that occur. You can
configure how often, if ever, you want log files created and deleted.
The log file stores data in standard dBASE IVX (.dbf) format.
Optionally, using the AlarmLogSendToODBC command, you can
export the alarm log file to an ODBC database while online. For
more information, see page 6-30.
In RSView32, you can view the alarm log file with the Alarm Log
Viewer. You can also use third-party applications to view the log file.
The application must be able to read the dBASE IV file format or be
ODBC compliant. For example, you can use Microsoft Excel,
Microsoft AccessZ, or Microsoft Visual Basic.
1
1
1
6-8
Configuring alarms
Alarm displays
Alarm information can be displayed in:
alarm log viewer
alarm summary
graphic objects and displays
tag monitor
When alarms are generated, they are recorded in two places: the
alarm log file and the computer’s memory. The alarm log viewer
displays the records in the alarm log file. The alarm summary
displays the records in the computer’s memory.
Alarm log viewer
The alarm log viewer displays the contents of the alarm log file. The
contents of this file depend on how you configured severities in the
Alarm Setup editor. By default, the log file will have a record for
each of the following alarm incidents:
when a tag goes into alarm
when a tag goes out of alarm
when an alarm is acknowledged
when a tag with an alarm is suppressed
when an alarm fault is generated
The viewer can display up to 32,767 records. Set up your project so
only essential alarm information is logged. Alarm logging uses
system resources and can slow overall system performance.
1
1
6-9 1
Configuring alarms
Alarm summary
The alarm summary displays the alarm information recorded in the
computer’s memory. The summary is configurable, so you can
determine what and how alarm information is viewed.
The summary can list up to 1,000 alarms. As new alarms occur, they
appear at the top of the list. When the alarm summary becomes full,
one alarm is dropped from the bottom of the list for each new alarm
that appears at the top. Alarms are also dropped when they are
out-of-alarm and acknowledged. When alarms are dropped, they are
removed from memory. When the AlarmOff command is issued, the
contents of the alarm summary are erased.
AlarmOff is just one of the RSView32 commands used with alarms.
For details about this command and others, see Appendix A,
RSView32 commands, or see Help.
In the summary, you can configure each alarm incident to be a
different color. For example, you might choose to configure low
severity alarms as blue, medium severity as yellow, and high severity
as red. When the alarm is displayed, operators can tell an alarm’s
severity at a glance.
Create an alarm summary in the Graphic Display editor or create an
alarm summary file through the Project Manager.
Graphic objects and displays
You can customize graphic displays to show specific information
about alarms. RSView32 makes all alarm status information available
to graphic displays through a set of system tags (see below). Use
these tags with numeric and string display objects. Attach visibility
and color animation to affect the appearance of the objects.
The Alarm Information graphic library contains graphic objects you
can drag and drop into your display. For example, to include an
alarm banner in a display, drag and drop the banner from the Alarm
Information graphic library. Use the graphic objects as they are or
edit them to suit your needs.
1
1
1
6-10
Configuring alarms
Alarm system tags
System tags are created and updated by RSView32. You can use these
tags anywhere a tag name is required. The system tags for alarms are:
This tag
Type
Displays this information
system\AlarmBanner
String
The most recent, most severe alarm.
If an alarm of an equal or higher
severity occurs, it replaces the first
alarm, whether or not the previous
alarm has been acknowledged.
system\AlarmMostRecentDate
String
The date of the most recent, most
severe alarm.
system\AlarmMostRecentLabel
String
The threshold label of the tag of the
most recent, most severe alarm.
system\AlarmMostRecentSeverity
Analog
The severity of the most recent, most
severe alarm (1 to 8).
system\AlarmMostRecentTagDesc
String
The description of the tag of the most
recent, most severe alarm.
system\AlarmMostRecentTagname
String
The name of the tag of the most
recent, most severe alarm.
system\AlarmMostRecentTime
String
The time of the most recent, most
severe alarm.
system\AlarmMostRecentUnits
String
The units of the most recent, most
severe alarm.
system\AlarmStatus
String
The number of unacknowledged and
suppressed alarms.
system\AlarmSummaryItems
Analog
The number of alarm transactions in
an unfiltered alarm summary.
system\AlarmSummaryItemsUnacked
Analog
The number of unacknowledged
alarms in an unfiltered alarm
summary.
system\AlarmSuppressedCount
Analog
The number of tags with alarm
suppression turned on.
1
1
6-11 1
Configuring alarms
Alarm acknowledgment
If an alarm appears in the alarm summary or some other alarm
display, an operator can acknowledge the alarm. Acknowledging an
alarm does not correct the condition causing the alarm, but indicates
that an operator is aware of the alarm.
A tag, not an alarm, is acknowledged. A single tag might have caused
several alarms. For example, a tag representing temperature might
have triggered Warm, Hot, and Overheat alarms by the time it is
acknowledged. The tag could also have gone in and out of alarm
several times before being acknowledged.
One acknowledgment is all that is required for all previous and
current alarms for a tag, so alarm log files often show fewer
acknowledgments than alarms.
To acknowledge alarms, operators can:
click the Acknowledge or Acknowledge All button in the alarm
summary
use the RSView32 Acknowledge command by itself, or with
parameters to name a tag or group of tags
use the RSView32 AcknowledgeAll command
Unless an alarm is acknowledged, it remains outstanding until the
system is shut down, the alarm summary is full, or alarm monitoring
is turned off.
Alarm suppression
You can suppress alarm monitoring for tags. This is useful for testing
or for performing repairs or maintenance on a piece of equipment.
To suppress alarm monitoring for tags, use the RSView32
SuppressOn command. To view a list of the tags not being
monitored, use the Suppressed List. You can also turn monitoring
back on from this list.
1
1
1
6-12
Configuring alarms
Running commands, macros, or VBA programs in response to
alarms
Using the Execute and Identify buttons in an alarm summary, you
can run a command, macro, or VBA program to respond to tags’
alarm conditions.
Use the Execute button to run a command, macro, or VBA program
that applies to all alarms in the summary, for example to create a
custom alarm report for analyzing plant maintenance efficiency.
Use the Identify button to run a command, macro, or VBA program
that applies only to the highlighted alarm. The Identify button can
run a different command, macro, or VBA program for each tag, for
example to run a different help file for each tag’s alarm conditions.
About the Execute button
With the Execute button, you can specify a command or macro that
operators can run with reference to the highlighted alarm in an alarm
summary. The Execute command can be appended with data items
derived from the highlighted alarm, for example the tag name, alarm
type, severity, value, date and time, and the tag type.
Use the execute feature to apply a common command, macro, or
VBA program to alarms in the alarm summary. For example, you can
run a VBA program to add entries to a custom alarm report for
selected alarms in an alarm summary, and you can pass arguments
from the highlighted alarm to the VBA program.
To set up the Execute button, double-click the alarm summary to
edit it, and then open the Execute Command dialog box by clicking
Execute on the Data menu. Type a command or macro in the
Execute Command Text box, and then select one or more parameters
to append to the command or macro. For details about using alarm
data with commands, see page 6-66.
By default, the Execute button is not included on an alarm summary.
The Execute button will be added when a command is assigned to
the button. For information about adding buttons to an alarm
summary, see page 6-59.
1
1
6-13 1
Configuring alarms
To run the command, macro, or VBA program associated with the
Execute button, either highlight an alarm in the list and then click
Execute, or double-click an alarm in the list.
For more information about using the Execute button in an alarm
summary, and for an example, see page 6-66.
About the Identify button
With the Identify button, you can specify a command or macro that
operators can run when a tag is in alarm. Use this button to provide
information about an alarm. For example, use the Display command
to open a display that contains instructions on how to handle a
motor that is running too fast.
To set up the Identify button, specify a command or macro in the
Alarm Identification field in the Advanced tab of the Analog Alarm
editor or Digital Alarm editor. For details about setting up Identify
for analog tags, see “Advanced” on page 6-44. For details about
setting up Identify for digital tags, see “Advanced” on page 6-49.
To run the Identify command, you can highlight the alarm in the
alarm summary and then click the Identify button, or type the
Identify command on a command line. When you use the Identify
command, the command or macro runs whether or not the tag is in
alarm.
For detailed information about the Identify command and other
RSView32 commands, see Appendix A, RSView32 commands, or see
Help.
For detailed information about macros, see Chapter 15, Setting up
navigation.
1
1
1
6-14
Configuring alarms
Alarm expressions
When a tag goes into alarm, certain information about the alarm is
recorded in the value table along with the tag’s value. Using
expressions, information about alarms can be retrieved on a
tag-by-tag basis.
For example, if the system detects that a tag is in alarm, it sets an
internal alarm bit, and resets the bit when the tag is out of alarm. The
following expression checks if a tag is in alarm:
ALM_IN_ALARM (tag)
where tag is the name of the tag you want to check for alarms. When
a tag is in alarm, the expression result is 1. When a tag is out of alarm,
the expression result is 0.
One way to use this expression is to animate the visibility of a
graphic object in a display. When the tag goes into alarm, the
ALM_IN_ALARM expression is set to 1, making the object visible.
This is an effective way to draw the operator’s attention to the alarm.
The following expression checks if an alarm has ever been
acknowledged:
ALM_ACK (tag)
The ALM_ACK expression returns 1 if an alarm has been
acknowledged. If a tag goes out of alarm without being
acknowledged, the expression returns 0.
When alarm monitoring starts and a tag has never been in alarm, the
ALM_ACK expression returns 1 by default. To reverse this default
behavior, use the Registry Configuration tool in the RSView32
Resource Kit.Z For a copy of the Resource Kit, contact Rockwell
Software Technical Support.
ALM_ALLACKED (tag*)
The ALM_ALLACKED (tag*) expression returns 1 if all tags that
match the pattern have been acknowledged. If any of the tags have
not been acknowledged, the expression returns 0.
1
1
6-15 1
Configuring alarms
Other functions are also used with expressions to monitor alarms.
For more information, see Chapter 14, Creating expressions.
Using wildcards in alarm expressions
For built-in alarm functions, you can use wildcards in the expression
to retrieve information about multiple tags at once.
This wildcard
Does this
*
Matches any number of characters, including the backslash (\)
character.
?
Matches any single character.
For example, the following expression checks if any of a group of
tags is in alarm:
ALM_IN_ALARM (alarm*)
where alarm* represents all tags whose names begin with “alarm.” If
one or more of these tags are in alarm, the expression result is 1. If all
of the tags are out of alarm, the expression result is 0.
Note that using wildcards in alarm expressions may have an impact
on performance if the pattern matches a large number of tags. See
“Tag functions” on page 14-14 for a list of the alarm functions.
Acknowledge bit (globally acknowledging alarms)
When you set up an acknowledge bit for a tag, all RSView32 stations
can be set up to monitor that bit automatically at runtime. When an
operator acknowledges an alarm for that tag, the acknowledge bit is
set. If an alarm is acknowledged on one machine, all other machines
log a RmAck (Remote Acknowledge) transaction in the alarm log
file. All other RSView32 stations then acknowledge the alarms
associated with that bit. In this way, operators can acknowledge
alarms globally. 6.
1
1
1
6-16
Configuring alarms
Set up acknowledge bits in any of the following ways:
one acknowledge bit for each tag
When an alarm is acknowledged on one RSView32 station, that
alarm is automatically acknowledged on all other RSView32
stations. Keep in mind, however, that RSView32 will be
monitoring each bit so using many acknowledge bits can result in
substantial system overhead.
one acknowledge bit for a group of tags
When an alarm is acknowledged on one RSView32 station, all
alarms associated with the acknowledge bit are automatically
acknowledged on all RSView32 stations. Keep in mind, however,
that RSView32 will be monitoring each bit so using many
acknowledge bits can result in substantial system overhead.
one acknowledge bit for all tags
When any alarm is acknowledged on one RSView32 station, all
alarms are automatically acknowledged on all RSView32 stations.
This means alarms cannot be acknowledged individually.
Therefore, the Acknowledge command and the alarm summary’s
Acknowledge button have the same effect as the AcknowledgeAll
command and the Acknowledge All button.
To set up acknowledgment, use the Acknowledge Bit field in the
Advanced tab of the Analog Alarm and Digital Alarm editors. Or, to
set up global alarm acknowledgment without using acknowledge
bits, use the global alarm acknowledgment features in the RSView32
Active Display System, available separately from Rockwell Software.
1
1
6-17 1
Configuring alarms
Handshake bit
When a tag goes into alarm, RSView32 can set a handshake bit to
notify a programmable controller that the tag is in alarm. To set up
handshaking, use the Handshake Bit field in the Advanced tab of the
Analog Alarm and Digital Alarm editors.
By default, handshaking is off. To turn on handshaking, do one of
the following:
use the /H parameter with the AlarmOn command
use the HandshakeOn command
For detailed information about commands, see Appendix A,
RSView32 commands, or see Help.
Alarm events
You can customize and extend the RSView32 alarm monitoring
system by writing your own alarm detection algorithms using PLC
ladder logic, VBA programs, or any other appropriate tools. You can
then add alarm events to the the RSView32 alarm subsystem, to
respond to your alarm detection algorithms for annunciation,
logging, printing, and for display in alarm summaries.
By using a tag name for an alarm event, you can customize the alarm
features of the tag. For example, you can use alarm events to specify
an alarm’s time stamp. Because alarms are scanned in the
background, alarms that are generated rapidly may appear out of
sequence in RSView32, because they may all be scanned at the same
time, and therefore given the same time stamp. If the sequence in
which alarms are generated is important, you may want to record
accurate time stamps for the alarms by buffering the alarms in the
PLC, and then using alarm events to record them with accurate time
stamps in RSView32.
You can also use alarm events to provide a tag with more than 8
thresholds.
To create an alarm event, use the AlarmEvent command.
1
1
1
6-18
Configuring alarms
How event-based alarms work
Alarm events let you create alarms, even without setting up tags in
the tag database. Event-based alarms work just like tag-based alarms.
They appear in alarm summaries, they can be used with alarm system
tags, and they can be logged to disk or printer.
You can filter event-based alarms the same way you filter tag-based
alarms in alarm summaries. You can acknowledge event-based
alarms, either individually, or with wildcards, using the
Acknowledge command. You cannot suppress event-based alarms.
You can time-stamp event-based alarms with the current time, or by
specifying a date and time, either in RSView32 or in your own alarm
detection algorithms.
Alarm events are not processed until the AlarmOn command is
issued, and alarm events are no longer processed after the AlarmOff
command is issued.
Differences between event-based alarms and tag-based alarms
You cannot specify thresholds for analog alarm events. All analog
alarm events have a value of zero.
You cannot specify alarm labels for event-based alarms. That is, you
cannot use the IntoAlarm and OutOfAlarm labels for digital
tag-based alarms, or the threshold labels for analog tag-based alarms.
Alarm events have no acknowledge and handshake bits.
The Identify feature is not available to event-based alarms, to run a
command, macro, or VBA program.
Event-based alarms are not retentive across project starts or stops.
1
1
6-19 1
Configuring alarms
Naming alarm events
A name must be associated with each alarm event. The event name
can, but need not be, a tag defined in the tag database. An alarm
event name cannot be an alarm tag in the database.
Alarm event names can be up to 40 characters long. The alarm event
name can contain the following characters:
A to Z
0 to 9
underscore (_) and dash (-)
The alarm event name can be mixed case. Alarm event names
preserve upper and lower case for readability but are not case
sensitive. For example, the alarm event name HopperOverflow is the
same as hopperoverflow.
When an alarm event name starts with a number or contains a dash,
enclose the name in braces { } when you use it in an expression, for
example, {N33-0}. Also use braces when using wildcards to represent
multiple alarm events in an expression, for example, {alarm*}.
Using event types
Use the AlarmEvent command to create into-alarm and out-of-alarm
events. Multiple into-alarm events can be processed for the same
event name before an out-of-alarm event is received. Use the
InAndOutOfAlarm event type for change-of-state alarms. An
out-of-alarm event is ignored if no into-alarm events preceded it.
How event-based alarms are logged
Event-based alarms appear in the alarm log file in the order in which
the alarm transactions were logged. If you specify a time stamp for
alarm events, alarm transactions could appear out of order in the
alarm log.
For detailed information about the AlarmEvent command, see
Appendix A, RSView32 commands, or see Help.
1
1
1
6-20
Configuring alarms
Summary of steps
The main steps involved in setting up alarms are described below.
You do not have to complete the steps in this order.
1. Set up the general features of all alarms in the Alarm Setup editor.
To do this:
configure the alarm log file. The alarm log file is a record of
alarm incidents. You can specify where you want the alarm log
file stored and when, if ever, you want log files created and
deleted. You can also specify whether to generate alarms when
an analog tag value is moving back to normal operating range
and recrosses the alarm trigger threshold. If you don’t want to
generate these alarms, ensure that the checkbox for the option is
deselected, in the Setup tab of the Alarm Setup editor.
configure alarm severities. For each severity, you can specify the
destination of alarm messages. You can also specify how to
annunciate the alarm.
configure user messages. When alarms occur, messages are sent
to the file and/or the printer. If you want to create a message
that will become the default message instead of using the
system default message, you can do that here.
2. For each tag you want to monitor, specify the alarm conditions in
the Tag Database editor. You can define alarms for analog and
digital tags, but not string tags.
3. Set up ways to display alarm information. You can configure
alarm summaries or create graphic objects.
4. Choose methods for starting and stopping alarm monitoring.
1
1
6-21 1
Configuring alarms
The Alarm Setup editor
To open the Alarm Setup editor:
1. In the Project Manager, open the Alarms folder.
2. Open the Alarm Setup editor by doing one of the following:
double-click the Alarm Setup icon
right-click the Alarm Setup icon and then click Show
Specify where to store
alarm log files.
Specify when to delete
log files.
Configure alarm severity.
Create alarm messages
that will replace the
system default messages.
1
1
1
6-22
Configuring alarms
Specifying where to store alarm log files
To specify where to store log files:
1. In the Alarm Setup editor, click the Setup tab.
By default, alarm log
files are stored in the
ALMLOG subdirectory
of your project.
2. If you want to change where the log files are stored, specify a new
path.
When log files are created, they will be stored in the directory
specified here.
3. If you want RSView32 to generate alarms when an analog tag
value is moving back to normal operating range and recrosses the
alarm trigger threshold, check Generate alarms when approaching
normal operating range. For an example, see page 6-3.
This option applies to all analog alarm tags in the project.
4. If you want to log activities in a format that is compatible with
projects running in RSView32 version 6.0 or earlier, click Use
RSView32 6.0 Log File Format.
1
1
6-23 1
Configuring alarms
5. If you want your alarm log files to be named using the DOS
eight-character file name and three-character extension format,
click to deselect Use Long File Names. If the path where the log
files are stored supports long file names, the date stamp part of the
log file name includes a four-digit year.
6. Click OK.
Creating log files
You can set up your project to create new log files:
periodically
at specified times
when a particular event occurs
never
In each 24-hour period, up to 26 new files can be created. If you
attempt to create a 27th file, RSView32 continues logging data to the
26th file. At midnight, the sequence starts again with the first new
file for the new day.
Log files are saved in the directory you specified in the Setup tab.
For more information about log files, also see “About alarm log
files” on page 6-29, “Viewing the alarm log file” on page 6-51,
“Bringing logged dBASE IV data into Microsoft Excel” on page
16-5, and “Alarm log files” on page 16-9.
Monitoring disk space
If your computer’s hard disk is full, alarm logging stops and no more
log files are created. To monitor disk space, see page 18-14.
1
1
1
6-24
Configuring alarms
To specify when to start new files:
1. In the Alarm Setup editor, click the File Management tab.
2. Under Start New Files, click a button to specify when you want
to have new files created. See the topics below for information on
the various times.
Creating files periodically
Click Periodic, and then click a time period. A new file is created
after the specified interval has elapsed.
For this period
The new file is created
Hourly
Approximately on the hour
Daily
Each day approximately at midnight
Weekly
Each Sunday approximately at midnight
Monthly
On the first day of each month approximately at midnight
1
1
6-25 1
Configuring alarms
Creating files at specified times
Click At Specified Times, and then type a time or list of times when
you want data to be logged to a new file. Start a new line for each
new time and allow at least five minutes between start times.
Use any of the following to specify time:
Time
Format
Day
Sun, Mon, Tue, Wed, Thu, Fri, or Sat
Date
1 – 31
Specifying 31 means that months that do not have
31 days will not have new log files.
Hour
00: to 23:
Minute
:00 to :59
You can combine hours and minutes with a day or date.
Example: Creating a new file
To start a new file every Wednesday at 2:00 am and every Friday at
2:00 pm, type the following start times:
1
1
1
6-26
Configuring alarms
Creating files when a particular event occurs
1. Click On Event.
2. In the Expression field, create the expression that will trigger
creation of a new file. For details on creating expressions, see
Chapter 14, Creating expressions.
Example: Creating a new file for a new shift
You can set up your project so it creates a new log file at the end of a
shift or batch process. For example, create a tag called NextShift. In
the Alarm Setup editor, click On Event and then type NextShift as
the expression.
When the tag evaluates to true, a new alarm log file is created to store
the data from the new shift.
Never creating new files
Click Never. Logged data is added to a single file.
To manage disk space if a log file grows too large, stop alarm
monitoring, delete the alarm log file, and then restart alarm
monitoring. You cannot delete an alarm log file while RSView32 is
monitoring alarms. For details about how to monitor disk space, see
“Monitoring disk space” on page 18-14.
1
1
6-27 1
Configuring alarms
Deleting log files
You can delete log files after a specified period or once a specified
number of files has been created. If you never want files deleted,
leave the check boxes under Delete Oldest Files blank.
Alarm log files are deleted only when a new file is created. So, if your
project creates a new file each day and deletes the oldest file every
third day, your project will have files for the three previous days’
data as well as a file for the current day.
To specify when to delete files:
1. In the Alarm Setup editor, click the File Management tab.
2. Under Delete Oldest Files, select one or both check boxes and
type a number to specify when to delete the log files. If you select
both check boxes, files are deleted after the maximum time or after
the maximum number of files is reached, whichever happens first.
If you do not want files deleted, leave the check boxes under
Delete Oldest Files blank.
1
1
1
6-28
Configuring alarms
After Maximum Time
Files are deleted after the maximum time has expired. For
example, if two days is the specified time, files are deleted at
midnight of the third day so you always have data for the current
day and the two previous days.
After Maximum Files
The oldest log file is deleted after the specified maximum has been
reached. The files currently being logged to are not included in
this number. For example, if you specify 10, you will have a
maximum of 11 alarm log files at any time—10 old ones and the
current one. When a new set is started, the oldest file is deleted.
If you have set up File Management to delete the oldest files when a
new one is started, and you are exporting data to an ODBC
database, make sure you export the data before the oldest file is
deleted.
About alarm log files
Alarm information is stored in dBASE IV (.dbf) format.
How log files are named
When a log file is created, it is automatically named. The name is
based on the date the file was created and the type of data it contains.
The format for the name is YYYYMMDDnz.dbf, where: 1
YYYY are the four digits of the year
MM is the month
DD is the day
n is the sequence letter (a, b, c, and so on). This letter indicates the
sequence files were created in. You can have up to 26 files (a to z)
per day. At midnight, the sequence starts at “a” again.
z is the file type: l is for alarm
If you are using short file names, or if the path where the log files are
stored does not support long file names, the format for the name is
YYMMDDnz.dbf, where YY are the last two digits of the year.
1
1
6-29 1
Configuring alarms
Example: Log file name
The log file named 19971028bl.dbf was created in the year 1997,
month 10, and day 28. The b indicates that this is the second file
created that day. The l indicates that this is an alarm log file.
Exporting alarm log files to ODBC format
Using the command, AlarmLogSendToODBC, you can export
logged alarms from their native dBASE IV (.dbf) format to an
ODBC database.
If the table in the database to which you are attempting to export
data is not ODBC-compliant, the export will fail. If an
ODBC-compliant table does not exist, RSView32 will try to create
it. RSView32 supports the following ODBC-compliant databases:
Microsoft Access, Sybase® SQL Server, Oracle,® and Microsoft
SQL Server.
When you export data to an ODBC table, RSView32 keeps track of
the data that was exported in a control file, Alarm.exp. This is
located in the log path where the .dbf files are stored. The next time
you export data, only the newest data will be exported. If the control
file is deleted, all the alarm log data in the .dbf file will be exported
when you issue the export command.
If you have set up file management to delete the oldest files when a
new set is started, and you are exporting data to an ODBC database,
make sure you export the data before the oldest files are deleted.
1
1
1
6-30
Configuring alarms
Example: Exporting alarm log files to ODBC once a day
To export the contents of the alarm log files to an ODBC database
once every day, create an event file that specifies when and where to
export the data. AlarmLogSendToODBC exports only the records
added to the alarm log files since the last export.
1. If required, using the ODBC Administrator, set up an ODBC
data source name. For an example, see page 7-16.
2. Double-click Events in the RSView32 Logic and Control folder.
3. In the Expression box, type: time(“01:00”). This expression runs
the command or macro you type in the Action box at 1:00 am
every day.
4. If the ODBC data source is called RSView32AlarmLog, the target
table name is AlarmTable, the user name is Derek, and the
password is golf, in the Action box, type:
AlarmLogSendToODBC RSView32AlarmLog AlarmTable
/UDerek /Pgolf
5. Click Accept to save the event.
6. Click Close to save the event file.
7. At the command line, type EventOn <filename> where
<filename> is the name of the event file you saved.
For information about the format of the alarm log ODBC tables, see
page 16-10.
1
1
6-31 1
Configuring alarms
Configuring alarm severity
For each alarm severity and alarm incident, you can configure
logging destinations. You can also specify how you want alarms of a
particular severity to be annunciated. 8.
To configure alarm severity:
1. In the Alarm Setup editor, click the Severities tab.
Alarm Severities
Alarm Incidents
2. Select an alarm severity or an incident.
1
1
1
6-32
Configuring alarms
3. Specify the logging destination. You can log to the alarm log file,
to a printer, or to both. Alarm severities and incidents are logged
as follows:
Alarm
What is logged
Severity 1 through 8
In Alarm messages are logged
Out of Alarm
Out of Alarm messages are logged for any severity that has
been set up to log In Alarm messages
Acknowledged
Acknowledged messages are logged for any severity that
has been set up to log In Alarm messages
Fault
All Fault messages are logged
Suppression
All Suppression messages are logged
If you want alarms logged to a printer, click the Printers button to
display a list of available printers. To select a printer, it must
already be set up on your system. For information on installing a
printer, see your Windows documentation.
IMPORTANT Page printers, such as laser printers, are not supported.
4. For an alarm severity, specify how you want the alarm to be
annunciated.
Internal Bell
The internal bell is a sound produced by the computer running
RSView32. To use the internal bell, select the Internal Bell check
box.
The sound for the internal bell can come from your computer’s
speaker or from a sound card. To set up the sound, open the
Windows Control Panel and then double-click the Sounds icon to
open the Sounds Properties dialog box. In the Events field, click
Exclamation, and then assign a .wav file to the Exclamation event.
When an alarm occurs, the assigned sound is repeated once per
second. When the alarm is acknowledged or silenced, the sound is
stopped. Because the sound is played repeatedly, assign only short
sounds to the Exclamation event.
1
1
6-33 1
Configuring alarms
You can choose from the sounds that come with Windows, or you
can install additional sound files. For information on installing
drivers and assigning sounds, see your Windows documentation.
External Bell
The external bell is a sound produced by a horn or some other
audio device. To set up the external bell, select the check box and
specify the name of a tag that is linked to an audio device.
The specified tag must refer to a bit in the programmable
controller. When an alarm occurs, this bit is set and the logic in the
programmable controller turns on the audio device. When the
alarm is acknowledged or silenced, the bit in the programmable
controller is reset and the logic in the programmable controller
turns off the audio device.
5. Click OK.
Configuring alarm messages
Alarm messages report information about alarms. There are several
types of messages. You can define the content of each message or
you can use the system defaults.2
Alarm messages appear in the description field of the alarm log file
only. You cannot display them in alarm summaries.
Types of messages
The types of messages are:
In alarm message: generated when an analog tag’s alarm threshold
has been crossed or when a digital tag has changed state
Out of alarm message: generated when a tag is no longer in alarm
Acknowledged message: generated when an alarm has been
acknowledged
1
1
1
6-34
Configuring alarms
Defining the content of the message
When defining the content of a message, use any combination of
system default messages, user default messages, and custom
messages.
System default messages
The system default messages are a series of placeholders. At runtime,
these placeholders are replaced with information about the alarm
that has been triggered.
To use the default messages for all alarms and alarm events, do not
change anything. The default messages will be used automatically.
Alarm events use system messages if you don’t specify a log message
string using the /L parameter with the AlarmEvent command.
These are the placeholders:34
This placeholder
Is replaced with
\C
Current value of tag in alarm.
\D
Date when message is sent.
\L
Alarm label specified in the Alarm Label field of the Analog Alarm
and Digital Alarm editors.
\N
Tag name of tag in alarm.
\S
Tag description of tag in alarm.
\T
Time when message is sent.
\U
Units specified in the Units field of the Tag Database editor.
\V
Threshold value that was crossed.
IMPORTANT \C, \U, and \V do not contain any information when used in alarm
Acknowledged messages.
To specify the width of a column, type a number between the
backslash and letter (see the following example). This allows you to
create columns of equal width.
1
1
6-35 1
Configuring alarms
Example: Message placeholders
An out-of-alarm message like this:
\11D \8T Tag \10N is out of alarm.
is displayed like this:
03/09/97 11:45:00 Tag PUMP3
is out of alarm.
Do not give placeholders too much space, or your messages might
not fit in the alarm log. In the example above, the tag name has 10
spaces (\10N).
User default messages
The user default messages are messages you create to replace the
system default messages. To create these messages, select the User
Msgs tab in the Alarm Setup editor and type a message in some or all
of the fields. Your message can say whatever you want, and can use
both words and placeholders. For a list of placeholders, see
page 6-35.
1
1
1
6-36
Configuring alarms
To create a user
default message,
type a message in
the appropriate
field.
To select the user message as the default message, click the User
Defaults button when you are configuring analog and digital alarms.
Custom messages
Custom messages apply on a per-tag basis.
To create a custom message, type any message you want. For more
information see “Configuring alarms for analog tags” on page 6-40.
and “Configuring alarms for digital tags” on page 6-46. Your
message can say whatever you want and can use both words and
placeholders. For a list of placeholders, see page 6-35.
1
1
6-37 1
Configuring alarms
Adding remarks to the alarm log file at runtime
Using the AlarmLogRemark command, you can add information to
the alarm log file at runtime.
Alarm log remarks appear in the alarm log file, and can also be
printed. You cannot display alarm log remarks in alarm summaries.
The AlarmLogRemark command has parameters that let you add a
text comment, the alarm severity, and the tag name to the alarm log
file. Other parameters let you prompt the operator for the text part
of the remark at runtime, and log the remark to a printer as well as to
the alarm log file.
Using the /P
parameter with the
AlarmLogRemark
command, you can
prompt the
operator for an
alarm log remark at
runtime.
At runtime, only one Alarm Log Remark dialog box is displayed at a
time, and the operator must respond to the dialog box before the
next one is displayed.
Alarm logging must be on before you can use the AlarmLogRemark
command. To start alarm logging, issue the AlarmLogOn command.
For details about the AlarmLogRemark command, see Appendix A,
RSView32 commands, or see Help.
1
1
1
6-38
Configuring alarms
Specifying alarm conditions for analog and digital tags
For each analog and digital tag that will be monitored for alarms,
specify the alarm conditions in any of the following ways:
by configuring alarm tags in the Tag Database editor. For more
information about using the Tag Database editor to configure
alarms, see this section.
by importing tags into the tag database using the Database Import
& Export Wizard. For more information about using the Database
Import & Export Wizard, see page 4-25.
by using the RSView32 Object Model with VBA. For more
information about using the RSView32 Object Model, see Help.
To open the Tag Database editor:
1. In the Project Manager, open the System folder.
2. Open the Tag Database editor by doing one of the following:
double-click the Tag Database icon
right-click the Tag Database icon and then click Show
To add an
alarm to a
tag, select
this check
box.
When a tag
has an
alarm, an X
appears in
this column.
1
1
6-39 1
Configuring alarms
When can I configure an alarm for a tag?
You can configure an alarm for a tag at the time you create the tag or
later.
To configure an alarm for an existing tag, select the tag in the Tag
Database spreadsheet, and then click the Alarm check box. Click the
Alarm button to open the Analog Alarm or Digital Alarm dialog
box.
Configuring alarms for analog tags
These are the main steps to configure alarms for analog tags: 3.
configure the alarm threshold, and choose the message that will
appear if the threshold is crossed
configure the messages that are sent when a tag goes out of alarm
and when an operator acknowledges an alarm
configure advanced features, such as deadband and handshake
1
1
1
6-40
Configuring alarms
Alarm thresholds
1. Click the Alarm Thresholds tab.
To configure a
threshold, first
select the
threshold in
this box.
2. Select a threshold.
You do not have to configure all eight thresholds, but you have to
configure the ones you use in ascending order. For example, you
can configure thresholds 1, 2, 5, and 8 as long as you configure
them in that order.
3. Fill in the fields as follows:
Threshold
To define a constant threshold, type a number. To define a variable
threshold, specify a tag name.
IMPORTANT At runtime a variable threshold must not become higher than the
threshold above it or lower than the threshold below it, or an alarm
fault will be generated for the tag.
1
1
6-41 1
Configuring alarms
Increasing/Decreasing
To monitor for a rising value that passes the threshold, click
Increasing. To monitor for a falling value that passes the threshold,
click Decreasing.
Alarm Label
Type a description of the alarm up to 21 characters long. This
description is displayed in the alarm summary and alarm banner.
Severity
Select a severity level. Severity 1 is most severe, Severity 8 is least
severe.
Severities are configured in the Alarm Setup editor. For details, see
“Configuring alarm severity” on page 6-32.
In Alarm Messages
Select the message you want when the tag goes into alarm.
If you click Custom Message, type the message in the File and/or
Printer fields. You can use both words and placeholders.
For detailed information about messages, see “Configuring alarm
messages” on page 6-34.
4. To configure additional thresholds, select another threshold and
fill in each field.
When you select another threshold, the information you
configured for the previous threshold is saved.
1
1
1
6-42
Configuring alarms
Alarm messages
1. Click the Alarm Messages tab.
2. Select the file and printer messages for when a tag goes out of
alarm and when an operator acknowledges an alarm.
If you click Custom Message, type the message in the File and/or
Printer fields. You can use both words and placeholders.
For detailed information about messages, see “Configuring alarm
messages” on page 6-34.
1
1
6-43 1
Configuring alarms
Advanced
1. Click the Advanced tab.
2. Fill in the fields as follows:
Alarm Identification
Type a command or macro file name, or click the Selection button
to open the Command Wizard.
Selection button
This command or macro runs in RSView32 when you highlight
the alarm in the alarm summary and click Alarm Identify on the
menu. The command or macro also runs when you use the
Identify command, whether or not the tag is in alarm.
Out of Alarm Label
Type a message up to 21 characters long that will be displayed in
the alarm summary when the tag is no longer in alarm. This
message can also appear in the alarm banner, if the banner is
configured to display it.
1
1
1
6-44
Configuring alarms
Deadband
Click Absolute or Percentage and then type a value.
The deadband is a buffer zone on the edge of an alarm threshold.
For more information, see “Deadband” on page 6-5.
Alarm Acknowledge
In the Acknowledge Bit field, type the name of the tag that refers
to the acknowledge bit’s address. When the operator
acknowledges the alarm, the acknowledge bit is set to 1 and
RSView32 logs an alarm acknowledgment.
When another RSView32 station detects the acknowledge bit
changing from 0 to 1, the RSView32 station acknowledges all tags
associated with this acknowledge bit and RSView32 logs a remote
acknowledgment to the alarm log file. The bit is set only once per
acknowledgment.
To have the acknowledge bit automatically reset (set back to 0)
when the tag goes back into alarm, check the Auto Reset box.
Otherwise the programmable controller must reset the bit.
For more information, see “Acknowledge bit (globally
acknowledging alarms)” on page 6-16.
Alarm Handshake
In the Handshake Bit field, type the name of the tag that refers to
the handshake bit’s address. When a tag goes into alarm, the
handshake bit is set to 1.
To have the handshake bit automatically reset (set back to 0) when
the tag goes out of alarm, check the Auto Reset box. Otherwise
the programmable controller must reset the bit.
For more information, see “Handshake bit” on page 6-18.
1
1
6-45 1
Configuring alarms
Configuring alarms for digital tags
These are the main steps to configure alarms for digital tags:
configure alarm states
configure the messages that are sent when a tag goes out of alarm
and when an operator acknowledges an alarm
configure advanced features, such as handshake
Alarm states
1. Click the Alarm States tab.
2. Fill in the fields as follows:
Alarm Type
Select a type.
For a description of types, see “Alarms for digital tags” on
page 6-7.
1
1
1
6-46
Configuring alarms
Alarm Label
Type a description of the alarm up to 21 characters long. This
description is displayed in the alarm summary and alarm banner.
Severity
Select a severity level. Severity 1 is most severe, Severity 8 is least
severe.
Severities are configured in the Alarm Setup editor. For details, see
“Configuring alarm severity” on page 6-32.
In Alarm Messages
Select the message you want when a tag changes state and goes
into alarm.
If you click Custom Message, type the message in the File and/or
Printer fields. You can use both words and placeholders.
For detailed information about messages, see “Configuring alarm
messages” on page 6-34.
1
1
6-47 1
Configuring alarms
Alarm messages
1. Click the Alarm Messages tab.
2. Select the the file and printer messages for when a tag goes out of
alarm and when an operator acknowledges an alarm.
If you click Custom Message, type the message into the File
and/or Printer fields. You can use both words and placeholders.
For detailed information about messages, see “Configuring alarm
messages” on page 6-34.
1
1
1
6-48
Configuring alarms
Advanced
1. Click the Advanced tab.
2. Fill in the fields as follows:
Alarm Identification
Type an RSView32 command or a macro, or click the Selection
button to open the Command Wizard.
Selection button
This command or macro runs in RSView32 when you highlight
the alarm in the alarm summary and click Alarm Identify on the
menu. The command or macro also runs when you use the
Identify command, whether or not the tag is in alarm.
1
1
6-49 1
Configuring alarms
Out of Alarm Label
Type a message up to 21 characters long that will be displayed in
the alarm summary when the tag is no longer in alarm. This
message can also appear in the alarm banner, if the banner is
configured to display it.
Alarm Acknowledge
In the Acknowledge Bit field, type the name of the tag that refers
to the acknowledge bit’s address. When the operator
acknowledges the alarm, the acknowledge bit is set to 1 and
RSView32 logs an alarm acknowledgment.
When another RSView32 station detects the acknowledge bit
changing from 0 to 1, the RSView32 station acknowledges all tags
associated with this acknowledge bit and RSView32 logs a remote
acknowledgment to the alarm log file. The bit is set only once per
acknowledgment.
To have the acknowledge bit automatically reset (set back to 0)
when the tag goes back into alarm, check the Auto Reset box.
Otherwise the programmable controller must reset the bit.
For more information, see “Acknowledge bit (globally
acknowledging alarms)” on page 6-16.
Alarm Handshake
In the Handshake Bit field, type the name of the tag that refers to
the handshake bit’s address. When a tag goes into alarm, the
handshake bit is set to 1.
To have the handshake bit automatically reset (set back to 0) when
the tag goes out of alarm, check the Auto Reset box. Otherwise
the programmable controller must reset the bit.
The bit cannot be reset automatically for tags with a change of
state alarm type (Any Change, Changes to On, or Changes
to Off).
For more information, see “Handshake bit” on page 6-18.
1
1
1
6-50
Configuring alarms
Viewing the alarm log file
The Alarm Log Viewer displays the description, user, and logging
station fields from the alarm log file. The contents of this file will
depend on how you configured alarm severities in the Alarm Setup
editor. By default, the alarm log file will have a record of all alarms
that are generated. 5
For information about all the fields in the alarm log file, see
page 16-9.
To view the alarm log file:
1. In the Project Manager, open the Alarms folder.
2. Open the Alarm Log Viewer by doing one of the following:
double-click the Alarm Log Viewer icon
right-click the Alarm Log Viewer icon and then click Show
The Alarm Log Viewer opens, displaying the contents of the most
recent log file.
1
1
6-51 1
Configuring alarms
3. To select another file for viewing, click Select Log File on the
Records menu.
One or more log files is displayed. The number of files depends on
how you set up file management in the Alarm Setup editor.
4. Click the file you want to view. The contents of the file are then
displayed in the viewer.
5. To close the viewer, click Close on the File menu.
Creating an alarm summary
The alarm summary displays the alarms recorded in the computer’s
memory. To configure an alarm summary, specify what data to
display and create the format you want the data to appear in.
At runtime, operators can use the alarm summary to view and
interact with the alarms.
To create an alarm summary, you can:
use the Alarm Summary editor in the Project Manager
use the Alarm Summary tool in the Graphic Display editor
No matter where you create the alarm summary, you use the same
methods to customize how the information will appear.
1
1
1
6-52
Configuring alarms
Embedding the alarm summary as an object in a graphic display
offers better screen management than creating an alarm summary
file. When the summary is embedded in a graphic display you can
use the Display command, which allows you to specify screen
properties such as size and position. You can also use the Cache
After Displaying and Allow Multiple Running Copies options in the
Display Settings dialog box.
Creating an alarm summary file
1. In the Project Manager, open the Alarms folder.
2. Open the Alarm Summary editor by doing one of the following:
double-click the Alarm Summary icon
right-click the Alarm Summary icon and then click New
An empty alarm summary window appears. You can configure all
aspects of this window’s appearance.
3. Configure the appearance of the alarm summary as described on
the following pages.
4. When you are finished, click Save on the File menu.
5. Type a file name.
The file you have created is listed in the right pane of the Project
Manager. At runtime, use the Summary command to display the
alarm summary.
1
1
6-53 1
Configuring alarms
Creating an alarm summary object
An alarm summary object can be part of a graphic display or it can
be the entire graphic display. You can use the pre-built alarm
summary, called Alarm Information, in the graphics objects library,
or you can create your own alarm summary object.
To create the alarm summary object:
1. Open a graphic display.
2. On the Objects menu, click Advanced Objects, and then click
Alarm Summary. The cursor changes to the Alarm Summary tool:
3. Drag the mouse to create a box approximately the size you want
for the alarm summary.
When you release the mouse, an empty alarm summary window
appears. The menu bar changes to display the menus for the
Alarm Summary editor.
4. Configure the appearance of the alarm summary object as
described on the following pages.
You can edit the alarm summary object as you would any other
graphic object. You can move it, resize it, and so on. You can also
use this object in other graphic displays by dragging it from one
display and dropping it in another.
For detailed information about graphic objects, see Chapter 11,
Creating graphic displays.
5. When you are finished, save the graphic display.
1
1
1
6-54
Configuring alarms
The parts of an alarm summary
The alarm summary is a table for displaying information. You decide
how many columns you want the table to have, how wide the
columns will be, and what information the columns will contain.
A new alarm summary looks like this:
Header area: Use the
commands on the
Insert menu to insert
headings here.
Divider: Use the
mouse to move the
divider up and down.
Body area: The area
where alarm
information is
displayed at runtime.
Button bar: Use the
commands on the
Format menu to
specify what buttons
to include on this bar
and to specify where
to place the bar.
1
1
6-55 1
Configuring alarms
Inserting headings
The Insert menu contains the items that can appear in the summary.
To add a heading for an item, click the item on the Insert menu. You
can add as many items as you want and place them in any order you
want.
When you click an item on the Insert menu, two boxes appear in
the alarm summary. Drag the boxes to position them. When you
release the mouse button, the item name appears.
To reposition items, click them and drag them with the mouse. To
resize items, click them and then drag a handle with the mouse. To
change an item, you only have to select one box—when you move or
resize one box, the other box is also moved or resized.
1
1
1
6-56
Configuring alarms
To edit the the text in a box, double-click the box. The Modify Text
dialog box appears. Type the new text in the To field, and then click
OK.
Choosing fonts
The header and body fonts can be different. For example, you might
choose a larger font for the header and a smaller font for the body.
To change a font, click Font on the Format menu.
The fonts listed here
depend on which fonts
you have installed in
Windows.
Choose the font, style, and size you want. When you are finished,
click OK.
To increase the size of the header area so a large font is more easily
displayed, drag the divider down.
1
1
6-57 1
Configuring alarms
Choosing colors and blink styles
You can configure the color of:
Severity 1 through 8 messages
Out of Alarm and Fault State messages
Header, body, and button areas
You can configure the blink style of:
Severity 1 through 8 messages
Out of Alarm and Fault State messages
To configure colors and blink styles, click Colors on the Format
menu.
Blink colors appear
to the right of the
solid colors when you
select Blink.
Click an item and then select the colors you want. To select a color,
place the cursor over the color box, click to open the color palette,
and then click a color in the palette. To configure the blink style for
an item’s state, click Blink and select the blink colors.
If you use the blink option for any item’s state, specify a blink rate in
the Blink Rate field. The blink rate applies to all items that use the
blink option in this alarm summary.
1
1
1
6-58
Configuring alarms
Text and Background are the colors the message initially appears in.
If you select the blink option, the default blink colors are the text
and background colors reversed.
Highlight Text and Highlight Background are the colors the message
changes to when it is selected. If you select the blink option, the
default colors are the highlight text and highlight background colors
reversed.
When you are finished, click OK.
Formatting buttons
You can specify which buttons you want on the button bar and
where you want the bar located.
To choose which buttons to include, click Buttons on the Format
menu. The Buttons dialog box appears. If you do not want certain
buttons displayed, clear the check boxes for those buttons. When
you are finished, click OK.
If you select the Execute check box, the Execute Command dialog
box appears. For information about using the Execute button, see
page 6-66.
1
1
6-59 1
Configuring alarms
The following table describes what the buttons do:
This button
Does this
Ack Current
Marks the highlighted alarm as acknowledged. If a bell is associated
with the alarm, acknowledging the alarm turns off the bell. If the tag has
gone out of alarm, it is removed from the alarm summary when it is
acknowledged.
Ack Page
Marks all alarms on the screen as acknowledged. If a bell is associated
with an alarm, acknowledging the alarm turns off the bell. If a tag has
gone out of alarm, it is removed from the alarm summary when it is
acknowledged.
Ack All
Marks all alarms in the alarm summary as acknowledged. If a bell is
associated with an alarm, acknowledging the alarm turns off the bell. If a
tag has gone out of alarm, it is removed from the alarm summary when
it is acknowledged.
Silence
Current
If the highlighted alarm is configured to set off the internal bell, silences
the computer’s sound.
If the highlighted alarm is configured to set off the external bell, resets
the associated bit in the programmable controller.
Silence Page
If any alarms on the screen are configured to set off the internal bell,
silences the computer’s sound.
If any alarms on the screen are configured to set off the external bell,
resets the associated bits in the programmable controller.
Silence All
If any alarms in the alarm summary are configured to set off the internal
bell, silences the computer’s sound.
If any alarms in the alarm summary are configured to set off the
external bell, resets the associated bits in the programmable controller.
Execute
Runs a command, macro, or VBA program, if one was assigned to the
Execute button. You can pass parameters from the highlighted alarm
(for example the tag name) to the command, macro, or VBA program.
Identify
Runs a macro for the alarm if one was created and entered in the Alarm
Identification field of the Advanced tab in the Analog Alarm or Digital
Alarm editor.
Filter
Opens the Filter dialog box, so alarm information can be temporarily
filtered out of the alarm summary.
Sort
Opens the Sort dialog box, so alarm information can be temporarily
sorted.
In addition to providing Filter and Sort buttons that the operator can
use at runtime, you can permanently filter or sort alarms at design
time. The result of the design time filter or sort operation will be
retained each time the summary is activated at runtime. For more
information see “Choosing data” on page 6-62.
1
1
1
6-60
Configuring alarms
Changing the button text
To change the text that is displayed on any of the buttons in an alarm
summary, double-click the button, then type the new button text in
the Text box.
To change the keyboard accelerator key that is used to activate the
button from the keyboard at runtime, type an ampersand character
(&) in front of the character you want to use as the accelerator key.
For example, to use Alt-X to activate the Execute button, type
E&xecute in the text box.
Positioning the button bar
To specify the location of the button bar, click Button Bar Position
on the Format menu, and then click a location. In the following
illustration, Left was chosen as the button bar position.
1
1
6-61 1
Configuring alarms
Choosing data
Use the Filter and Sort items in the Data menu to specify which
alarm information is displayed. Use Filter to filter out
information—that is, to specify information you do not want
displayed in the alarm summary. Use Sort to specify the order in
which alarm information is displayed.
Alarm information can be filtered and sorted at runtime, but changes
are not saved.
Filtering data
To filter data, click Filter on the Data menu. The Filter dialog box
opens. If a check box is selected, the information is included in the
alarm summary. Clear the check boxes for information you want
excluded from the alarm summary.
You can use
wildcards or tag
placeholders in
the alarm
summary filter.
1
1
1
6-62
Configuring alarms
Tag Names
Specify the tag names you want to appear in the alarm summary,
entering each tag on a separate line. You can use wildcards to select
tags. These are the wildcards:
This wildcard
Does this
*
Matches any number of characters, including the
backslash (\) character.
?
Matches any single character.
~
When placed before a tag name, excludes the tag. When
placed before a folder name, excludes the tags in the
folder.
By default, the Tag Names field contains an *, which means all tags
are displayed.
If the alarm summary is an object embedded within a graphic
display, you can also use tag placeholders to specify the tag names to
appear in the alarm summary. A tag placeholder is the cross-hatch
character (#) followed by a number from 1 to 500. The placeholder
can also contain wildcards and folder names. See “Using tag
placeholders” on page 11-37 for more information.
If you use tag placeholders, at runtime you must specify the tag each
placeholder represents, either by using a parameter file or by typing
the tag names on the command line. You can also use wildcards in
the parameter file or on the command line.
1
1
6-63 1
Configuring alarms
Example: Using a parameter file to replace tag placeholders
The parameter file called Beans specifies which tags to use for the
placeholders in a display:
#1 = bean_weight
#2 = bean_level
#3 = bean_temp
To run the display called Canning with the Beans parameter file,
type:
Display Canning /PBeans
For more information see “Using a parameter file to replace tag
placeholders” on page 11-38 and “Listing tag names to replace tag
placeholders” on page 11-40.
Tag Type
Only the tag types that are checked will appear in the alarm
summary. To include all alarms, leave both Analog and Digital
checked.
Alarm States
If you want a message to appear in the alarm summary when an
alarm is in fault or when a tag goes out of alarm, leave both Faults
and Out of Alarm checked.
If you leave the Out of Alarm state unchecked, the alarm summary
item changes color when the tag goes out of alarm. Tags that are out
of alarm remain in the alarm summary until they are acknowledged.
If you want to see only the tags that are in alarm in the summary,
click Only show tags currently In Alarm. Digital change of state
alarms and InAndOutOfAlarm events are not displayed in the alarm
summary when you select this checkbox.
1
1
1
6-64
Configuring alarms
Alarm Severities
To include alarms of all severities, leave all boxes checked. To exclude
an alarm severity, clear its check box.
Out of alarm messages do not have severities, so if you select the
Out of Alarm option all out of alarm messages will be shown
whether or not you show the InAlarm message for a given severity.
Sorting data
To sort data, click Sort on the Data menu. You can specify three
levels of sorting.
By default, alarm information is sorted first by date and time, then
by severity, and finally by tag name. This means that the alarms will
be presented chronologically. If two or more alarms have the same
time and date, these alarms are presented in order of severity. If any
alarms have the same time and date and the same severity, they are
then presented by tag name.
You can sort data that has been filtered.
1
1
6-65 1
Configuring alarms
Using alarm data with commands
Use the Execute item in the Data menu to execute a command
(whether an RSView32 command, an RSView32 macro, or a VBA
program) and to append data items derived from the highlighted
alarm to the command.
Alarm information is appended to the command in the same order in
which the parameters appear in the dialog box. Parameters are
separated by a space, unless you click Separate Parameters with
commas.
IMPORTANT A space is not automatically appended to the end of the command
text. If you are using parameters and require a space between the end
of the command, macro, or VBA program and the first parameter, be
sure to include the space with the command text.
Severity and value are shown only for alarms of type IntoAlarm. For
alarm types OutOfAlarm and IntoFault, severity is 0.
1
1
1
6-66
Configuring alarms
If you configure the Execute button to run a VBA program, and you
copy the alarm summary from one project to another project, you
must ensure that the VBA program is available in the new project,
otherwise the Execute button will not run the VBA program.
When passing parameters to VBA programs, you must select the
checkbox Separate Parameters with commas.
Example: Using the AlarmLogRemark command with the Execute
button in an alarm summary
You cannot change the order in which parameters are passed to the
command line for the alarm summary Execute button. To use the
alarm summary Execute button with the AlarmLogRemark
command, and have the tag name added correctly to the
AlarmLogRemark’s /T argument, you must make sure that the tag
name argument (/T) appears last on the command line:
For details about using the AlarmLogRemark command, see
“Adding remarks to the alarm log file at runtime” on page 6-38, and
see Appendix A, RSView32 commands, or see Help.
1
1
6-67 1
Configuring alarms
Suppressing alarm printing
You can stop all alarms from printing, while continuing to log alarms
to the alarm log file. This is useful for testing or performing repairs
or maintenance on equipment.
To suppress alarm printing for all tags, use the RSView32
AlarmPrintOff command. To re-enable printing of alarms, use the
RSView32 AlarmPrintOn command.
Alarms will print when the AlarmOn command is issued, unless the
AlarmPrintOff command was issued before the AlarmOn command
was issued in the same session of RSView32. The AlarmPrintOff and
AlarmPrintOn commands are not retained across RSView32
sessions.
The AlarmPrintOff and AlarmPrintOn commands have no
arguments.
Suppressing alarm monitoring
You can suppress alarm monitoring for tags. This is useful for testing
or performing repairs or maintenance on a piece of equipment.
To suppress alarm monitoring for tags, use the RSView32
SuppressOn command. To suppress all alarms for the specified tags,
issue the SuppressOn command before the AlarmOn command.
To view a list of the tags not being monitored, use the Suppressed
List. You can also turn monitoring back on from this list.
The SuppressOn command is not retained after an AlarmOff
command is issued. The Suppressed List is therefore empty after the
AlarmOff command is issued.
1
1
1
6-68
Configuring alarms
Suppressing alarm monitoring for tags
1. Open the command line.
2. Type the following RSView32 command and press Enter:
SuppressOn <tag name>
To suppress more than one tag, use a wildcard.
The wildcards are:
This wildcard
Does this
*
Matches any number of characters, including the
backslash (\) character.
?
Matches any single character.
Viewing suppressed tags
The Suppressed List shows which tags are suppressed—that is, which
tags are not being monitored for alarms.
To open the Suppressed List:
1. In the Project Manager, open the Alarms folder.
2. Open the Suppressed List editor by doing one of the following:
double-click the Suppressed List icon
right-click the Suppressed List icon and then click Show
1
1
6-69 1
Configuring alarms
Using the Suppressed List
Use the Suppressed List to see which tags are not being monitored
for alarms and to turn alarm monitoring back on.
Click a tag name and then
click here to turn off
suppression for that tag.
Click here to turn off
suppression for all tags.
More RSView32 commands
You can also use RSView32 commands to turn off suppression and
to open the Suppressed List. For details, see Appendix A, RSView32
commands, or see Help.
1
1
1
6-70
Configuring alarms
Starting and stopping alarm monitoring
There are many ways to start and stop alarm monitoring. Choose the
way that works best for your project.
For a complete list of RSView32 commands and their command
syntax, see Appendix A, RSView32 commands, or see Help.
Ways to start alarm monitoring
In the Startup editor, select the Alarming check box.
In the Macro editor, create a startup or login macro and include
the AlarmOn command.
In the Graphic Display editor, create a button object and specify
the AlarmOn command as the press action. When the button is
pressed, alarm monitoring starts.
In the Graphic Display editor, create a graphic object and attach
touch animation with the AlarmOn command as the action. When
the object is touched, alarm monitoring starts.
In the Events editor, specify the AlarmOn command as the action
for an event.
On the command line, type AlarmOn and then press Enter.
In the Graphic Display editor, specify the AlarmOn command in
the Startup field in the Display Settings dialog box.
1
1
6-71 1
Configuring alarms
Ways to stop alarm monitoring
When a project stops, alarm monitoring stops as well. To stop alarm
monitoring without stopping the project, use any of the methods
below.
In the Graphic Display editor, create a button object and specify
the AlarmOff command as the press action. When the button is
pressed, alarm monitoring stops.
In the Graphic Display editor, create a graphic object and attach
touch animation with the AlarmOff command as the action.
When the object is touched, alarm monitoring stops.
In the Events editor, specify the AlarmOff command as the action
for an event.
On the command line, type AlarmOff and then press Enter.
1
1
1
6-72
7
Configuring data logging
Data log is an RSView32 component that collects and stores tag
values (data). You specify the type of data to collect, when to collect
it, and where to store it by defining a data log model.
The data that is collected is stored in dBASE IV (.dbf) format or
ODBC (Open Database Connectivity) format.
You can display the data in trends, archive it for future use, or
analyze it using third-party software, such as Microsoft Excel,
Seagate Crystal ReportsZ, and Microsoft Visual FoxProZ.
What is a model?
A data log model defines which tags to log data for, when to log the
data, and what file to log the data to. In the model you also specify
the format of the log files (dBASE IV or ODBC) and when to create
and delete the files.
How to use multiple data log models
At runtime, up to 20 models can run simultaneously. Use multiple
data log models to:
store related information in separate files
log groups of tags at different rates
log groups of tags based on events
1
1
7-1 1
Configuring data logging
Summary of steps
To set up a data log model, specify:
what format to use
where to store data log data (primary and secondary paths)
when to create and delete log data
what actions will trigger logging
which tags to log data for
what to call the model
About data log storage formats
For easy access, logged data is stored in either dBASE IV (.dbf)
format or using the ODBC connectivity standard.
If you use the dBASE IV format, data log files are created in sets.
The number of files in a set depends on the .dbf file format you
choose (narrow or wide). Each file in the set contains a particular
type of data. 3.
If you use the ODBC format, tag values are logged to tables in an
ODBC database. This allows you to use third-party
ODBC-compliant relational database software to retrieve and
manipulate the data. If the database becomes inaccessible, RSView32
logs the data to backup files in binary format.
If you need to use data in multiple formats, define multiple data log
models for the same tags.
1
1
1
7-2
Configuring data logging
The .dbf file format
Data logged in the .dbf format can be stored in narrow or wide
format. The data file names vary depending on which format you
choose.
Narrow .dbf file format
The narrow .dbf format stores one date, one time, and one tag value
per line. The following figure shows how tag values are stored in the
file. For a detailed description of the file’s contents, see page 16-12.
This is one
snapshot of data.
'DWH
7LPH
7DJ YDOXH
'DWH
7LPH
7DJ YDOXH
'DWH
7LPH
7DJ YDOXH
'DWH
7LPH
7DJ YDOXH
'DWH
7LPH
7DJ YDOXH
'DWH
7LPH
7DJ YDOXH
Wide .dbf file format
The wide .dbf format stores one date, one time, and multiple tag
values per line. The following figure shows how tag values are stored
in the file. For a detailed description of the file’s contents, see page
16-13.
This is one
snapshot of data.
'DWH
7LPH
7DJ YDOXH
7DJ YDOXH
7DJ YDOXH
'DWH
7LPH
7DJ YDOXH
7DJ YDOXH
7DJ YDOXH
'DWH
7LPH
7DJ YDOXH
7DJ YDOXH
7DJ YDOXH
'DWH
7LPH
7DJ YDOXH
7DJ YDOXH
7DJ YDOXH
'DWH
7LPH
7DJ YDOXH
7DJ YDOXH
7DJ YDOXH
'DWH
7LPH
7DJ YDOXH
7DJ YDOXH
7DJ YDOXH
1
1
7-3 1
Configuring data logging
Choosing between narrow and wide .dbf file formats
The following table summarizes the features of each file format:
Narrow
Wide
Limit of 10,000 tags in the model.
Limit of 100 tags in the model.
Most useful for storing data that changes
infrequently (as in on-change logging).
Most useful for storing frequently changing
data (as in periodic logging). Particularly
useful for storing data from batch
applications.
Data is harder to use for sums and
averages because it crosses rows.
Data is more easily used for sums and
averages because it is all in one column.
Does not create a new log file set if tags
are added to or deleted from the model.
Creates a new log file set if tags are added
to or deleted from the model.
Stores numeric and string values in
separate files.
Stores numeric and string values in the
same file.
Preferred for queries because you can join
tables.
Can’t join tables for queries.
How .dbf log files are named
When a .dbf log file is created, it is named automatically. The name is
based on the date the file was created and the type of data it contains.
Long file names
RSView32 gives you the option to use long file names. When you
choose this option, at runtime RSView32 creates data log files with
long file names unless either the primary or secondary path does not
support long file names, or unless either path is inaccessible when
data logging starts. The maximum data log file name, including path,
is 200 characters. This is the format for the name:
YYYY MM DD NNNN <Log File Identifier String> <(type)>.dbf
YYYY is the year
MM is the month
DD is the day
NNNN is the sequential file identifier. This number indicates the
sequence files were created in. You can have up to 9999 file sets
per day. At midnight, the sequence starts at 0000 again.
1
1
1
7-4
Configuring data logging
<Log File Identifier String> is a text string you can specify to help
identify the log file. The maximum string length is 20 characters.
<(type)> is the file type. Note that the type is enclosed in
parentheses. Narrow format has three file types: Tagname, Float
(for analog and digital tag values), and String. Wide format has
two file types: Tagname and Wide. The Wide type stores both
floating point and string values.
Example: Long file name
The log file named 1997 10 28 0004 Oven Temperatures (Wide).dbf
was created in the year 1997, month 10, and day 28. The 0004
indicates that this is the fourth file set created that day. Oven
Temperatures is the log file identifier string, which the user defined
to help identify the data. (Wide) indicates that this file is in wide file
format and may contain both floating point and string tag data.
Short file names
RSView32 uses 8-character file names if you do not choose to use
long file names, or if either the primary or secondary path does not
support long file names, or if either path is inaccessible when data
logging starts. This is the format for 8-character file names:
YYMMDDnz.dbf
YY is the year
MM is the month
DD is the day
n is the sequence letter (a, b, c, and so on). This letter indicates the
sequence files were created in. You can have up to 26 file sets (a to
z) per day. If you attempt to create a 27th file, RSView32
continues logging data to the 26th file. At midnight, the sequence
starts at “a” again.
1
1
7-5 1
Configuring data logging
z is the file type. Narrow format has three file types: t for tag
names, f for floating point (analog and digital tag) values, and s for
string tag values. Wide format has a two file types: t for tag names
and w for wide. The w file stores both floating point and string
values.
Example of short file names for narrow .dbf format
For narrow .dbf file format, data log files are created in sets of three.
Even if your project does not contain a particular type of data, three
files are created. If data is not available for a file, the file remains
empty.
Example: Log file name
The log file named 971028cs.dbf was created in the year 97, month
10, and day 28. The c indicates that this is the third file set created
that day. The s indicates that this is a file containing string tag data.
Example: Log file set
If you were to look in the directory containing the data log files, you
would find three files with almost the same name.
971028ct.dbf
contains the tag name data
971028cf.dbf
contains the floating point data from analog and
digital tags
971028cs.dbf contains the data from string tags
1
1
1
7-6
Configuring data logging
Example of short file names for wide .dbf format
For wide .dbf file format, data log files are created in sets of two.
Example: Log file name
The log file named 971028dw.dbf was created in the year 97, month
10, and day 28. The d indicates that this is the fourth file set created
that day. The w indicates that this file is in wide file format and may
contain both floating point and string tag data.
Example: Log file set
If you were to look in the directory containing the data log files, you
would find two files with almost the same name.
971028dt.dbf contains the tag name data
971028dw.dbf contains the floating point data from analog and
digital tags and the string data from string tags
1
1
7-7 1
Configuring data logging
The ODBC storage format
Use the ODBC storage format to store your data using an ODBC
data source such as Microsoft Access or Microsoft SQL Server. The
ODBC format stores data in up to three tables, similar to narrow
format:
Tag table (optional)—stores tag names in an index so they can be
referenced using a 2- or 4-byte numeric field (rather than a
40-byte character field) in the float and string tables
Float table—stores analog and digital tag values
String table (optional)—stores string tag values
For a detailed description of the tables’ contents, see page 16-15.
ODBC backup files are stored as binary files with the extension .obf.
You cannot view the contents of the .obf files.
How ODBC tables are named
The ODBC tables are created with the default names TagTable,
FloatTable, and StringTable. However, you can edit these names
before creating the tables, or specify different tables to use, in the
Data Log Setup dialog box. If you specify a backup path for an
ODBC model, RSView32 names the backup log files as described for
narrow .dbf files. If you use long file names you can specify a log file
identifier string for the backup file names.
Using an existing ODBC data source
You can log data to an existing ODBC data source, but its tables
must contain fields that are formatted for the RSView32 data log.
There are two ways to prepare tables for data logging to an existing
database:
set up the RSView32 data log fields in the existing ODBC tables
before setting up your data log model
automatically or manually create new tables in the existing
database in the Data Log Setup dialog box
1
1
1
7-8
Configuring data logging
To use the tables in an existing ODBC data source:
1. Add fields for the data log data to the tables in the ODBC
database. See the example on page 7-16 for information about
adding fields to an existing table.
“Data log—ODBC format” on page 16-15 describes the order and
type of fields needed to log data to an ODBC database. Edit the
tables as described in the documentation for the ODBC relational
database you are using.
2. Set up your data log model, as described in “Setting up a model”
on page 7-11. Specify the existing ODBC database as the ODBC
Data Source, and specify the tables you edited.
To create new tables in an existing ODBC data source:
1. Specify the name of the existing ODBC data source in the ODBC
Data Source field of the Data Log Setup editor. See “Setting up a
model” on page 7-11 for more information.
2. Click Create Tables. RSView32 automatically creates new data log
tables in the existing database. You can also create tables manually,
as described in the example on page 7-16.
3. Set up the rest of your data log model, as described in “Setting up
a model” on page 7-11.
Creating a new ODBC data source
You can also create a new ODBC data source when you set up your
data log model, as described in “Setting up a model” on page 7-11.
RSView32 can create the ODBC tables automatically, or you can
create the tables manually. See page 7-16 for an example of how to
create a new ODBC data source.
1
1
7-9 1
Configuring data logging
The Data Log Setup editor
To open the Data Log Setup editor:
1. In the Project Manager, open the Data Log folder.
2. Open the Data Log Setup editor by doing one of the following:
double-click the Data Log Setup icon
right-click the Data Log Setup icon and then click New
Set up general
aspects of the model.
Specify the paths to
which to log the
data.
Specify when you
want log data
created and deleted.
Specify how and
when logging should
occur.
Specify which tags
to log data for.
1
1
1
7-10
Configuring data logging
Setting up a model
1. In the Data Log Setup editor, click the Setup tab.
2. Type a description of the model. This is for your information
only.
3. Specify whether to use long file names for the data log files.
If you choose to use long file names, type a log file identifier
string, up to 20 characters. This string of text forms part of the file
name for the data log files. For more information about long file
names see “Long file names” on page 7-4.
If you choose the ODBC storage format in step 4, long file names
apply to the backup files only.
You can change the log file identifier string at runtime, as
described on page 7-45. However, the runtime change affects the
current data log session only. When you stop and restart the
model RSView32 uses the string you set up here.
4. Click a file storage format.
Narrow dBASE IV format stores one tag value per line, with
multiple time and date stamps per record. Wide dBASE IV format
stores multiple tag values per line, with one time and date stamp
per record. For more information about dBASE IV (.dbf) log file
formats see “The .dbf file format” on page 7-2.
ODBC format logs tag values to tables in an ODBC database. For
more information about ODBC tables see “The ODBC storage
format” on page 7-8. If you choose this format, go to step 6.
1
1
7-11 1
Configuring data logging
5. If you chose the dBase IV (Narrow) or dBase IV (Wide) storage
format in step 4, specify storage options for the .dbf log file.
Number of Digits (including decimal point)
Type the number of digits, including the decimal point, to be
stored for floating point numbers. Use this field and the Digits
After Decimal Point field to achieve the precision you want.
These fields apply to
floating point data.
This field applies to
string data.
This field
specifies the
total width that
can be stored.
Digits After Decimal Point
Type the number of digits after the decimal point that are to be
stored for floating point numbers. Use this field and the Number
of Digits field to achieve the precision you want. For example, if
your process has very large numbers, you can increase the total
number of digits and reduce the number of digits after the decimal
point.
Number of Characters in String
Type the number of characters to be logged for all string tags in
the model.
Log Milliseconds in Separate Field
Specify whether to log the millisecond portion of the time in a
separate field in the .dbf file. If you do not select this option the
milliseconds are logged in the time field.
1
1
1
7-12
Configuring data logging
When you have finished specifying options for the dBASE IV
storage format, go to “Setting up logging paths” on page 7-21.
6. If you chose the ODBC storage format in step 4, specify the
ODBC data source.
Type the path and file name of an existing ODBC data source, or
click ... to select an existing data source or create a new one.
1
1
7-13 1
Configuring data logging
If you click ... the Select Data Source dialog box appears.
To use an existing file-based ODBC data source, select it from
the Data Source Name list box or click ... to browse for the file
folder that contains the data source.
To use an existing machine-based ODBC data source, click the
Machine Data Source tab and select it from the list box.
To use a new ODBC data source, click the File Data Source or
Machine Data Source tab, then click the New button. The
Windows 9x or Windows NT Create New Data Source wizard
appears. Follow the instructions on screen to create the new
ODBC data source. For an example of how to create a new
ODBC data source, see page 7-16.
1
1
1
7-14
Configuring data logging
7. Specify one or more ODBC tables. See “The ODBC storage
format” on page 7-8 for a description of each table’s purpose.
To choose a table from the existing tables at the data source,
click the ... button. Select a table from the Select ODBC Table
dialog box that appears. To view the order, type, length, and
precision of the fields in the table, highlight the table and click
Details.
If you don’t specify a table name for the tag table, the tag name
is used instead of a tag index in the float and string tables. This
uses more database space than using a separate tag table.
When you save the data log model, RSView32 informs you if
the fields in a selected table are not in the order or of the type
required to log data. In this case you must edit the table as
described in the documentation for the ODBC relational
database you are using. See “Data log—ODBC format” on
page 16-15 for information about the order and type of fields
needed to log data to an ODBC database.
To automatically create the tables at the data source you
specified, type the table names to use in the table fields, then
click Create Tables. Delete the name in a table field if you don’t
want to create that table.
If RSView32 is unable to create the tables automatically, you
must create the tables manually. Follow the instructions in
“Using an existing ODBC data source” on page 7-8, or see the
example, next.
If RSView32 cannot create an index automatically, a message
informs you that you must create it manually, as described in
the example on page 7-20.
8. If the ODBC database you are using requires that you enter a
password to connect to it, click the Login Required checkbox and
enter your user ID and password. The use of this option is
database-dependent. For example, you must log in to SQL Server,
but you may not need to log in to Microsoft Access, depending on
how your database is configured.
1
1
7-15 1
Configuring data logging
Example: Creating a new ODBC data source
This example shows how to create a new ODBC data source that
connects to an SQL Server database called Bakery. The SQL Server is
called Athena. The new data source will be called Bakery_Stats.
The data source will be used on the current computer only, but will
be used by multiple users at the computer. In this example, you will
set up the ODBC data log tables manually using Microsoft Query.
First, create the ODBC data source. Then set up the ODBC tables.
To create the ODBC data source:
1. In the Setup page of the Data Log Setup editor, choose the ODBC
storage format and click ... beside the ODBC Data Source field.
2. In the Select Data Source dialog box, click the Machine Data
Source tab and click New.
1
1
1
7-16
Configuring data logging
3. In the Create New Data Source dialog box, select System Data
Source, then click Next.
4. Select SQL Server from the list of ODBC drivers installed on the
computer, and click Next. Click Finish.
5. In the ODBC SQL Server Setup dialog box, enter the data source
name (Bakery_Stats) and a description.
1
1
7-17 1
Configuring data logging
6. In the Server field, select Athena, the name of the server where the
SQL database is located. Click Options.
7. In the Database Name field, type Bakery, the name of the SQL
database to log the data to.
8. Deselect Generate Stored Procedure for Prepared Statement.
Click OK.
9. In the Select Data Source dialog box, select Bakery_Stats and click
OK.
Note that you could also create the ODBC data source in the
Windows Control Panel, then select the data source in the ODBC
Data Source field of the Data Log Setup editor.
1
1
1
7-18
Configuring data logging
To set up the ODBC data tables:
You must have access to the SQL Server to log in and create the
tables.
1. Double-click Microsoft Query in the MSOffice directory and
choose Table Definition from the File menu.
2. In the Select Data Source dialog box, specify the data source you
just created and click Use. Enter your login ID and password.
3. Click New in the Select Table dialog box.
4. Enter information to set up the first field in a table called
TagTable:
Table Name:
TagTable
Field Name:
TagName
Type:
char
Length:
40
5. Click Add.
6. Enter the following to set up the second field in the table.
Field Name:
TagIndex
Type:
smallint
In the Type field, choose the type that most closely matches the
SQL Data Type for the field you are adding, as listed in the tables
on pages 16-15 to 16-16.
7. Enter the following to set up the third field in the table.
Field Name:
TagType
Type:
smallint
1
1
7-19 1
Configuring data logging
8. Enter the following to set up the fourth field in the table.
Field Name:
TagDataType
Type:
smallint
9. Click Create.
10. Repeat steps 4 through 7 to add the FloatTable and StringTable.
See page 16-15 for information about the field types and lengths.
If you want to edit a table that already exists, after you log in choose
the table name and click View. The order of the data log fields must
match the order listed in the tables on pages 16-15 to 16-16. If you
add the data log fields to an existing table, the data log fields must be
first. However, you can use different names for the data log fields.
To add an index for the FloatTable and StringTable:
1. In the Select Table dialog box, select FloatTable and click Index.
2. In the Index Name field, type FloatTableIndex.
3. In the Index Fields field select DateAndTime (or the name you
assigned to the first field in the FloatTable).
4. Click Add, then click Close.
5. Repeat steps 1 through 4 for the StringTable. Click Close.
Setting up an index for these tables enhances logging performance.
1
1
1
7-20
Configuring data logging
Setting up logging paths
Switching logging paths
RSView32 allows you to specify a secondary or backup path to log
data to if the primary path for .dbf files or the ODBC database
becomes unavailable. The primary path or ODBC database could
become unavailable because of network failures, or because of lack of
disk space on the primary path or where the ODBC database is
located.
If the primary path or ODBC database becomes unavailable,
RSView32 begins to store the data in a buffer. The buffer can hold up
to 64 Kb of data. When the buffer fills, or when the maximum
amount of time to buffer data has elapsed, if the primary path or
ODBC database is still unavailable RSView32 switches to the
secondary or backup path.
RSView32 checks periodically to determine whether the primary
.dbf file path or ODBC database has become available again. If the
primary path or ODBC database has become available, RSView32
switches back automatically.
RSView32 also checks the status of the primary path or ODBC
database if the secondary or backup path becomes unavailable, and
will switch back if possible. If both paths are unavailable, RSView32
buffers the data. If the buffer fills and both paths are still unavailable,
RSView32 empties the buffer (the data in the buffer is lost) and
begins storing new data in the buffer. RSView32 continues checking
both paths until one becomes available.
If the data log file is locked by another program, for example if it is
opened with Excel, data is buffered for the time specified for
Maximum Time To Buffer in the Advanced Configuration dialog,
and then a new set of files is created on the primary path. If the
secondary path is not configured, the data is buffered for 10 minutes
(the default value for maximum time). If the maximum time is set
to 0, a new file is started immediately.
1
1
7-21 1
Configuring data logging
If the model is logging to the secondary path and the file is locked,
the behavior is the same. That is, the data is buffered and then a new
file created when the specified time period has elapsed.
You can also switch back to the primary path or ODBC database
manually, using the DataLogSwitchBack command (see page 7-26)
or the DataLogMergeToPrimary command (see page 7-27).
For models that use the dBASE IV format, RSView32 creates a new
file set each time the logging path changes.
Specifying logging paths
You can specify the .dbf primary and secondary file paths and the
ODBC backup file path by editing the data log model in the
RSView32 Works Project Manager, as described next. You can also
change the logging paths at runtime using RSView32 Runtime, as
described in “Changing logging paths using RSView32 Runtime” on
page 7-42.
To specify .dbf primary and secondary file paths and ODBC backup file path:
1. In the Data Log Setup editor, click the Paths tab. If you are using
the ODBC storage format, go to step 3.
1
1
1
7-22
Configuring data logging
2. If you are using dBASE IV storage format, specify the primary
path where you want to store the .dbf data log files.
Relative To Project
Click this to store the log files in the project directory. RSView32
creates a directory called Dlglog and a subdirectory with the same
name as the model name and stores the files there.
Absolute Path
Click this to specify a particular path. If the path you type does
not exist, RSView32 will create it. The first time data logging runs,
RSView32 creates a subdirectory with the same name as the model
name and stores the files there.
1
1
7-23 1
Configuring data logging
3. Specify whether to enable RSView32 to switch to a secondary .dbf
file path or a backup path if the primary path or ODBC database
becomes unavailable. See “Switching logging paths” on page 7-21
for more information.
Relative To Project
Click this to store the secondary path or backup log files in the
project directory. RSView32 creates a directory called Dlglog and
a subdirectory with the same name as the model name and stores
the files there.
For .dbf data log files, if you used this default path as your
primary path, specify a different path for the secondary path.
Absolute Path
Click this to specify a particular path. If the path you type does
not exist, RSView32 will create it. The first time data logging runs,
RSView32 creates a subdirectory with the same name as the model
name and stores the files there.
4. If you choose to use a secondary or backup path, click Advanced.
Specify the parameters to use when switching between the
primary path or ODBC database and the secondary or backup
path.
Maximum time to buffer data before attempting switchover
(minutes)
If you specify 0, RSView32 switches over immediately and no data
is buffered.
The buffer can hold up to 64 Kb of data. If the buffer fills before
the specified time and the primary path is still unavailable,
RSView32 switches to the secondary path.
If the primary path becomes available before the maximum time,
RSView32 logs the data in the buffer to the primary path and
continues to use the primary path.
1
1
1
7-24
Configuring data logging
Note that the amount of time RSView32 buffers the data may vary
slightly from the time you specify, depending on the log rate for
periodic models or the frequency with which tag values change for
on-event models.
How often to retry primary for automatic switchback
(minutes)
If you specify 0, RSView32 will not switch back automatically.
The operator must issue the DataLogSwitchBack or
DataLogMergeToPrimary command to switch logging back to the
primary path.
In all other cases, RSView32 checks whether the primary path has
become available after the specified time has elapsed.
Minimum free disk space required for auto switchback (MB)
For data log models that use dBASE IV storage format, specify an
amount that is high enough to prevent RSView32 from frequently
switching between paths due to low disk space on the primary
path. The needs of your project may vary considerably from the
default value of 10 MB, depending on the frequency and amount
of data you expect to log. This option is not available if you use
the ODBC storage format.
Note that RSView32 does not use this amount to trigger a switch
to the secondary path. The amount is used only to determine
whether to switch back automatically to the primary path after the
time to retry has elapsed.
1
1
7-25 1
Configuring data logging
Using the DataLogSwitchBack command to switch logging paths
You can switch back to the primary path manually by using the
DataLogSwitchBack <file> command or DataLogSwitchBack *
command.
The DataLogSwitchBack <file> command switches logging for the
specified data log model. The DataLogSwitchBack * command
switches logging for all data log models that are currently running.
Use these commands anywhere an RSView32 command or macro
can be entered. For example, type the command as the action for an
event.
These commands perform a switchback only if the model is running,
RSView32 is logging data to the secondary or backup path, and the
primary path or ODBC database is available. For .dbf files,
RSView32 creates a new set of files when it switches back to the
primary path.
In order to prevent an impact on performance, data is not moved
from the secondary or backup path when you switch back to the
primary path or ODBC database. You must move it manually using
the DataLogMergeToPrimary command.
RSView32 also switches back to the primary path or ODBC
database when you use the DataLogMergeToPrimary command.
Note that you cannot switch manually from the primary path or
ODBC database to the secondary or backup path.
You can give operators ways to issue these commands at runtime.
For example, you can create a button object and use the
DataLogSwitchBack <file> command as the press action.
1
1
1
7-26
Configuring data logging
Using the DataLogMergeToPrimary command to move secondary files
to the primary path
When you begin writing to or reading from a data log model,
RSView32 sends a message to the activity log if there are files on the
secondary or backup path. You must move data manually from the
secondary or backup path to the primary path or ODBC database
using the DataLogMergeToPrimary <file> command or
DataLogMergeToPrimary * command.
The DataLogMergeToPrimary <file> command moves data for the
specified data log model, whether or not the model is running. The
DataLogMergeToPrimary * command moves data for all data log
models that are currently running. Use these commands anywhere
an RSView32 command or macro can be entered.
If a model is running when you issue these commands, RSView32
also performs a switchback to the primary path or ODBC database
for the specified model or all running models. If a model uses the
.dbf format, RSView32 moves all files on the secondary path
(including the current file set) to the primary path, begins a new file
set on the primary path, and continues logging to the new file set. If
a model uses the ODBC format, RSView32 merges the data in the
ODBC backup files into the ODBC database and continues logging
to the ODBC database.
To restore the secondary or backup data, give operators a way to
issue the DataLogMergeToPrimary <file> command or the
DataLogMergeToPrimary * command at runtime. For example, you
can create a button object and use the command as the press action.
1
1
7-27 1
Configuring data logging
Creating .dbf log files
If your data log model uses the ODBC format, data is added
continually to the same database, and this section does not apply. If
your data log model uses the dBASE IV format, RSView32 logs the
data to sets of files. You can set up your project to create new sets of
.dbf log files, over these time intervals:
periodically
at specified times
when a particular event occurs
never
If you use short file names, a maximum of 26 new file sets can be
created for each data log model in a given 24-hour period. If you
attempt to create a 27th file, RSView32 continues logging data to the
26th file. At midnight, the sequence starts over again with a new file
set (with the new date).
Log files are saved in the directory you specified in the Paths tab.
Monitoring disk space
If the hard disk space for the primary path is full, data logging
switches to the secondary path, if enabled, until space becomes
available on the primary path. However, if you do not set up a
secondary path, when the primary path runs out of disk space data
logging stops and no more log files are created.
To prevent loss of data, you can monitor disk space. See page 18-14.
1
1
1
7-28
Configuring data logging
To specify when to start new .dbf files:
1. In the Data Log Setup editor, click the File Management tab.
2. Under Start New Files, click a button to specify when you want
to have new files created. See the topics below for information on
the different times.
Creating files periodically
Click Periodic, and then click a time period. A new file is created
after the specified interval has elapsed.
For this period
The new file is created
Hourly
Approximately on the hour
Daily
Each day approximately at midnight
Weekly
Each Sunday approximately at midnight
Monthly
On the first day of each month approximately at midnight
1
1
7-29 1
Configuring data logging
Creating files at specified times
Click At Specified Times, and then type a time or list of times when
you want data to be logged to a new file. Start a new line for each
new time and allow at least five minutes between start times.
Use any of the following to specify time:
Time
Format
Day
Sun, Mon, Tue, Wed, Thu, Fri, or Sat
Date
1 – 31
Specifying 31 means that months that do not have 31
days will not have new log files.
Hour
00: to 23:
Minute
:00 to :59
You can combine hours and minutes with a day or date.
Example: Creating a new file
To have a new file start every Wednesday at 2:00 am and every
Friday at 2:00 pm, type the following start times:
1
1
1
7-30
Configuring data logging
Creating files when a particular event occurs
1. Click On Event.
2. In the Expression field, create the expression that will trigger
creation of a new file. For details about expressions, see
Chapter 14, Creating expressions.
You can use on-event logging to create sets of data for use with
file-based trending. For more information, see Chapter 13,
Configuring trends.
Example: Creating a new file for a new shift
You can set up your project so it creates a new log file at the end of a
shift or batch process. For example, create a tag called NextShift. In
the Data Log Setup editor, click On Event and type NextShift as the
expression.
When the tag evaluates to true, a new data log file is created to store
the data from the new shift.
Never creating new files
Click Never. Logged data is added to a single file.
To manage disk space if a log file grows too large, stop data logging,
move or delete the data log file, and then restart data logging. You
cannot delete a log file while data is being logged to it. For details
about how to monitor disk space, see “Monitoring disk space” on
page 18-14.
1
1
7-31 1
Configuring data logging
Using the DataLogNewFile command to create files
You can also create new ODBC backup files and .dbf log files with
the DataLogNewFile <file> command or the DataLogNewFile *
command.
The DataLogNewFile <file> command creates a new file set for the
specified data log model. The DataLogNewFile * command creates a
new file set for all data log models that are currently running. Use
these commands anywhere an RSView32 command or macro can be
entered.
If your data log model uses the ODBC format, these commands
create a new set of backup files if RSView32 is logging to the backup
path when the command is issued. If RSView32 is logging to the
ODBC database, RSView32 logs an End snapshot and then a Begin
snapshot when you issue these commands.
If your data log model uses the dBASE IV format, these commands
start a new file set regardless of when new files have been configured
to start in the Data Log Setup editor. The new .dbf file set is created
on the same path that RSView32 is currently logging to.
These commands record two snapshots of data: an End record in the
old file and a Begin record in the new file. If you use the
DataLogNewFile <file> command or the DataLogNewFile *
command, it is not necessary to also use the DataLogSnapshot
command.
If you use short file names, a maximum of 26 new file sets can be
created for each data log model in a given 24-hour period. If you
attempt to create a 27th file, RSView32 continues logging data to the
26th file. At midnight, the sequence starts over again with a new file
set (with the new date). If you use long file names, RSView32 can
create up to 9,999 files per day.
You can give operators ways to issue the command at runtime. For
example, you can create a button object and use the command as the
press action. When an operator presses the button, the command is
issued, a new file is created, and data is logged to that file.
1
1
1
7-32
Configuring data logging
Deleting ODBC database records and .dbf log files
If your data log model uses the ODBC database format, you can
purge old records from the database using standard relational
database tools or SQL queries. You can also configure RSView32 to
delete (purge) records in the ODBC database after a specified time.
If your data log model uses the dBASE IV format, you can delete
.dbf log file sets after a specified period or once a specified number of
file sets has been created. If you never want .dbf files deleted, leave
the check boxes under Delete Oldest Files blank.
Data log file sets are deleted only when a new file set is created. So, if
your project creates a new file set each day and deletes the oldest file
set every third day, your project will have file sets for the three
previous days’ data as well as a file set for the current day.
To specify when to delete .dbf files or ODBC database data:
1. In the Data Log Setup editor, click the File Management tab. If
you are using the ODBC storage format, go to step 3.
1
1
7-33 1
Configuring data logging
2. If you are using dBASE IV storage format, under Delete Oldest
Files, select one or both check boxes and type a number to specify
when to delete the .dbf log file sets. If you select both check
boxes, files sets are deleted after the maximum time or after the
maximum number of files is reached, whichever happens first. If
you do not want files deleted, leave the check boxes under Delete
Oldest Files blank.
After Maximum Time
File sets are deleted after the maximum time has expired. For
example, if two days is the specified time, file sets are deleted at
midnight of the third day so you always have the two previous
days’ data and the current day’s data.
After Maximum Files
The oldest log file set is deleted after the specified maximum has
been reached. The files currently being logged to are not included
in this number. For example, if you specify 10, you will have a
maximum of 11 data log file sets at any time—10 old ones and the
current set. When a new set is started, the oldest file set is deleted.
These options apply to .dbf files on the primary path only, not the
files on the secondary path. RSView32 deletes files on the
secondary path only when the DataLogMergeToPrimary
command is issued.
1
1
1
7-34
Configuring data logging
When you have finished specifying options for deleting .dbf files,
go to “Specifying when to log data” on page 7-36.
3. If you are using ODBC storage format, under Purge Oldest
Records in ODBC Database, select the After Maximum Time
check box. Type a number to specify when to delete the records,
and select whether the number is measured in days, weeks, or
months.
If you do not want records deleted, leave the check box blank.
This option purges records from the ODBC database only, not
from the backup files. RSView32 deletes ODBC backup files only
when the DataLogMergeToPrimary command is issued.
1
1
7-35 1
Configuring data logging
Specifying when to log data
You can set up logging so tag values are logged:
periodically (periodic logging)
only when a tag value changes (on-change logging)
when a particular event occurs and triggers the DataLogSnapshot
command (on-demand logging)
DataLogSnapshot <file> is the RSView32 command for logging
data for a single data log model on demand, where <file> is the
name of the data log model. Use the DataLogSnapshot *
command to log a snapshot of the data for all data log models that
are currently running.
You can combine types of logging. For more information, see
“Combining logging” on page 7-40.
To specify what should trigger logging:
1. In the Data Log Setup editor, click the Log Triggers tab.
1
1
1
7-36
Configuring data logging
2. Click a button to specify a log trigger and fill in any additional
information. See the topics below for information on the different
types of log triggers.
Logging periodically
Periodic logging is used to take a snapshot of all tag values at a
particular point in time. You can use the dBASE IV (narrow),
dBASE IV (wide), or ODBC storage format for periodic logging.
For periodic logging to dBASE IV files, the dBASE IV (wide) file
format is most efficient for storing the data.
1. Click Periodic.
2. In the Interval field, type a time and click a time unit to specify
how often tag values will be logged. All tags in the model will be
logged each time this interval expires.
Do not set the interval faster than the scan class rate, OPC update
rate, or DDE poll rate, or you will log redundant data. For
information about scan classes, see “Scanning for new tag values”
on page 2-15. For information about update rates see “Scanning
for new tag values” on page 3-15.
You can change the periodic log rate at runtime, as described on
page 7-44. However, the runtime change affects the current data
log session only. When you stop and restart the model, RSView32
uses the log rate you set up here.
Logging on change
On-change logging is used to log only tags whose values have
changed, when the change occurs. You can use the dBASE IV
(narrow), dBASE IV (wide), or ODBC storage format for on-change
logging. For on-change logging to dBASE IV files, the dBASE IV
(narrow) file format is most efficient for storing the data. The
dBASE IV (wide) format is not recommended because records are
logged for all tags, whether their values have changed or not, making
the wide format inefficient.
1. Click On Change.
1
1
7-37 1
Configuring data logging
2. In the Change Percentage field, type the percent the tag value has
to change in order to trigger logging.
The percentage is based on the tag’s minimum and maximum
values as configured in the Tag Database editor. Only the tags that
change by the specified percentage are logged. Zero means all
changes are logged.
3. In the Heartbeat field, type a time, and then click a time unit to
specify how often tag values will be logged even if no change has
occurred. If you do not want to use the heartbeat, type 0.
The heartbeat ensures that the data in the log file is current. The
heartbeat is also a good way to ensure that data logging is working
and acquiring valid data.
Logging on demand
Logging on demand means that data is logged for a model only when
the DataLogSnapshot command is issued. When the
DataLogSnapshot command is executed, tag values for all tags in the
specified model or models are logged.
To log on demand:
1. Click On Demand.
2. Run the model or models for which data will be logged. To run a
model, select the model in the Startup editor or issue the
DataLogOn <file> command where file is the name of the data log
model.
3. Issue the DataLogSnapshot command, as described next.
1
1
1
7-38
Configuring data logging
Using the DataLogSnapshot command
You can record tag values using the DataLogSnapshot <file>
command or DataLogSnapshot * command.
The DataLogSnapshot <file> command records tag values for all tags
in the specified model at the instant the command is executed. The
DataLogSnapshot * command records tag values for all tags in all
running models at the instant the command is executed.
Use these commands anywhere an RSView32 command or macro
can be entered. For example, enter the command as the action for an
event.
Operators can also use these commands at runtime. For details, see
“Providing operators with a way to log on demand” on page 7-40.
Example: Creating an event for on demand logging
To create an event that will trigger logging when an alarm occurs:
1. Click On Demand as the log trigger.
2. Open the Event editor. Create an expression such as:
If alm_in_alarm(motor_fault) and new_batch_started then 1 else 0
3. In the Event editor’s Action field, type DataLogSnapshot <file>
where file is the name of the data log model.
When tag1 goes into alarm, the DataLogSnapshot <file> command
runs. All tags in the model will then be logged (not just the tag in
alarm).
1
1
7-39 1
Configuring data logging
Combining logging
You can combine periodic or on-change logging with on-demand
logging. This enables data to be captured at particular times, as well
as when a particular event occurs. 4.
To combine logging:
1. In the Data Log Setup editor, choose Periodic or On Change as
the log trigger.
2. Type the DataLogSnapshot <file> command or the
DataLogSnapshot * command anywhere an RSView32 command
or macro can be used.
Providing operators with a way to log on demand
At runtime, operators might need to take a snapshot of data. To do
this, they need a way to issue the DataLogSnapshot <file> command
or the DataLogSnapshot * command. Possible methods include: 3.
creating a button object and using the command as the press
action—operators can then press the button to take a data log
snapshot
creating a display key or global key and using the command as the
press action—operators can then press a key to take a data log
snapshot
providing a command line—operators can then type the command
directly on the command line
1
1
1
7-40
Configuring data logging
Choosing the data to log
For narrow-format dBASE IV models and ODBC models, the
model can contain up to 10,000 tags. For wide-format dBASE IV
models, the model can contain up to 100 tags.
To specify tags:
1. In the Data Log Setup editor, click the Tags in Model tab.
2. In the Tag(s) to Add field, specify the tags that will be logged by:
typing the tag names, separating multiple tag names by a space
or a comma
using the selection button to open the Tag Browser and then
selecting tags. To select multiple tags, Shift-click to select
groups of tags or Ctrl-click to select individual tags.
3. Click the Add button. The tags listed in the Tag(s) to Add field
appear in the Tags in Model field.
1
1
7-41 1
Configuring data logging
To remove a tag from the Tags in Model field, click a tag, and then
click Remove. To remove multiple tags, Shift-click the tags and
then click Remove. To remove all tags, click Remove All. Tags that
you remove appear in the Tag(s) to Add field. Delete the tags you
want to remove from the Tag(s) to Add field before you click OK.
Editing the data log model
You can edit a model during development or runtime. If you change
a model at runtime, the changes will not take effect until you stop
data logging and then restart it.
For narrow-format dBASE IV models and ODBC models, adding or
deleting a tag in the model does not cause a new file set to be created
the next time the DataLogOn <file> command runs. For
wide-format dBASE IV models, adding or deleting a tag in the
model causes a new log file set to be created the next time the
DataLogOn <file> command runs.
To edit the data log model:
1. In the Project Manager, open the data log model you want to
change.
2. Make the required changes.
3. Save the changes.
IMPORTANT If you delete a tag from a data log model, and the tag is also used in a
trend object, be sure to remove all references to the deleted tag from
the trend object.
Changing logging paths using RSView32 Runtime
You can change the logging paths at runtime using RSView32
Runtime (you don’t need to use RSView32 Works). You can change
the primary and secondary paths for dBASE IV data log models, and
the backup path for ODBC data log models. You cannot change the
ODBC database using RSView32 Runtime.
1
1
1
7-42
Configuring data logging
To edit the logging paths:
1. In the Project Manager, open the Data Log folder.
2. Open the Data Log Path editor.
3. Specify paths as described in “Specifying logging paths” on
page 7-22.
Changing logging paths using the DataLogPath command
The operator can also change logging paths at runtime using the
DataLogPath <file> command, where <file> refers to the data log
model you want to change paths for.
The command opens the Data Log Path editor. Use the editor to
specify paths as described in “Specifying logging paths” on
page 7-22. You can use the editor to change the primary and
secondary paths for dBASE IV data log models, and the backup path
for ODBC data log models. You cannot change the ODBC database
using the Data Log Path editor.
You can use the DataLogPath command anywhere an RSView32
command or macro can be entered.
1
1
7-43 1
Configuring data logging
Making runtime changes without editing the data log model
You can change certain data log parameters at runtime without
editing the data log model. These runtime changes take effect
immediately, but are not retentive:
changing the log rate for periodic logging
changing the log file identifier string
Use these commands anywhere an RSView32 command or macro
can be entered. For example, type the command directly on the
command line.
Changing the log rate for periodic logging
You can change the log rate for periodic logging at runtime using the
DataLogChangeRate <file> <value> [unit] command.
<file> is the name of the data log model
<value> is the numeric portion of the time interval for the log
rate. For example, if you want to log data every 20 seconds, the
value is 20.
[unit] is the time unit of the log rate: hundredths, tenths, seconds,
minutes, hours, or days. The default is seconds if you omit the
[unit] parameter.
The change to the logging rate applies during the current logging
session only. When you stop and restart logging, RSView32 uses the
logging rate you specified in the the data log model.
1
1
1
7-44
Configuring data logging
Changing the log file identifier string
You can change the log file identifier string that is used as part of the
file name for dBASE IV log files that use long file names. The log file
identifier string is also used in the names of ODBC backup files that
use long file names. To change the string, use the
DataLogRenameFile <file> <LogFileIDString> command.
<file> is the name of the data log model
<LogFileIDString> is the log file identifier string, up to
20 characters
The change to the log file identifier string applies during the current
logging session only. When you stop and restart logging, RSView32
uses the log file identifier string you specified in the the data log
model.
Displaying data in a trend
The data for historical trends comes from data log files. You can set
up trends to display data from one file set or from all file sets. When
data comes from one file set, it is called file-based trending. When
you configure trending, you can specify exactly which file you want
to see. When data comes from all the file sets, it is referred to as
historical trending
For more information about trends, see Chapter 13, Configuring
trends.
1
1
7-45 1
Configuring data logging
Starting and stopping data logging
There are many ways to start and stop data logging. Choose the way
that works best for your project.
For a complete list of RSView32 commands and their command
syntax, see Appendix A, RSView32 commands, or see Help.
Ways to start data logging
In the descriptions below, <file> represents the name of the data log
model.
In the Startup editor, select the Data Logging check box and
specify a data log model. If you want to start more than one data
log model for a project, include the DataLogOn <file> command
in a startup or login macro.
In the Macro editor, create a startup or login macro that includes
the DataLogOn <file> command.
In the Graphic Display editor, specify the DataLogOn <file>
command in the Startup field in the Display Settings dialog box.
In the Graphic Display editor, create a button object and specify
the DataLogOn <file> command as the press action. When the
button is pressed, data logging of the specified model starts.
In the Graphic Display editor, create a graphic object and attach
touch animation with the DataLogOn <file> command as the
press action. When the object is touched, data logging of the
specified model starts.
In the Events editor, specify the DataLogOn <file> command as
the action for an event.
On the command line, type DataLogOn <file> and then press
Enter.
1
1
1
7-46
Configuring data logging
Ways to stop data logging
When a project stops, all data log models automatically stop as well.
To stop data logging without stopping the project, use any of the
methods below.
To stop a single data log model, use the DataLogOff <file>
command where <file> is the name of the data log model. To stop all
data log models, use the DataLogOff * command.
In the Graphic Display editor, specify the DataLogOff <file>
command or the DataLogOff * command in the Shutdown field
in the Display Settings dialog box.
Note that if the display is cached using the Always Updating
option, the DataLogOff command won’t be executed until the
display is removed from the cache (for example, by using the
FlushCache command).
In the Graphic Display editor, create a button object and specify
the DataLogOff <file> command or the DataLogOff * command
as the press action. When the button is pressed, the specified
command runs.
In the Graphic Display editor, create a graphic object and attach
touch animation with the DataLogOff <file> command or the
DataLogOff * command as the action. When the object is
touched, the specified command runs.
In the Events editor, specify the DataLogOff <file> command or
the DataLogOff * command as the action for an event.
On the command line, type DataLogOff <file> or type
DataLogOff * and then press Enter.
1
1
7-47 1
8
Configuring activity logging
Activity log records information about various types of system
activity. The information is stored in dBASE IV (.dbf) format and
can be:
viewed with the Activity Log Viewer
archived for future processing or analysis
used with third-party software, such as Microsoft Excel, Seagate
Crystal Reports, and Microsoft Visual FoxPro, for display or
analysis
exported to ODBC format while online
Which activities can be logged?
You can log some or all of the following types of system activity:
command and macro usage
operator comments
system messages and errors
errors from the communication network
tag read and write activity
You can also log custom messages generated by VBA programs.
1
1
8-1 1
Configuring activity logging
Summary of steps
By default, RSView32 is set up to log activities. You can change the
default settings and specify:
where to store activity log files
when to create and delete log files
which activities to log
The Activity Log Setup editor
To open the Activity Log Setup editor:
1. In the Project Manager, open the System folder.
2. Open the Activity Log Setup editor by doing one of the
following:
double-click the Activity Log Setup icon
right-click the Activity Log Setup icon and then click Show
Set up the file path,
select a printer, and
specify details about
the log file.
Specify when you
want log files
created and deleted.
Specify which
activities to log.
1
1
1
8-2
Configuring activity logging
RSView32 versions 6.2 and later contain extra fields in the dBASE IV
file format for storing activity log data. The newer .dbf file format
logs details about the computer on which the logging server is
running.
Specifying where to store activity log files
To specify where to store log files:
1. In the Activity Log Setup editor, click the Setup tab.
By default, activity log
files are stored in the
ACTLOG subdirectory
of your project.
2. If you want to change where the log files are stored, type a new
path.
When log files are created, they will be stored in the directory
specified here.
3. If you want activities logged to a printer, click the Printer button
to display a list of available printers.
Only printers already set up on your system are available for
printing. For information on installing a printer, see your
Windows documentation.
1
1
8-3 1
Configuring activity logging
IMPORTANT Page printers, such as laser printers, are not supported.
4. If you want to log activities in a format that is compatible with
projects running in RSView32 version 6.0 or earlier, click Use
RSView32 6.0 Log File Format.
5. If you want your activity log files to be named using the DOS
eight-character file name and three-character extension format,
click to deselect Use Long File Names. If the path where the log
files are stored supports long file names, the date stamp part of the
log file name includes a four-digit year.
6. Click OK.
Creating log files
You can set up your project to create new log files: AL1
periodically
at specified times
when a particular event occurs
never
Up to 26 new files can be created in each 24-hour period. If you
attempt to create a 27th file, RSView32 continues logging data to the
26th file.
For log files with both long and short file names, the sequence starts
again at midnight, with the first new file for the new day.
Log files are saved in the directory you specified under the Setup tab.
For more information about activity log files, see “About activity log
files” on page 8-9, “Bringing logged dBASE IV data into Microsoft
Excel” on page 16-5, and “Activity log files” on page 16-7.
1
1
1
8-4
Configuring activity logging
Monitoring disk space
If your computer’s hard disk is full, activity logging stops and no
more log files are created. To monitor disk space, see page 18-14.
To specify when to start new files:
1. In the Activity Log Setup editor, click the File Management tab.
2. Under Start New Files, click a button to specify when you want
to have new files created. See the topics below for information on
the different times.
1
1
8-5 1
Configuring activity logging
Creating files periodically
Click Periodic, and then click a time period. A new file is created
after the specified interval has elapsed.
For this period
The new file is created
Hourly
Approximately on the hour
Daily
Each day approximately at midnight
Weekly
Each Sunday approximately at midnight
Monthly
On the first day of each month approximately at midnight
Creating files at specified times
Click At Specified Times, and then type a time or list of times when
you want activities to be logged to a new file. Start a new line for
each new time and allow at least five minutes between start times.
Use any of the following to specify time:
Time
Format
Day
Sun, Mon, Tue, Wed, Thu, Fri, or Sat
Date
1 – 31
Note: Specifying 31 means that months that do not have
31 days will not have new log files.
Hour
00: to 23:
Minute
:00 to :59
You can combine hours and minutes with a day or date.
1
1
1
8-6
Configuring activity logging
Example: Creating a new file
To have a new file start every Wednesday at 2:00 am and every
Friday at 2:00 pm, type the following start times:
Creating files when a particular event occurs
1. Click On Event.
2. In the Expression field, create the expression that will trigger
creation of a new file. For details about expressions, see
Chapter 14, Creating expressions.
Example: Creating a new file for a new shift
You can set up your project so it creates a new log file at the end of a
shift or batch process. For example, create a tag called NextShift. In
the Activity Log Setup editor, click On Event and type NextShift as
the expression.
When the tag evaluates to true, a new activity log file is created to
store the data from the new shift.
1
1
8-7 1
Configuring activity logging
Never creating new files
Click Never. Logged data is added to a single file.
When considering how much data to log to a file, keep in mind that
the Activity Log Viewer can display a maximum of 32,767 records at
one time.
To manage disk space if a log file grows too large, stop activity
logging, delete the activity log file, and then restart activity logging.
You cannot delete a log file while activities are being logged. For
details about how to monitor disk space, see “Monitoring disk
space” on page 18-14.
Deleting log files
You can delete old log files after a specified period or once a specified
number of files has been created. If you never want files deleted,
leave the check boxes under Delete Oldest Files blank.
Activity log files are deleted only when a new file is created. So, if
your project creates a new file each day and deletes the oldest file
every third day, your project will have files for the three previous
days’ data as well as a file for the current day.
To specify when to delete files:
1. In the Activity Log Setup editor, click the File Management tab.
1
1
1
8-8
Configuring activity logging
2. Under Delete Oldest Files, select one or both check boxes and
type a number to specify when to delete the log files. If you select
both check boxes, files are deleted after the maximum time or after
the maximum number of files is reached, whichever happens first.
If you do not want files deleted, leave the check boxes under
Delete Oldest Files blank.
After Maximum Time
Files are deleted after the maximum time has expired. For
example, if two days is the specified time, files are deleted at
midnight of the third day so you always have the two previous
days’ data and the current day’s data.
After Maximum Files
The oldest log file is deleted after the specified maximum has been
reached. The files currently being logged to are not included in
this number. For example, if you specify 10, you will have a
maximum of 11 activity log files at any time—10 old ones and the
current one. When a new file is started, the oldest file set is
deleted.
About activity log files
Logged activities are stored in dBASE IV (.dbf) format.
How log files are named
When a log file is created, it is named automatically. The name is
based on the date the file was created and the type of data it contains.
The format for the name is YYYYMMDDnz.dbf, where: 3.
YYYY are the four digits of the year
MM is the month
DD is the day
n is the sequence letter (a, b, c, and so on). This letter indicates the
sequence files were created in. You can have up to 26 files (a to z)
per day. At midnight, the sequence starts at “a” again.
z is the file type: i is for activity
1
1
8-9 1
Configuring activity logging
If the path where the log files are stored does not support long file
names, the format for the name is YYMMDDnz.dbf, where YY are
the last two digits of the year.
Example: Log file name
The activity log file named 971028bi.dbf was created in the year 97,
month 10, and day 28. The b indicates that this is the second file
created that day. The i indicates that this is an activity log file.
Exporting activity log files to ODBC format
Using the command, ActivityLogSendToODBC, you can export
logged activities from dBASE IV (.dbf) format to an ODBC
database.
If the table in the database to which you are attempting to export
data is not ODBC-compliant, the export will fail. If an
ODBC-compliant table does not exist, RSView32 will try to create
it. RSView32 supports the following ODBC-compliant databases:
Microsoft Access, Sybase SQL Server, Oracle, and Microsoft SQL
Server.
When you export data to an ODBC table, RSView32 keeps track of
the data that was exported in a control file, Activity.exp. This is
located in the log path where the .dbf files are stored. The next time
you export data, only the newest data will be exported. If the control
file is deleted, all the activity log data in the .dbf file will be exported
when you issue the export command.
If you have set up file management to delete the oldest files when a
new set is started, and you are exporting data to an ODBC database,
make sure you export the data before the oldest files are deleted.
1
1
1
8-10
Configuring activity logging
Example: Exporting activity log files to ODBC once a day
To export the contents of the activity log files to an ODBC database
once every day, create an event file that specifies when and where to
export the data. ActivityLogSendToODBC exports only the records
added to the activity log files since the last export.
1. If required, using the ODBC Administrator, set up an ODBC
data source name. For more information about setting up an
ODBC data source, see page 7-16.
2. Double-click Events in the RSView32 Logic and Control folder.
3. In the Expression box, type: time(“01:00”). This expression runs
the command or macro you type in the Action box at 1:00 am
every day.
4. If the ODBC data source is called RSView32ActivityLog, the
target table name is ActivityTable, the user name is Derek, and the
password is golf, in the Action box, type:
ActivityLogSendToODBC RSView32ActivityLog ActivityTable
/UDerek /Pgolf
5. Click Accept to save the event.
6. Click Close to save the event file.
7. At the command line, type EventOn <filename> where
<filename> is the name of the event file you saved.
For information about the contents of the activity log ODBC tables,
see page 16-8.
1
1
8-11 1
Configuring activity logging
Specifying which activities to log
To specify which types of activity to log:
1. In the Activity Log Setup editor, click the Categories tab.
2. In the Select Category area, click a category:
This activity category
Logs
Commands
The execution of a command.
Applications
Applications such as security logins and data logging.
ActiveX events if the event has been set up to do so in the
ActiveX Control Events dialog box.
Remarks
Remarks entered using the Remark command.
Communications
Communication errors for device, DDE, or OPC tags.
Important: To log communication errors, you must also
select the Communication Status check box in the Startup
editor, or type the command ComStatusOn at the command
line.
Tag Write
Any tag write (not write errors).
Tag writes are done by the = (Equal), Ramp, Set, and Toggle
commands, as well as by downloading data from numeric
input, string input, and recipe fields in a graphic display.
1
1
1
8-12
Configuring activity logging
This activity category
Logs
Tag Read
Any tag read (not read errors).
Tag reads can be done by uploading data into numeric and
string input fields in a graphic display. Normal scanning is
not logged as a tag read.
Custom 1 through
Custom 4
User-defined messages for use with RSView32 VBA programs. For more information about using custom activity
categories, see Help.
3. The label appears in the log file to identify an activity category. To
create your own label, type a new label up to 20 characters long.
4. Check the appropriate boxes to specify where you want the
activity logged. You can log to the activity bar, log file, and
printer.
For more information about the activity bar, see “Using the
activity bar” on page 8-14. For more information about log files,
see “Creating log files” on page 8-4.
5. Complete Steps 2 through 4 for each category you want to log.
You can also use the EchoOff and EchoOn commands to control
activity logging. For more information see Appendix A, RSView32
commands.
Editing activity log setup
You can edit the activity log setup during development or runtime. If
you change the activity log setup at runtime, the changes will not
take effect until you stop activity logging and then restart it.
To edit the activity log setup:
1. Open the Activity Log Setup editor.
2. Make the required changes.
3. Save the changes.
1
1
8-13 1
Configuring activity logging
Using the activity bar
Use the activity bar to keep track of what is happening when a
project is running. To log activities to the activity bar, the Activity
Bar check boxes must be selected in the Categories tab of the
Activity Log Setup editor.
Hiding, showing, and moving the activity bar
When RSView32 first starts, the activity bar is visible and is docked
above the status bar in the RSView32 main window.
Activity bar
Status bar
To show and hide the activity bar, click Activity Bar on the View
menu for the Project Manager. When Activity Bar has a check mark
beside it, the activity bar is visible. You can also use the
ActivityBarOn and ActivityBarOff commands to show and hide the
activity bar.
1
1
1
8-14
Configuring activity logging
To undock the activity bar, place the pointer over the grey area
between the Clear and Clear All buttons, and then drag the mouse
until the bar is where you want it. You can place the activity bar
anywhere on your screen, or redock it to the bottom of the
RSView32 main window by dragging it to the bottom. To move the
bar when it is not docked, grab the title bar and drag.
To undock the activity bar, place the
pointer here and drag the mouse.
When the activity bar is undocked, you can make it any size you
like, for example to view more than one message at a time. To resize
the bar, grab an edge or corner and drag until the bar is the desired
size.
Messages in the activity bar
The types of messages that appear in the activity bar depend on what
is set up in the Categories tab of the Activity Log Setup editor.
Activity messages are preceded by a blue, yellow, or red icon. Blue
indicates information, yellow indicates a warning, and red indicates
an error. The following illustration shows an error:
To clear a message, use the Clear and Clear All buttons. Clear
removes the the top message. Clear All removes all the messages.
Clearing a message in the activity bar does not delete the message
from the activity log file.
1
1
8-15 1
Configuring activity logging
Using the Activity Log Viewer
With the Activity Log Viewer, you can view records in the activity
log file. Files can be viewed in both edit and run modes.
The Activity Log Viewer does not display all the information in the
log file. To see the complete log file, use an application that reads
dBASE IV (.dbf) files, such as Microsoft Excel, or export the data to
an ODBC database and view it using a viewer such as Microsoft
Query. For more information, see “Tracking system usage” on
page 8-17 and “Activity log files” on page 16-7.
To open the Activity Log Viewer:
1. In the Project Manager, open the System folder.
2. Open the Activity Log Viewer by doing one of the following:
double-click the Activity Log Viewer icon
right-click the Activity Log Viewer icon and then click Show
Selecting a record
When the Activity Log Viewer opens, it displays the contents of the
most recent log file. To select another file:
1. On the Records menu, click Select Log File.
1
1
1
8-16
Configuring activity logging
2. Click the file you want to view. The contents of the file are
displayed in the viewer.
Understanding records
The Activity Log Viewer displays up to 32,767 records. A record is
made up of the items shown below:
Record
Drag to resize columns.
The icon at the beginning of the record can be red, yellow, or blue.
The colors provide a visual cue to the importance of the record. Red
indicates an error, yellow indicates a warning, and blue indicates
information.
Tracking system usage
If you have set up security for your project, you can use the activity
log file to track what users are doing on the system. As shown in the
figure above, when an activity is logged, the ID of the current user is
also logged. 3.
1
1
8-17 1
Configuring activity logging
Starting and stopping activity logging
By default, activity logging is on when you start a project. However,
if you need to start or stop activity logging, you can use any of the
following methods:
Ways to start activity logging
In the Macro editor, create a startup or login macro that includes
the ActivityOn command.
In the Graphic Display editor, create a button object and specify
the ActivityOn command as the press action. When the button is
pressed, activity logging starts.
In the Graphic Display editor, create a graphic object and attach
touch animation with the ActivityOn command as the action.
When the object is touched, activity logging starts.
In the Events editor, specify the ActivityOn command as the
action for an event.
On the command line, type ActivityOn and then press Enter.
Ways to stop activity logging
In the Macro editor, create a shutdown or logout macro that
includes the ActivityOff command.
In the Graphic Display editor, create a button object and specify
the ActivityOff command as the press action. When the button is
pressed, activity logging stops.
In the Graphic Display editor, create a graphic object and attach
touch animation with the ActivityOff command as the action.
When the object is touched, activity logging stops.
In the Events editor, specify the ActivityOff command as the
action for an event.
On the command line, type ActivityOff and then press Enter.
For a complete list of RSView32 commands and command syntax,
see Appendix A, RSView32 commands, or see Help.
1
1
1
8-18
9
Configuring events
Events are expressions that trigger actions. Expressions are equations
containing tag values, mathematical operations, if-then-else logic,
and other built-in RSView32 functions. Actions are RSView32
commands, symbols, or macros. An action could, for example:
initiate a snapshot of tag values using the DataLogSnapshot
command
display an error screen using the Display command
change a tag value using the Set command
execute a VBA program using the VBAExec command
This chapter describes how to use the Events editor to create events.
It does not describe the expressions used to produce the event’s
actual function, or the events associated with VBA programs. If you
do not know how to use expressions, see Chapter 14, Creating
expressions. For information about events in VBA programs, see the
Help topics that relate to the RSView32 Object Model.
1
1
9-1 1
Configuring events
How to use multiple event files
You can create multiple event files. At runtime, up to 20 event files
(containing a maximum of 1,000 events each) can run simultaneously.
Use multiple event files to:
group events that need to be evaluated at different rates
group events that are active only when a particular graphic display
is active
Summary of steps
The main steps for configuring events are:
set up the evaluation interval for the event file in the Event Setup
dialog box
create the events in the Events editor
The Events editor
To open the Events editor:
1. In the Project Manager, open the Logic and Control folder.
1
1
1
9-2
Configuring events
2. Open the Events editor by doing one of the following:
double-click the Events icon
right-click the Events icon and then click New
Using the Accept and Discard buttons
When you enter information in the editor, the Prev and Next
buttons change to Accept and Discard. Click Accept to save
information. Click Discard to discard information.
1
1
9-3 1
Configuring events
Setting up the evaluation interval
To set up the evaluation interval for the event file:
1. On the menu bar, click Setup and then click Event Setup.
The Event Setup dialog box opens.
2. Type a brief description of the event file. This description is for
your information only—it doesn’t appear anywhere else.
For example, if you were creating an event file for a certain area of
your plant, you might type something like “East Wing Assembly
Line” to identify the area.
3. Choose a type of evaluation to specify how often to evaluate
expressions at runtime. When the evaluation interval expires,
RSView32 evaluates the expressions that contain tags with values
that have changed.
To have expressions evaluated as quickly as possible, click
Continuous. To have expressions evaluated at a particular interval,
click Periodic and type a number in the Evaluation Interval field.
You can use fractional seconds. For example, if you type .6, the
expression will be evaluated every six-tenths of a second. If you’re
using tags, don’t specify an evaluation interval faster than the scan
class background period, DDE server polling rate, or OPC server
update rate.
4. Click OK.
1
1
1
9-4
Configuring events
Creating events
An event is made up of an expression and an action. When the
expression changes from false on the previous evaluation to true on
the current evaluation, the action is triggered.
The following illustration shows an event file.
To create an event:
1. In the Action field, type an RSView32 command, a macro, or a
symbol that will run when the expression goes from false to true
(but not from true to false).
IMPORTANT Do not create events that depend on other events. Events are not
processed sequentially.
For a complete list of RSView32 commands, see Appendix A,
RSView32 commands, or see Help.
For more information about macros and symbols, see Chapter 15,
Setting up navigation.
1
1
9-5 1
Configuring events
2. To disable the event, clear the Enabled check box. When the event
file runs, this disabled event will not be evaluated.
3. In the Description field, type a brief description to document the
event’s function. This description is for your information only—it
doesn’t appear anywhere else.
4. In the Expression area, create an expression to specify the
conditions that will trigger the action.
For more information on expressions, see Chapter 14, Creating
expressions.
5. Click Accept.
6. Repeat Steps 1 through 5 to create more events.
Use the Next button to move to a new record in the spreadsheet.
Editing events
You can edit events during development or when you run the project
using RSView32 Works.
1. Open the event file you want to edit.
2. Use the Prev and Next buttons to move among events. Make the
required changes.
3. Save the changes.
If you change the event file while running the project, the changes
won’t take effect until you stop running the file and then restart it.
1
1
1
9-6
Configuring events
Starting and stopping event processing
There are many ways to start and stop event processing. Choose the
way that works best for your project.
For a complete list of RSView32 commands and their command
syntax, see Appendix A, RSView32 commands, or see Help.
Ways to start event processing
In the Startup editor, select the Event Detector check box and
specify an event file.
In the Macro editor, create a startup or login macro that includes
the EventOn <file> command.
In the Graphic Display editor, specify the EventOn <file>
command in the Startup field of the Display Settings dialog box.
In the Graphic Display editor, create a button object and specify
the EventOn <file> command as the press action. When the
button is pressed, event detection starts.
In the Graphic Display editor, create a graphic object and attach
touch animation with the EventOn <file> command as the action.
When the object is touched, event detection starts.
On the command line, type EventOn <file> and then press Enter.
Ways to stop event processing
When a project stops, event processing stops as well. To stop event
processing without stopping the project, use any of the methods
below.
In the Graphic Display editor, specify the EventOff <file>
command in the Shutdown field of the Display Settings dialog
box.
Note that if the display is cached using the Always Updating
option, the EventOff command won’t be executed until the
display is removed from the cache (for example, by using the
FlushCache command).
1
1
9-7 1
Configuring events
In the Graphic Display editor, create a button object and specify
the EventOff <file> command as the action. When the button is
pressed, event detection stops.
In the Graphic Display editor, create a graphic object and attach
touch animation with the EventOff <file> command as the action.
When the object is touched, event detection stops.
On the command line, type EventOff <file> and then press Enter.
1
1
1
9-8
10
Adding security
This chapter describes the RSView32 security system, and outlines
how to:
configure security codes
secure RSView32 commands, macros, graphic displays, OLE
objects, and tags
configure user accounts
secure the RSView32 Project Manager
prevent users from going outside of the project
About security
Use security to prevent users from accessing certain parts of the
system.
You can enter user names and passwords in the User Accounts
editor, or, if you are using Windows NT, you can use the
Windows NT user list instead of creating a custom RSView32 list.
No matter which method you choose to create the user list, you still
have to assign security access to the individual users.
1
1
10-1 1
Adding security
Security is based on a system of codes. Each code allows users with
security privileges for that code to access the RSView32 features
allowed by that code. Users can be assigned combinations of security
codes, allowing each user to access a different set of features.
Use the Security Monitor utility, included with the RSView32
Resource Kit,Z to customize user access to objects on graphic
displays. With this utility, you can create a single set of graphic
displays for all users, but have some objects visible or operable for
some users, and not for others.
Example: Assigning security codes
The following security codes are set up:
the DataLogOn command is assigned security code B
a graphic display named Boiler is assigned security code D
a tag named Tag1 is assigned security code E
In the User Account editor, the following security codes are
assigned:
Alice is assigned security codes B, D, and E
Simon is assigned security codes B and D
This means that Alice has access to the command, the display, and
the tag. Simon has access to the command and display, but not the
tag.
1
1
1
10-2
Adding security
Summary of steps
The steps involved in setting up security are:
assigning security codes to RSView32 commands and macros in
the Security Codes editor
assigning security codes to graphic displays and OLE objects with
verb animation in the Graphic Display editor
assigning security codes to tags in the Tag Database editor
assigning security codes to users in the User Accounts editor
Before you begin
Before you begin, gather a list of:
RSView32 commands and macros
For a complete list of RSView32 commands, see Appendix A,
RSView32 commands, or see Help.
graphic displays, OLE objects with verb animation, and tags
users or groups of users requiring accounts
Configuring security codes
In the Security Codes editor, you create a list of RSView32
commands and macros and then assign a security code to each item
in the list.
Here, you can also turn off strict security, which means commands
or macros issued from somewhere other than the command
line—such as from a graphic object with touch animation—are not
checked for security. For details, see “Using strict security” on
page 10-7.
1
1
10-3 1
Adding security
To open the Security Codes editor:
1. In the Project Manager, open the System folder.
2. Open the Security Codes editor by doing one of the following:
double-click the Security Codes icon
right-click the Security Codes icon and then click Show
Security codes
RSView32 has 17 security codes: an asterisk (*) and the letters A
through P. The asterisk is for unlimited access, and the letters are for
limited access. The letters are not hierarchical—that is all letters
provide the same level of security. You do not have to use all of the
security codes, nor do you have to assign the codes in a particular
order. For example, you can choose to use only the codes D and P
and you can assign P before you assign D.
1
1
1
10-4
Adding security
The default
The first record in the spreadsheet is called Default. Any commands
or macros that are not listed in the spreadsheet use the security code
selected for the default.
You can change the security code for the default. Initially, it is an
asterisk (*), which means unlimited access. If you leave it as an
asterisk, you have to list all RSView32 commands and macros you
want to secure. This is referred to as security by inclusion. If you
change the default to a letter, you have to list only those commands
you want users who are assigned this code to have access to. This is
referred to as security by exclusion.
Setting up security by inclusion
Security by inclusion means all RSView32 commands and all macros
requiring security are listed in the Security Codes editor.
1. For Default, leave the security code as *.
2. In the Command field, type the command or macro you want to
assign security to.
If you assign security to the Login and Logout commands, be sure
to give all users, including Default, access to these commands.
Otherwise, users might be locked in or out of the system. It is
recommended that Login and Logout keep the * security code.
3. In the Security Code field, select a code for the command or
macro.
4. If you like, type a descriptive remark in the Description field.
5. Repeat steps 2 through 4 for each command and macro.
6. Save the configuration by choosing Close.
1
1
10-5 1
Adding security
Setting up security by exclusion
Security by exclusion means only the RSView32 commands and
macros you want users who are assigned this code to have access to
are listed in the Security Codes editor.
1. For Default, change the security code to any letter.
2. In the Command field, type a command or macro you want users
who are assigned this code to have access to.
Ensure you include the Login and Logout commands and assign
them the * security code.
3. In the Security Code field, select a code for the command or
macro.
4. If you like, type a descriptive remark in the Description field.
5. Repeat steps 2 through 4 for each command and macro.
6. Save the configuration by choosing Close.
Preventing access to the Security Codes and User Accounts
editors
Both the Security Codes editor and the User Accounts editor have
commands that can be used at runtime to open these editors. The
Security command opens the Security Codes editor and the Account
command opens the User Accounts editor.
Be sure to secure the Security and Account commands in the
Security Codes editor to prevent users from accessing these editors at
runtime. If users open the editors, they can edit any information.
Also be sure to restrict access to the ProjectShow command, as it
allows access to these editors. For additional information see
“Securing the Project Manager” on page 10-18.
1
1
1
10-6
Adding security
Using strict security
When strict security is on, the system checks the security codes of
commands and macros no matter where they are issued from. When
strict security is off, the system checks the security codes of
commands and macros only when they are issued from the
command line. 7.
When strict security is on, RSView32 checks security access to
commands or macros issued from:
macros
command line
button objects
object, display, and global keys
objects configured with touch animation
Alarm Identification field in the Tag Database editor
By default, strict security is on. For most projects, strict security is
desirable.
IMPORTANT Strict security always applies to graphic displays, OLE verbs, and tags. If
you assign security to any of these items, their security is always
checked.
1
1
10-7 1
Adding security
Turning off strict security
If you turn off strict security, security access to graphic displays,
OLE verbs, and tags is still checked. As well, commands issued from
the command line are checked. However, the system does not check
security access to commands issued from components other than the
command line. For example, if strict security is off, commands issued
from a graphic display are not checked for security access.
To turn off strict security:
1. Open the Security Codes editor.
2. On the menu bar, click Setup, and then click Strict Security.
If you do NOT want strict security, clear this check box.
3. Clear the check box.
4. Click OK.
1
1
1
10-8
Adding security
Assigning security to a graphic display
Security is assigned to a graphic display in the Graphic Display
editor. You can assign security while you are creating a graphic
display, or you can assign it later.
1. In the Graphic Display editor, open Display Settings by doing one
of the following:
click Display Settings on the Edit menu
right-click the mouse button and then click Display Settings
Select a
security
code.
2. Select a security code.
3. Click OK.
1
1
10-9 1
Adding security
Assigning security to an OLE object
Security is assigned to a graphic object with OLE verb animation in
the Graphic Display editor.
IMPORTANT Once an OLE object is activated, there is no security within the associated
application. Therefore, the only way to secure the application is to assign
security to the OLE object.
1. Open the Graphic Display editor.
2. Select the OLE object you would like to secure.
3. Open the Animation dialog box by doing one of the following:
click an item on the Animation menu
click Animation on the View menu
click Animation on the context menu and click an item
4. Click the OLE Verb tab.
Select a
security code.
5. In the OLE Verb field, select the verb you want to secure.
6. Select a security code.
7. Click Apply.
1
1
1
10-10
Adding security
Assigning security to a tag
Security is assigned to tags in the Tag Database editor. By assigning
security, you can restrict write access to a tag so a user cannot change
the tag’s value.
1. Open the Tag Database editor.
2. Select the tag that requires security.
3. Select a security code.
Select a security code.
4. Click Accept.
1
1
10-11 1
Adding security
Configuring user accounts
Once you have assigned security codes to RSView32 components,
assign these codes to users. You can configure user accounts in the
User Accounts editor, or, if you are using Windows NT, you can use
the Windows NT user list instead of configuring a custom RSView32
list.
To open the User Accounts editor:
1. In the Project Manager, open the System folder.
2. Open the User Accounts editor by doing one of the following:
double-click the User Accounts icon
right-click the User Accounts icon and then click Show
1
1
1
10-12
Adding security
About the default user
The default user account is active when no user is logged into the
system. When setting up security, keep the following in mind:
You can change the security codes for the default user account,
but you cannot change the account ID, or add a password.
For a completely secure project, clear all security codes for the
default user account. This ensures that the default user does not
have any privileges.
Ensuring you always have access
When setting up accounts, first create a “super user” account for the
system administrator, filling in the fields as specified below. Be sure
to select all security codes (A through P).
Creating user accounts
You can create user accounts in the User Accounts editor, or, if the
computer on which RSView32 is installed is running Windows NT,
you can create user accounts by adding users from the Windows NT
domain user list. You cannot use both Windows NT and RSView32
to maintain user accounts in the same project.
When you use the NT user list you can’t enter or change user names
or passwords in the User Accounts editor, but you can specify login
and logout macros.
All users you add from the Windows NT user list must be in the
same Windows NT domain. All NT users added to the RSView32
User Accounts will have the same security codes as DEFAULT in
the User Accounts editor.
Once you have added users from the Windows NT user list, you will
have to specify security access for each user you added in the
RSView32 User Accounts editor.
1
1
10-13 1
Adding security
To create user accounts using the User Accounts editor:
1. In the Account ID field, type a user ID up to 20 characters long.
The ID can include letters and numbers, but cannot include
spaces, or the characters / \ [ ] ; : | = , . + * ? < >. The ID also
cannot be NULL.
The account ID can be the name of a user, a name for a group of
users, or an ID number.
2. If you like, type the name of a macro in the Login Macro and
Logout Macro fields.
These macros run each time this user logs in and out. For more
information about macros see “Login and logout macros” on
page 10-17.
3. In the Password field, type a password up to eight characters long.
The password can include letters and numbers, and is not case
sensitive. A blank or null password is acceptable.
Users can change the password at runtime. For details, see
“Changing passwords at runtime” on page 10-20.
4. In the Security Codes area, select the check box for each security
code you want this user to have access to.
5. Click Accept.
6. Repeats steps 1 through 5 for each user.
7. To save the user account configuration, click Close.
1
1
1
10-14
Adding security
To create users from the Windows NT domain user list:
1. On the Setup menu, click NT Security Options.
In the NT Security Options dialog you select which NT users you
want to make up the RSView32 user accounts list. All users must
be in the same NT domain. All NT users added to the RSView32
User Accounts will have the same security codes as DEFAULT in
the User Accounts editor. You will have to specify individual
users security access in the User Accounts editor’s main dialog.
2. Click the option Use NT User Accounts as Source for RSView32
User Accounts.
3. Select the NT domain that contains the users you want to add to
the RSView32 user list.
4. Do one of the following:
Select users from the NT Domain User Accounts list, and then
click the single right arrow ( > ) or double-click one of the user
names to copy them into the RSView32 User Accounts list. To
copy all the users from the NT Domain User Accounts list,
click the double arrow ( >> ).
Check the option Synchronize RSView32 User Accounts with
NT User Accounts, to use all NT user accounts for the
RSView32 user accounts list and have it automatically updated
whenever new users are added to, or removed from the domain.
1
1
10-15 1
Adding security
Moving a project with Windows NT user accounts to a
Windows 9x computer
When you move a project that uses the Windows NT security option
to a computer running Windows 9x, you can continue using your
project with the Windows NT security option enabled, provided you
enable user-level access control in Windows 9x.
To enable user-level access control in Windows 9x:
1. On the Windows 9x computer, click Start, point to Settings, and
then click Control Panel.
2. Double-click the Network icon.
3. Click the Access Control tab.
4. Click User-Level Access Control.
5. In the Domain field, type the name of the Windows NT domain
on which you want to authenticate your user name.
6. Click OK.
7. Reboot your computer.
With user-level access control enabled, all users will still be able to
log in and log out of your project, but you will not be able to change
the user list, and synchronization of the RSView32 user list with the
Windows NT user list will fail. You will also not be able to change
users’ passwords.
When you load a project with the Windows NT security option
enabled on a computer running Windows 9x, the project opens with
the DEFAULT user logged in. With Windows NT, the project opens
with the current user logged in.
1
1
1
10-16
Adding security
To disable the Windows NT security option after moving your project to
Windows 9x:
1. On the Windows 9x computer, in the Project Manager,
double-click the System folder, and then double-click User
Accounts.
2. On the Setup menu, click NT Security options.
3. Clear the checkbox Use NT User Accounts as Source for
RSView32 User Accounts.
4. Create or modify user accounts using the standard RSView32
method.
For details about creating user accounts, see page 10-13.
Login and logout macros
Each person with a user account can have a login and logout macro.
Any macro file can be a login or logout macro and the file can
contain any RSView32 command. For example, a login macro could
contain a command to bring up a graphic display for an area of the
plant. A logout macro could contain commands to close all active
screens and redefine sensitive keys. 5.
For more information on macros, see “Creating macros” on
page 15-7.
1
1
10-17 1
Adding security
Securing the Project Manager
There is no security from within the Project Manager. Therefore, to
prevent unrestricted access to project components, ensure users
cannot access the Project Manager. To do this, you can:
6.
assign security to the ProjectStop and ProjectShow commands in
the Security Codes editor. For details about these commands and
how to hide the Project Manager, see Appendix A, RSView32
commands, or see Help.
disable the Windows shortcut keys for accessing the Project
Manager (Ctrl-Alt-P) by selecting the appropriate check box in
the Startup editor. For details, see page 18-5.
Preventing users from going out of the RSView32 project
To prevent users from going outside of the RSView32 project, do
one or more of the following:
do not include title bars or minimize and maximize buttons on
graphic displays by deselecting the appropriate options in the
Graphic Display editor’s Display Settings dialog box. For details,
see page 11-16.
disable access to the operating system as follows:
for Windows 9x and Windows NT, prevent users from
switching to other applications by disabling “Switch to other
Apps” in the Startup editor
for Windows 9x, prevent users from restarting the computer by
disabling Ctrl-Alt-Del in the Startup editor
for Windows NT, prevent users from accessing the desktop by
using the NT 4.0 Desktop Lock tool in the RSView32 Tools
program folder
For details about the Startup editor, see Chapter 18, Running your
project.
For details about the NT 4.0 Desktop Lock tool, see the NT 4.0
Desktop Lock Help.
1
1
1
10-18
Adding security
Logging in at runtime
When you use the Windows NT security option, user authentication
at login is performed by Windows NT rather than by RSView32.
If your project requires users to log in when the project opens,
ensure you include a way for them to issue the Login command. For
example, create a button and use the Login command as the press
action. When a user presses the button, the following dialog box
appears:
If your project does not require users to log in when the project
opens, and you are not using the Windows NT security option, the
user called DEFAULT is logged in automatically. If you are using the
Windows NT security option, the current Windows NT user is
logged into RSView32 instead of DEFAULT, if the current Windows
NT user also has an RSView32 user account. If the user doesn’t also
have an RSView32 user account, RSView32 opens with DEFAULT
as the user.
When the current user logs out, DEFAULT is shown as the
logged-in user.
1
1
10-19 1
Adding security
Changing passwords at runtime
If you want operators to be able to change their passwords, include a
way for them to access the Password dialog box.
One way is to create a button and use the Password command as the
press action. When the button is pressed, the Password dialog box
appears.
The new
password is
typed here
to confirm it.
The new password is also added to the Password field of the User
Accounts editor.
IMPORTANT If your project is using the Windows NT security option, and you change
your password using the RSView32 Password command, your password
for the Windows NT domain will automatically be changed as well.
1
1
1
10-20
11
Creating graphic displays
This chapter describes the Graphic Display editor and outlines how
to:
set up the drawing environment
draw, edit, and arrange graphic objects
use objects from the Graphic Library editor
About graphic displays and graphic objects
A graphic display represents the operator’s view of plant activity.
The display can show system or process data and provide operators
with a way to write values to an external device such as a
programmable controller. Operators can also print the display at
runtime to create a visual record of tag values.
The components that make up a graphic display are called graphic
objects. Objects can be:
created in the Graphic Display editor
dragged and dropped from a graphic library
copied and pasted from another Windows application
created by another Windows application and inserted in the
graphic display using OLE (Object Linking and Embedding)
ActiveXZ objects embedded in the graphic display
1
1
11-1 1
Creating graphic displays
The Graphic Display editor
To open the Graphic Display editor:
1. In the Project Manager, open the Graphics folder.
2. Open the Graphic Display editor by doing one of the following:
double-click the Display icon
right-click the Display icon and then click New
The editor’s main components
The figure below shows the main components of the Graphic
Display editor. Each component is briefly described in the table on
the following page.
Toolbar
Drawing area
Status bar
1
1
1
11-2
Creating graphic displays
The Graphic Display editor’s main components are:
Toolbar
Contains buttons for commonly used menu items. The figure on
the previous page shows only one toolbar but there are several,
including toolbars for drawing tools, line and fill colors, and fill
patterns. You can hide or show toolbars using the View menu, and
you can move the toolbars anywhere on the screen.
For more information about toolbars, see page 11-4.
Drawing area
Is the area for creating graphic displays. Change the background
color of this area in the Display Settings dialog box. For details,
see page 11-21.
Status bar
Describes the action to be performed by the selected menu item
or button. The status bar also displays the x and y coordinates,
and width and height, of the selected object.
Mastering basic techniques
When working on a graphic display, certain actions and techniques
are used frequently. Knowing how to perform these actions can save
you time.
Using the context menu
No matter where you are in the Graphic Display editor, you can
open a context menu by clicking the right mouse button. The items
on the menu depend on the cursor’s location. For example, when
you right-click on an object, the menu contains items relevant to that
object.
When you
right-click an
object . . .
. . . the context
menu opens. It
contains menu items
for working with the
selected object.
1
1
11-3 1
Creating graphic displays
Switching between normal and test modes
Test mode
Normal mode
To quickly test objects in a graphic display, use test mode. When you
are finished testing, switch back to normal mode to continue editing.
To switch between test and normal modes, use the buttons on the
toolbar or the items on the View menu.
If your graphic displays contain objects associated with device tags,
your system must be set up to communicate with programmable
controllers, OPC servers, or DDE servers in order for you to use test
mode.
IMPORTANT Test mode is not the same as running the display. It does not change the
appearance or position of the display as set up in the Display Settings
dialog box.
Using the toolbars
The toolbars are a convenient way to quickly perform an action. You
can: 3.
hide or show them using the items on the View menu. If there is a
check mark beside the toolbar name, the toolbar is visible. If there
is no check mark, the toolbar is hidden.
drag them anywhere on the screen
dock them to an edge of the window (except the ActiveX
Toolbox)
1
1
1
11-4
Creating graphic displays
A toolbar
that is
docked.
Toolbars that
are floating.
Selecting a drawing tool
The Drawing Tools toolbox contains tools for creating, selecting,
and rotating objects. The tools are also available on the Objects
menu.
Drawing Tools toolbox
Objects menu
1
1
11-5 1
Creating graphic displays
Before you can draw an object, you must select the appropriate tool.
To select a drawing tool, click the tool in the toolbox or on the
Objects menu. When you click a tool, the pointer changes to show
which tool is active.
Freehand tool
Text tool
To deselect a drawing tool, do one of the following:
click the Select tool
click another drawing tool
Selecting colors
The color palettes contain the colors you can assign to objects. To
show and hide the color palettes, click them on the View menu. You
can also select colors using the color items on the Attributes menu.
You can select colors before you draw an object, or you can apply
them to an existing object.
Use the Line Color palette to select a color for the outline of an
object, for text, or for hollow objects.
Use the Fill Color palette to select a color for the inside of an object
or for solid objects.
1
1
1
11-6
Creating graphic displays
Selecting and deselecting objects
Select tool
To work with an object, you must first select it with the Select tool.
You can click this tool in the Drawing Tools toolbox or on the
Objects menu.
To deselect a drawing tool, click the Select tool in the toolbox or on
the Objects menu.
To select
Do this
An object
Click the object.
Several objects
Click the first object, Ctrl-click additional objects.
All objects in an area
Drag diagonally to draw a selection border around
the objects.
Ctrl-click objects outside the border to add them to
the selection.
All objects in the drawing area
Click Select All on the Edit menu.
To deselect
Do this
An object
Ctrl-click the object.
Several objects
Hold down Ctrl and drag a selection border around
the objects.
All selected objects
Click in the drawing area, away from any objects.
1
1
11-7 1
Creating graphic displays
Using the grid
To size and position objects precisely, use the grid items on the View
menu. You can change the grid settings any time during the drawing
process.
Check this box to make the grid
visible.
Click here to save the
settings.
Select a color for the grid points.
Set the spacing of the grid
points in pixels
Check this box to make the grid active.
The grid can be active or passive. If you turn on Snap to Grid, the
grid is active and all the objects you draw or position are pulled to
the closest grid point. This makes it easy to align and size objects. If
you turn off Snap to Grid, the grid is passive and does not affect
your drawing or the position of your objects.
Turn off the grid to either draw or position an element between the
grid lines. Turn on the grid and the next object you draw or place
will automatically be aligned with the grid. Turning on the grid does
not affect the placement of existing objects.
You can click Show Grid and Snap On on the View menu.
1
1
1
11-8
Creating graphic displays
Using the Rotate tool
Rotate tool
Use this tool to rotate an object or group of objects around an
anchor point.
You can also use the Rotate tool when attaching rotation animation
to a graphic object. For details about rotation animation, see
“Configuring rotation animation” on page 12-24.
You cannot rotate OLE objects, ActiveX objects, bitmaps, and text.
Rotation of rounded rectangles is supported in Windows NT only.
To rotate an object:
1. Click the Rotate tool.
2. Click the mouse button. A small circle with a crosshair appears.
This is the anchor point that is used as the center of rotation. To
move the center of rotation, drag the crosshair.
You can place the crosshair inside an object.
Or you can place it outside an object.
1
1
11-9 1
Creating graphic displays
3. Place the pointer on an edge of the object and drag the object to
rotate it.
To rotate the object in five-degree increments, press Ctrl while
you drag.
4. When the object is in the desired position, release the mouse
button.
Zooming in and out
Zoom In
To magnify or reduce your view of a graphic display, use Zoom In
and Zoom Out. Zoom In magnifies objects, Zoom Out reduces
magnification.
Zoom Out
To zoom in on objects:
1. Select the objects you want to zoom in on.
2. Click Zoom In on the View menu or click the Zoom In button on
the toolbar.
To zoom out:
Click Zoom Out on the View menu or click the Zoom Out button
on the toolbar. You can also click Cancel Zoom on the View menu.
Correcting mistakes
Undo
If you change your mind about something you did, undo the action.
If you change your mind again, redo the action.
Redo
To undo an operation:
Click Undo on the Edit menu or click the Undo button on the
toolbar.
To redo an operation:
Click Redo on the Edit menu or click the Redo button on the
toolbar.
1
1
1
11-10
Creating graphic displays
Setting up the display
To set up a graphic display, use the Display Settings dialog box.
To open the Display Settings dialog box, do one of the following:
click Display Settings on the Edit menu
right-click in an empty area of the display and then click Display
Settings on the context menu
The Display Settings
dialog box contains
many options for
defining the
appearance of a
graphic display.
You can edit these
options any time
during the drawing
process.
Saving the display settings
You can save the settings for the current graphic display, or you can
save the settings as the default for all new graphic displays.
To save the settings for the current display, click OK.
1
1
11-11 1
Creating graphic displays
Creating a default
To create your own default settings, click Set as Default. When you
open a new graphic display, it will use the display settings you have
configured.
Note that if you click Set as Default the settings for the current
display are not saved. You must also click OK to save the settings for
the current display.
Using the Display Settings dialog box
The Display Settings dialog box has two tabs, Properties and
Behavior.
Use the Properties tab to specify these display options:
display type
multiple running copies
caching
title bar and other display attributes
size, resizing, and position
security
background color
Use the Behavior tab to specify these display options:
startup and shutdown commands
input field colors
behavior of interactive objects
behavior of objects with input focus
on-screen keyboard
These options are described in the sections that follow.
1
1
1
11-12
Creating graphic displays
Specifying the display type
Replace
Replace is the default display type. Use this option if you want the
graphic display to replace other open graphic displays when it opens.
RSView32 will close any graphic display that the newly opened
display overlaps. This way you don’t need to issue separate
commands to close the other displays.
Overlay
Use this option if the graphic display doesn’t need to replace others
or appear on top. The display will layer with other displays,
overlapping some and being overlapped by others as the focus
changes between multiple displays.
Overlay displays will always appear behind On Top displays, and
will be replaced by Replace displays. Use Overlay with care, as
keeping multiple displays open can affect system performance
adversely.
Keep at Back
Check this box if you always want this graphic display at the back.
However, we recommend that you use the On Top display type to
control the layering of displays. Note that you must choose the
Overlay option to use Keep at Back.
On Top
Use this option to keep the graphic display on top at all times. It will
remain on top even if another display has focus. However, if more
than one graphic display of the On Top type is open at once, the
display that has focus, or had the most recent focus, appears on top.
Use the PullForward, PushBack, and SetFocus commands to cycle
through multiple On Top and Overlay screens.
1
1
11-13 1
Creating graphic displays
Allowing multiple running copies
Use this option with displays of type Overlay or On Top. Check this
box to allow more than one copy of the graphic to be displayed at
runtime. When this option is not selected, running displays are
brought to the foreground when they are called via the Display
command, rather than a new copy being loaded.
You can also run multiple copies without checking this option, by
using the Display command with different parameter files for each
copy of the display. For example, to display two copies of the same
graphic in different places on the screen you could use these
commands:
'LVSOD\ 3,' 3/HYHO 4
'LVSOD\ 3,' 3/HYHO 4
PID is a display and Level1 and Level2 are parameter files.
For details about parameter files, see “Using a parameter file to
replace tag placeholders” on page 11-38.
If multiple copies or several separate displays are running and one is
hidden behind another, use the SetFocus command to bring the
hidden display forward. For details, see Appendix A, RSView32
commands, or see Help. However, remember that graphic displays of
the On Top type will always be at the front, regardless of which
display has focus.
1
1
1
11-14
Creating graphic displays
Specifying caching
Cache After Displaying
Select Yes to load the graphic display into the display cache when it
is displayed for the first time. Placing the graphic in the cache makes
subsequent displays of the graphic faster because it does not have to
be read from disk. You can have up to 40 graphic displays in the
cache. We suggest you use this option for large or complex displays
only, to minimize the use of system resources.
Select No if you don’t want RSView32 to load the display into the
display cache. 3.
IMPORTANT Cached displays consume memory. Once Windows consumes all physical
memory, it is forced to swap to disk, which slows all system activities.
Always Updating
Check this box to keep the cached display up-to-date. For example,
choose this option to update trend data continuously for the display,
even when the display is not visible. This option also makes
subsequent displays faster.
IMPORTANT Always updating a cached display can cause added communications
overhead because data will be retrieved for tags whose values would not
otherwise be needed.
Choosing this option affects the behavior of the display’s startup and
shutdown commands. See “Specifying startup and shutdown
commands” on page 11-22 for more information.
1
1
11-15 1
Creating graphic displays
Specifying the title bar and other display attributes
Title Bar
To have a title bar appear on the graphic display at runtime, select the
Title Bar check box. If the Title Bar check box is not selected, the
check boxes for the System Menu, Minimize button, and Maximize
button are not available (because these items all appear on the title
bar). You can also type a title for the graphic display, which will
appear in the title bar at runtime in place of the component name.
The title can be anything you want and can include spaces. You
cannot type a title if the Title Bar check box is not selected.
You must select Title Bar to be able to move the screen’s position at
runtime.
The following illustration shows the window style options available
if you select the Title Bar check box. To include an item, select the
appropriate check box. Otherwise, leave the check box blank.
Title
Maximize button
Minimize button
Title bar
System menu box
1
1
1
11-16
Close button
(comes with System menu box)
Creating graphic displays
Size to Main Window at Runtime
If you select this check box, the graphic display will be the size of
the RSView32 main window when the display starts running. The
graphic display is panned or scaled, depending on which option is
selected under Resize. See page 11-19 for more information.
RSView32 has resolution-independent graphics. This means that no
matter what resolution you use to create your graphic displays, they
will automatically resize to fit the monitor on which they are
displayed.
Show Last Acquired Value
Select this check box to have a graphic displayed with the last known
value for each tag in the display until current values arrive from the
programmable controller. In many projects, selecting this option will
result in graphics displaying more quickly.
If you do not select this option, objects with values that have not yet
been updated will appear in outline form. The outline indicates that
data is not current or is in error.
Selecting Show Last Acquired Value might not affect a graphic
display the first time the display starts because the tags used in the
display might not be initialized and so might not have any values. To
indicate that there are no tag values, the objects appear in outline
form. Once the tags have been initialized and tag values arrive, the
objects appear in their normal form.
This option does not affect objects with tags that are in error. If an
object has a tag that is in error, the object will appear in outline form.
1
1
11-17 1
Creating graphic displays
Preventing scroll bars on the RSView32 main window
If a graphic display is larger than the RSView32 main window, scroll
bars will appear on the main window and will remain there even if
subsequent displays are smaller than the main window.
To prevent scroll bars, all graphic displays must be smaller than the
working area in the RSView32 main window. Keep in mind that the
size of the working area depends on several factors: the size you
make the window, your monitor’s display resolution, and whether
you select the RSView32 toolbar, status bar, and activity bar (on the
View menu).
To minimize scroll bars, RSView32 tries to position all graphic
displays within the working area of the RSView32 main window
unless explicitly overridden by the /X and /Y parameters of the
Display command.
To ensure the RSView32 main window never has scroll bars, select
the Size to Main Window at Runtime option for large displays. Do
not select this option for smaller graphic displays that are not meant
to fill the screen. However, be sure to position the smaller displays so
they are completely visible, otherwise scroll bars might appear.
You can also turn scroll bars on and off using the Windows registry
keys. To change the registry key settings for scroll bars, use the
Registry Configuration tool in the RSView32 Resource Kit. For
details about the Resource Kit, see the RSView32 Resource Kit Help.
1
1
1
11-18
Creating graphic displays
Specifying display size
To set the display size, do one of the following:
select Use Current Size. When you save the graphic display, the
size of the window at that time becomes the default size.
select Specify Size in Pixels, and type values in the Width and
Height fields.
The window size and position you specify here can be overridden by
the RSView32 Display command. The Display command accepts
size and position parameters, which override the Display Settings
options. For more information about the Display command, see
Appendix A, RSView32 commands, or see Help.
Specifying resize behavior
Allow Display to be Resized
If you want a window that can be resized with the mouse, select this
check box. This option works with the pan and scale options.
If you do not select the check box, the graphic display cannot be
resized at runtime.
1
1
11-19 1
Creating graphic displays
When Resized
Select Pan or Scale.
Pan resizes the display so objects retain their original size when the
display size changes. For example, if the display was resized to one
quarter its original size, only one quarter of the display would be
visible. In this case scroll bars appear for viewing the rest of the
display.
Scale resizes the display so objects in the display are magnified or
reduced to retain their size in relation to the display size. For
example, if the display was resized to one quarter its original size, the
entire display would be visible—but it would all be one quarter its
original size.
Specifying display position
To set the display position, do one of the following:
select Use Current Position. When you save the graphic display,
the position of the window at that time becomes the default
position.
select Specify Position in Pixels and type values in the X and Y
fields. These fields specify the position of the window in relation
to the top-left corner of the RSView32 main window. The X value
positions the window from the left edge of the main window and
the Y value positions the window from the top of the main
window.
The window size and position you specify here can be overridden by
the RSView32 Display command. The Display command accepts
size and position parameters, which override the Display Settings
options. For more information about the Display command, see
Appendix A, RSView32 commands, or see Help.
1
1
1
11-20
Creating graphic displays
Specifying a security code
To restrict access to the graphic display, select a security code. For
detailed information about security, see Chapter 10, Adding security.
Specifying background color
To select a background color, click the Background Color box, and
then click a color on the palette. 4.
Use the Behavior
tab of the Display
Settings dialog
box to specify
startup and
shutdown
commands and
the appearance
and behavior of
input fields and
other interactive
objects.
1
1
11-21 1
Creating graphic displays
Specifying startup and shutdown commands
Type commands or macros in the
Startup and Shutdown fields, or click
the ... buttons to open the Command
Wizard and select the commands or
macros.
To run RSView32 commands or macros each time this graphic
display starts or stops, specify the commands or macros. The startup
command runs before the graphic opens so commands such as
UploadAll or RecipeRestore will not work in a startup macro. The
shutdown command runs after the display closes, so commands such
as DownloadAll or RecipeSave will not work in a shutdown macro.
If you use the Always Updating option with the Cache After
Displaying option, the startup command is executed when the
display is loaded into the cache. The shutdown command is executed
only when the cache is flushed (using the FlushCache command) or
when you stop the project. If you do not use the Always Updating
option, the startup and shutdown commands work as described in
the previous paragraph.
For a complete list of RSView32 commands, see Appendix A,
RSView32 commands, or see Help.
1
1
1
11-22
Creating graphic displays
Specifying colors for input fields5.
Input fields are created with the Numeric Input, String Input, and
Recipe drawing tools. At runtime, operators can use these fields to
read values from or write values to the programmable controller.
Click the colored boxes to open the color palette, and then choose
colors.
Text color is the color of the text in the input field. Fill color is the
background color of the input field.
When choosing colors for the input fields, be sure to choose colors
that will stand out from the background color of the display. Choose
different colors for when the field is selected, so the operator can tell
that the field is highlighted.
Specifying the behavior of interactive objects
Interactive objects are those that the operator can interact with at
runtime, either using a mouse, keyboard, or touch screen. For
example, a button that has a press action is interactive.
You can create a tab sequence for interactive objects that use index
numbers. For details, see “Creating a tab sequence” on page 12-45.
1
1
11-23 1
Creating graphic displays
Beep on Press
Check this box if you want the computer to beep when a button
object or an object with touch animation is clicked.
Highlight When Cursor Passes Over It
Check this box to turn on the highlight for interactive objects. Click
the colored box to open the color palette and then choose the
highlight color. At runtime, when the mouse cursor is over an
interactive object, the object will be highlighted.
When choosing a highlight color, be sure to choose a color that
stands out from the display’s background color.
Specifying the behavior of objects with input focus
When an object has input focus—that is, the object is ready to accept
keyboard or mouse input—the object will have a highlight box. You
can enable or disable this highlight box, and select the color of the
box.
When choosing a highlight color, be sure to choose a color that
stands out from the display’s background color.
1
1
1
11-24
Creating graphic displays
The following illustration shows the two types of highlight:
This object is an
interactive object,
but it is not the
object with input
focus.
This object is the one with
focus—as indicated by the
cursor. The highlight box is
a different color than the
highlight box for the
interactive object.
An object can have both types of highlight at one time.
Displaying the on-screen keyboard
Select this option to display a keyboard on the screen at runtime for
numeric input, string input, and recipe fields in the graphic display.
The keyboard appears only when an operator selects one of these
fields for input. The on-screen keyboard is typically used with
systems that do not have a hardware keyboard, such as systems that
use touch screens only.
This field is selected for input.
1
1
11-25 1
Creating graphic displays
When the operator clicks or touches the selected field, or presses
Enter on a hardware keyboard, the on-screen keyboard appears. The
keyboard for string input and recipe fields allows alphanumeric
entry.
The keypad for numeric input fields allows numeric entry only.
1
1
1
11-26
Creating graphic displays
Displaying graphics more quickly
Graphic displays appear more quickly if they have been stored in the
display cache. You can place up to 40 graphic displays in the cache.
To cache displays:
select the Cache After Displaying option in the Display Settings
dialog box. For details, see page 11-15.
use the [cache] parameter with the Display command. The [cache]
parameter loads a graphic display into the cache without
displaying it. The [cache] parameter has two options: /Z and /ZA.
For example, the command Display Bakery /Z loads the graphic
display called Bakery into the cache but does not display it. When
the graphic is called up, it is displayed quickly. The command
Display Bakery /ZA loads the display into the cache and
continually updates the values in the display. For more details
about the Display command, see Appendix A, RSView32
commands, or see Help.
Removing displays from the cache
To remove all graphic displays from the display cache, use the
FlushCache command. To remove a specific graphic display from the
display cache, use the FlushCache <file> command. Graphic displays
are also removed from the cache when a project is closed or stopped.
If a display uses the Always Updating option with the Cache After
Displaying option, the display’s shutdown command is executed
when you issue a FlushCache command, or when you close the
project. For details about the FlushCache commands, see
Appendix A, RSView32 commands, or see Help.
1
1
11-27 1
Creating graphic displays
Types of graphic objects
You can create the following types of objects:
Simple objects: geometric and freehand objects, and text. These
objects are created in the RSView32 Graphic Display editor.
Advanced objects: complex objects that typically require data
configuration.
OLE objects: objects such as spreadsheets, charts, or text
produced by other Windows applications. The types of OLE
objects that are available depend on the software installed on your
system.
ActiveX objects (formerly called OLE custom controls or
OCXs): control objects such as gauges, sliders, and buttons, and
objects you create yourself using a tool like Visual Basic. These
objects allow an external action, such as a mouse click, to initiate
an action within RSView32. The ActiveX objects that are available
depend on the software installed on your system.
Most objects, including OLE objects, can have animation attached to
them. For more information, see Chapter 12, Animating graphic
objects.
Creating simple objects
Use the drawing tools in the Drawing Tools toolbox or on the
Objects menu to draw simple objects. Once you have selected a
drawing tool, there are two ways to draw objects: dragging, or
clicking end points. Some objects, such as rectangles, ellipses, and
arcs, can be drawn only by dragging. Others, such as polylines and
polygons, can be drawn only by clicking end points.
1
1
1
11-28
Creating graphic displays
Drawing a rounded rectangle
Rounded Rectangle tool
Use the Rounded Rectangle tool to draw a rectangle with rounded
corners.
1. Click the Rounded Rectangle tool.
2. Drag the drawing tool diagonally until the object is the size you
want.
You can change a rounded rectangle into a right-angle rectangle by
using the small black box that appears inside the rounded
rectangle. Place the pointer on the box and drag the drawing tool
until the rectangle is the desired shape.
Note that rounded rectangles can only be rotated in Windows NT
(not Windows 9x).
Drawing a rectangle or square
Use the Rectangle tool to draw a rectangle or square.
Rectangle tool
1. Click the Rectangle tool.
2. To draw a rectangle, drag the drawing tool diagonally until the
object is the size you want.
To draw a square, hold down Ctrl while you drag.
1
1
11-29 1
Creating graphic displays
Drawing an ellipse or circle
Use the Ellipse tool to draw an ellipse or circle.
Ellipse tool
1. Click the Ellipse tool.
2. To draw an ellipse, drag the drawing tool diagonally until the
object is the size you want.
To draw a circle, hold down Ctrl while you drag.
Drawing a line
Line tool
Use the Line tool to draw straight lines in any direction.
1. Click the Line tool.
2. Drag from the beginning point to the end point.
To draw horizontal or vertical lines (not diagonal lines), hold
down Ctrl while you drag the mouse.
You can also use the Snap to Grid option to draw straight lines.
You can change the style and width of lines using Line Properties on
the Attributes menu. For details, see page 11-95.
1
1
1
11-30
Creating graphic displays
Drawing a polyline or polygon
Polyline tool
A polyline is a series of connected line segments. A polygon is a
closed polyline shape.
Polygon tool
Polyline
Hollow Polygon
Filled Polygon
1. Click the Polyline or Polygon tool.
2. Drag the drawing tool to create the first segment of the object.
Release the mouse button.
To draw horizontal or vertical lines (not diagonal lines), hold
down Ctrl while you drag the mouse.
3. Move the drawing tool to where you want the angle of the
polyline or polygon to be and click.
Repeat this step until you have completed the object.
4. To finish drawing, click the Select tool.
1
1
11-31 1
Creating graphic displays
Drawing a freehand object
Drawing freehand is similar to drawing with a pen on paper.
Freehand tool
1. Click the Freehand tool.
2. Drag the drawing tool to create the shape you want.
Drawing an arc or wedge
Arcs and wedges are drawn in two steps: first you create a circle, and
then you reshape the circle.
Arc tool
To draw the arc or wedge in 45-degree increments, hold down Ctrl
while you draw.
Wedge tool
Arc
Hollow Wedge
Filled Wedge
1. Select the Arc or Wedge tool.
2. Drag to draw a circle. Release the mouse button.
When you release the mouse button, a set of handles appears so
you can reshape the circle.
1
1
1
11-32
Creating graphic displays
3. Click a handle, and drag the mouse to ‘cut out’ part of the circle.
You can also use the Arc and Wedge tools to reshape any arc, ellipse,
or wedge.
Creating text
1. Click the Text tool.
Text tool
The pointer becomes an I-beam ( ).
2. Type the text.
Once the Text tool is selected, you can create more than one text
object. To do so, move to an empty spot in the drawing area, click,
and then type the text.
To edit text, select the text object and double-click. The I-beam
appears. To delete text characters, use the Backspace and Delete
keys.
You cannot rotate text.
1
1
11-33 1
Creating graphic displays
Choosing a font
You can choose a font before or after you create text. Fonts apply to
all objects, including display and input objects.
1. Select the text object or objects you want to format, or position
the I-beam where you want to begin typing text.
2. On the Attributes menu, click Font.
3. Select the font style, size, and effects you want.
IMPORTANT You can select any font you have installed, but TrueTypeZ fonts are
recommended. These fonts can be resized with graphic scaling.
The fonts listed here
depend on the fonts
you have installed in
Windows.
4. Click OK.
You can also choose font color using the Line Color palette or using
the Line Color item on the Attributes menu.
1
1
1
11-34
Creating graphic displays
Font substitution at runtime
If you run a project on a computer that does not have the fonts you
used when configuring the project, Windows will substitute fonts.
Reshaping simple objects
You can easily reshape any simple object.
To reshape lines, rectangles, polylines, and polygons:
1. Place the pointer on the object you want to reshape and
double-click, or right-click and then click Edit Object.
The cursor changes to the Polygon tool.
2. Move the cursor over any line in the object.
A handle with a cross-hair appears.
3. Drag the handle until the object is the desired shape.
To maintain the aspect ratio of any object while resizing, grab a
corner handle, press Shift, and drag the mouse.
1
1
11-35 1
Creating graphic displays
To reshape arcs, ellipses, and wedges:
1. Place the pointer on the object you want to reshape and
double-click, or right-click and then click Edit Object.
The cursor changes to the Arc or Wedge tool, and handles appear
on the object.
2. Place the pointer on one of the handles.
A cross-hair appears.
3. Drag the handle until the object is the desired shape.
Creating advanced objects
To create advanced objects, use the drawing tools in the Drawing
Tools toolbox or the items under the Advanced Objects sub-menu.
The basic steps are:
1. Click a drawing tool and drag it to create a box approximately the
size you want for the object.
When you release the mouse button, a dialog box opens.
2. Configure the object by entering the required information.
Most advanced objects display information about a tag. Therefore,
as part of configuration, you have to supply a tag name or tag
placeholder.
1
1
1
11-36
Creating graphic displays
Objects described in other chapters
Detailed information about configuring certain advanced objects is
contained in other chapters. The following table lists where you can
find information:
To configure this object
See
Tag monitor
Chapter 4, Creating tags
Alarm summary
Chapter 6, Configuring alarms
Trend
Chapter 13, Configuring trends
Command line
Appendix A, RSView32 commands
Using tag names
When creating advanced objects, you can use the name of an existing
tag or a tag that is not yet in the tag database. If you specify a tag that
does not exist, you are prompted to create it.3.
To supply a tag name, do one of the following:
type a tag name in a Tag Name field or in an Expression field
Browse
click the Browse button and select a tag from the list
Using tag placeholders
Tag placeholders provide a way to use one graphic display to
represent a number of similar operations. 4.
For example, imagine you are creating displays for a plant that cans
corn and beans. The machinery used in both processes is identical.
Instead of drawing two displays and specifying corn-related tags in
one display and bean-related tags in another, you can create one
display and not specify any tag names. Where a tag name is required,
type a tag placeholder.
When the display is run, the tag each placeholder represents must be
specified. This can be done in two ways: with a parameter file, or by
specifying the tag names.
1
1
11-37 1
Creating graphic displays
Creating a tag placeholder
A tag placeholder is the cross-hatch character (#) followed by a
number from 1 to 500, as shown in the example below:
You can also add a folder name to the placeholder. For example,
#1\PV is a valid placeholder and requires only one parameter (the
folder name).
For tag placeholders in alarm summary objects (when they are
contained in graphic displays only), you can use wildcards in the
placeholder. For example, #1\PV* is a valid placeholder.
You cannot use wildcards in tag placeholders in alarm summary files
when they are not contained in a graphic display. That is, you cannot
use wildcards if the alarm summary was created using the Alarm
Summary editor. For more information about alarm summaries see
“Creating an alarm summary” on page 6-52.
Using a parameter file to replace tag placeholders
A parameter file contains one entry for each unique placeholder in a
display. When you run a display, you specify the filename along with
the /P parameter. For details about the Display command, see
Appendix A, RSView32 commands, or see Help. 5.
1
1
1
11-38
Creating graphic displays
To create a parameter file:
1. Open the Parameters editor.
2. Type one entry for each unique placeholder in the display,
associating the placeholder with a tag name. For example:
#1 = bean_weight
#2 = bean_level
#3 = bean_temp
3. Save the file with a meaningful name (for example, Beans).
For tag placeholders in alarm summary objects in graphic displays
only, you can use wildcards in the parameter file. For example,
#1 = bean_* is a valid parameter entry. The alarm summary would
display any alarms associated with tags beginning with bean_.
Note that you cannot use wildcards in placeholders for any other
type of graphic object.
To run a parameter file:
Type the following command in a macro or anywhere else you can
use an RSView32 command:
Display <file> [/Pfile]
where:
<file>
is the name of the graphic display file.
[/Pfile]
is the parameter file containing the tags to be
substituted into the display.
1
1
11-39 1
Creating graphic displays
Example: Using a Parameter File to Replace Tag Placeholders
To run the display called Canning with the parameter file called
Beans, type:
Display Canning /PBeans
Listing tag names to replace tag placeholders
When you run a graphic display, you can specify the tag names using
the RSView32 Display command with the /T parameter.
To replace tag placeholders:
Type the following command in a macro or anywhere else you can
use an RSView32 command:
Display <file> /T[tag_name]
where:
<file>
is the name of the graphic display file.
/T[tag_name] is one or more tags to be substituted into the
display. The tag name can also be a folder name.
If multiple tag names are used, separate them with
commas. Do not use spaces.
For tag placeholders in alarm summary objects in graphic displays
only, you can use wildcards when you specify tag names on the
command line.
1
1
1
11-40
Creating graphic displays
Example 1: Replacing tag placeholders by listing tag names
To run the display called Canning with the tags Pea_Weight,
Pea_Level, Pea_Temp:
Type:
Display Canning /TPea_Weight,Pea_Level,Pea_Temp
Example 2: Replacing tag placeholders by using a folder name
In the following example, the tag database contains these tags:
Corn\Weight
Corn\Level
Corn\Temp
Bean\Weight
Bean\Level
Bean\Temp
Anywhere a tag name is required, the placeholder #1 is used for the
folder name. That is, all objects that use these tags would be set up
using the folder placeholder and the tag name: #1\Weight, #1\Level,
or #1\Temp.
To run the display called Canning with the folder containing corn
tags, type:
Display Canning /TCorn
To run the display called Canning with the folder containing bean
tags, type:
Display Canning /TBean
1
1
11-41 1
Creating graphic displays
Creating numeric and string input fields
Numeric Input tool
String Input tool
Use the Numeric Input tool to create fields that operators can use to
enter data for analog and digital tags. Use the String Input tool to
create fields that operators can use to enter data for string tags. When
the display runs, operators can use these fields to write values to the
value table. The values can then be accessed by the programmable
controller, external OPC or DDE device, or RSView32 memory.
A display can contain up to 500 input fields.
12345
Programmable
Controller
To download data, the operator types a number into the input field and presses PgDn.
Numeric and string input fields can also be used to upload values
and display them in a graphic display.
12345
Programmable
Controller
To upload data and display it in the input field, the operator presses PgUp.
Operators can select any one of the input fields in the display and
read or write the values associated with that field, or they can read or
write all the values at once. You also have the option of setting input
fields so that tag values update continuously when the operator is
not using the field to input data.
1
1
1
11-42
Creating graphic displays
An operator can also retrieve a series of values from a recipe file,
change them, write the changed values back to the programmable
controller and/or save them to a recipe file. For more information on
recipe files, see “Creating a recipe field” on page 11-59.
If an upload fails because of a communication error, question marks
appear in the numeric input fields.
Colors for input fields are set in the Display Settings dialog box. For
details, see “Specifying colors for input fields” on page 11-23.
To create a Numeric Input field:
1. Click the Numeric Input tool.
2. Drag the mouse to draw the field.
3. Release the mouse button.
1
1
11-43 1
Creating graphic displays
4. Fill in the fields as follows:
In this field
Do this
Tag Name
Type a tag name or a placeholder for an analog or digital tag.
For details about placeholders, see “Using tag placeholders”
on page 11-37.
Index
Either leave the default as it is or type a number other than
the default. Index numbers determine the Tab sequence for
interactive objects such as input objects and buttons, and are
also used in recipe files. For details, see “Using index
numbers” on page 12-43.
Default Data
Type a value that will appear in the numeric input field when
the graphic is initially displayed.
Continuously
Update
Check this box to have tag value changes appear in the field
when the operator is not using the field to input data.
Field Length
Type a value to specify the maximum number of characters
that will be displayed in this field. Be sure the field is long
enough to accommodate all the possible values for the tag.
Format
Select a number base for the value.
Decimal Places
Type the number of places you want after the decimal point.
This number must be at least one less than the field width.
Overflow
You can select this field only if Floating Point is selected in the
Format field. Specify how you want the floating point value
displayed if it is too long for the field. The value can be shown
as an exponent, rounded up to fit in the field, or completely
replaced by asterisks.
Justification
Select Left, Center, or Right to specify how the values will be
aligned within the field.
Leading Character
Select Blanks or Zeroes.
5. Click OK.
1
1
1
11-44
Creating graphic displays
To create a String Input field:
1. Click the String Input tool.
2. Drag the mouse to draw the field.
3. Release the mouse button.
4. Fill in the fields as follows:
In this field
Do this
Tag Name
Specify a tag name or a placeholder for a string tag. For details
about placeholders, see “Using tag placeholders” on page 11-37.
Index
Either leave the default as it is or type a number other than the
default. Index numbers determine the tab sequence for interactive
objects such as input objects and buttons, and are also used in
recipe files. For details, see “Using index numbers” on
page 12-43.
Default Data
Type the text that will appear in the string input field when the
graphic is initially displayed.
Continuously
Update
Check this box to have tag value changes appear in the field when
the operator is not using the field to input data.
Dimensions
Type a value to specify the maximum number of characters that
will be displayed in this field. Be sure the field is long enough to
accommodate the string for the tag.
Justification
Select Left, Center, or Right to specify how the values will be
aligned within the field.
5. Click OK.
1
1
11-45 1
Creating graphic displays
Using input fields at runtime
At runtime, operators can use input fields to retrieve data from and
send data to the value table so it can be accessed by the
programmable controller, external OPC server or DDE device, or by
RSView32 memory.
Continuously updating tag values
This field is in
display mode.
This field is in
pending write
mode.
This field is in
input mode.
When a numeric or string input field is set to update continuously
and display tag values, its appearance changes to reflect which mode
the field is in. When the field is displaying a value from the
programmable controller or server (display mode), the border
around the field is dotted. When a value has been entered in the field
but not downloaded yet (pending write mode), the border around
the field becomes solid. When a field is ready to receive input (input
mode), the border is solid and the field is surrounded by a highlight
box.
The operator can put the field into input mode by setting focus on
the field, uploading to the field, or restoring a recipe to the field. The
operator can set the field back to display mode by pressing the
Escape key.
When you first open a display containing fields set to update
continuously, default focus is given to the first non-updating field in
the index sequence. If all fields in the display are set to update
continuously, no field is given focus until the operator sets focus on a
field.
If an upload fails because of a communication error, question marks
appear in the numeric input fields.
1
1
1
11-46
Creating graphic displays
Keys
Operators can use the following keys to retrieve data from and send
data to the value table. You can re-assign these actions to other keys
or assign them to button objects.
PgDn: downloads the contents of all input fields in the active
graphic display to the value table
Ctrl-PgDn: downloads the contents of a selected input field to
the value table
Enter: downloads the contents of a selected input field to the
value table, unless the display was invoked using the /E parameter,
which disables the Enter key.
If the display has been set up to use the on-screen keyboard,
pressing Enter brings up the on-screen keyboard.
PgUp: uploads all values from the value table and displays them
in the input fields
Ctrl-PgUp: uploads a value from the value table for the selected
input field
Tab: moves between input fields
RSView32 commands
Operators can use these commands to retrieve data from and send
data to the value table:
Download: downloads the contents of the selected input field to
the value table
DownloadAll: downloads the contents of all input fields to the
value table
Upload: uploads a value from the value table and displays it in the
selected input field
UploadAll: uploads all the values from the value table and
displays them in the input fields
For detailed information about commands, see Appendix A,
RSView32 commands, or see Help.
1
1
11-47 1
Creating graphic displays
Using the on-screen keyboard
Displays can be set up so that an operator can use an on-screen
keyboard for input entry in numeric, string, and recipe input fields.
The characters the operator types using the on-screen keyboard
appear in the selected input field when the operator presses the
Download or Update Field button on the on-screen keyboard, or
when the operator presses Enter on a hardware keyboard.
This button
Does this
Update Field
Closes the on-screen keyboard and stores the new value on
screen, for later download.
Download
For numeric and string input fields, closes the on-screen
keyboard and downloads the value or text the operator typed.
For recipe fields, closes the on-screen keyboard, opens the
Recipe dialog box, and inserts in the Recipe File field the text the
operator typed.
Cancel
Discards the operator’s changes and closes the on-screen
keyboard.
For information about setting up displays to use the on-screen
keyboard see “Displaying the on-screen keyboard” on page 11-25.
1
1
1
11-48
Creating graphic displays
Creating numeric and string display fields
Numeric Display tool
Use the Numeric Display tool to create fields that operators can use
to display the current value of an analog or digital tag or a value
based on an expression. Use the String Display tool to create fields
that operators can use to display the current value of a string tag.
String Display tool
To create a Numeric Display field:
1. Click the Numeric Display tool.
2. Drag the mouse to draw the field.
3. Release the mouse button.
1
1
11-49 1
Creating graphic displays
4. Fill in the fields as follows:
In this field
Do this
Expression
Create an expression. At runtime, the numeric result of this
expression is displayed in the Numeric Display field. For details
about expressions, see Chapter 14, Creating expressions.
Field Length
Type a value to specify the maximum number of characters
that will be displayed in this field. Be sure the field is long
enough to accommodate the result of the expression.
Format
Select a number base for the value.
Decimal Places
Type the number of places you want after the decimal point.
This number must be at least one less than the field width.
Overflow
This field is available only if Floating Point is selected in the
Format field. Use this field to specify how you want the floating
point value displayed if it is too long for the field. The value can
be shown as an exponent, rounded up to fit in the field, or
completely replaced by asterisks.
Leading Character
Select Blanks or Zeroes.
Justification
Select Left, Center, or Right to specify how the values will be
aligned within the field.
5. Click OK.
To create a String Display field:
1. Click the String Display tool.
2. Drag the mouse to draw the field.
3. Release the mouse button.
1
1
1
11-50
Creating graphic displays
4. Fill in the fields as follows:
In this field
Do this
Expression
Create an expression. At runtime, the string result of this
expression is displayed in the String Display field. For details
about expressions, see Chapter 14, Creating expressions.
Dimensions
Type a value to specify the maximum number of characters
that will be displayed in this field. Be sure the field is long
enough to accommodate the result of the expression.
Justification
Select Left, Center, or Right to specify how the values will be
aligned within the field.
Character Offset
Select a number of characters. This number determines the
first characters to be displayed in the field starting at 0. You
can display an entire string or part of a string. You can also
display parts of the same string in different string display
fields.
For example, assume you have a string 12 characters long.
The first eight characters contain the tag address. The last
four characters contain the tag status. To display only the
status, specify a character offset of 8. The address part of the
string will not be displayed. To display the address in a
separate field, create another string display field, specify the
same tag name and specify a field width of 8 and an offset
of 0.
5. Click OK.
1
1
11-51 1
Creating graphic displays
Creating labels
Label tool
Use the Label tool to create fields that display different types of tag
information at runtime. All the information comes from fields you
configure for the tag in the Tag Database editor.
You can create the following types of labels:
This label
Displays
Minimum
An analog tag’s minimum value
Maximum
An analog tag’s maximum value
Status
The current status of a digital tag. When the tag value is 1, “On Label” is
displayed; when the tag value is 0, “Off Label” is displayed
Units
An analog tag’s units label
Name
A tag’s name
Description
A tag’s description
Off Label
A digital tag’s off label
On Label
A digital tag’s on label
To create a label:
1. Click the Label tool.
2. Drag the mouse to draw the label field.
3. Release the mouse button.
Select a label
from the list.
1
1
1
11-52
Creating graphic displays
4. Fill in the fields as follows:
In this field
Do this
Tag Name
Specify a tag name or placeholder.
For information on placeholders, see “Using tag placeholders”
on page 11-37.
Field Length
Type a value to specify the maximum number of characters
that will be displayed in this field. Be sure the field is long
enough to accommodate the label.
The maximum field width depends on the type of label you are
creating.
Label Type
Select a type.
Justification
Select Left, Center, or Right to specify how the values will be
aligned within the field.
5. Click OK.
Creating arrows
Arrow tool
Use the Arrow tool to create arrows that move based on the results
of an expression. Arrows can move vertically or horizontally.
Vertical arrows move up or down in relation to a tag’s minimum and
maximum values. Horizontal arrows move left and right in relation
to the minimum and maximum values.
For vertical arrows, if the value is less than or equal to the minimum
value, the arrow is at the bottom. If the value is equal to or greater
than the maximum value, the arrow is at the top.
For horizontal arrows, if the value is less than or equal to the
minimum value, the arrow is at the left. If the value is equal to or
greater than the maximum value, the arrow is at the right.
1
1
11-53 1
Creating graphic displays
To create an arrow:
1. Click the Arrow tool.
2. To draw a rectangle for a vertical arrow, drag the mouse vertically.
To draw a rectangle for a horizontal arrow, drag the mouse
horizontally.
3. Release the mouse button.
4. Fill in the fields as follows:
In this field
Do this
Expression
Create an expression. At runtime, the numeric result of the
expression positions the arrow. For details about expressions,
see Chapter 14, Creating expressions.
Range
To use the minimum and maximum values for the first tag in the
expression, clear the Specify check box. To specify a minimum
and maximum value that is different than the first tag’s, enter
values in the Min and Max fields.
Direction
Select Vertical or Horizontal.
5. Click OK.
1
1
1
11-54
Creating graphic displays
Creating buttons
Button tool
Use the Button tool to create buttons that work like standard
Windows buttons. You can attach RSView32 commands to the
buttons so they trigger actions when pressed and released.
You can apply visibility, color, horizontal and vertical slider,
horizontal and vertical position, width, and height animation to the
button.
To create a button:
1. Click the Button tool.
2. Drag the mouse to draw a button about the size you want.
3. Release the mouse button.
4. Fill in the fields in each tab to configure how you want the button
to look and act, as described in the sections that follow. When
finished, click OK.
1
1
11-55 1
Creating graphic displays
General
1. In the General tab, click a button style.
3D, Recessed, and Raised styles can be used only for
rectangular-shaped buttons. The Beveled style supports
rectangular and polygonal shapes. If you change a 3D, recessed, or
raised button to another shape, or rotate it, the button
automatically changes to beveled.
The highlight and shadow colors on the beveled button use the
current system settings.
To reshape a button, select it, click the Polygon tool and then
move or add vertices as you would for any other polygonal shape.
2. To have the cursor captured when the button is pressed at
runtime, check the Capture cursor check box. When the cursor is
captured, it will not move off the button until the button is
released. Use this feature when you need to ensure that a button’s
release action is carried out.
If the Capture cursor check box is not selected, the button will
behave like standard Windows buttons, allowing the user to
‘cancel’ the release action by holding the mouse and moving off
the button.
3. If you want the button to be highlighted when the button has
focus, check the Highlight box.
The option, Disable Highlight When Object has Focus, on the
Behavior tab of the Display Settings dialog box, overrides this
Highlight setting.
4. In the Index field, either leave the default value or type a new
value. Index numbers determine the tab sequence for interactive
objects such as buttons and input fields and are also used in recipe
files. For details, see “Using index numbers” on page 12-43.
1
1
1
11-56
Creating graphic displays
Action
In the action tab, click an action:
Set: Sets the specified tag to 1 when the button is released (mouse
down = no action, mouse up = Set <tag> to 1).
Reset: Sets the specified tag to 0 when the button is released (mouse
down = no action, mouse up = Set <tag> to 0).
Toggle: Sets the specified tag to 0 or 1 depending on its current state.
If the tag’s value is 0, the tag is set to 1 when the button is pressed. If
the tag’s value is any non-zero value, the tag is set to 0 when the
button is pressed.
Momentary On: Sets the specified tag to 1 when the button is
pressed (mouse button is pressed and held down) and sets the tag to
0 when the button is released (mouse button is released).
Momentary Off: Sets the specified tag to 0 when the button is
pressed (mouse button is pressed and held down) and sets the tag to
1 when the button is released (mouse button is released).
Browse
Command: Runs the specified RSView32 command or macro. In the
Press action, Repeat action, and Release action fields, type an
RSView32 command or macro, or press the ... button to open the
Command Wizard.
You must specify either a press or release action; both are not
required. If you specify a repeat action, the action is repeated at the
rate specified in the Repeat rate field for as long as the mouse button
is held down.
Pressing the Enter key does not cause a repeat action to be executed
because Windows interprets this as a series of press actions, so the
repeat action is not carried out. The Enter key works for the press
and release actions.
1
1
11-57 1
Creating graphic displays
Up Appearance
In the Up Appearance tab, specify what the button will look like
when it is not pressed.
1. In the Button Label field, type a label for the button. Click the
color box to specify the label’s color and then click Font to
specify a font for the button. Choose only TrueType fonts.
2. In the Fill field, choose a fill pattern for the button.
3. If desired, click Import to import a bitmap that will appear in the
center of the button. The label, as specified in step 1, appears on
top of the bitmap.
If the button is a polygon, the label text and any imported bitmap
graphic are clipped at the rectangular extents of the button.
Down Appearance
In the Down Appearance tab, specify what the button will look like
when it is pressed.
If you want the button to appear the same when it is not pressed and
pressed, click Same as “Up Appearance”. If you want the button to
appear differently, choose different options. See “Up Appearance,”
above, for details about the fields.
Editing a button object
To edit a button object, double-click the button object to open the
Button Configuration dialog box.
To change a button’s label, use the font style and color in the Button
Configuration dialog box or use the commands on the Attributes
menu.
1
1
1
11-58
Creating graphic displays
Reshaping a button object
If you reshape or rotate a button, the button type always changes to
beveled. Only beveled buttons can be a polygon (or non-rectangle)
shape.
To reshape a button, select the button and then click the Polygon
tool. Move or add vertices as you would with any polygon shape.
Creating a recipe field
Recipe tool
Use the Recipe tool to create a field that operators can use to specify
the name of a recipe file containing tag values for all the numeric and
string input fields in a graphic display. 4.
With a recipe field, operators can load all the values from a recipe file
into the numeric and string input fields in one keystroke rather than
having to enter values one by one. Operators can then write all these
values to the programmable controller with another keystroke.
IMPORTANT A graphic display can have only one recipe field.
To create a recipe field:
1. Click the Recipe tool.
2. Drag the mouse to draw the field.
3. Release the mouse button.
1
1
11-59 1
Creating graphic displays
4. In the Default File Name field, type the name of the recipe file to
and from which values will be saved and restored. Do not include
a file extension.
5. In the Field Length field, type a value to specify the maximum
number of characters that can be displayed in this field.
6. In the Justification field, select Left, Center, or Right to specify
how the recipe file name will be aligned within the field.
7. Click OK.
Creating a recipe file
A recipe file contains tag values for all the numeric and string input
fields in a graphic display. The recipe file uses index numbers to
specify which tag value goes into which input field.
RSView32 automatically assigns index numbers to input objects and
button objects as you create them. To check the index number for an
object, double-click the object to open its configuration dialog box,
and then check the number in the Index field.
For details about index numbers, see “Using index numbers” on
page 12-43.
Two ways to create a recipe file
You can create a recipe file with the Recipe editor or, at runtime, you
can create a recipe file by specifying a file name in the recipe field
and then saving values to that file.
1
1
1
11-60
Creating graphic displays
To create a recipe file with the Recipe editor:
1. Open the Recipe editor.
2. Type one entry per line. Type one entry for each input field in the
display. You can have up to 500 entries.
An entry is the index number, a comma, and the value you want to
load into the input field, with no spaces. Index numbers must start
at one and increase by one.
If you want, you can include the tag name, preceded by an
exclamation mark (!), as a comment. Tag names are automatically
added to the file when values are written to the file.
3. Save the file.
To create a recipe file at runtime:
1. At development time, in a graphic display, create an input field for
each value the recipe is to contain.
2. Create a recipe field for the display.
3. Save the graphic display.
4. At runtime, type values in the input fields.
5. Type a file name in the recipe field and press Enter. The recipe
dialog box opens with the name in the recipe file field.
If the display has been set up to use the on-screen keyboard,
pressing Enter brings up the on-screen keyboard. Pressing the
Download button on the on-screen keyboard opens the Recipe
dialog box, where you can save the recipe file.
6. To save the values in the input fields and at the same time create a
recipe file, click Save.
A recipe file is created. When the Recipe icon is selected, the file
appears in the right pane of the Project Manager.
1
1
11-61 1
Creating graphic displays
Example: Creating a recipe file at runtime
The following display was used to create a recipe file for
chocolate-chip cookies:
Numeric input
fields
String input
field
Recipe field
This is the recipe file that was created:
Index number
Value
Tag name
1
1
1
11-62
Creating graphic displays
Using a recipe at runtime
At runtime, operators can restore values from a recipe file into input
fields and send those values to the programmable controller or
server. Operators can also upload values from a programmable
controller or server into input fields, and then save those values to a
recipe file.
If an upload fails because of a communication error, question marks
appear in the numeric input fields.
To move to a recipe field, users can do any one of the following:
use the mouse. Double-click the recipe field to open the Recipe
dialog box and save or restore the recipe file.
press Ctrl-R to move to the field and then press Enter to restore
the contents of the recipe file.
If the display has been set up to use the on-screen keyboard,
selecting the recipe field and pressing Enter brings up the
on-screen keyboard. Pressing the Download button on the
on-screen keyboard opens the Recipe dialog box, where you can
restore the contents of the recipe file.
press Ctrl-W to move to the field and then press Enter to save the
recipe file.
If the display has been set up to use the on-screen keyboard,
pressing Enter brings up the on-screen keyboard. Pressing the
Download button on the on-screen keyboard opens the Recipe
dialog box, where you can save the recipe file.
1
1
11-63 1
Creating graphic displays
To download recipe values to a programmable controller or server:
1. Restore the values from a recipe file as follows:
D In the recipe field, type the name of a recipe file and press
Enter, or click in the recipe field and press Enter. The Recipe
dialog box opens.
If the display has been set up to use the on-screen keyboard,
selecting the recipe field and pressing Enter brings up the
on-screen keyboard. Type the name of a recipe file using the
on-screen keyboard and press the Download button on the
keyboard. The Recipe dialog box opens.
E If you didn’t type a name, select a file from which to restore
values.
F Click Restore.
2. Download the values in the input fields by pressing PgDn, or by
using the RSView32 Download or DownloadAll command.
You can also restore the values from a recipe file using the RSView32
RecipeRestore command. For details, see Appendix A, RSView32
commands, or see Help.
1
1
1
11-64
Creating graphic displays
To save recipe values from a programmable controller or server:
1. Upload the values to the input fields by pressing PgUp, or by
using the RSView32 Upload or UploadAll command.
2. Save the values to the recipe file as follows:
D In the recipe field, type the name of a recipe file and press
Enter, or click in the recipe field and press Enter. The Recipe
dialog box opens.
If the display has been set up to use the on-screen keyboard,
selecting the recipe field and pressing Enter brings up the
on-screen keyboard. Type the name of a recipe file using the
on-screen keyboard and press the Download button on the
keyboard. The Recipe dialog box opens.
E If you didn’t type a name, select a file to which values will be
saved.
F Click Save.
You can also save the values from a recipe file using the RSView32
RecipeSave command. For details, see Appendix A, RSView32
commands, or see Help.
1
1
11-65 1
Creating graphic displays
Replacing text associated with objects
You can replace any text string used to configure the graphic objects
in your display by using tag substitution. For example, tag names,
RSView32 commands, and expressions used to animate a graphic
object are all text strings that you can replace using tag substitution.
Tag substitution does not work for text objects you create using the
Text tool.
To replace text:
1. Select an object or group of objects. To select all the objects in the
display, click Select All on the Edit menu.
2. On the Edit menu, click Tag Substitution.
3. Click the down arrows to display a list of the possible text items
you can search for and replace, or type text in the Search for and
Replace with fields. The string can be part or all of:
a tag name (without wildcards)
a folder name (without wildcards)
the text in an expression
an RSView32 command
4. Click Replace.
If the Confirm Replacements check box is not selected, all
occurrences of the text in the Search for field are automatically
replaced with the text in the Replace with field.
1
1
1
11-66
Creating graphic displays
If the Confirm Replacements check box is selected, the Confirm
Replacement dialog box opens, showing where the text is used.
To replace the text, click Replace or click Replace All. To move to
the next selected object that uses the text string, click Next.
5. When all replacements are done, click Close.
Creating and editing OLE objects
OLE stands for Object Linking and Embedding. OLE objects are
objects created in other Windows applications and linked to or
embedded in an RSView32 graphic display. RSView32 is an OLE
client application, which means it cannot be embedded in other
Windows applications.
The main difference between linking and embedding is where data is
stored. Linked objects are stored in the source file. The graphic
display stores only the location of the source file and displays a
representation of the linked data. Embedded objects become part of
a graphic display.
This difference means that:
linking pastes the object into the graphic display and retains links
to the source file in addition to allowing it to be edited. If the
source file is changed, the object in the display is changed.
When you double-click a linked object to edit it, its application
comes up in another window. The object’s source file is active.
1
1
11-67 1
Creating graphic displays
If you move your project, remember to move, copy, or update the
link for the source file to the new location.
embedding pastes the object into the graphic display and allows it
to be edited. If the source file is changed, the object in the display
is not affected.
When you double-click an embedded object to edit it, the Graphic
Display editor’s toolbar is replaced by the application’s toolbar. A
border appears around the object to indicate that it can be edited.
This is called in-place editing.
If you move your project, embedded objects are automatically
moved with the project.
To create an OLE object:
1. Click OLE Objects on the Objects menu or click the button in
the Drawing Tools toolbox.
OLE Tool
2. Draw a box about the size you want for the object.
3. Click Create New to create and embed a new object.
Click Create from File to insert an existing file. To create a link to
the source file, click Link. To embed the file, do not click Link.
4. Select an object type or file.
1
1
1
11-68
Creating graphic displays
5. If you want the embedded object displayed as an icon, click
Display As Icon.
6. Click OK.
Other methods for inserting OLE objects
You can also insert OLE objects by:
copying the information from the source file onto the clipboard
and then choosing Paste Special
choosing Insert Object on the Edit menu. You can then select an
object type or file.
Converting OLE objects
The reasons to convert an object are:
to change any type of embedded vector-based object into a
polygon that is more readily manipulated7.
to reduce the size of a graphic display file
Embedding an object in a graphic display increases the size of the
graphic file because the embedded object includes information
about its source application. This lets you double-click the object
and edit it using the source application. To reduce the size of the
graphic file, convert the object to an RSView32 graphic object.
You can no longer use its source application to edit the object, but
you can still use the editing tools in the Graphic Display editor to
work with the object.
1
1
11-69 1
Creating graphic displays
To convert an object:
1. Do one of the following:
select the object and cut it to the clipboard
copy the object from its source application to the clipboard
2. On the Edit menu, click Paste Special. The Paste Special dialog
box opens.
3. Click the Paste or Paste Link button.
Paste copies the contents of the clipboard into the active graphic
but does not link to the source application. This is an embedded
object.
Paste Link copies the contents of the clipboard into the active
graphic and links it to the source application. This is a linked
object. This option is not available if the object comes from an
application that does not support OLE linking.
4. Click RSView Graphic Object.
5. Click OK.
1
1
1
11-70
Creating graphic displays
Creating and editing ActiveX objects
An ActiveX object is a software component that is supplied
independently from RSView32 through products such as Microsoft
Visual Basic, Rockwell Software RSToolsZ, Office 97, and many
other third-party applications. An ActiveX object provides functions
that can be accessed through the object’s properties, events, and
methods. By embedding an ActiveX object in an RSView32 graphic
display and then assigning properties or specifying handlers for the
object’s events, the object can interact with RSView32. Information
is passed between an ActiveX object and RSView32 using RSView32
tags.
For example, you can embed an RSTools gauge in an RSView32
graphic display and attach an RSView32 tag to the gauge’s Value
property. As the tag’s value changes, the gauge’s needle changes
position to reflect the tag’s value.
To pass information between an ActiveX object and RSView32,
information must be in the same format as the RSView32 tags, that
is, an analog or digital number, or a string. RSView32 does not
support pointer parameters in an ActiveX object.
An ActiveX object has three types of attributes:
Properties: named characteristics and values of an object such as
shape, color, position, or number. For details about attaching control
to an object’s properties, see page 12-35.
Events: actions triggered by the ActiveX object in response to an
external action on the object, such as a mouse click. In RSView32
you can use events to change the value of an RSView32 tag or to run
an RSView32 command or a macro. When the event happens, the
command or macro runs. To use the ActiveX object to change a tag’s
value, associate the tag with one of the object’s event parameters. For
details about attaching control to an object’s events, see page 12-36.
1
1
11-71 1
Creating graphic displays
Methods: functions implemented in the ActiveX object that allow
external actions to change the object’s appearance, behavior, or
properties. A call to a method might be made in response to events
from other controls and could trigger other events. You can use the
RSView32 Invoke command as the external event that calls a
method. For details about attaching control to an object’s methods,
see page 12-38.
To create an ActiveX object:
1. Click ActiveX Control on the Objects menu or click the button in
the Drawing Tools toolbox.
ActiveX Control
If you have set up tools in the ActiveX Toolbox, as described on
page 11-75, click the tool in the toolbox, draw a box about the size
you want for the object, and skip the remainder of these steps.
2. Draw a box about the size you want for the object.
3. Click the object you want to add to your graphic display. The list
of objects depends on what software you have installed.
If some objects you have installed do not appear in the list, the
objects might not be registered. To register them, click Register,
and then choose the objects you want to add.
To remove an object from the list, select the object, and then click
Deregister.
1
1
1
11-72
Creating graphic displays
4. Click OK.
The object appears in the graphic display. To edit the object’s
properties, right-click the object, then click ActiveX Property
Panel on the context menu. For details, see “Using the ActiveX
Property Panel,” next.
To attach control to the object so it can interact with RSView32,
use the ActiveX Property Panel and the ActiveX Control
commands on the Animation context menu. For details, see
“Configuring ActiveX control” on page 12-32.
You can also create an ActiveX object using the ActiveX Toolbox, as
described in “Using the ActiveX Toolbox” on page 11-75.
Using the ActiveX Property Panel
Use the ActiveX Property Panel to:
set up or modify properties for an ActiveX object. With multiple
ActiveX objects selected, you can simultaneously set up or modify
the properties they have in common.
attach control to object properties. For details, see “Configuring
ActiveX control” on page 12-32.
For information about the [Name] property, see “Naming an
ActiveX object” on page 12-34.
To set up or modify properties:
1. Right-click the object, then click ActiveX Property Panel on the
context menu.
To open the property panel you can also use the View menu on
the Graphic Display editor’s menu bar. Click View, then click
ActiveX Property Panel.
1
1
11-73 1
Creating graphic displays
2. Click the Properties tab if it is not already selected.
Click for help on the
selected property.
Drag splitter bar to see
more properties.
Click for help on the
property panel.
3. In the column on the right, type the value for the property. You
cannot specify values for properties that are read only.
If a selection list or window is available for the property, when
you click in the column the selection list or window opens. Select
the value to use for the property.
4. If custom property pages are available for the ActiveX object,
click in the column beside [Custom] to open the property pages
and set up more properties.
Once the property panel is open, you can set up properties for
multiple objects at the same time by Ctrl-clicking them. The
properties common to the selected objects are listed in the property
panel.
1
1
1
11-74
Creating graphic displays
Using the ActiveX Toolbox
You can use the ActiveX Toolbox to set up tools for the ActiveX
objects you use frequently. This toolbox cannot be docked.
By default, the ActiveX Toolbox contains some of the Forms 2.0
ActiveX controls that are installed with VBA. For examples of using
these controls, see the ActiveX Forms 2.0 sample graphic displays in
the Samples project.
To add tools to the ActiveX Toolbox:
1. If the toolbox is not open, click ActiveX Toolbox on the View
menu.
2. Select the page of the toolbox to add objects to.
3. Right-click the page and click Additional Controls.
4. Click the checkboxes of the tools to add from the list of installed
controls, then click OK.
You can use up to 10 pages in the toolbox, to group related tools,
although the number of tabs you can view at one time depends on
the length of the tab names.
To add pages to the ActiveX Toolbox:
1. Right-click an existing tab in the toolbox.
2. Click New Page on the context menu.
RSView32 creates a new page with the name “New Page.” To give
the page a new name, rename it as described next.
This page
is selected.
1
1
11-75 1
Creating graphic displays
To rename or remove pages in the ActiveX Toolbox:
1. Select the page to rename or remove.
2. Right-click the tab label.
3. Click Rename or Delete Page on the context menu.
4. If renaming the page, type a name in the Caption field.
You can also type descriptive text in the Control Tip Text field.
This text appears when the operator positions the cursor over the
page tab at runtime.
Note that the page with focus is deleted when you choose Delete
Page, even though the tab for that page may not be visible. When a
tab has focus (is selected) a dotted line appears around the label text.
To remove tools from the ActiveX Toolbox:
1. Select the tool to remove.
2. Right-click, and click Delete Item on the context menu.
To add an object to a graphic display using the ActiveX Toolbox:
1. In the ActiveX Toolbox, click on the icon for the object to add.
2. Draw a box about the size you want for the object.
The object appears in the graphic display. To edit the object’s
properties, right-click the object, then click ActiveX Property
Panel on the context menu. For details, see “Using the ActiveX
Property Panel” on page 11-73.
To attach control to the object so it can interact with RSView32,
use the ActiveX Property Panel and the ActiveX Control
commands on the Animation context menu. For details, see
“Configuring ActiveX control” on page 12-32.
1
1
1
11-76
Creating graphic displays
Naming graphic objects
Once you have drawn a graphic object, you can name it. Naming a
graphic object allows you to manipulate the object using commands
(for example, when using the Invoke command with an ActiveX
object).
You can also give the object a tooltip description. Tooltips appear at
runtime when you bring the cursor to rest over an object for a few
seconds, if the object is not inactive (grayed out).
Tooltips only appear on buttons, data entry fields, recipe fields, and
objects with touch, slider, or object key animation.
Also see “Naming an ActiveX object” on page 12-34.
To name an object and type a tooltip description:
1. Select one object.
2. Right-click the object, and then click Object Name/Tooltip.
3. In the New field, type a name for the object.
4. If required, type a tooltip description.
5. Click OK to save the changes, or click Cancel to discard the
changes.
1
1
11-77 1
Creating graphic displays
Working with objects
Once you have drawn an object, you can select the object and edit it.
You can:
move objects
copy objects
duplicate objects
resize objects (except text objects)
Moving objects
You can move objects using the mouse or the keyboard. The keys
give you fine positioning, allowing you to move objects in small
increments.
To drag objects:
1. Select one or more objects.
2. Place the pointer on an object (not on the edge or on the handles).
3. Drag the objects to the desired position.
Select the object.
Drag the object to
the desired position.
You can move several objects at once by selecting them all and then
dragging one of the selected objects.
1
1
1
11-78
Creating graphic displays
To move objects in small increments:
1. Select one or more objects.
2. Hold down Shift while you press an arrow key. Holding Shift is
the same as pressing the left mouse button.
Use the plus (+) and minus (-) keys to increase or decrease, per
press, the distance moved by the arrow keys.
Copying objects
To copy objects, you can:
drag and drop objects
copy and paste objects to and from the clipboard
Dragging and dropping objects
You can drag and drop objects between displays. This is particularly
useful for copying objects from a graphic library.
To drag objects between displays:
1. Select one or more objects.
2. Hold down the mouse button and drag the object.
3. When the object is where you want it, release the mouse button.
To drag objects in the same display:
1. Select one or more objects.
2. Drag the object, and then press Ctrl.
When you press Ctrl, a plus sign is added to the cursor.
3. When the object is where you want it, release the mouse button
and Ctrl key.
A new copy of the object is created.
1
1
11-79 1
Creating graphic displays
Copying and pasting objects
You can cut, copy, or paste objects using the menu items on the Edit
menu or the buttons on the toolbar.
When an object is copied, any animation attached to the object is
also copied. If a group is copied, the new copy of the group can be
ungrouped to individual objects, just like the original.
Once you copy an object, you can paste it anywhere in the drawing
area of:
the same graphic display
a graphic display in the same or a different project
a graphic library in the same or a different project
To cut or copy objects:
1. Select one or more objects.
2. Click Cut or Copy on the Edit menu, or click the Cut or Copy
button on the toolbar.
Cut
To remove the original object, click Cut.
To retain the original object, click Copy.
Copy
To paste objects:
1. Click in the Graphic Display editor.
2. Click Paste on the Edit menu or click the Paste button on the
toolbar.
Paste
To delete objects:
Select one or more objects and then click Delete on the Edit menu,
or press Delete on the keyboard.
1
1
1
11-80
Creating graphic displays
Duplicating objects
Unlike Cut and Copy, Duplicate does not use the clipboard.
1. Select one or more objects.
2. Click Duplicate on the Edit menu or click the Duplicate button
on the toolbar.
Duplicate
The duplicated object is placed slightly offset from the original.
Select object
Duplicate object
Move object
Duplicate again
Duplicate also duplicates actions. For example, if you duplicate an
object, move it, and then duplicate it again, the second Duplicate
will, in one step, duplicate and move the object. This is useful for
creating a series of objects with an equal distance between them.
Duplicate works until you deselect the object.
When an object is duplicated, any animation attached to the object is
also duplicated. If a group is duplicated, the new copy of the group
can be ungrouped to individual objects, just like the original.
1
1
11-81 1
Creating graphic displays
Resizing objects
You can resize objects using the mouse or using the keyboard. The
keys let you resize objects in small increments.
When you select an object, handles appear around it. Use these
handles to resize the object.
Drag a side handle to change either the width or height.
Drag a corner handle to change both the width and height.
To resize an object by dragging the mouse:
1. Select the object.
2. Place the pointer on one of the handles.
A double arrow appears.
3. Drag the handle until the object is the desired size or shape.
For perfect circles and squares, hold down Ctrl while you drag a
corner handle.
1
1
1
11-82
Creating graphic displays
To maintain the object’s original proportions (width to height),
hold down Shift while you drag a corner handle.
When advanced objects, such as input fields, are resized, the font
is resized to fit the new boundary.
To resize an object in small increments using the keyboard:
1. Select the object.
2. Place the pointer on one of the handles.
A double arrow appears.
3. Hold down Shift and press an arrow key until the object is the
desired size or shape.
Arranging objects
You can arrange objects in a number of ways using the items on the
Arrange menu or the buttons on the toolbar. You can:
combine several objects into a group that behaves as a single
object
divide a grouped object into its component objects
stack objects by moving them in front of or behind other objects
align objects with each other
space objects horizontally or vertically
flip objects horizontally or vertically
Grouping and ungrouping objects
Grouping combines several objects into a single object so you can
manipulate them as a single object. You can attach animation to a
group, and any animation attached to individual objects in the group
remains active.
1
1
11-83 1
Creating graphic displays
To group objects:
1. Select all the objects you want grouped.
2. Click Group on the Arrange menu or click the Group button on
the toolbar.
Group
The handles around each object are replaced by a set of handles
around the group.
... ... ... ... ...
... ... ... ... ...
Select the objects
Group them
Deleting a group deletes all individual objects in the group.
Changing the color or fill pattern of the group changes the color or
fill pattern of all individual objects in the group.
1
1
1
11-84
Creating graphic displays
To ungroup objects:
1. Select the objects you want to ungroup.
2. Click Ungroup on the Arrange menu or click the Ungroup button
on the toolbar.
Ungroup
The handles around the group are replaced with handles around
each object.
Select the group.
Ungroup it.
Ungrouping deletes any animation attached to the group, because
the group no longer exists. However, animation attached to the
individual objects that were in the group remains active.
1
1
11-85 1
Creating graphic displays
Performing group editing
With group editing, you can edit the objects in a group as you would
individual objects. This allows you to edit a group of objects without
breaking the group, which is particularly useful when you have
animation attached to groups. No
To use group editing, double-click on the grouped object. A
rope-like border appears around the group. Double-click inside this
box to access another group or to access the individual objects.
Double-click to select the object. A
rope-like border appears. This border
indicates that this is a group.
Click again. Handles appear. The
handles show the individual objects
within the group.
When you double-click, you are in group edit mode. In this mode,
you can select individual objects in the group and modify them. You
can also add new objects to the group. To see what objects are
selected, either look at the status bar, or right-click to see the Edit
menu item on the context menu. To stop editing, click outside of the
group.
Stacking objects
You can stack objects on top of each other. Objects are stacked in the
order they are created, with the most recently created object on top.
Change the stacking order with Send to Back and Bring to Front.
Send to Back moves the selected object to the bottom of the stack.
Bring to Front moves the selected object to the top of the stack.
1
1
1
11-86
Creating graphic displays
To bring an object to the front:
1. Select an object.
2. Click Bring to Front on the Arrange menu or click the Bring to
Front button on the toolbar.
Bring to Front
Select the object from
behind.
Bring the object
to front.
To send an object to the back:
1. Select an object.
2. Click Send to Back on the Arrange menu or click the Send to Back
button on the toolbar.
Send to Back
Select the
object.
Send the object
to back.
To select the object in the back, place your pointer on the object,
click once, pause, and then click again. Do not double-click and do
not move the mouse.
1
1
11-87 1
Creating graphic displays
Aligning objects
Objects can easily be aligned with each other and with the grid.
Align objects with each other when you want the tops, bottoms, or
sides to line up.
1. Select the objects you want to align.
2. Click the appropriate button or menu item:
This button or menu item
1
1
1
11-88
Aligns selected objects with
Align Left
Left-most selected object
Align Center
Horizontal center of all selected objects
Align Right
Right-most selected object
Align Top
Top-most selected object
Align Middle
Vertical center of all selected objects
Align Bottom
Bottom-most selected object
Align Center Points
Center of all selected objects
Align to Grid
Grid
Creating graphic displays
Aligning objects left, right, and center
Select objects
Align left
Select objects
Align right
Select objects
Align center
1
1
11-89 1
Creating graphic displays
Aligning objects top, middle, and bottom
Align top
Align middle
Align bottom
1
1
1
11-90
Creating graphic displays
Spacing objects
With Space Vertical and Space Horizontal, objects are moved
vertically or horizontally to have the same amount of space from the
center point of each object.
1. Select the objects you want to space.
2. Click the appropriate button or menu item:
This button or menu item
Does this
Space Horizontal
Places the centers of the selected objects an
equal distance apart horizontally.
Space Vertical
Places the centers of the selected objects an
equal distance apart vertically.
Centers are
separated by
an equal vertical
distance
Select objects
Space vertically
Centers are
separated by
an equal horizontal
distance
Select objects
Space horizontally
1
1
11-91 1
Creating graphic displays
Flipping objects
Flipping an object creates a mirror image of that object. You can flip
most objects.
1. Select an object.
2. Click the appropriate button or menu item:
This button or menu item
1
1
1
11-92
Flips selected objects
Flip Vertical
Top to bottom (upside-down)
Flip Horizontal
Left to right
Select object
Flip vertical
Select object
Flip horizontal
Creating graphic displays
Applying colors
You can define both line and fill colors for an object. Line color
applies to the outline of an object. Fill color applies to the inside of
an object.
To make objects blink, attach color animation to the objects. For
details, see page 12-13.
To apply colors before drawing:
1. Select line and fill colors from the color palette or from the
Attributes menu.
2. Select a drawing tool and draw the object.
To apply colors to existing objects:
1. Select one or more objects.
2. Select line and fill colors from the color palette or from the
Attributes menu.
Applying colors to text
To apply color to text, use the Line Color palette, or click Font on
the Attributes menu and then click a color in the Font dialog box.
1
1
11-93 1
Creating graphic displays
Applying fill patterns
Fill patterns apply to the interior of objects. Closed objects such as
rectangles, circles, polygons, text objects, and wedges are completely
filled. Open or partially open objects, such as polylines or freehand
objects, can also take a fill pattern. The editor draws an imaginary
line from the start and end points, and then fills the object as a closed
object.
Hollow polyline object
Filled polyline object
Selecting fill patterns
Fill patterns are available on the Attributes menu or on the Fill Style
toolbar. To see the toolbar, click Fill Style Toolbar on the View
menu.
Applying fill patterns
You can apply fill patterns to objects before or after you draw them.
To apply a fill pattern before drawing:
1. Select a drawing tool.
2. Select a fill pattern from the Attributes menu.
1
1
1
11-94
Creating graphic displays
To apply a fill pattern to an existing object:
1. Select one or more objects.
2. Select a fill pattern from the Attributes menu.
How colors and patterns work
Color is applied to graphic objects with patterns as follows:
the pattern is the selected line color
the background is the selected fill color
Changing line properties
You can change line width and style. You can select a line object and
change its properties, or you can select the properties before drawing
an object.
1. On the Attributes menu, click Line Properties.
2. Specify a line width and style. Line styles are available only when
the line width is 1.
The styles are:
Solid
Dash
Dot
Dash-Dot
Dash-Dot-Dot
1
1
11-95 1
Creating graphic displays
3. Click OK.
4. Click Line Color or Fill Color on the Attributes menu to apply
line or fill colors.
Line style uses both the line color and fill color attributes. Line
color applies to the line, and fill color applies to the spaces in the
line. For example, to obtain the dash-dot line, choose black as the
line color, and choose white as the fill color. Black is applied to the
dots and dashes and white is applied to the spaces between the
dots and dashes.
5. Select a color, then click OK.
For trend objects, you can also customize line width and color using
the Pen Configuration tab of the Trends dialog box.
Peeking at objects
Use Peek to view any or all of the following objects in a graphic
display:
obscured (hidden) objects
numeric or string input objects
the recipe object
objects with animation
objects linked to a particular tag
When Peek is turned on, a red box appears around all selected
graphic objects. For example:
if you select Obscured Objects, all objects that are totally hidden
by other objects will have a highlighted box around them
if you select By Tag and then specify a tag name, all objects
associated with this tag will have a highlighted box around them
The Peek highlight is not visible in a graphic display with a red
background.
1
1
1
11-96
Creating graphic displays
To specify which objects you want to peek at:
1. On the View menu, click Peek Settings.
2. Select the check boxes for the objects you want to view.
To select animated objects, check the Animated Objects check
box, and then select the individual types of animation.
When you check By Tag, the field below it is active. To list the
tags associated with a graphic display, either type a tag name, or
click the arrow beside the By Tag field and scroll through the list.
The list contains the names of all tags used in the display except
tags in commands.
You can peek at as many types of objects as you want. However,
Peek does not distinguish between the objects.
For example, if you choose color and visibility animation, all
objects with these types of animation are highlighted and Peek
does not indicate which objects have which types of animation.
3. If you want Peek to be active when you close the dialog box, click
Activate Peek.
Otherwise, you can turn on Peek by clicking Peek On on the
View menu.
4. To save your settings, click OK.
1
1
11-97 1
Creating graphic displays
To turn Peek on and off:
click Peek On on the View menu
click Activate Peek in the Peek dialog box
When Peek is on, the cursor looks like this:
Peek is automatically turned off as soon you do any action in the
Graphic Display editor. For example, if you are peeking at objects
and then move an object, Peek is turned off.
Creating a background for your display
You can create a background for your graphic display by converting
objects to wallpaper. When objects are converted to wallpaper, they
are locked into position and become an unchanging background for
the other objects in the display. This is useful for importing
photographs of your machine or process and overlaying them with
animated objects.
Converting objects that do not need to be selected or animated
speeds up animated displays. Converting bitmaps to wallpaper can
significantly improve the performance of a graphic display.
Objects that have been converted to wallpaper cannot be selected or
edited until you unlock the wallpaper. Also, any animation attached
to the objects is not in effect. However, animation is restored when
you unlock the wallpaper.
1
1
1
11-98
Creating graphic displays
Objects that cannot be converted
The following objects cannot be converted to wallpaper: numeric
inputs, string inputs, numeric displays, string displays, labels, and
trends.
To convert objects to wallpaper:
1. Select one or more objects.
2. On the Edit menu, select Wallpaper and click Convert to
Wallpaper.
To unlock wallpaper:
On the Edit menu, select Wallpaper and click Unlock Wallpaper. All
objects that were previously converted to wallpaper will be
unlocked.
Importing graphic files from third-party applications
RSView32 can import the following types of files:
File extension
Type of file
.gfx
Graphics
.mgx, .mgl
ControlViewZ for DOS graphic files
.wmf, .clp
Windows metafiles
.bmp, .gif, .tif, .pcx
Bitmap files
.dxf
AutoCADX files*
.jpg
JPEG files
* RSView32 does not import AutoCAD 13 or later .dxf files. To import an AutoCAD 13 or
later graphic, export it as a .wmf file from within AutoCAD, and open the .wmf file in
RSView32.
Before importing files, configure your video adapter to display more
than 256 colors to ensure that the colors of imported objects appear
the same as in the original.
1
1
11-99 1
Creating graphic displays
To import files:
1. In the Graphic Display editor, click the File menu and then click
Open.
2. In the Open dialog box, go to Files of type and select the type of
file you want to import.
3. Select the directory and file to open.
4. Click Open.
5. If the Convert Object dialog box appears, click Yes to convert the
object to a native RSView32 object or click No to leave the object
in its original format.
Converting imported objects to RSView32 native objects
Converting imported objects to native objects offers the following
advantages:
graphic files are smaller
objects are groups of objects rather than a single object. This
means you can edit the individual parts of the object, including
attaching animation to individual parts.
Using bitmaps
Bitmaps consume Windows resources, so when using bitmaps follow
these guidelines:
Use device-dependent bitmaps
Device-dependent bitmaps (.bmp files) display faster than
display-independent bitmaps (.dib files) because the RSView32
Graphic Display editor is optimized for device-dependent
bitmaps. Also, you can in-place edit device-dependent bitmaps
using the Microsoft Paint program.
1
1
1
11-100
Creating graphic displays
Avoid unnecessary color depth
Create bitmaps in the lowest color depth possible. The more
colors you use, the more memory that is consumed:
16-color bitmaps consume 4 bits per pixel (1/2 byte per pixel)
256-color bitmaps consume 8 bits per pixel (1 byte per pixel)
24-bit bitmaps consume 24 bits per pixel (3 bytes per pixel)
If possible, use 16-color bitmaps. To change a higher-resolution
bitmap to 16-colors, open the bitmap in the Microsoft Paint
program and save the bitmap as a 16-color bitmap.
In 256-color systems, match palettes
In a 256-color system, if bitmaps use two different color palettes,
Windows must recalculate and redraw all bitmaps when window
focus changes. Redrawing the bitmaps causes delays and can make
a scanned image or photograph ‘sparkle’ or appear as a negative.
To match palettes, use a bitmap-oriented graphical tool that lets
you match palettes.
Palette matching is an issue only for 256-color video adapters.
24-bit color systems do not match palettes and 16-color systems
dither colors (that is, alternate pixels of different colors to
approximate another color).
Do not use the Scale option
The Scale option in the Display Settings dialog box causes the
contents of a graphic display to change size to suit the size of the
graphic display’s window. To speed up the display of a graphic
containing bitmaps, choose Pan rather than Scale because bitmaps
take longer to draw when they are scaled to a size different from
their original size.
An OLE object can be a bitmap or a bitmap wrapped in a
metafile. These types of OLE objects will also draw more slowly
when scaled.
1
1
11-101 1
Creating graphic displays
Avoid large bitmaps
Graphic displays that contain large bitmaps consume memory and
can be very slow to display because of the delay in loading them
from disk.
You can change a bitmap to a native RSView32 object by
converting the bitmap to wallpaper, tracing over the bitmap with
RSView32 drawing tools, and then deleting the bitmap.
Avoid many bitmaps
Whenever possible, create graphical objects using the RSView32
drawing tools.
When could a bitmap help?
Bitmaps generally make graphic displays slower. However, objects
with large amounts of detail, such as subtle shading, might draw
more quickly if converted to a bitmap because bitmaps take the same
amount of time to draw regardless of their complexity.
Using graphic libraries
RSView32 comes with a set of libraries that contain graphic objects
and displays. Additional libraries are installed if you install the
RSView32 Resource Kit. Many of the objects are preconfigured with
animation. You can:
look at the objects and displays to get ideas for your own project
drag and drop objects from the libraries into your own displays
Use the objects as they are or change them to suit your needs.
1
1
1
11-102
Creating graphic displays
Location of library files
By default, library files are stored in a different directory than
RSView32. The default installation places the files in:
C:\Program Files\Rockwell Software\Samples\RSView\Library
To open a graphic library:
1. In the Project Manager, open the Graphics folder.
2. Click the Library icon. The libraries are displayed in the right
pane of the Project Manager.
3. To open a library, either double-click its icon, or right-click it and
then click Edit.
To create a graphic library:
1. In the Project Manager, open the Graphics folder.
2. Open the Graphics Library editor by doing one of the following:
double-click the Library icon
right-click the Library icon and then click New
3. When you are finished creating the library, click Save or Save As
on the File menu and name the library.
The library name is added to the other names in the right pane of
the Project Manager.
1
1
11-103 1
Creating graphic displays
To add a library to a project:
1. In the Project Manager, open the Graphics folder.
2. Right-click the Library icon and then click Create Shortcut to
Existing Component.
3. In the dialog box, select the library file you want.
4. Click OK.
The library is displayed in the right pane of the Project Manager.
Printing displays at runtime
Operators can print graphic displays at runtime using the
PrintDisplay command. You must provide the operator with a way
to issue the command when you create the display. For example,
create a button object, display key, or global key with the
PrintDisplay command as the press action, or provide a command
line in the graphic display.
When you use the PrintDisplay command RSView32 prints the
entire display, even if parts are covered by other displays. You can
also use the ScreenPrint command to print an image of whatever
shows on the monitor. For more information about these commands
see Appendix A, RSView32 commands, or see Help.
1
1
1
11-104
12
Animating graphic objects
This chapter describes the various types of animation you can attach
to graphic objects, and outlines how to:
use tag names, tag placeholders, expressions, and commands when
attaching animation
use Object Smart PathZ (OSP) to quickly define an object’s range
of motion
attach object and display key animation
attach animation to OLE objects
attach control to ActiveX objects
1
1
12-1 1
Animating graphic objects
Types of animation
Once you have created graphic objects, you can:
attach animation that links an object to a tag so the object’s
appearance changes to reflect changes in the tag’s value
attach key animation that links an object or display to a key or
mouse button so operators can perform an action by pressing a
key or mouse button
attach OLE verb animation to an OLE object so when the
expression evaluates to true, it activates an OLE object by
initiating one of the verbs (for example, edit or open) associated
with the object
attach control to ActiveX objects so you can:
map tags to an ActiveX object’s properties so changes to the
object’s properties change the tag’s value and, in some cases,
changes to the tag’s value change the object’s properties
map commands to an ActiveX object’s events so commands run
based on the object’s events
map tags to event parameters
Which objects can have animation?
All graphic objects can have animation attached to them. Groups of
objects can also have animation attached.
You can attach as many types of animation to an object as you like.
For example, apply both width and height animation to an object to
give it the appearance of moving into or out of the display as it
shrinks and grows.
1
1
1
12-2
Animating graphic objects
Using the Animation dialog box
To attach animation, use the Animation dialog box.
To open the Animation dialog box, do one of the following:
select an object and click Animation on the View menu
select an object, click Animation on the menu bar to open the
Animation menu, and then click a menu item
right-click an object to open the context menu, select Animation,
and then click a menu item
To attach key animation, use the Object Key and Display Key dialog
boxes. For information about key animation, see “Associating
objects and displays with keys” on page 12-40.
1
1
12-3 1
Animating graphic objects
About the Animation dialog box
The Animation dialog box is a floating dialog box, which means you
can have it open all the time and can move it around the screen, select
other objects, and open other dialog boxes.
Animation
tabs
Expression area
Expression result
Minimum and
maximum values
Animation Tabs
Click the tab for the type of animation you want to configure.
Expression Area
Create one or more expressions either by typing them, choosing the
Expression button, or both. Multiple expressions are evaluated in the
order they are listed.
To supply a tag name for an expression, click the Tags button and
then select a name, or type the name. If you use multiple tags in an
expression, the first tag is used for the minimum and maximum
values if you do not specify these values.
Enclose tag names that contain dashes or start with a number in
braces { } when you use them in an expression. This distinguishes the
characters in the tag name from the characters in the expression. Also
use braces when using wildcards (* or ?) to represent multiple tags in
an expression.
1
1
1
12-4
Animating graphic objects
For more information about creating expressions, see Chapter 14,
Creating expressions.
Expression Result
Specify how the object’s appearance should change based on the
result of the expression. The fields in this area change for each type
of animation.
For some types of animation, you have to specify a change of state.
For example, an object with visibility animation will switch between
visible and invisible.
For other types of animation, you have to specify a range of motion.
For example, an object will move from a fixed starting point to a
fixed end point. The range of motion is related to the minimum and
maximum values for the expression. The object moves from the At
Minimum position to the At Maximum position as the expression
value changes to the maximum value.
Minimum and Maximum Values
If you do not want to use the values set for the tag in the Tag
Database editor, specify minimum and maximum values. If a value
falls outside the specified range, it will be evaluated as either the
minimum or maximum value. If you do not specify minimum and
maximum values, RSView32 uses the minimum and maximum values
for the first tag in the expression. For details, see “Setting minimum
and maximum values” on page 12-8.
Apply, Delete, and Close Buttons
These buttons do the following:
Apply: Applies and validates the animation configured for the
selected object or group of objects. Choosing another tab is the
same as choosing Apply—the animation you have configured is
applied to the object and validated.
Delete: Deletes the animation for the selected object.
Close: Prompts to apply changes and closes the dialog box.
1
1
12-5 1
Animating graphic objects
Using Object Smart Path to visually set animation
Because the Animation dialog box stays open, you can go back and
forth between the dialog box and the graphic display. This makes it
easy to set the range of motion for an object because you do not have
to know how many pixels you want an object to move. Instead, use
the RSView32 Object Smart Path (OSP) feature.
For details, see “Defining a range of motion” on page 12-9.
Testing animation
Test mode
Normal mode
Quickly test the animation you have set up in a graphic display by
switching to test mode. When you are finished testing, switch back
to normal mode to continue editing. To switch between test and
normal modes, use the buttons on the toolbar or the items on the
View menu.
If your graphic displays contain objects associated with device tags,
your system must be set up to communicate with programmable
controllers or servers in order for you to test animation.
IMPORTANT Test mode is not the same as running the display. Test mode does not
change the appearance or position of the display as set up in the Display
Settings dialog box.
Using tag names and tag placeholders
When configuring animation for objects, you are linking objects to
tags, so you have to specify a tag name or tag placeholder. Following
is a brief description of how to use tag names and placeholders. For
more information, see “Using tag names” on page 11-37.
Tag names
You can use tag names that you have already added to the tag
database or you can use a new tag name.
1
1
1
12-6
Animating graphic objects
Tag placeholders
Tag placeholders allow you to create displays that can be used with
different tags. A placeholder is a cross-hatch character (#) followed
by a number between 1 and 500. Tag names are substituted for
placeholders when the display is run. Folder names can also be
substituted for part of the tag name. For example,
#1\#2\MotorValve. This allows the same animation to be added to
multiple objects where only the folder name is different.
When setting up object keys, you can specify the [Tag] parameter as
a placeholder for a tag name or any character string. The [Tag]
parameter is used for object keys only. For more information on this
parameter, see “Using the Current [Tag] parameter” on page 12-46.
Using commands and macros
Some types of animation, such as touch animation, require you to
specify an action. The action is an RSView32 command or a macro.
The command or macro you use depends on what type of action you
want. For example, if you want the action to open another graphic
display, use the Display command.
This chapter does not provide detailed information on using
RSView32 commands or macros. For a complete list of commands
and command syntax, see Appendix A, RSView32 commands, or see
Help.
For details about macros, see “Creating macros” on page 15-7.
Using expressions
Many types of animation require an expression. You can use
expressions involving tag values, constants, mathematical equations,
and if-then-else program logic for animation. A tag name or tag
placeholder can be included as part of an expression, or it can stand
alone as the entire expression.
This chapter does not provide detailed information on creating
expressions. If you are not familiar with the expression language, see
Chapter 14, Creating expressions, before you begin.
1
1
12-7 1
Animating graphic objects
Setting minimum and maximum values
Many types of animation require a minimum and maximum range
for an expression. These values determine the start and end points
for a range of motion. 5.
When configuring animation, do one of the following:
use the tag’s minimum and maximum values—this is the default,
so you do not have to do anything. The values are taken from the
Minimum and Maximum fields in the Tag Database editor.
specify minimum and maximum values by selecting the Specify
check box and then typing minimum and maximum values
Why specify minimum and maximum values?
The minimum and maximum values specified for a tag in the Tag
Database editor limit the range of values that can be written to the
programmable controller but do not limit the values that are read.
Therefore, a tag’s actual minimum and maximum values might be
greater than those specified in the Tag Database editor. If so, you
might want to specify the tag’s actual minimum and maximum values
when configuring an object.
On the other hand, you might want to limit the range of values,
which you can also do by specifying minimum and maximum values
yourself. For example, if you specify a minimum of 0 and a
maximum of 100, the object will not react to values outside of this
range. So, even if the expression results to 200, the object does not
change from its At Maximum position.
If an expression uses more than one tag, the first tag in the
expression is used for the minimum and maximum values.
1
1
1
12-8
Animating graphic objects
Defining a range of motion
To define a range of motion for an object, do one of the following:
move the objects in the Graphic Display editor. This is called OSP
(Object Smart Path).
type values in the At Minimum and At Maximum fields6.
All motion is defined in pixels.
Objects that do not have a range of motion
Objects with visibility, color, and touch animation do not have a
range of motion, because these types of animation represent a change
of state, not a range.
Using OSP (Object Smart Path)
With OSP, you can easily set the range of motion for an object. The
following example shows how OSP works.
Example: Using OSP to define the range of motion for horizontal
slider animation
To define a range of motion for a slider object:
1. In the Graphic Display editor, create a slider object or copy a
slider object from a library.
2. Open the Animation dialog box and click the Horizontal Slider
tab.
3. In the Graphic Display editor, select the slider button.
4. In the Tag field of the Animation dialog box, specify a tag name.
1
1
12-9 1
Animating graphic objects
5. In the Graphic Display editor, drag the button object to the
position that will indicate the lowest number in the range.
1
1
1
12-10
Animating graphic objects
In the Animation dialog box, set this position by clicking the At
Minimum check box.
6. In the Graphic Display editor, drag the button object to the
position that will indicate the highest number in the range.
In the Animation dialog box, set this position by clicking the At
Maximum check box.
7. To save the settings, click Apply.
When you finish configuring the button object, it returns to its
starting position.
1
1
12-11 1
Animating graphic objects
Configuring visibility animation
With visibility animation, an object becomes visible or invisible
based on a tag value or the result of a logical expression.
If an object is invisible, no other animation attached to the object is
evaluated to prevent unnecessary processing.
To configure visibility animation:
1. Select the object.
2. Click the Visibility tab in the Animation dialog box.
3. Create an expression. The expression can be a tag name or a more
complex expression. If a tag name is used, the tag’s value
determines visibility. A value other than 0 evaluates to true.
4. If you want the object to be invisible when the tag or expression
value is true—that is, when it does not equal zero—click invisible.
If you want the object to be visible when the tag or expression
value is true—that is, when it does not equal zero—click visible.
5. Click Apply.
1
1
1
12-12
Animating graphic objects
Configuring color animation
With color animation, an object changes color based on a tag value
or the result of a logical expression. Specify up to 16 color changes
(A to P) for any object. Colors can be solid or blinking. For each
color change, specify the value or threshold at which the color is to
change and specify the colors to change to. At runtime, when the
value reaches or crosses the threshold, the color changes.
Color animation does not affect string input, numeric input, or
recipe fields. Color for these fields is defined in the Display Settings
dialog box.
The list box displays
the values and colors
for each threshold.
To return to the default
colors and thresholds,
click this button.
The parts of the list box
Line color
Fill color
The boxes show the line and fill colors
for each threshold. If you select white
as the line and the fill color, the boxes
will not be visible over the white
background of the dialog box.
Threshold value
Threshold
A box with two colors shows the colors
the object will alternate between when
blinking.
1
1
12-13 1
Animating graphic objects
To configure color animation:
1. Select the object.
2. Click the Color tab in the Animation dialog box.
3. Create an expression. The expression can be a tag name or a more
complex expression. If a tag name is used, the tag’s value
determines the color.
4. In the list box, select a threshold (A through P) for which you will
configure a value and colors. You can change the default values
and colors for thresholds A and B. The other thresholds have no
defaults.
5. In the Value field, type the threshold value. When the expression
value reaches this threshold, the object’s color changes.
Enter threshold values in ascending order. That is, A must be
lower than B, and B must be lower than C , and so on.
To delete a value for a threshold (A - P), select the threshold and
delete the value in the Value field. In the list box, the value will be
replaced with “No Value.”
6. Click Solid or Blink for the line and fill colors and then click the
line and fill colors. Line colors apply to the outline of the object
and to text. Fill colors apply to the inside of the object. To select a
color, place the cursor over the box, click to open the color
palette, and then click the desired color.
Specify the solid color here.
Specify the blinking colors here.
Solid colors have only one line and one fill color.
Blinking colors have two line and two fill colors, which are the
line and fill colors the object will alternate between when
blinking. If you select blink, the two colors must be different.
1
1
1
12-14
Animating graphic objects
7. In the Blink Rate field, specify how many seconds each blink
cycle will be. For example, if you specify four seconds, the object
will be one color for two seconds and the other color for two
seconds.
8. Click Apply.
Example 1: Creating a text object that blinks
This example describes how to create a text object that blinks
between two colors. In this example, the expression is simply a
constant value that matches the value for the selected threshold.
For details about creating text and other graphic objects, see
page 11-33.
1. Using the Text tool, type the text.
2. Select the text.
3. Open the Animation dialog box, and then click the Color tab.
Attach color animation as follows:
in the Expression field, type 0
Zero is the default value for threshold A.
in the list box, click threshold A
leave the value in the Value field as 0
for Line color, click Blink (only line color affects text)
click each color box to open the color palette and then click a
color
4. Click Apply.
1
1
12-15 1
Animating graphic objects
Example 2: Creating an object that changes color as the fill level
changes
This example describes how to create a rectangle object that changes
color as the object’s fill level increases. This example uses a tag called
Hopper1\FlourLevel. The tag has a range of 1 to 100. When the flour
level reaches 80, the rectangle blinks between gray and yellow to
warn the operator that the hopper is nearly full. When the flour level
reaches 95, the rectangle blinks between gray and red.
1. Using the Rectangle tool, create a rectangle.
2. Select the rectangle.
3. Using the Fill Style toolbar, make the the rectangle solid.
4. Using the Line Color and Fill Color palettes, make the rectangle
gray.
5. Open the Animation dialog box, and click the Fill tab. Attach fill
animation as follows:
in the Expression field, type Hopper1\FlourLevel (this is the
tag that controls the fill level)
for Fill Direction, click Up
click Apply
6. Click the Color tab. Attach color animation as follows:
Create the expression
in the Expression field, type Hopper1\FlourLevel (the same tag
that was used in the Fill tab)
Configure the color for the normal state
in the list box, click A
in the Value field, leave the value as 0
for Line and Fill colors, click Solid
for each, open the color palette and click gray (the same gray
used for the rectangle)
1
1
1
12-16
Animating graphic objects
Configure the color for the first warning
in the list box, click B
Yellow
Gray
in the Value field, type 80
for Line and Fill colors, click Blink
for Line and Fill, open the color palettes and click gray for the
first color and yellow for the second color
Configure the color for the second warning
Red
Gray
in the list box, click C
in the Value field, type 95
for Line and Fill colors, click Blink
for Line and Fill, open the color palettes and click gray for the
first color and red for the second color
7. Click Apply.
Configuring fill animation
With fill animation, the level of fill in an object changes based on a
tag’s value in relation to its minimum and maximum values. The
object’s fill level is proportional to the value of the expression. For
example, if the value of the expression is halfway between the
minimum and maximum values, the object will be half full.
Fill animation does not affect string input, numeric input, or recipe
fields, nor does it affect arrow objects. It also does not affect hollow
objects or line objects even if those objects are grouped into a single
object.
1
1
12-17 1
Animating graphic objects
To configure fill animation:
1. Select the object.
2. Click the Fill tab in the Animation dialog box.
3. Create an expression. The expression can be a tag name or a more
complex expression. If a tag name is used, the tag’s value
determines the fill levels.
4. Specify At Minimum and At Maximum values for the fill
percentage levels.
5. Click a fill direction.
6. Select the Inside Only check box if you want the object’s outline
to remain constant so only the inside fill level varies.
7. To specify minimum and maximum values, select the Specify
check box and type the values.
8. Click Apply.
1
1
1
12-18
Animating graphic objects
Configuring horizontal position animation
With horizontal position animation, an object moves horizontally
based on the result of an expression in relation to its minimum and
maximum values. The object’s horizontal position is proportional to
the value of the expression. For example, if the value of the
expression is halfway between the minimum and maximum values,
the object will be halfway between its minimum and maximum pixel
offset.
To configure horizontal position animation:
1. Select the object.
2. Click the Horizontal Position tab in the Animation dialog box.
3. Create an expression. The expression can be a tag name or a more
complex expression. If a tag name is used, the tag’s value
determines the horizontal position.
4. Set the starting point for the object by dragging the object or by
typing a value. Click the At Minimum check box.
5. Set the ending point for the object by dragging the object or by
typing a value. Click the At Maximum check box.
1
1
12-19 1
Animating graphic objects
6. To specify minimum and maximum values, click the Specify check
box and type the values.
7. Click Apply.
Configuring vertical position animation
With vertical position animation, an object moves vertically based on
the result of an expression in relation to its minimum and maximum
values. The object’s vertical position is proportional to the value of
the expression. For example, if the value of the expression is halfway
between the minimum and maximum values, the object will be
halfway between its minimum and maximum offset.
To configure vertical position animation:
1. Select the object.
2. Click the Vertical Position tab in the Animation dialog box.
3. Create an expression. The expression can be a tag name or a more
complex expression. If a tag name is used, the tag’s value
determines the vertical position.
1
1
1
12-20
Animating graphic objects
4. Set the starting point for the object by dragging the object or by
typing a value. Click the At Minimum check box.
5. Set the ending point for the object by dragging the object or by
typing a value. Click the At Maximum check box.
6. To specify minimum and maximum values, click the Specify check
box and type the values.
7. Click Apply.
Configuring width animation
With width animation, an object’s width changes based on a tag
value or the result of an expression. The object’s width is
proportional to the value of the expression. For example, if the value
of the expression is halfway between the minimum and maximum
values, the object will be half the full width.
1
1
12-21 1
Animating graphic objects
To configure width animation:
1. Select the object.
When the object is first selected, its width is 100 percent.
2. Click the Width tab in the Animation dialog box.
3. Create an expression. The expression can be a tag name or a more
complex expression. If a tag name is used, the tag’s value
determines the object’s width.
4. Set the minimum width for the object by doing one of the
following:
click a handle on the left or right side of the object and drag it
to resize the object
type the width you want the object to be when the expression
evaluates to its minimum value
Select the At Minimum check box.
5. Set the maximum width for the object by doing one of the
following:
click a handle on the left or right side of the object and drag it
to resize the object
type the width you want the object to be when the expression
evaluates to its maximum value
Select the At Maximum check box.
6. Click an anchor point.
This is the part of the object that does not move. For example,
click Left if you do not want the left side of the object to move.
As the value of the expression changes, the object will grow to or
shrink from the right.
7. To specify minimum and maximum values, click the Specify check
box and type the values.
8. Click Apply.
1
1
1
12-22
Animating graphic objects
Configuring height animation
With height animation, an object’s height changes based on a tag
value or the result of an expression. The object’s height is
proportional to the value of the expression. For example, if the value
of the expression is halfway between the minimum and maximum
values, the object will be half the full height.
To configure height animation:
1. Select the object.
When the object is first selected, its height is 100 percent.
2. Click the Height tab in the Animation dialog box.
3. Create an expression. The expression can be a tag name or a more
complex expression. If a tag name is used, the tag’s value
determines the object’s height.
1
1
12-23 1
Animating graphic objects
4. Set the minimum height for the object by doing one of the
following:
click a handle on the top or bottom of the object and drag it to
resize the object
type the height you want the object to be when the expression
evaluates to its minimum value
Click the At Minimum check box.
5. Set the maximum height for the object by doing one of the
following:
click a handle on the top or bottom of the object and drag it to
resize the object
type the height you want the object to be when the expression
evaluates to its maximum value
Click the At Maximum check box.
6. Click an anchor point.
This is the part of the object that does not move. For example,
click Top if you do not want the top of the object to move. As the
value of the expression changes, the object will grow to or shrink
from the bottom.
7. To specify minimum and maximum values, click the Specify check
box and type the values.
8. Click Apply.
Configuring rotation animation
With rotation animation, an object rotates around an anchor point
based on the result of an expression in relation to its minimum and
maximum values. The degree of rotation is proportional to the value
of the expression. For example, if the value of the expression is
halfway between the minimum and maximum values, the object will
rotate half the specified amount. 9.
1
1
1
12-24
Animating graphic objects
Text, advanced objects except arrows, OLE objects, ActiveX objects,
and bitmaps cannot be rotated.
Windows 9x does not support rotation animation for rounded
rectangles.
To configure rotation animation:
1. Select the object.
2. Click the Rotation tab in the Animation dialog box.
3. Create an expression. The expression can be a tag name or a more
complex expression. If a tag name is used, the tag’s value
determines the object’s rotation.
4. Set the center of rotation using one of the methods described
below. The center of rotation is the point around which the object
will rotate. This point can be inside or outside of the object. If it is
outside, the object will appear as if it is moving in an arc.
1
1
12-25 1
Animating graphic objects
Using the Default Center Points
To use the default center points, select a button.
Why use the default center points? If you set the center of
rotation with the default center points, the object will rotate
around the same point even if the object is resized. For example,
the top-middle corner will always be the center of rotation no
matter what size the object is.
Specifying Coordinates
The default coordinates 0,0 are the center of the object; all
coordinate values are relative to the center. To specify coordinates,
do one of the following:
using the mouse, place the crosshair at the desired center of
rotation and select the button beside the coordinates field
type values in the coordinates field and then select the button
beside the field
5. Set the range of motion for the object.
To set the minimum, do one of the following and then select the
At Minimum check box:
click the Rotate tool and visually set the degree of rotation
Rotate Tool
type the desired degree of rotation (this value is relative to the
object’s current position). For clockwise rotation, use a positive
number. For counterclockwise rotation, use a negative number.
To set the maximum, do one of the following and then select the
At Maximum check box:
click the Rotate tool and visually set the degree of rotation
1
1
1
12-26
Animating graphic objects
type the desired degree of rotation (this value is relative to the
object’s current position). For clockwise rotation, use a positive
number. For counterclockwise rotation, use a negative number.
6. To specify minimum and maximum values, click the Specify check
box and type the values.
7. Click Apply.
Configuring touch animation
With touch animation, you can specify press, repeat, and release
actions that are triggered when an operator touches an object with a
mouse or a touch screen.
To highlight touch objects, use the options in the Display Settings
dialog box. You can have a highlight box appear around a touch
object when a cursor passes over the object. You can also have the
computer beep when a touch object is selected.
IMPORTANT If you require a momentary push button, create a button object with a
momentary push button action rather than an object with touch
animation.
1
1
12-27 1
Animating graphic objects
To configure touch animation:
1. Select the object.
2. Click the Touch tab in the Animation dialog box.
3. In the Press Action field, type an RSView32 command or a macro.
Separate multiple commands or macros with a semi-colon (;) or
place them on separate lines. Multiple commands are executed in
the order they are listed.
If you want repeat and release actions, type commands or macros
in these fields as well. Press and release actions occur when the
object is pressed or released. Repeat actions occur at the rate
specified in the Repeat Rate field and do not wait for the press
command to be completed.
4. If you specified a repeat action, specify a repeat rate. This is how
often the action will be repeated while the object is pressed.
5. Click Apply.
Configuring horizontal slider animation
With horizontal slider animation, you can create a graphic object
that sets the value of a tag. To do this, define a path for the object
and then use the mouse to move the object horizontally. The pixel
position of the object is translated into values that are written to the
tag. An object can have both vertical and horizontal slider animation.
1
1
1
12-28
Animating graphic objects
To configure horizontal slider animation:
1. Select the object.
2. Click the Horizontal Slider tab in the Animation dialog box.
3. Type the name of the tag whose value will be determined by the
slider.
4. Set the starting point for the slider object by dragging the object
or by typing a value. Select the At Minimum check box.
5. Set the ending point for the slider object by dragging the object or
by typing a value. Select the At Maximum check box.
6. To specify minimum and maximum values that will be written to
the tag, click the Specify check box and type the values.
7. Click Apply.
1
1
12-29 1
Animating graphic objects
Configuring vertical slider animation
With vertical slider animation, you can create a graphic object that
sets the value of a tag. To do this, define a path for the object and
then use the mouse to move the object vertically. The pixel position
of the object is translated into values that are written to the tag. An
object can have both vertical and horizontal slider animation.
To configure vertical slider animation:
1. Select the object.
2. Click the Vertical Slider tab in the Animation dialog box.
3. Type the name of the tag whose value will be determined by the
slider.
4. Set the starting point for the slider object by dragging the object
or by typing a value. Select the At Minimum check box.
5. Set the ending point for the slider object by dragging the object or
by typing a value. Select the At Maximum check box.
6. To specify the minimum and maximum values that will be written
to the tag, click the Specify check box and type the values.
7. Click Apply.
1
1
1
12-30
Animating graphic objects
Configuring OLE verb animation
With OLE (Object Linking and Embedding) verb animation, you
can set up OLE objects to perform certain actions. When the
expression evaluates to true—that is, when the expression does not
equal zero—the specified OLE verb is activated. The verbs available
depend on the OLE object. Typical verbs include open, edit, and
run.
To configure OLE verb animation:
1. Select the OLE object.
2. Click the OLE Verb tab in the Animation dialog box.
3. Create an expression. The expression can be a tag name or a more
complex expression. If a tag name is used, the tag’s value
determines when the OLE verb is activated. A value other than 0
evaluates to true.
4. In the OLE Verb field, click the down arrow to display the OLE
verbs available for the selected OLE object. Click a verb in the
list.
1
1
12-31 1
Animating graphic objects
5. Click a security code.
To restrict access to this object, assign the appropriate security
code. For example, you might want to restrict access so only a
senior operator can edit an embedded spreadsheet. For more
information about security, see Chapter 10, Adding security.
6. Click Apply.
Attaching other types of animation to OLE objects
You can attach many types of animation to OLE objects—just as
you can with other objects. And like other objects, the type of
animation you attach depends on the object. For example, you could
attach visibility animation to a spreadsheet and then create a button
that, when selected, would display or hide the spreadsheet. This
could be used to show or hide various shift reports or management
summaries contained in embedded spreadsheets or database forms.
Configuring ActiveX control
With ActiveX control, you can map RSView32 tags to an ActiveX
object’s properties, and map RSView32 commands to an ActiveX
object’s events.
You can change an ActiveX object’s properties without using a tag.
If you choose this method, the object’s properties do not change
dynamically at runtime. For more information about making static
changes to an object’s properties, see page 11-73.
For details about how to create an ActiveX object, see “Creating and
editing ActiveX objects” on page 11-71.
The object’s properties versus RSView32 animation
Each ActiveX object has a set of properties. To view the object’s
properties, right-click the object, then click ActiveX Property Panel
on the context menu. The content of the property panel is
determined by the application that created the object, not by
RSView32.
1
1
1
12-32
Animating graphic objects
To link the ActiveX object to RSView32, you must attach ActiveX
control to the object.
IMPORTANT The runtime behavior of ActiveX objects depends on the vendor’s
implementation. Before running your project, test ActiveX objects
thoroughly to ensure they behave as desired.
To configure ActiveX control:
1. Right-click the object to open the context menu, point to
Animation, ActiveX Control, and then click the control you want.
You can also use the Animation menu on the Graphic Display
editor’s menu bar. Click Animation, point to ActiveX Control,
and then click the type of control you want.
2. Configure the control for properties and events as described on
the following pages.
1
1
12-33 1
Animating graphic objects
Naming an ActiveX object
All objects have a default name. You can change the default name of
all objects, including ActiveX objects. The object’s name is used
when logging events for that object. The object’s name is also used
for the Invoke command—to use the Invoke command to call a
method, you must specify the name of the object in which the
method is implemented.
For more information about ActiveX events, see “Attaching ActiveX
control events” on page 12-36. For more information about the
Invoke command, see “Using the Invoke command to call an
ActiveX method” on page 12-39.
To name an object:
1. Select the ActiveX object.
2. Click the right mouse button to open the context menu and then
click Object Name/Tooltip.
3. Type a name for the object, or accept the default name. Each
object in a graphic display must have a unique name. Object
names are case sensitive.
The first character of the name must be a letter, but subsequent
characters can use numbers or the underscore character (_).
4. Click OK.
To name an object using the ActiveX Property Panel:
1. Right-click the object, then click ActiveX Property Panel on the
context menu.
2. Click the Properties tab if it is not already selected.
3. In the column beside [Name], type the name for the object.
1
1
1
12-34
Animating graphic objects
Attaching ActiveX control properties
The ActiveX Property Panel shows the properties associated with
the selected ActiveX object and allows you to attach an RSView32
tag to a property. The property type is determined by the ActiveX
object, not by RSView32.
Property Type
A property type can be Bindable or Not Bindable. The type
determines how the property and the tag interact at runtime.
Bindable—When the tag value changes the property value also
changes, and when the property value changes the tag value also
changes. For example, a slider object has the bindable property
Value, which is attached to a tag called Tag1. When Tag1 changes, the
slider’s knob changes position accordingly. Likewise, when the
slider’s knob changes position (for example, by being dragged with
the mouse) the slider’s value is written to Tag1.
Not Bindable—When the tag value changes, the property value
changes. However, the reverse is not true. For example, if the slider
object described above has a property Value that is Not Bindable,
Tag1’s value will not change when the slider’s knob is changed but
the slider’s knob will change when Tag1’s value changes.
If a property is Not Bindable and read only, it does not appear on
the Animation tab of the ActiveX Property Panel.
To attach an RSView32 tag to a property:
1. Right-click the object, then click ActiveX Property Panel on the
context menu.
To open the property panel you can also right-click the object to
open the context menu, point to Animation, ActiveX Control,
and then click Properties.
1
1
12-35 1
Animating graphic objects
2. Click the Animation tab if it is not already selected.
Click for help on the
selected property.
Drag splitter bar to see
more properties.
Click for help on the
property panel.
The middle column indicates whether the property updates the tag
or the tag updates the property:
A left arrow indicates the tag updates the property
A right arrow indicates the property updates the tag
A double arrow indicates the tag and property update each
other
3. Click in the Tag column to specify the tag to use for the property.
Type the tag name or click the ... button to open the Tag Browser
and select a tag.
Attaching ActiveX control events
The ActiveX Control Events dialog box shows the events associated
with the selected ActiveX object and allows you to specify
RSView32 commands or macros that will run when the event occurs
at runtime.
1
1
1
12-36
Animating graphic objects
To launch the
Command
Wizard, click this
button.
For more
information
about the object
and its events,
click this button.
To attach RSView32 commands or macros:
1. Select the ActiveX object.
2. Click the right mouse button to open the context menu, point to
Animation, point to ActiveX Control and then click Events.
3. Select the event you want to attach the command or macro to.
4. Type the command or macro name, or click the ... button to open
the Command Wizard, and then click a command or macro.
Separate multiple commands or macros with a semi-colon (;) or
place them on separate lines. Multiple commands are executed in
the order they are listed.
5. To attach a tag to an event parameter, select an event parameter.
6. Type the tag name or click the ... button to open the Tag Browser
and select a tag. The tag’s value is determined when the ActiveX
event occurs.
1
1
12-37 1
Animating graphic objects
7. To log the event, click the Log event to RSView activity log file
check box and set up logging in the Activity Log Setup editor.
ActiveX events are logged under the Applications category and
will be logged to whatever destination you specify (activity bar,
log file, printer). For information about setting up activity
categories, see “Specifying which activities to log” on page 8-12.
When an event is logged, the name of the ActiveX object is the
message that is logged. For details about naming an object, see
“Naming an ActiveX object” on page 12-34.
Viewing ActiveX control methods
The ActiveX Control Methods dialog box shows the methods
implemented for the selected object. A method is a function that is
part of the ActiveX object.
For more
information
about the object
and its methods,
click this button.
1
1
1
12-38
Animating graphic objects
To view an object’s method description:
1. Select the ActiveX object.
2. Right-click to open the context menu, point to Animation,
ActiveX Control, and then click Methods.
3. Select the method you want to view the description for.
Using the Invoke command to call an ActiveX method
To call an ActiveX method, the object must have a name. You then
use the RSView32 Invoke command to call the method for the
named object. For details about naming an object, see page 12-34.
With the Invoke command you can:
call an object’s method
assign the value returned by a method to a tag
set an object’s property to a tag value or a constant
set a tag to the value of an object property
To call a method on an object:
On the command line or anywhere else that accepts a command,
type the following command:
Invoke file.object.method(parameter1, parameter2, . . .)
file
The name of the graphic display that contains the
ActiveX object.
me
can be used instead of file. At runtime it resolves to
the graphic file that currently has focus.
object
The name of the ActiveX object as specified
in the Object Name dialog box.
1
1
12-39 1
Animating graphic objects
method
The name of a function or sub-routine in the
ActiveX object. The method is initiated by an
external event such as the Invoke command.
parameter
The tag name or constant that the method will use.
The easiest way to specify the file.object.method(parameter1,
parameter2, . . .) string for the Invoke command is to use the
Command Wizard.
Associating objects and displays with keys
You can associate RSView32 commands with graphic objects in a
display and with the display itself using object keys and display keys.
A key is either a key on a keyboard or keypad, or a button on a
touch screen that is connected to the computer or monitor an
operator uses to interact with your RSView32 project at runtime.
Operators can use these keys to perform actions such as moving
between screens, setting tag values, and so on.4.
Object keys and display keys are different from global keys. Object
keys and display keys are active only while a particular object or
display has input focus. Global keys are active at all times. Object
and display keys are discussed on the following pages. For details
about global keys, see page 15-19.
For details about the order of precedence among object, display, and
global keys, see page 15-14.
Creating object keys
Object keys associate graphic objects with keys. When an object has
input focus, an operator can use keys to interact with the object.
For detailed information about how keys work at runtime, see
“Specifying the behavior of interactive objects” on page 11-23.
1
1
1
12-40
Animating graphic objects
Example: Using object keys
Imagine you have a display showing a tank with two valves. The two
valves control the flow in and out of the tank. Both valves have been
configured with object key animation as follows:
Valve 1
F2 = Open
F3 = Close
Valve 2
F2 = Open
F3 = Close
At runtime, operators can select either valve, press F2 to open it and
press F3 to close it.
To create an object key:
1. Select an object.
2. On the Animation menu, click Object Keys.
3. Click Add.
1
1
12-41 1
Animating graphic objects
4. Specify a key. If desired, select one or both modifiers.
Some keys are normally reserved for use by Windows and
RSView32. For details about assigning reserved keys as object,
display, or global keys, see 15-18.
5. Click OK.
The key you added is displayed in the Key field. If you specified a
modifier, the first letter of that modifier is also displayed. If you
create a label, in the next step it is also listed in this field.
The information in the Key field is used in the key list, which
appears at runtime so operators know which keys are associated
with an object and a display. For details about the key list, see
“Viewing the key list at runtime” on page 12-55.
6. In the label field, if desired, type a label for the key.
7. In the Press Action field and, if desired, in the Release Action
field, type an RSView32 command or a macro. The command or
macro is the action that will occur when the key is pressed or
released. Separate multiple commands or macros with a
semi-colon (;) or place them on separate lines.
If you want the command to perform an action on a tag, include a
tag name or the Current [Tag] parameter. The Current [Tag]
parameter is a placeholder for a tag name or any character string.
For details about the Current [Tag] parameter, see “Using the
Current [Tag] parameter” on page 12-46.
8. If you want an action to repeat while the key is held down, type
the RSView32 command or macro name in the Repeat Action
field.
1
1
1
12-42
Animating graphic objects
The repeat action repeats at the rate specified in the Keyboard
properties of the Windows Control Panel.
9. If, at runtime, you want a highlight box to appear around the
object when it has input focus, select the Highlight check box. For
details, see “Specifying the behavior of interactive objects” on
page 11-23.
10.
Click OK.
For details about the Index field, see “Using index numbers” on
page 12-43. For details about the Current [Tag] field, see “Using
the Current [Tag] parameter” on page 12-46.
Using index numbers
RSView32 assigns index numbers to the following objects:
numeric and string input objects
button objects
objects with object key animation
As you create these objects, they automatically receive an index
number. The number increases by one for each object you create.
For example, if you create a numeric input object, then a button
object, and then a string input object, the objects will have the index
numbers 1, 2, and 3.
How index numbers are used
Index numbers are used to:
determine a tab sequence for interactive objects
move among objects using the Position, NextPosition, and
PrevPosition commands at runtime. For details about these
commands, see Appendix A, RSView32 commands, or see Help.
specify which tag value goes into which numeric or string input
field in a recipe file. For details about recipe files, see “Creating a
recipe file” on page 11-60.
1
1
12-43 1
Animating graphic objects
Checking an object’s index number
To check an object’s index number, double-click the object and
check the number in the Index field.
The selected object
has index number 1.
Changing index numbers
Once you have created two or more objects with index numbers,
you can change the index numbers.
For example, if you have created four input fields, you can change
the order of their index numbers. You can change input field 4 to
index number 1. However, you cannot change input field 4 to index
number 5, because you have not created five input fields.
When you change an index number, other numbers are adjusted so
two objects do not have the same number and there are no gaps in
the numbering.
1
1
1
12-44
Animating graphic objects
To change an index number:
1. Do one of the following:
for a numeric or string input object, open the object’s
configuration dialog box by double-clicking the object
for a button object, open the object’s configuration dialog box
by double-clicking the object
for an object with object key animation, select the object and
then open the Object Keys dialog box
2. In the Index field, type a new number.
3. Click OK.
If you typed a number that is too high, RSView32 automatically
adjusts the index number to use the highest available number.
If you type a number that is already in use, RSView32 renumbers
the other objects in the display. This will change the tab sequence.
Creating a tab sequence
A tab sequence is the order in which users can move through a series
of objects using the Tab key. To create a tab sequence, use index
numbers. To move through a tab sequence:
press Tab to move through the objects from lowest index number
(1) to highest index number.
press Shift-Tab to move through the objects from highest index
number to lowest index number (1).
1
1
12-45 1
Animating graphic objects
Example: Creating a selection order
In the display below, pressing the Tab key moves users through the
objects in a left to right pattern.
The valves are objects
with object key
animation.
The boxes are
numeric input fields.
The buttons are
button objects.
The numbers above
the objects show each
object’s index number.
Using the Current [Tag] parameter
The Current [Tag] parameter is a placeholder for a tag name or any
character string. Use this parameter to create a command that is
object-specific.
For example, if you want F2 to set the value of a selected object’s tag
to 0, you would set up a display key for F2, using the [tag]
parameter, and then set up object keys for each object on the screen,
specifying which tag to use for each object.
1
1
1
12-46
Animating graphic objects
Summary of steps
1. Create a graphic object.
2. In the Display Keys dialog box, associate a key with an RSView32
command. Use the [tag] placeholder as the command’s parameter.
To open the Display Keys dialog box, click the Animation
menu and then click Display Keys.
In the Press Action field, specify an RSView32 command with
[tag] as the command parameter.
3. Select the graphic object.
4. In the Object Keys dialog box, supply the tag name or character
string that will replace the placeholder.
To open the Objects Keys dialog box, click the Animation
menu and then click Object Keys.
In the Current [Tag] field, specify a tag name or a character
string.
At runtime, when the object is selected and the display key is
pressed, the contents of the Current [Tag] field replace [tag] in the
RSView32 command.
Examples
For ways to use the [tag] parameter, see the examples starting on
page 12-47.
Example 1: Creating display-wide keys to open and close valves
Imagine you have a graphic display containing 20 valves and you
want operators to be able to open and close all the valves with the
same two keys. Instead of specifying the tag name for each valve, use
the [tag] parameter with display keys.
1
1
12-47 1
Animating graphic objects
1. In the Display Keys dialog box, assign two display keys. For the
press action, type Set [tag].
2. In the Object Keys dialog box, type the tag name in the Current
[Tag] field for each valve object.
Type the tag name here.
At runtime, the operator can select any valve object, and press F2 to
open the valve and F3 to close it.
1
1
1
12-48
Animating graphic objects
Example 2: Opening object-specific Help
Imagine you have a graphic display containing various graphic
objects that represent plant-floor equipment. If something goes
wrong with a piece of equipment, you want operators to be able to
select the appropriate object and display a Help file that suggests
steps for correcting the situation.
1. In the Display Keys dialog box, assign a display key. In the Press
Action field, type Help [tag].
2. In the Object Keys dialog box, type the appropriate help file name
in the Current [Tag] field for each equipment object.
1
1
12-49 1
Animating graphic objects
Type the name of the
help file here.
At runtime, when an operator selects any equipment object and
presses F4, the help file for that piece of equipment is displayed.
Example 3: Opening an object-specific alarm summary
Imagine you want to have alarm information available for a specific
machine. If something goes wrong and causes an alarm, you want the
operator to be able to display an alarm summary for that machine.
1. Create an alarm summary that uses a filter to display only the
alarms for the machine. For more information about creating an
alarm summary, see page 6-52.
2. In the Display Keys dialog box, assign a display key. In the Press
Action field, type Display AlmSumm /t[tag].
1
1
1
12-50
Animating graphic objects
3. In the Object Keys dialog box, type the name of the alarm
summary file in the Current [Tag] field for each machine object.
Type the name of the
alarm summary object.
At runtime, when the operator selects an equipment object and
presses F5, the alarm summary for that piece of equipment appears.
1
1
12-51 1
Animating graphic objects
Creating display keys
Display keys associate graphic displays with keys. Using the keys,
operators can interact with the graphic displays at runtime.
Example: Using a display key
Suppose you want the Home key to display a main menu display. To
do this, create a display key as follows:
In the Press Action field, type: Display Main Menu
Whenever an operator presses Home, the active graphic display
closes and the Main Menu display opens.
If the Main Menu display is of the Overlay display type, you must
use the Abort command to close the active display.
For details about how keys and other interactive objects work at
runtime, see “Specifying the behavior of interactive objects” on
page 11-23.
1
1
1
12-52
Animating graphic objects
To create a display key:
1. On the Animation menu, click Display Keys.
2. Click Add.
3. Specify a key and, if desired, select one or both modifiers.
Some keys are reserved for use by Windows and RSView32.
Reserved keys do not appear in the Key field in the Add Key
dialog box.
1
1
12-53 1
Animating graphic objects
4. Click OK.
The key you added is displayed in the Key field. If you specified a
modifier, the first letter of that modifier is also displayed. If you
create a label in the next step, it is also listed in this field.
The information in the Key field is used in the key list, which
appears at runtime so operators know which keys are associated
with an object and a display. For details about the key list, see
“Viewing the key list at runtime” on page 12-55.
5. In the label field, if desired, type a label for the key.
6. In the Press Action field and, if desired, in the Release Action and
Repeat Action fields, specify an RSView32 command or a macro.
Type the command or macro or click the ... button to open the
Command Wizard. The command or macro is the action that will
occur when the key is pressed, pressed and held, or released.
Separate multiple commands or macros with a semi-colon (;) or
place them on separate lines.
If you want the command to perform an action on a tag, include a
tag name or the [tag] parameter. For details about the [tag]
parameter, see “Using the Current [Tag] parameter” on
page 12-46.
7. Click OK.
Editing display and object keys
Editing display and object keys is the same except that for object
keys you must first select an object.
Modifying a key
1. On the Animation menu do one of the following:
to modify object keys (you must have an object or group of
objects selected first), click Object Keys
to modify display keys, click Display Keys
2. In the Key field, select the key you want to modify.
1
1
1
12-54
Animating graphic objects
3. Click the Modify button.
4. Make the necessary changes, and then click OK.
Removing a key
1. On the Animation menu do one of the following:
to remove object keys (you must have an object or group of
objects selected first), click Object Keys
to remove display keys, click Display Keys
2. In the Key field, select the key you want to remove.
3. Click the Remove button, and then click OK.
Removing all keys
1. On the Animation menu do one of the following:
to remove object keys (you must have an object or group of
objects selected first), click Object Keys
to remove display keys, click Display Keys
2. Click the Remove All button, and then click OK.
Viewing the key list at runtime
At runtime, users can use the key list to see which keys are
associated with an object and display, and to see what actions the
keys will perform. 3.
Key
Modifiers
Label
1
1
12-55 1
Animating graphic objects
The key list displays the keys listed in the Key fields of the Object
Keys and Display Keys dialog boxes. All object keys are displayed
and then all display keys. The key list does not separate the two
types of keys because this distinction does not matter to
operators—they only need to know what action will occur when
they press a key.
To display a key list at runtime:
1. Place the cursor over an object with key animation.
2. Click the left mouse button.
The key list is displayed. It lists keys associated with this object
and all keys associated with this display.
Disabling the key list
To disable the key list, use the /O parameter with the Display
command. For details, see Appendix A, RSView32 commands, or see
Help.
Applying animation to groups
You can apply animation to objects and then group those objects and
apply animation to the group. When the display is running,
animation is evaluated from the inside out.
To apply animation to objects within groups, use the group edit
feature. For details, see page 11-86.
1
1
1
12-56
Animating graphic objects
Checking the animation on objects
To see what type of animation an object or group of objects has:
use the Animation menu or the Animation dialog box
use Peek, as described on page 12-58
Using the Animation menu and the Animation dialog box
Use the Animation menu or the Animation dialog box to see what
type of animation a graphic object or grouped object has. To see
what type of animation objects within a group have, use the group
edit feature. For details, see page 11-86.
To view the animation on an object using the menu:
1. Select an object.
2. View the animation by doing one of the following:
on the menu bar, click Animation and see which items have a
check mark
place the cursor over the object and press the right mouse
button to display the context menu. Then click Animation from
this menu and see which items have a check mark.
The object
has visibility
animation.
1
1
12-57 1
Animating graphic objects
To view the animation on an object using the Animation dialog box:
1. Select an object.
2. On the View menu, click Animation.
When the Animation dialog box opens, click the tabs to see which
types of animation have been set up.
Using Peek
Use Peek to view the animation attached to a graphic object or group
of objects. In the Peek Settings dialog box, you specify what type of
animation you want to check. When Peek is turned on, any objects
with the type of animation you have specified are surrounded by a
red box.
For example:
if you click Color, any objects with color animation will have a
red box
if you click Object Keys, any objects that have keys associated
with them will have a red box
Viewing this list
is a good way
to see which
tags have been
used in the
graphic display.
Tags in
commands are
not included on
the list.
The Peek highlight is not visible in a graphic display with a red
background.
1
1
1
12-58
Animating graphic objects
To specify types of animation:
1. On the View menu, click Peek Settings.
2. Click Animated Objects, and then click any of the types of
animation.
You can click as many types of animation as you want. However,
Peek does not show the specific type of animation an object has.
For example, if you choose color and visibility animation, all
objects with these types of animation will be highlighted, but you
will not know which objects have which types of animation.
3. If you want Peek to be active when you close the dialog box, click
Activate Peek.
Otherwise, specify the settings and save them. Later when you
want to turn on Peek, click Peek On on the View menu.
4. To save your settings, click OK.
To turn Peek on and off:
Do any of the following to turn Peek on:
click Peek On on the View menu
click Activate Peek in the Peek dialog box
When Peek is on, the cursor looks like this:
Peek automatically turns off as soon you do any action in the
Graphic Display editor. For example, if you are peeking at objects
and then move an object, Peek is turned off.
1
1
12-59 1
Animating graphic objects
Changing the animation on objects
You can change the animation attached to a group of objects or to
individual objects within the group. To access objects within a group,
use the group edit feature. For details, see page 11-86.
To change the animation on objects:
1. Select the object.
2. Open the Animation dialog box.
3. Make the required changes.
4. Click Apply.
Copying or duplicating objects with animation
You can copy or duplicate objects that have animation attached to
them. When you do, the animation attached to the objects is also
copied or duplicated. If you copy or duplicate a group, the copy of
the group can be ungrouped to individual objects, just like the
original.
For information about copying and duplicating objects, see
pages 11-79 and 11-81.
To copy objects with animation:
1. Select the objects.
2. Do one of the following:
use the copy and paste commands on the Edit menu or toolbar,
or use Ctrl-C to copy and Ctrl-V to paste
in the same display, drag the object and then press Ctrl and
drop the object
between displays, drag and drop objects
1
1
1
12-60
Animating graphic objects
To duplicate objects with animation:
1. Select the objects.
2. On the Edit menu, click Duplicate.
Copying animation without copying objects
If you have attached animation to an object, you can copy the
animation and paste it onto another object. If the object has more
than one type of animation, all animation is copied and pasted. Note
that you can’t use RSView32 animation on ActiveX controls.
To copy and paste animation:
1. Select the object that has the animation you want to copy.
2. On the Edit menu, click Copy Animation.
3. Select the object(s) that you want to copy the animation to.
4. On the Edit menu, click Paste Animation.
1
1
12-61 1
13
Configuring trends
This chapter describes trends, and outlines how to:
create and configure a trend object
layer trends to compare realtime and historical tag values
use objects from the Trends graphic library
provide buttons and sliders for controlling a trend at runtime
About trends
A trend is a visual representation of realtime or historical tag values.
The trend provides operators with a way of tracking plant activity as
it is happening.
You can:
plot data for as many as sixteen tags on one trend
use shading to emphasize when a particular tag crosses a reference
value
create a trend that is part of a graphic display or acts as the entire
graphic display
The illustration on the following page shows a trend that has been
added to a graphic display.
1
1
13-1 1
Configuring trends
Trend
object
Key concepts
Trend object
A trend object is created in the Graphic Display editor. It can be
created and edited like any other advanced object.
Trend dialog box
The Trend dialog box contains two tabs for configuring the
appearance and content of the trend: Trend Configuration and Pen
Configuration. By filling in the fields under these tabs, you specify
what kind of data the trend will plot and how the data will look.
1
1
1
13-2
Configuring trends
Data source
The data displayed in a trend can come from two sources. For
realtime trends, data comes from the value table as it is collected. For
historical trends, data comes from a data log model’s set of files.
Historical trends can also be set up to display data from a single log
file at a time. This is called file-based trending, and is useful if you
want to display data from a particular shift or batch process.
For historical trends you can display data from a data log model in
the project you are running, or you can display data from a different
project, either on the same computer or on another computer on the
network. Displaying data from a different project is called remote
trending.
Pens
Pens are the lines and/or symbols used to represent values. The
values can be tags you are monitoring or they can be constant values.
To show a tag value, specify a tag name. To show a constant
value—such as a tag’s alarm levels—specify a value instead of a tag
name. To define the pen’s tag at runtime, use a tag placeholder. For
details, see “Configuring pen style” on page 13-19.
Both of these
lines are pens.
Pens can be
different colors,
widths, and
symbols so
operators can
easily distinguish
one pen from
another.
1
1
13-3 1
Configuring trends
Shading
Use shading to show relationships between tags and to compare tag
values to constants. The figure below calls attention to tag values in
alarm. The difference between the tag’s value and the alarm’s level is
shaded.
Shading between
pen values
Legend
Legend
Include a legend at the bottom of the trend to identify the data that is
being drawn by each pen. You can include some or all of the pens in
the legend, and can label each pen.
Control tags
Control tags are a type of memory tag—that is, they are tags that are
created and updated by RSView32. You can use these tags to control
the view of the trend at runtime—for example, you can scroll and
zoom in on the trend. 6
1
1
1
13-4
Configuring trends
Summary of steps
These are the steps for creating a trend:
create a trend object in the Graphic Display editor
configure the trend in the Trend dialog box
provide a method for controlling the trend
Creating a trend object
To create a trend object:
1. Open the Graphic Display editor.
2. Choose the Trend drawing tool by doing one of the following:
open the Objects menu, click Advanced Objects, and then click
Trend
click
in the Drawing Tools toolbox
The cursor changes to the trend drawing tool:
3. Drag the mouse to create a box approximately the size you want
for the trend.
When you release the mouse, the Trend dialog box opens.
4. Configure the trend as described on the following pages.
Once you have configured the trend, you can edit it as you would
any other graphic object. You can move it, resize it, attach
animation to it, and so on. You can also use this object in other
graphic displays by dragging it from one display and dropping it
into another.
For detailed information about graphic objects, see Chapter 11,
Creating graphic displays.
1
1
13-5 1
Configuring trends
Instead of creating a trend from scratch, you can use the trend in the
Trends graphic library. For more information, see “Using the Trends
graphic library” on page 13-35.
Working in the Trend dialog box
When you release the mouse button after drawing a trend object, the
Trend dialog box appears.
Click this tab to specify
the appearance of the
time and vertical axes and
other features of the
trend’s appearance.
Click this tab to set up the
pens that will plot the
values of the trend.
1
1
1
13-6
Configuring trends
Trend configuration
To configure the time axis, vertical axis, and other aspects of the
trend’s appearance: 5.
1. In the Trend dialog box, click the Trend Configuration tab.
2. Fill in the fields. See the topics on the following pages for
information about the fields.
3. Click OK.
Configuring the time axis
The following illustration shows many of the components of the
time axis:
Major division
Minor division
Scale
(displaying time)
1
1
13-7 1
Configuring trends
To configure the time axis, fill in the following fields as outlined
below.
Start time for a realtime trend
For a realtime trend, NEWEST is shown. Data will start plotting as
soon as the trend starts, with the newest data available.
You cannot modify the start time for a realtime trend.
Start time for a historical trend
Start times for historical data can be relative or absolute. With
relative time, plotting always starts relative to the newest or oldest
data in the log model or log file. With absolute time, plotting always
starts at the specified date and time.
You can also specify a start time at runtime. For details, see
“Specifying a start time” on page 13-33.
To specify relative time, type one of the following:
the word NEWEST or NEWEST minus (-) a time range
the word OLDEST or OLDEST plus (+) a time range
Specify the time range as a whole number followed by a unit. Valid
units are: Sec, Min, Hour, Day, Week.
1
1
1
13-8
Configuring trends
Example: Relative Time
To display data starting 90 minutes from the oldest data in the log
model, type:
To specify absolute time:
Absolute time is specified by the month, day, year, hour, minute, and
second. For an absolute start time, type:
MMM DD YYYY hh:mm:ss where:
MMM
is month
DD
is day
YYYY
is year
hh:mm:ss
is hours, minutes, seconds
Time Range
The time range determines the time span on the time axis. Together,
the start time and time range determine how many points are plotted
on the time axis.
Specify the time range as a whole number followed by a unit. Valid
units are: Sec, Min, Hour, Day, Week.
1
1
13-9 1
Configuring trends
Examples: Start Time and Time Range
To plot realtime data in a 60-second window, specify:
To display one day of data starting on Jan 19, 1998 at 1:30 pm, type:
Divisions
Specify the number of major and minor divisions you want marked
on the time axis. Keep the number of divisions small so they will be
visible.
Scale
Check this box to have a time scale appear at the bottom of the
trend. Depending which check boxes you select, the scale can
contain any or all of the following: the major and minor divisions,
the date, and the time. After you close the Trend dialog box, you can
change the font displayed in the scale by selecting Fonts on the
Attributes menu.
Grid
Check this box to have vertical grid lines extend from the major and
minor divisions on the time axis.
1
1
1
13-10
Configuring trends
Date
Check this box to show the date in the scale.
The format of the date is determined by the Short date format
specified in the Regional Settings option in the Windows Control
Panel. For more information about this option, see “Specifying time,
date, and number formats” on page 18-12, or see your Windows
documentation.
Scroll Axis
Check this box to have the grid for the time axis scroll across the
trend. When this box is not checked, the grid for the time axis is
fixed.
Time
Check this box to show the time in the scale. Time is displayed in the
following format: HH:MM:SS (hour, minute, second).
Relative Time
This check box is visible only when Historical is selected as the data
source. Check this box to show the time of the trend in relation to
the oldest time. The oldest time is one of the following:
for a historical trend, it is the oldest logged data in the log model
for a file-based trend, it is the oldest logged data in a log file
Relative time is displayed in the following format: DD:HH:MM:SS
(day, hour, minute, second).
1
1
13-11 1
Configuring trends
Configuring the vertical axis
The following illustration shows the components of the vertical axis:
Major division
Vertical axis
scale
Minor division
To configure the vertical axis, fill in the fields as outlined below:
Divisions
Specify the number of major and minor divisions you want marked
on the vertical axis. Keep the number of divisions small so they will
be visible.
Scale
Check this box to display a scale with the range of values for a pen.
These values are determined by the minimum and maximum values
for the pen scale, which are configured in the Pen Configuration tab.
The font color and vertical axis scale are determined by the pen that
is selected when the trend is running. By default, pen 1 is selected.
1
1
1
13-12
Configuring trends
Digits
Select the number of characters you want to display in the pen scale,
including the decimal point. The values that appear in the scale are
selected in the Pen Configuration tab. Specify enough digits so the
scale is wide enough to display the minimum and maximum values
for all your tags. If the pen value does not fit it appears in scientific
notation.
To display the division markings on the vertical axis without
numbers, select 0.
Grid
Check this box to have horizontal grid lines extend from the major
and minor divisions on the vertical axis.
Choosing a data source
The data for trends can be realtime, historical, or file-based. Realtime
data comes from the value table. Historical data comes from a data
log model’s set of files. File-based data comes from a single log file at
a time.
For a realtime trend:
Click the Real Time button.
The buffer for each realtime trend pen can contain up to 2,000 tag
values. A tag value is saved to the buffer whenever that value
changes. When the buffer is full, the oldest value is overwritten with
a new value.
1
1
13-13 1
Configuring trends
To ensure a realtime trend contains data, see “Ensuring realtime
trends have data” on page 13-26.
For a local historical trend:
To display historical data from a data log model in the project you
are running, click Historical, then click Local and specify a data log
model in the Model field.
For a remote historical trend:
To display historical data from a different project (from another
location on the same computer or from another computer), click
Historical, then click Remote.
In the Model field, type the complete path to the logged data (to the
.dlg file), or click ... and select a .dlg file.
For a file-based trend:
Click Oldest File to display data from the oldest file in the data
model. For local data, specify a data log model in the Model field.
For remote data, type the complete path to the logged data (to the
.dlg file), or click ... and select a .dlg file.
1
1
1
13-14
Configuring trends
Click Newest File to display data from the newest file in the data
model. For local data, specify a data log model in the Model field.
For remote data, type the complete path to the logged data (to the
.dlg file), or click ... and select a .dlg file.
Click Choose File to select the data file that will be used. For local
data, specify a data log model in the Model field. For remote data,
type the complete path to the logged data (to the .dlg file), or click ...
and select a .dlg file.
In the File field, select a data log file.
For detailed information about how data log files are named, see
Chapter 7, Configuring data logging.
Configuring control
To configure control, fill in the fields as outlined below:
1
1
13-15 1
Configuring trends
Rate
Type a number to specify how often to update the trend.
For realtime data, the rate determines how often the value table is
checked for new data. If you have specified a scan class for the tags,
do not specify a rate faster than the scan class rate.
For historical data, the rate determines how often the log file is
checked for new data. Do not specify a rate faster than the rate at
which the data is logged to the file. For example, if you set up
periodic logging with a 20-second interval, do not specify a rate less
than 20 seconds, because no new data will be available.
Control Tag
Type a name for the folder that will contain the trend control tags.
Control tags are used to control the view of the trend at runtime.
When you save the trend configuration, a folder by this name will be
created in the Tag Database. This folder will contain the trend
control tags.
For example, if you type Trend1 in the Control Tag field, the system
will create a folder called Trend1. Each tag in the folder will have
Trend1 as the first part of its name.
For more information about these tags, see “Creating control for a
trend” on page 13-27.
1
1
1
13-16
Configuring trends
Creating a legend
To include a legend, check the Show Legend box.
In the Pen Configuration tab, you can specify which pens you want
included in the legend and create a label for each pen.
The following illustration shows a trend with a legend:
Pen value
Legend
Pen label
1
1
13-17 1
Configuring trends
Pen configuration
To configure the pens that will plot the data for the trend:
4.
1. In the Trend dialog box, click the Pen Configuration tab.
To begin
configuring pens,
select a pen here.
When you select
another pen, the
configuration for
the previous pen
is saved.
2. Select a pen. For each pen you select, fill in the fields in this tab.
The fields are described below.
To move to another pen, select it in the Pen Selection field.
1
1
1
13-18
Configuring trends
Configuring the tag or value
In the Tag or Value field, specify one of the following:
an analog or digital tag, or a tag placeholder
Tag placeholders allow you to insert tag names at runtime. A
placeholder is a cross-hatch character (#) followed by a number
from 1 to 500. For details about placeholders, see “Using tag
placeholders” on page 11-37.
a value
When you specify a value, the pen draws a constant horizontal
line on the trend. Use horizontal lines to provide a frame of
reference for your tags. For example, if you define values that are
the limits within which a tag should operate, when a tag crosses
one of these limits the tag’s alarm condition is obvious on the
trend.
Configuring pen style
To configure pen style, fill in the fields as described below:
Show Line
Check this box if you want to draw a line between the plotted
symbols. If you want only plot symbols visible, leave this box empty.
Color
Select a color for the pen. Do not choose the same color as the
background of the trend object.
1
1
13-19 1
Configuring trends
Show Plot Symbol
Check this box if you want a plot symbol. The plot symbol appears
at each point that is plotted. The plot symbols are:
Name
Symbol
Name
Symbol
Hollow Square
P
Filled Diamond
◆
Filled Square
3
Hollow Circle
Up Hollow Triangle
▲
Up Filled Triangle
Down Hollow Triangle
▼
Down Filled Triangle
Filled Circle
/
Dot
0
Cross
✕
Star
Hollow Diamond
Line Interpolation
Line interpolation determines how a line is drawn. The choices are:
This item
Does this
Automatic
Draws the appropriate type of line based on the tag type. For
example, for a digital tag, digital interpolation is automatically used.
For an analog tag, linear interpolation is automatically used.
Linear
Draws a straight line between two points, which suggests a gradual
change from the first point to the second point. For example:
✕
✕
Digital
Draws a line along the time axis at the first value then, when the
value changes, draws a vertical line to the second value. For
example:
✕
✕
Full Width
Draws the most recent value for a tag horizontally across the trend.
For example, if the most recent value for a tag is 75, draws a line
across the trend at 75. When the value changes, redraws the line
at the new value.
You can use full width to display values that act as high and low
setpoints.
1
1
1
13-20
Configuring trends
Custom Pen Width
The custom pen width affects the thickness of the line and the plot
symbols.
Check this box if you want to specify a different pen width. If you
do not specify a width, the line for the pen will be the same as the
grid lines.
Configuring pen scale
The pen scale defines the range of numbers on the vertical axis. The
vertical axis changes to reflect the minimum and maximum values for
the selected pen’s tag.
For example, if Tag1 has a minimum value of 10 and a maximum
value of 100, the range on the vertical axis will be 10 to 100 when the
Tag1 pen is selected. If Tag2 has a minimum of -10 and a maximum
of 50, the range on the vertical axis will change to -10 to 50 when the
Tag2 pen is selected.
If you want all pens in the trend to use the same range on the vertical
axis, specify the same range in the Custom Min/Max field.
Use Tag’s Min/Max
Select this button to use the tag’s minimum and maximum range as
configured in the Minimum and Maximum fields of the Tag Database
editor.
Custom Min/Max
Select this button to specify a range, then type minimum and
maximum values. To always have the same range on the vertical axis,
specify the same minimum and maximum values for all pens.
1
1
13-21 1
Configuring trends
Configuring shading
Use shading to compare the values of different pens. To have
shading, at least two pens must be defined.
For the upper and lower boundaries, select the pens with which to
compare values. When the pen you are defining plots above the value
of an upper boundary pen, or below the value of a lower boundary
pen, the area between the pen you are defining and the boundary pen
will be shaded. The shading color will be the color you select under
Style.
IMPORTANT Shading is determined by the position of lines on the screen—not by the
actual tag values—because each tag has its own vertical axis. This is
important if you have specified different minimum and maximum values for
the pens.
1
1
1
13-22
Configuring trends
Example: Shading with three pens
The upper pen, Pen 2, has a constant value of 75 and the lower pen,
Pen 3, has a constant value of 25. Pen 1 represents the tag called
VIN_LEVEL. The trend will be shaded whenever Pen 1 goes above
Pen 2 or below Pen 3. A plot for this trend looks like this:
Pen 1
Pen 2
Pen 3
40064
To produce the shading shown above, the following settings were
used:
Pen
Tag Name or Value
Pen 1
VIN_LEVEL
Pen 2
75
Pen 3
25
Shading
Upper Bound
Lower Bound
Pen 2
Pen 3
1
1
13-23 1
Configuring trends
Example: Shading with two pens
Whenever Pen 1 goes above Pen 2, the trend will be shaded like this:
Pen 1
Color 1
Pen 2
42603
To produce the shading shown above, the following settings were
used:
Pen
1
1
1
13-24
Tag Name
Pen 1
VIN_LEVEL
Pen 2
OIL_LEVEL
Shading
Upper Bound
Pen 2
Lower Bound
Configuring trends
Example: Shading between two pens
Whenever Pen 1 goes above or below Pen 2, the trend will be shaded
like this:
Pen 1
Color 1
Pen 2
40065
To produce the shading shown above, the following settings were
used:
Pen
Tag Name
Shading
Upper Bound
Lower Bound
Pen 1
VIN_LEVEL
Pen 2
Pen 2
Pen 2
OIL_LEVEL
Creating a legend
To include a pen in the legend, leave the box checked. To label the
pen, type a label such as a tag name or description. If you do not
type a label, the pen’s tag name appears in the legend. If you use a tag
placeholder in the Tag or Value field, you can also type the tag
placeholder here, to insert the tag name in the legend at runtime.
1
1
13-25 1
Configuring trends
Ensuring realtime trends have data
Realtime trends collect data only while the trend is displayed. This
means that a trend will not contain any data when it starts. To ensure
a trend contains data once it has started, keep the trend updating in
the background by loading it into the display cache.
Example: Ensuring a realtime trend has data
1. Create a startup macro that includes this command:
Display Trend1 /ZA
where Trend1 is the name of the display containing the realtime
trend, and /ZA is the parameter for loading the display into the
display cache (but not making it visible) and continually updating
the display even when it is not visible.
The display is loaded when you start the project and remains in
the cache until you use the FlushCache command or stop running
the project.
2. When you want the realtime trend to become visible, specify the
following command:
Display Trend1
Trend1 will then be displayed in the foreground and will contain
data.
1
1
1
13-26
Configuring trends
Comparing realtime and historical data
You can layer trends, which is useful for comparing realtime and
historical data in order to see process changes.
To layer trends:
1. Create two or more trends of the same size.
2. Configure the trends.
3. Select the trend that will be on top. On the Attributes menu, click
Hollow.
4. Move the trend that will be on top over the other trend.
5. With the trend still selected, click Bring to Front on the Arrange
menu.
Creating control for a trend
To control a trend, operators require buttons and other graphic
objects that are associated with the trend’s control tags. You can
draw your own buttons and objects for controlling a trend, or you
can use the objects in the Trends library. For details, see “Using the
Trends graphic library” on page 13-35.
Control tags are a type of memory tag—that is, they are tags that are
created and updated by RSView32. You can use these tags to control
the view of the trend at runtime—for example, you can scroll and
zoom in on the trend.
To create control tags, you have to type a name in the Control Tag
field in the Trend dialog box. When you do, a folder with that name,
containing the trend control tags, is created in the tag database.
IMPORTANT If at runtime you display multiple trends that use the same control tags,
changes to one trend affect all the other trends that use the tags,
including trends that are loaded in the cache and are not visible.
1
1
13-27 1
Configuring trends
If you copy a trend, the new trend uses the same Control Tag folder
name. Therefore, if you plan to display both trends simultaneously,
rename the copied trend’s Control Tag folder name.
Trend control tags
The trend control tags are:
Tag name
Function
Read or Write?
\CurrentFile
Number of the current data log file. Each data
log file is numbered in sequence.
Read and write
(see Function
column)
\CurrentPen
Number of the current pen (1 – 16) highlighted
in the legend.
Read and write
\NewestFile
Offset from current data log file to newest data
log file.
Read only
\NewestTime
Time of the newest data sample available for
plotting.
Read only
\OldestFile
Offset from current data log file to oldest data
log file.
Read only
\OldestTime
Time of the oldest data sample available for
plotting.
Read only
\Paused
A tag value of 1 pauses the trend.
Read and write
A tag value of 0 resumes movement of the
trend.
For realtime trends, RSView32 reads the value
of this tag when the trend is first displayed to
determine whether to start the trend in paused
or resumed mode. If this tag doesn’t exist, the
trend is started in resumed mode.
For historical trends, RSView32 reads the value
of this tag when the trend is first displayed to
determine whether to start the trend in paused
or resumed mode. If this tag doesn’t exist, the
trend is started in paused mode.
File-based trends are always started in paused
mode.
1
1
1
13-28
Configuring trends
Tag name
Function
Read or Write?
\PenMask
A 16-bit mask that controls the visibility of the
trend pens. If the bit corresponding to a pen is
set in this mask, the pen is displayed. For
example:
Read and write
PenMask = 0000 0000 0000 0000 = 0
No pens are displayed.
PenMask = 0000 0000 0000 0100 = 4
Only Pen 3 is displayed.
\StartTime
Long integer tag specifying the time at the right
margin of the time scale.
Read and write
The start time value is the number of seconds
elapsed since midnight (00:00:00), January 1,
1970, coordinated universal time (UTC).
\StartTimeDate
String tag representing the start time and date
for the trend (at the right margin of the time
scale). For example, JAN 01 1998 13:00:00.
Read and write
\TimeRange
Time range of the time scale in seconds.
Read and write
\Updating
Digital tag that indicates whether the trend
object is retrieving data log data. The tag value
is 1 if retrieving data, and 0 if not.
Read only
\YMag
Magnification of the vertical axis in percent.
Read and write
0 No magnification
100 Twice the resolution (half the range)
-100 Half the resolution (twice the range)
\YOffset
Offset of the vertical axis in percent. Moves the
view up or down but does not change the time
range.
Read and write
1
1
13-29 1
Configuring trends
How the trend control tags work
When a trend is running, the data for a trend—either realtime or
historical—is stored in a buffer. The trend is a view of this buffer.
The values of the control tags determine how the data is viewed. The
following illustration shows what the OldestTime, TimeRange,
StartTime, and NewestTime control tags represent:
OldestTime
TimeRange
StartTime NewestTime
When the value of one control tag changes, some aspect of this view
changes. For example, the TimeRange tag determines how much of
the data is shown at one time and the StartTime determines where
the right margin of the trend is in relation to the total time span
represented by the data.
The values for the trend control tags initially come from the
information configured in the Trend dialog box. As the trend runs,
some values are updated, such as the times of the newest and oldest
data. The time of the oldest data changes when the trend’s buffer
becomes full and the oldest data is discarded. The time of the newest
data changes when new data is available for the trend.
1
1
1
13-30
Configuring trends
Creating objects to animate a trend
To provide animated objects, use the items in the Trends library, or
create your own objects and configure animation for them. See
“Using the Trends graphic library” on page 13-35 for details about
the Trends graphic library.
To create your own objects, follow the steps in Chapter 11, Creating
graphic displays. To configure animation for the objects you create,
follow the steps in Chapter 12, Animating graphic objects.
The following table lists some expressions you can use when
configuring animation. When creating expressions, remember to use
the full tag name, which includes the Control Tag folder name. For
example, for a Control Tag folder called Trend, the full tag name is
Trend\StartTime, Trend\OldestTime, and so on. For brevity, the
folder name is omitted from the tag names in the examples below.
To
Use this expression
Move all the way to the left (view the oldest
data)
StartTime = OldestTime + TimeRange
Move all the way to the right (view the
newest data)
StartTime = NewestTime
Move one view to the left
StartTime = StartTime – TimeRange
Move two views to the left
StartTime = StartTime – 2 TimeRange
Move one view to the right
StartTime = StartTime + TimeRange
Move two views to the right
StartTime = StartTime + 2 TimeRange
Pause the trend
Paused = 1
Resume the trend
Paused = 0
Specify the newest data log file as the
current file*
CurrentFile = Current File + NewestFile
Move from the current file to one file
earlier*
CurrentFile = CurrentFile – 1
Move from the current file to one file later*
CurrentFile = CurrentFile + 1
Specify the oldest data log file as the
current file*
CurrentFile = CurrentFile – OldestFile
* Expressions using CurrentFile are applicable to trends using the Choose File, Oldest
File, and Newest File Data Sources. Historical trends move between files automatically.
1
1
13-31 1
Configuring trends
Masking pens
By default, all pens in a trend are visible. However, too many pens
on one display can be difficult to read. To enable operators to hide or
show individual pens, set up pen masking.
The Trends graphic library contains buttons that are already
configured for pen masking. To use these buttons, drag and drop
them into your graphic display.
To set up pen masking, create an expression that sets the value of the
bit for the \PenMask control tag. To show the pen, the bit must be 1.
To hide the pen, the bit must be 0.
You cannot use binary numbers to set a value—you must use
decimals. The following table shows the decimal value for each pen:
1
1
1
13-32
Pen Number
Binary Mask Value
Decimal Value
1
0000 0000 0000 0001
1
2
0000 0000 0000 0010
2
3
0000 0000 0000 0100
4
4
0000 0000 0000 1000
8
5
0000 0000 0001 0000
16
6
0000 0000 0010 0000
32
7
0000 0000 0100 0000
64
8
0000 0000 1000 0000
128
9
0000 0001 0000 0000
256
10
0000 0010 0000 0000
512
11
0000 0100 0000 0000
1024
12
0000 1000 0000 0000
2048
13
0001 0000 0000 0000
4096
14
0010 0000 0000 0000
8192
15
0100 0000 0000 0000
16384
16
1000 0000 0000 0000
32768
Configuring trends
Example: Showing or hiding a pen
The following example describes how to use pen masking to show or
hide a pen.
To hide Pen 10 (without affecting other pens), use the bitwise AND
operator and the complement of the pen’s decimal value:
PenMask = PenMask & ~ 512
To show Pen 10 again, use the bitwise OR operator and the pen’s
decimal value:
PenMask = PenMask | 512
Specifying a Start time
To specify an absolute trend start time, use the \StartTimeDate
control tag. The \StartTimeDate control tag overrides the time
specified in the Start Time field of the Trend dialog box. Create a
string input object so that the operator can enter the date and time of
the start time. 6.
To specify a relative trend start time, create an = (Equal) command
that uses the system\DateAndTimeInteger tag as the current time
and performs calculations relative to its value. The value that is
added to or subtracted from the current time must be in seconds.
1
1
13-33 1
Configuring trends
Example: Specifying an absolute start time
The current display contains these objects:
A historical trend with a Control Tag folder called Trend
A string input object configured with the control tag
Trend\StartTimeDate
To specify a start time of 1:00 pm on January 1, 1998, the operator
enters this string in the string input object:
JAN 01 1998 13:00:00
Example: Specifying a start time one hour before the current time
Display “Process Trend”
Trend\StartTime=system\DateAndTimeInteger - 3600
When these commands run, RSView32 displays the trend graphic
called Process Trend and sets the start time for the trend to the
current time minus 3600 seconds (1 hour).
You can specify the start time from a graphic object or from a macro.
For example, create a button object and use the above commands as
the press action for the button.
IMPORTANT Do not set control tags from a macro that is launched from the Startup
field in the Display Settings dialog box of the Graphic Display editor. All
commands and macros launched from the Startup field are executed
before the graphic display is initialized.
1
1
1
13-34
Configuring trends
Using the Trends graphic library
The Trends graphic library contains a realtime trend and objects for
controlling the trend. You can use the trend and objects as they are,
or you can edit them to suit your needs. To use the objects, drag and
drop them into your graphic display and then type a folder name in
the trend’s Control Tag field. 7
To use the Trends graphic library:
1. In the Project Manager, open the Graphics folder.
2. Open the Graphics Library folder.
The graphic library files are displayed in the right pane of the
Project Manager.
3. Double-click Trends.
4. Drag and drop one or more trend objects into your display.
Setting the name of the Control Tag folder
You can use the Control Tag folder name (“trend”) that has already
been configured for the trend objects in the Trends graphic library,
or you can change the name of the folder and then apply the new
name to all objects associated with this trend.
To change the trend’s Control Tag folder name and replace the old folder name:
1. Open the Trend dialog box by doing one of the following:
double-click the trend
select the trend, place the cursor over it, right-click to display
the context menu, and then click Edit Trend
select the trend, open the Edit menu on the menu bar, and then
click Edit Trend
2. In the Control Tag field, type a new name.
1
1
13-35 1
Configuring trends
3. Click OK.
The Control Tag folder is created in the tag database. It contains
the control tags for the trend. You now have to replace the old
folder name with the new name for the buttons and touch control
objects that the operator uses to control the trend at runtime.
4. Select all the remaining objects.
5. On the Edit menu, click Tag Substitution.
6. In the Search for field, specify the old Control Tag folder name. In
the Replace with field, specify the new folder name.
7. Click Replace.
If the Confirm Replacements check box is not selected, all
occurrences of the old folder name are automatically replaced with
the new name. If the Confirm Replacements check box is selected,
the name that is about to be replaced is displayed along with its
usage.
1
1
1
13-36
Configuring trends
Choosing fonts, colors, and lines
The following table summarizes where to choose fonts, colors, and
lines for a trend. Before doing any of the actions described below,
select the trend.
To choose
Do this
Background fill color
Choose a color from the Fill Color palette or from the
Attributes menu.
Background fill pattern
Choose a pattern from the Fill Style toolbar or from
the Attributes menu.
Choose Hollow to create a transparent trend.
Grid line color
Choose a color from the Line Color palette or from
the Attributes menu.
Grid line width
Choose Line Properties from the Attributes menu
and then specify a line width.
Pen line color
In the Trend dialog box, choose the Pen Configuration
tab, and then choose a color in the Color field. You
must configure each pen separately. This color is
also used for the vertical axis labels and for the pen
values in the legend.
Pen line width
Choose Line Properties from the Attributes menu
and then specify a width. If you use this method the
width applies to all the pens in the trend.
Or, in the Trend dialog box, choose the Pen
Configuration tab and then choose a width in the
Custom Pen Width field. If you use this method, you
must configure each pen separately.
If you do not specify a pen width, the pen lines default
to the width selected for the grid lines.
Pen line symbol
In the Trend dialog box, choose the Pen Configuration
tab and then choose a symbol in the Show Plot
Symbol field. You must configure each pen
separately.
1
1
13-37 1
Configuring trends
To choose
Do this
Marker color
Choose Font from the Attributes menu and then
choose a color. For information about the marker see
page 13-39.
The marker color is also used for time axis labels (if
used) and for the time and date in the legend.
Text font family, size, and color
Choose Font from the Attributes menu and then
choose a font, size, and color. The font and size are
used for all the text used for axis labels and all the
text in the legend.
The font color is used for time axis labels (if used),
for the time and date in the legend, and for the
marker color.
Using the trend at runtime
Selecting pens
To display details about a pen, select the pen by clicking it in the
legend. When the pen is selected, the vertical scale changes to reflect
the minimum and maximum values for that pen.
When you click
this pen . . .
1
1
1
13-38
. . . the scale shows
the minimum and
maximum range for
this pen.
Configuring trends
Selecting points
To view details about a specific point in the trend, use the marker.
When the marker is over a point in the data, the pen’s date, time, and
value at the marker’s location are displayed in the legend.
0DUNHU
The marker is not over a
point in the data, so “No
Value” appears in the
legend. When the data
reaches the marker, the
date, time, and value of
the data at that point is
displayed in the legend.
By default, the marker is at the right-most edge of the trend (and
might not be visible). To move the marker, position the cursor on the
trend and then click. The marker moves to the point you clicked. To
hide the marker, click the vertical axis.
Changing the marker’s color
By default, the marker is black (which means it is not visible on a
trend with a black background). The marker uses the same color as
the text for the time axis labels (if used) and for the time and date in
the legend, so changing the marker color also changes this text color.
To change the marker color:
1. Select the trend.
2. Right-click, point to Attributes, and then click Font.
3. In the Font dialog box, select a new color.
1
1
13-39 1
Configuring trends
Editing a trend
You can edit the physical characteristics of the trend object as well as
the trend configuration.
Editing the trend object
You can edit a trend object as you would any other graphic object.
You can move it, resize it, attach animation to it, and so on.
For detailed information about working with graphic objects, see
Chapter 11, Creating graphic displays.
Editing the trend configuration
1. Open the Trend dialog box by doing one of the following:
double-click the trend
select the trend, place the cursor over it, right-click to display
the context menu, and then click Edit Trend
select the trend object, click Edit on the menu bar, and then
click Edit Trend
2. Edit the information in any of the fields.
For detailed information about the fields, see “Trend
configuration” on page 13-7 and “Pen configuration” on
page 13-18.
3. Click OK.
1
1
1
13-40
14
Creating expressions
This chapter includes:
instructions for creating expressions
description of the components used for building expressions
About expressions
Sometimes the data you gather from devices is only meaningful
when you:
compare it to other values
combine it with other values
create a cause-effect relationship with other values
Expressions allow you to create mathematical or logical
combinations of data that return more meaningful values.
1
1
14-1 1
Creating expressions
Expression components
Expressions can be built from:
tag values
constants
mathematical, relational, logical, and bitwise operators
built-in functions
if-then-else logic
Where you can use expressions
Expressions can be used in the following editors:
Graphic Display: You can define an expression to control various
aspects of a graphic object’s appearance. You can also display the
value of an expression in numeric and string display objects.
Derived Tags: You can define an expression and specify the name
of a tag that will store the result of the expression.
Events: You can define an expression and associate it with an
action. When the expression changes from false to true (from zero
to any non-zero value), the action (a command or macro) runs.
Activity Log Setup: When configuring file management, you can
choose to have a log file created when a particular event occurs.
One way of doing this is to create an expression.
Data Log Setup: When configuring file management, you can
choose to have a log file created when a particular event occurs.
One way of doing this is to create an expression.
Alarm Setup: When configuring file management, you can choose
to have a log file created when a particular event occurs. One way
of doing this is to create an expression.
Using expressions in a command
You can also use expressions in a command to set the value of a tag.
For details, see “Using the Equal (=) command” on page 14-6.
1
1
1
14-2
Creating expressions
Creating expressions
All editors that use expressions include an Expression field. In some
editors, you will also find:
expression buttons
an expression column
The following illustration shows the items for creating an expression
in the Events editor.
Expression field
Expression
buttons
Expression column
Expression buttons
These are the expression buttons:
This button
Displays a list of
This button
Displays a list of
If-then-else operators
Bitwise operators
Logical operators
Built-in functions
Relational operators
Tags in the tag database
Arithmetic operators
1
1
14-3 1
Creating expressions
Cutting, copying, and pasting expressions
You can cut, copy, or paste an expression or parts of an expression.
The method for performing these actions depends on whether the
expression is in a window or in a dialog box.
When you are working in a window, you can use the commands on
the Edit menu, the toolbar, or the keyboard. When you are working
in a dialog box, you can use only the keyboard because you cannot
access the menu bar or toolbar.
When you cut or copy an expression, a copy of it is placed on the
clipboard. Once it is on the clipboard, you can paste it into any other
Expression field or Expression column. You can also paste it into a
command line.
To cut or copy expressions in a window:
1. Select the expression in the form or in the spreadsheet.
2. Do one of the following:
Cut
Copy
click Cut or Copy on the Edit menu
click the Cut or Copy button on the toolbar
press Ctrl-X or Ctrl-C
To paste expressions in a window:
1. Click where you want to paste the expression.
You can paste into the Expression field in the form or into the
Expression column in the spreadsheet.
2. Do one of the following:
Paste
click Paste on the Edit menu
click the Paste button on the toolbar
press Ctrl-V
1
1
1
14-4
Creating expressions
To cut or copy expressions in a dialog box:
1. Select the expression in the Expression field.
2. Press Ctrl-X or Ctrl-C.
To paste expressions in a dialog box:
1. Click in the Expression field where you want to paste the
expression.
2. Press Ctrl-V.
Formatting expressions
You can format expressions so they are easier to read. However, do
not let tag names, key words, function names, or function arguments
span more than one line.
When formatting expressions, you can use tabs, line returns, and
multiple spaces.
When you’re working in the Animation dialog box in the Graphic
Display editor, type Ctrl-Tab to insert a tab in the expression.
Example: Formatting an expression
To format this if-then-else statement, you can align the “else” with
the appropriate “if” so the logic is easy to understand:
If (tag1 > tag2) Then 0
Else If (tag1 > tag3) Then 2
Else 4
Or you can condense it to the following:
If (tag1 > tag2) Then 0 Else If (tag1 > tag3) Then 2 Else 4
1
1
14-5 1
Creating expressions
Using the = (Equal) command
You can type an expression as a command using the following
syntax: 3.
[&] <tag_name> = <expression> where:
[&]
Forces the command to be executed asynchronously,
which makes the command faster.
<tag_name>
The name of an analog, digital, or string tag that will
store the result of the expression.
<expression>
A value or string, a tag name, or a more complex
expression.
Enclose tag names that contain dashes or start with a
number in braces { } when you use them in an
expression. This distinguishes the characters in the
tag name from the characters in the expression. Also
use braces when using wildcards (* or ?) to represent
multiple tags in an expression.
Enclose strings in quotes. The string can contain any
character, and can include spaces.
Do not use braces for the tag name before the equal
sign.
You cannot nest braces.
1
1
1
14-6
Creating expressions
Examples: The = (Equal) command
Tag1 = Tag1 + 1
Increases the value of tag1 by 1.
Tag1 = Tag2
Sets the value of Tag1 to be the same as Tag2.
Tag1 = if (Tag2 < Tag1) then 4 else 3
Performs the if-then-else calculation and stores the result in Tag1.
1Pump = {Industry-2} + {2Pump}
Adds the values of Industry-2 and 2Pump and stores the result in
1Pump.
Braces surround Industry-2 because of the dash in the name. Braces
surround 2Pump because the name starts with a number. No braces
are used for 1Pump because this name is on the left side of the equal
sign.
Tank1\Message = “Tank1 Overflow”
Sets the tag Tank1\Message to Tank1 Overflow.
1
1
14-7 1
Creating expressions
Using tag names and tag placeholders
A tag name can be included as part of an expression or can stand
alone as the entire expression.
To supply a tag name, do one of the following:
type a tag name
You can type a tag name that does not exist in the tag database.
When you click OK, a dialog box appears prompting you to
create the tag.
click the Tags button and select a tag from the Tags list
Enclose tag names that contain dashes or start with a number in
braces { } when you use them in an expression. This distinguishes the
characters in the tag name from the characters in the expression. Also
use braces when using wildcards (* or ?) to represent multiple tags in
an expression.
This character
Does this
?
Matches any single character.
*
Matches any number of characters, including the backslash (\)
character.
Use this wildcard by itself to display all the tags in the tag
database.
For detailed information about tags, see Chapter 4, Creating tags.
Using tag placeholders instead of tag names
The Graphic Display editor accepts tag placeholders instead of tag
names. Placeholders allow you to use the same display with a variety
of tags.
You can use tag placeholders in the same way you use tag names. A
tag placeholder is the cross-hatch character (#) followed by a number
from 1 to 500. For detailed information about placeholders, see
Chapter 11, Creating graphic displays.
1
1
1
14-8
Creating expressions
Constants
A constant can have any of the following formats:
integer (123)
floating point (123.45)
scientific notation (1.2345E2)
string constant (“character string”)
the symbol “pi”. RSView32 replaces the symbol with its numeric
value.
Arithmetic operators
Arithmetic operators calculate values based on two or more numeric
values. The arithmetic operators are:
Symbol
Operator
Example
(For these examples, tag1 = 5 and tag2 = 7)
+
addition
tag1 + tag2
returns a value of 12
-
subtraction
tag1 - tag2
returns a value of -2
*
multiplication
tag1 * tag2
returns a value of 35
/
division
tag1 / tag2
returns a value of 0.7142857
MOD, %
modulus (remainder)
tag2 MOD tag1
returns a value of 2
The modulus operator is the remainder of one
number divided by another. For example, the
remainder of 13 divided by 5 is 3; so 13 % 5 = 3.
Important: This operator is for integers only, not
floating point numbers.
**
exponent
tag1 ** tag2
returns a value of 78125
IMPORTANT Be sure that any tag value you use as a divisor cannot at some point have
a value of zero. Expressions that attempt to divide a number by zero
produce an error at runtime.
1
1
14-9 1
Creating expressions
String operands
The + operator can be used to join string operands. For example, the
expression “hello” + “world” returns: helloworld.
Relational operators
Relational operators compare two numeric or string values to
provide a true or false result. If the statement is true, a value of 1 is
returned. If false, 0 is returned.
The relational operators are:
Symbol
Operator
Numeric Examples4
String ExamplesQ
4 For the numeric examples, tag1 = 5 and tag2 = 7
Q For the string examples, serial_no = ST009
EQ, ==
equal
tag1 == tag2
false
serial_no == “ST011”
false
NE, <>
not equal
tag1 <> tag2
true
serial_no <> “ST011”
true
LT, <
less than
tag1 < tag2
true
serial_no < “ST011”
true
GT, >
greater than
tag1 > tag2
false
serial_no > “ST011”
false
LE, <=
less than or equal to
tag1 <= tag2
true
serial_no <= “ST011”
true
GE, >=
greater than or equal
to
tag1 >= tag2
false
serial_no >= “ST011”
false
How string operands are evaluated
String operands are evaluated by case and by alphabetical order.
Upper case letters are greater than lower case letters. For example, H
is greater than h. Letters later in the alphabet are greater than those
earlier in the alphabet. For example, B is greater than A.
1
1
1
14-10
Creating expressions
Logical operators
Logical operators determine the validity of one or more statements.
There are three logical operators: AND, OR, and NOT. The
operators return a non-zero value if the expression is true, or a zero
if the expression is false.
The logical operators are:
Symbols
Operator
Action
Example
(For these examples, tag1 = 5 and tag2 = 7)
AND, &&
and
Returns a 1 if the
statements to the
right and to the left of
the operator are both
true.
(tag1 < tag 2) AND (tag1 == 5)
both statements are true; returns a 1
OR, ||
or
Returns a 1 if either
the statement to the
left or to the right of
the operator is true.
(tag1 > tag2) OR (tag1 == 5)
tag1 == 5 is true; returns a 1
NOT
negation
Reverses the logical
value of the statement
it operates on.
NOT(tag1 < tag2)
although tag1 < tag2 is true, NOT
reverses the logical value; returns a 0
IMPORTANT The parentheses are essential in the above expressions. See “Evaluation
order of operators” on page 14-20.
1
1
14-11 1
Creating expressions
Bitwise operators
Bitwise operators examine and manipulate individual bits within a
value.
IMPORTANT These operators are for integers only, not floating point numbers.
Symbol
Operator
Action
&
AND
Compares two integers or integer tags on a bit-by-bit basis.
Returns an integer with a bit set to 1 if both the corresponding
bits in the original numbers are 1. Otherwise, the resulting bit
is 0.
|
inclusive OR
Compares two integers or tags on a bit-by-bit basis.
Returns an integer with a bit set to 1 if either or both of the
corresponding bits in the original numbers are 1. If both bits
are 0, the resulting bit is 0.
^
>>
exclusive OR
(XOR)
Compares two integers or tags on a bit-by-bit basis.
right shift
Shifts the bits within an integer or tag to the right.
Returns an integer with a bit set to 1 if the corresponding bits
in the original numbers differ. If both bits are 1 or both are 0,
the resulting bit is 0.
Shifts the bits within the left operand by the amount specified
in the right operand. The bit on the right disappears.
Either a 0 or a 1 is shifted in on the left, depending on whether
the left-most bit is a 0 or a 1. If the left-most bit is 0, a 0 is
shifted in. If the left-most bit is 1, a 1 is shifted in. In other
words, the sign of the number is preserved.
<<
left shift
Shifts the bits within an integer or tag to the left.
Shifts the bits within the left operand by the amount specified
in the right operand. The bit on the left disappears and 0
always shifts in on the right.
~
complement
Returns one’s complement; that is, it toggles the bits within an
integer or tag.
Reverses every bit within the number so every 1 bit becomes a
0 and vice versa.
1
1
1
14-12
Creating expressions
Example: Bitwise operators
For these examples tag1 = 5 (binary 0000 0000 0000 0101),
tag2 = 2 (binary 0000 0000 0000 0010)
tag1 & tag2
Returns 0 (binary 0000 0000 0000 0000).
tag1 | tag2
Returns 7 (binary 0000 0000 0000 0111).
tag1 ^ tag2
Returns 7 (binary 0000 0000 0000 0111).
tag1 >> 1
Returns 2 (binary 0000 0000 0000 0010).
tag1 << 1
Returns 10 (binary 0000 0000 0000 1010).
~ tag1
Returns -6 (binary 1111 1111 1111 1010).
1
1
14-13 1
Creating expressions
Built-in functions
The types of built-in functions are:
tag
time
file
math
Many functions check for specific true and false conditions. They
return 1 if the condition is true, and 0 if the condition is false.
Tag functions
The following built-in functions examine the status of a tag (tag) or
multiple tags (tag*).
1
1
1
14-14
This function
Returns
ALM_IN_ALARM(tag)
or
ALM_IN_ALARM(tag*)
1 (true) if the tag or alarm event is in alarm.
ALM_ACK(tag)
or
ALM_ACK(tag*)
1 (true) if the tag or alarm event’s alarm has been
acknowledged.
ALM_ALLACKED(tag)
or
ALM_ALLACKED(tag*)
1 (true) if the tag’s alarm has been acknowledged.
ALM_SEVERITY(tag)
or
ALM_SEVERITY(tag*)
The severity of the alarm—a value between 1 and 8, or 0 if
the tag or alarm event is not in alarm.
ALM_LEVEL(tag)
or
ALM_LEVEL(tag*)
The alarm level or threshold for an analog tag: a value
between 1 and 8, or 0 if the tag is not in alarm.
If examining multiple tags, 1 (true) if one or more of the tags
or alarm events are in alarm.
If examining multiple tags or alarm events, 1 (true) if one or
more of the tags’ or alarm events’ alarms have been
acknowledged.
If examining multiple tags, 1 (true) if all of the tags’ alarms
have been acknowledged.
If examining multiple tags or alarm events, the highest
severity of the tags or alarm events that are in alarm. For
example, if the current alarms have severities of 1, 3, and 6,
this function returns the value 1.
If examining multiple tags, the highest level of the tags that
are in alarm. For example, if the current alarms are levels 2,
6, and 8, this function returns the value 8.
Creating expressions
This function
Returns
ALM_SUPPRESS(tag)
or
ALM_SUPPRESS(tag*)
1 (true) if the tag’s alarms are suppressed.
ALM_FAULT(tag)
or
ALM_FAULT(tag*)
1 (true) if there has been an alarm fault for the specified tag.
COMM_ERR(tag)
1 (true) if the last read or write operation for the specified
tag indicated a communication failure.
If examining multiple tags, 1 (true) if one or more of the tags’
alarms are suppressed.
If examining multiple tags, 1 (true) if there has been an alarm
fault for one or more of the tags.
Note that you can examine the status of only one tag with this
function.
To examine multiple tags at once, use a wildcard in the expression
argument.
This wildcard
Does this
*
Matches any number of characters, including the backslash (\)
character.
?
Matches any single character.
Example: Tag functions
ALM_IN_ALARM(vessel3\TIC3\pv*)
Returns 1 (true) if one or more tags in the specified folder have a
name beginning with the letters “pv” and are in alarm. Returns 0
(false) if none of the specified tags are in alarm.
1
1
14-15 1
Creating expressions
Time functions
The following built-in functions examine system time. These
functions use the time or interval parameters.
These are the functions:
This function
Returns
TIME(“time”)
1 (true) if the time specified is the current time.
BEFORE_TIME(“time”)
1 (true) if the expression is evaluated before the specified
time.
AFTER_TIME(“time”)
1 (true) if the expression is evaluated after the specified
time.
INTERVAL(“interval”)
1 (true) if the specified time interval has elapsed—the
interval timer starts running when an event file starts
running.
IMPORTANT The time and interval parameters must be enclosed in quotes.
The time functions are described on the following pages.
The time parameter can include the following options:
day of week
[Sun, Mon, Tue, Wed, Thu, Fri, or Sat]
month
[Jan, Feb, Mar, Apr, May, Jun, Jul, Aug, Sep, Oct,
Nov, or Dec]
date
[1-31]
year
[1997-2100]
hour of day
[00:-23:]
minute
[:00-:59]
seconds
[:00-:59]
It does not matter in what order options are listed. You can include
any or all of these options; the more you include, the more specific
the time becomes.
1
1
1
14-16
Creating expressions
Example: Specific time parameters
The following all represent the same date and time, and are valid time
parameters:
“mon aug 18 1997 17:00”
“mon aug 18 1997 17: :00”
“:00 aug 18 mon 1997 17:”
IMPORTANT The validity of the date is not checked. In the above example if
Aug 18 1997 is not a Monday, this error is not detected.
Example: Less specific time parameters
Following are valid examples of time parameters:
“17:00”
Means any day at 5:00 pm.
“ :30 ”
Means any hour, on the half hour.
“ mon 17:”
Means 5:00 pm each Monday.
1
1
14-17 1
Creating expressions
The interval parameter has this format:
<number> <units>
where <units> is one of:
mil (millisecond)
sec (second)
min (minute)
hou (hour)
day (day)
wee (week)
mon (month)
yea (year)
Examples: Time and interval functions
TIME(“sun aug 18 1997 14:30”)
Returns 1 (true) if it is exactly 2:30 pm and 0 seconds, on Sunday,
Aug 18, 1997; otherwise returns 0 (false).
_____________________________
AFTER_TIME(“sun aug 18 1997 14:30”)
Returns 1 the first time the expression is evaluated after 2:30 pm on
Sunday Aug 18, 1997.
_____________________________
BEFORE_TIME(“aug 18 1997”)
Returns 1 (true) the first time the expression is evaluated before
Aug 18, 1997.
_____________________________
1
1
1
14-18
Creating expressions
INTERVAL(“1 min”)
Returns 1 (true) if a minute has elapsed since the expression last
returned a 1.
_____________________________
(tag1 > 500) and INTERVAL (“30 sec”)
Returns 1 (true) when tag1 > 500 on some 30-second interval since
the event file started running. (It does not mean 30 seconds after
tag1 > 500.)
File functions
The following built-in functions check if a file exists and check the
amount of free disk space.
The file parameter is the DOS path name, surrounded by quotes.
The drive parameter is the drive letter.
These are the functions:
This function
Returns this value
Example
FILE_EXISTS(“file”)
1 (true) if the
specified file exists.
FILE_EXISTS
“C:\Proj1\Dlglog\Aug\970412bf.dbf”
returns 1 (true) if the file exists or 0
(false) if the file does not exist.
Use this function to set a tag when a
specified file has been created or
deleted.
FREE_BYTES(drive)
The number of bytes
free on the specified
drive.
FREE_BYTES(c)
returns the number of bytes available
on drive C, up to a maximum of 2.1 GB.
Use this function to display a message
or trigger an alarm when disk space is
getting low.
If you want an expression containing these functions to be evaluated
more than once, assign the expression to an event rather than to an
object in a graphic display.
1
1
14-19 1
Creating expressions
Math functions
These functions perform math on an expression:
This function
Returns this value
SQRT (expression)
The square root of the expression
LOG (expression)
The natural log of the expression
LOG10 (expression)
The base ten log of the expression
SIN (expression)
The sine of the expression in radians
COS (expression)
The cosine of the expression in radians
TAN (expression)
The tangent of the expression in radians
ARCSIN (expression)
The arc sine of the expression in radians
ARCCOS (expression)
The arc cosine of the expression in radians
ARCTAN (expression)
The arc tangent of the expression in radians
SIND (expression)
The sine of the expression in degrees
COSD (expression)
The cosine of the expression in degrees
TAND (expression)
The tangent of the expression in degrees
ARCSIND (expression)
The arc sine of the expression in degrees
ARCCOSD (expression)
The arc cosine of the expression in degrees
ARCTAND (expression)
The arc tangent of the expression in degrees
Evaluation order of operators
Expressions with more than one operator are evaluated as follows: 4.
Operators in parentheses are evaluated first.
Therefore, to change the order of precedence, use parentheses.
The operator with the highest precedence is evaluated next.
When two operators have equal precedence, they are evaluated
from left to right.
1
1
1
14-20
Creating expressions
Operators are evaluated in the following order:
Evaluation order
Symbols
1 (highest)
()
2
NOT
a
3
*
/
MOD, %
**
AND, &&
&
>>
<<
4
+
OR, ||
|
^
5 (lowest)
EQ, =
NE, <>
LT, <
GT, >
LE, <=
GE, >=
Example: Evaluation order
For these examples, tag1 = 5, tag2 = 7, and tag3 =10.
_____________________________
(tag1 > tag2) AND (tag1 < tag3)
is evaluated in this sequence:
1. tag1 > tag2 = 0
2. tag 1 < tag3 = 1
3. 0 AND 1 = 0
The expression evaluates to 0 (false).
1
1
14-21 1
Creating expressions
_____________________________
tag1>tag2 AND tag3
is evaluated in this sequence:
1. tag2 AND tag3 = 1
2. tag1 > 1 = 1
The expression evaluates to 1 (true).
_____________________________
NOT tag1 AND tag2 > tag3 ** 2
is evaluated in this sequence:
1. NOT tag1 = 0
2. 0 AND tag2 = 0
3. tag3 ** 2 = 100
4. 0 > 100 = 0
The expression evaluates to 0 (false).
1
1
1
14-22
Creating expressions
If-then-else
If-then-else expressions carry out an action conditionally or branch
actions depending on the statements in the expression. The
if-then-else statements enable the expression to perform different
actions in different situations and to repeat activities until a
condition changes.
To build conditional expressions, use the relational operators and the
logical operators.
The if-then-else structure is:
if statement then value1 else value2
If the statement is true then the expression returns value1; if the
statement is false then the expression returns value2. Keep in mind
that the statement is a mathematical equation and true means a
non-zero value, and false means zero.
The if-then-else structure is illustrated below.
enter
statement
true
false
value2
value1
exit
1
1
14-23 1
Creating expressions
Nested if-then-else structure
It is common to nest an if-then-else structure inside the ‘then’ or
‘else’ part of an if-then-else structure.
Example 1: Nested if-then-else
This expression:
if (statement1) then (value1)
else if (statement2) then (value2)
else (value3)
has this interpretation:
enter
statement1
true
false
statement2
true
value1
false
value3
exit
1
1
1
14-24
value2
Creating expressions
Example 2: Nested if-then-else
This expression:
if (statement1) then
if (statement2) then (value1)
else (value2)
else (value3)
has this interpretation:
enter
statement1
false
value3
true
statement2
true
value1
false
value2
exit
1
1
14-25 1
15
Setting up navigation
An important part of the complete operator interface is the way
operators navigate through and interact with your project.
RSView32 gives you the tools for linking displays and creating an
overall project structure that is easy for operators to use.
This chapter provides:
examples and ideas for creating a hierarchy of displays
examples of how users can move among displays
procedures for linking displays
Developing a hierarchy of displays
A display hierarchy is a series of displays that provide progressively
more detail as users move through them. A hierarchy should meet
the needs of the various users, including managers, supervisors, and
operators.
A hierarchy could include:
an initial graphic display that serves as a menu
an overview of the plant
a comprehensive display of each process being monitored
process-specific displays
1
1
15-1 1
Setting up navigation
management summary displays
trend displays of historical and realtime data
The following illustration shows a display hierarchy.
Main Menu
Graphic Display
Process-Wide
Alarm
Summary
System
Status
Process
Overview
Management
Summary
Process
Monitoring 1
Process
Monitoring 2
Process
Monitoring 3
Area 1
Trend Display
Area 2
Trend Display
Area 3
Trend Display
Link to Historical
Trend Display
Methods for moving among displays
To set up displays so operators can easily move among them, you
can:
create a keyboard-based project
create a mouse- or touch screen-based project
You can use one or both of these methods in your project. Although
the methods look different to the operator, they work similarly. That
is, they all initiate RSView32 commands.
1
1
1
15-2
Setting up navigation
Commands for moving among displays
To open, close, and switch between displays, use these commands:5.
RSView32 Command
Function
Display
Opens the specified graphic display.
If a display is already open and the display allows multiple
running copies (specified in the Display Settings dialog box in
the Graphic Display editor), this command will open another
display and make it active. If the display is already open but
does not allow multiple running copies, this command simply
makes the display active.
If a display of type Replace overlaps any other display(s) when
it opens, the display(s) it overlaps will be closed.
Displays of type Overlay open on top of any other open displays
without closing them.
Displays of type On Top will remain on top of any other open
graphic displays.
Abort
Use this command only for displays of type Overlay or On Top.
The Abort command closes the active display or a specified
display.
PullForward
Pulls forward the specified display. If the specified graphic
display is of the Replace or Overlay type, PullForward gives the
specified display focus and positions it behind any On Top
display that is open.
PushBack
Pushes the specified display behind other displays. If the
specified graphic display is of the On Top type, PushBack
positions the display behind any other open On Top displays,
and in front of any open displays of the Replace or Overlay type.
The PullForward and PushBack commands provide quick display
changes because displays are already up and running. However, be
aware that the more displays that are open, the more memory is
used.
The display type you choose gives you additional control over how
the operator navigates between displays. For example, use the On
Top option to keep a display on top at all times, even when another
display has focus. Or use the Replace option if you want a display to
replace all other open displays when it opens. For details about
assigning display type see “Specifying the display type” on
page 11-13.
1
1
15-3 1
Setting up navigation
Reducing display call-up time
You can reduce the time required to display a graphic by loading the
graphic into the display cache. You can:
load the graphic before it is displayed by using the Display
command with the /Z or /ZA parameter. For details, see
Appendix A, RSView32 commands, or see online help.
load the graphic when it is displayed for the first time by using the
Cache After Displaying option in the Display Settings dialog box
of the Graphic Display editor. For details, see “Specifying
caching” on page 11-15.
Where to use RSView32 commands
Commands can be used in the following places:
a field that requires you to enter an action
a macro
a command line
Many RSView32 commands accept parameters. For a complete list
and description of commands, see Appendix A, RSView32
commands, or see Help.
1
1
1
15-4
Setting up navigation
Example of navigation methods
Following are examples of various navigation methods:
Example: Keyboard operation
The following graphic display has been designed to act as a menu,
listing keys users can press to open different displays.
To create this display, the designer assigned various RSView32
commands to keys using the three types of key definitions: object,
display, and global. In all cases, keys (not mouse buttons) were
defined to run commands.
Object key and display key animation are configured in the Graphic
Display editor. For details, see Chapter 12, Animating graphic
objects. Global keys are created in the Global Keys editor. For
details, see “Creating global keys” on page 15-19.
1
1
15-5 1
Setting up navigation
Example: Mouse/touch screen operation
The following graphic display contains buttons that users can click
with the mouse or press on a touch screen to call up detail displays.
This display presents information and acts as a menu.
The Line 1, Line 2,
and Line 3 buttons
have touch
animation attached
to them.
To create the buttons, the designer used the Button drawing tool in
the Graphic Display editor. The buttons can be selected with a
mouse or with a touch screen. For details about how to create
buttons, see “Creating buttons” on page 11-55.
1
1
1
15-6
Setting up navigation
The tools
To build a complete operator interface, use:
macros to replace a set of commands with a single command
symbols to replace long commands or commands with parameters
key definitions to assign commands, symbols, macros, or a series
of replacement keystrokes to keys or mouse buttons
Precedence
At runtime, components are evaluated in the following order:
symbols, commands, macros
object keys, display keys, global keys
For details about the order of precedence among object, display, and
global keys, see page 15-14.
Creating macros
A macro is a series of commands stored in a macro file. The name of
the macro file is then used like a command and can be used anywhere
a command can be used. When the file name is entered, the macro
runs, executing all the commands in the file.
You can create macros to perform almost any action. For example, a
macro can: CD
open a group of windows and define their initial positions
define temporary key definitions
close any open windows
set tag values
Instead of using macros to set tag values, you can also set tag values
using the tag collections in the RSView32 Object Model’s
WritePendingValues method. For more information about using the
RSView32 Object Model, see Help.
1
1
15-7 1
Setting up navigation
To create a macro:
1. In the Project Manager, open the Logic and Control folder.
2. Open the Macro editor by doing one of the following:
double-click the Macro icon
right-click the Macro icon and then click New
3. Type your macro commands and, if required, add command
parameters.
When entering commands, follow these guidelines:
Separate each identifier, specification, or string with a space or a
tab.
Start each command on a new line, or separate commands on
the same line with a semicolon (;).
Precede comments with an exclamation mark (!). The comment
lasts until the next semicolon (;) or line break.
To replace a tag name with its current value when the command
is evaluated, enclose the tag name in dollar signs ($) to create a
placeholder in the command.
To indicate a percent in a macro, use two percent signs (%%)
because a single percent sign indicates a parameter.
For information about parameters, see “Using parameters” on
page 15-10. For more information about command syntax, see
“How to use commands” on page A-2.
For assistance while typing macro commands, double-click
anywhere in the Macro editor to open the Command Wizard. For
more information about using the Command Wizard, see
page A-5.
4. On the File menu, click Save As.
5. Type a file name. Remember, the file name is the macro name so
ensure the name does not conflict with symbols or commands. If
names conflict, only the symbol or command will run.
1
1
1
15-8
Setting up navigation
At runtime, operators can type the macro name anywhere they can
type an RSView32 command. For example, if you include a
command line in your project, operators can run a macro by typing
its name on the command line.
Example: A macro called factory
Display Overview
Display Detail
Valve23 = Open
When the macro called Factory runs, the graphic display Overview
appears, then the graphic display Detail appears, then the tag Valve23
is set to its open state.
Example: A macro using placeholders in commands
Display Screen$Tag1$
Display $Tag3$$Tag2$
Valve23 = Open
Tag1 = 1, Tag2 = 2, and Tag3 = Screen. Note that these are all string
tags. When the macro runs, RSView32 replaces the placeholders in
the commands with the tags’ current string values. The graphic
display Screen1 appears, then the graphic display Screen2 appears,
then the tag Valve23 is set to its open state.
Note that you don’t need to put braces around tag names when
using placeholders in commands.
1
1
15-9 1
Setting up navigation
Using parameters
Macros can accept parameters. To specify a parameter in a macro,
type a percent (%) sign followed by a number. Up to nine
parameters are allowed. CE
To run the macro and parameters, specify the macro name followed
by the parameters. Separate multiple parameters with spaces.
For example, here is the same Factory macro with two parameters:
Example: Factory macro with two parameters
Display Overview
Display %1
valve23 = %2
To run the macro, type Factory Detail Open
The macro performs the same actions as in the original Factory
example because it substitutes “detail” wherever %1 appears in the
macro and substitutes “open” wherever %2 appears in the macro.
1
1
1
15-10
Setting up navigation
Nesting macros
You can insert a macro within another macro—this is called nesting.
You can have eight nesting levels in macros.
For example, a macro called Draw contains:
Display Overview
Display Detail
and a macro called Factory contains:
Draw
Valve23 = Open
Typing Factory performs the same actions as the original Factory
macro in the previous example.
Creating a macro that starts when a project starts
If you have created a project with components that must start in a
particular order, create a startup macro. You can then configure the
Startup editor to run this macro when your project starts.
For more information about the Startup editor, see Chapter 18,
Running your project.
1
1
15-11 1
Setting up navigation
Creating symbols
If you have long commands or commands with parameters that are
hard to remember or easy to mix up, you can rename those
commands with a single word called a symbol.
Symbols can be used anywhere a command can be used: in a field
that requires an action, in a macro, or on the command line.
You can define symbols in a macro or on the command line.
However, symbols are mainly an operational convenience when
using the system from the command line.
To define a symbol:
On the command line or in a macro, type:
Define <symbol> <string>
<symbol>
the abbreviated command, without spaces
<string>
an existing command with or without parameters.
It can contain spaces and other symbols.
Example: The Define command
Define
Show
Display Overview
The Define command
The symbol
The string
In this example, the command Display Overview is replaced with the
word Show.
1
1
1
15-12
Setting up navigation
Important guidelines
When creating symbols, keep the following in mind:
RSView32 does not check for security access on symbol names.
Therefore, be sure to put security on the underlying RSView32
command. For more information, see Chapter 10, Adding security.
A symbol and a macro should not have the same name. If they do,
the symbol runs instead of the macro.
The order of precedence is: symbol, command, macro.
To clear a symbol:
On the command line or in a macro, type one of the following:
This command
Does this
Undefine <symbol>
clears the symbol
where <symbol> is the name of the symbol you want
to delete
Undefine *
clears all defined symbols
Example: Undefining symbols
Undefine Show
Clears the symbol Show.
1
1
15-13 1
Setting up navigation
Key definitions
You can associate RSView32 commands with objects in a display
and/or with the entire display using object key animation, display
key animation, and touch animation. You can also associate
commands with keys that will be active at all times throughout the
system by creating global keys. At runtime, operators use these keys
to interact with the system, for example to change displays or set tag
values.
When deciding what type of key to create, use the following table as
a guide:
To
Do this
For details, see
Associate a key with a specific
graphic object (object key)
Attach object key animation in
the Graphic Display editor
Page 12-40
Associate a key with a specific
graphic display (display key)
Attach display key animation in
the Graphic Display editor
Page 12-52
Create a key that works
everywhere (global key)
Create a key definition file in the
Global Keys editor
Page 15-19
General rules about precedence
You can assign a single key to one or more of the three types of key
definitions—object, display, or global. For example, the F2 key can
open a valve when the valve object has input focus, or it can close a
popup display that has focus, or the F2 key can be a global key that
opens a graphic display containing an overview of your process.
When a graphic display is active and an object has input focus, object
keys have precedence over display keys and global keys.
When a graphic display is active, display keys have precedence over
global keys. This means that if you assigned the F2 key as a display
key in some graphic displays in your project, and you assigned F2 as
a global key in the same project, F2 will only work as a global key if
the current display does not have F2 assigned as a display key as
well.
1
1
1
15-14
Setting up navigation
When you design your system, pay particular attention to the keys
used by embedded objects. Object keys and display keys have
precedence over keys used by embedded objects (for example,
ActiveX, or OLE objects), except for OLE objects that are not part
of RSView32 (for example, an Excel worksheet), whose keys have
precedence over object or display keys. For details, see the pages that
follow.
Precedence and the F1 key
When you are editing an RSView32 project, the F1 key always
launches context-sensitive Help.
At runtime, if a runtime editor has focus, F1 launches
context-sensitive Help for that editor. If a graphic display has focus,
and a press, release, or repeat action has been defined for the F1 key,
F1 acts as a display, object, or global key instead of launching Help.
Precedence and embedded ActiveX objects
When a graphic display is active and an embedded ActiveX object
has input focus, a key that triggers an action in the embedded object
will not trigger that action if the key has been defined as an object or
display key as well. When you press the key, the action of the
embedded ActiveX object will not be executed; the action of the
object key or display key will be triggered instead.
For example, you might have an ActiveX slider object to control the
speed of a motor, with the F2 key defined to increase the motor’s
speed, and the F3 key defined to decrease the motor’s speed. If you
have defined F2 as an object key to jog the motor’s position, pressing
F2 will never increase the motor’s speed—every time an operator
presses F2, the motor’s position will be jogged instead.
If a key that triggers an action in an embedded ActiveX object has
been defined as a global key, pressing that key will trigger both the
action defined for the embedded object and the action defined for
the global key.
1
1
15-15 1
Setting up navigation
For example, if the F2 key for an ActiveX gauge object increases a
motor’s speed, and you have defined F2 as a global key to print the
current graphic display, each time the operator presses F2, the
motor’s speed will be increased, and the graphic display will be
printed.
Precedence and embedded OLE objects
The order of precedence for embedded OLE objects differs,
depending on whether the OLE object is an RSView32 OLE object,
for example, an embedded command line, alarm summary, or tag
monitor object, or whether the object is a non-RSView32 OLE
object, for example, an Excel worksheet.
Precedence and embedded RSView32 OLE objects
When a graphic display is active and an embedded RSView32 OLE
object has input focus, a key that triggers an action in the embedded
object will not trigger that action if the key has been defined as an
object or display key as well. When you press the key, the action of
the object or display key will be triggered instead.
If a key that triggers an action in an embedded RSView32 OLE
object has been defined as a global key, pressing that key will trigger
both the action defined for the embedded object and the action
defined for the global key.
Precedence and embedded non-RSView32 OLE objects
For non-RSView32 embedded OLE objects (for example, an Excel
worksheet), a key that triggers an action in the embedded object will
trigger only that action, even if it has also been defined as an object
or display key. In this case, the action defined for the object or
display will not be triggered at all.
If a key that triggers an action in an embedded non-RSView32 OLE
object has been defined as a global key, pressing that key will trigger
both the action defined for the embedded object and the action
defined for the global key.
1
1
1
15-16
Setting up navigation
Reserved keys
The following keys and key combinations are normally reserved for
use by Windows and RSView32.
This reserved key
Does this
+ on the numeric
keypad
Displays the Recipe dialog box, or saves the recipe if Ctrl-W
was pressed previously, or restores the recipe if Ctrl-R was
pressed previously.
Enter
If Enter is pressed when a button has focus, the button’s press
and release actions are executed.
If Enter is pressed when an input field has focus, the field’s
value is downloaded to the PLC. If the input field is configured
to display the on-screen keyboard, pressing Enter displays the
on-screen keyboard.
If Enter is pressed when a recipe field has focus, the Recipe
dialog box is displayed. If Ctrl-W was pressed previously, the
recipe is saved. If Ctrl-R was pressed previously, the recipe is
restored. If the recipe field is configured to display the
on-screen keyboard, pressing Enter displays the on-screen
keyboard.
Tab
Moves focus to the object with the next highest index number.
Shift-Tab
Moves focus to the object with the next lowest index number.
Ctrl-Up Arrow,
Ctrl-Left Arrow,
Ctrl-Down Arrow,
Ctrl-Right Arrow
Moves focus to an object in the direction in which the arrow
points.
PgUp
Uploads data into all input fields.
Ctrl-PgUp
Uploads data into the selected input field.
PgDn
Downloads data from all input fields.
Ctrl-PgDn
Downloads data from the selected input field.
Ctrl-R
Sets input focus to the recipe object, and prepares for a recipe
restore.
Ctrl-W
Sets input focus to the recipe object, and prepares for a recipe
save.
Up Arrow,
Down Arrow
Moves the selection bar on the Object Key menu.
Left Arrow,
Right Arrow
Moves the cursor one position left or right.
Esc
Closes the Object Key menu, or exits the input mode of a
continuously-updating input field.
Backspace
Deletes the character to the left of the cursor.
1
1
15-17 1
Setting up navigation
This reserved key
Does this
Del
Deletes the character to the right of the cursor.
Shift-End-Delete
Deletes all characters from the cursor position to the end of
the line.
Home-Shift-End-Delete
Deletes the contents of the input field.
Ctrl-C or Ctrl-Ins
Copies the selected items to the clipboard
Ctrl-X or Shift-Del
Cuts the selected items and places them in the clipboard.
Ctrl-V or Shift-Ins
Pastes the contents of the clipboard at the current cursor
position.
Home
Positions the cursor at the beginning of the data entry field.
Ctrl-Alt-P
Toggles the Project Manager.
Ctrl-F4, or
Ctrl-Shift-F4
Closes the active window.
Ctrl-F6
Moves focus to the next window.
Ctrl-Shift-F6
Moves focus to the previous window.
If you define a press, release, or repeat action for a reserved key, to
use the key as an object or display key, the object or display key
function takes precedence, and the default, reserved function of that
key is disabled.
For example, you might want to evaluate the contents of an input
field using a VBA program before you download the input field’s
value to a PLC. To do this, create an object key for the input object,
and assign the VBAExec command to the press action of the Enter
key. To do this for all input objects on the display, create a display
key for the PgDn key, and assign the VBAExec command to the
key’s press action.
If you use a reserved key or key combination as a global key, the key
will perform both the actions of the global key you defined, as well
as the action of the reserved key. Because the results can be
unpredictable, defining global key actions for reserved keys is not
recommended.
1
1
1
15-18
Setting up navigation
Tips for using keys
Keys with repeat actions are ideal for such tasks as ‘ramping’ a tag’s
value.
To define keys for running VBA programs or macros, define press
actions and release actions only. Repeat actions could produce
unexpected results, or could flood the system with VBA programs or
macros, if the operator is unsure about whether pressing the key
triggered the desired action, and then presses the key repeatedly or
holds it down.
Creating global keys
A global key is a key that has been assigned commands or macros.
At runtime, when the key is pressed, the assigned action is triggered.
A global key is active at all times because it is not associated with a
particular graphic object or display. 6.
To create a global key:
1. In the Project Manager, open the Logic and Control folder.
2. Open the Global Keys editor by doing one of the following:
double-click the Global Keys icon
right-click the Global Keys icon and then click New
1
1
15-19 1
Setting up navigation
3. Click Add.
4. Specify a key and, if desired, click one or both modifiers.
Some keys are reserved for use by Windows and RSView32.
Reserved keys do not appear in the Key field in the Add Key
dialog box.
1
1
1
15-20
Setting up navigation
5. Click OK.
The key you add is displayed in the Key field. If you specified a
modifier, the first letter of that modifier is also displayed. If you
create a label in the next step, it will also be listed in this field. As
you continue to add keys, they will be listed here.
6. In the Label field, if you want, type a label for the key.
7. In the Press Action field and, if desired, in the Release Action
field, specify an RSView32 command or a macro by typing it or
by clicking the ... button to open the Command Wizard and
choose it. The command or macro is the action that will occur
when the key is pressed or released. You can type multiple
commands or macros. If you do, separate them with a
semi-colon (;) or type them on separate lines.
8. If you want an action to repeat while the key is held down, type
the RSView32 command or macro name in the Repeat Action
field.
The repeat action repeats at the rate specified in the Keyboard
properties of the Windows Control Panel.
9. Click OK to save the global key file.
Running global key files
Use the RSView32 Key command to run global key files. Type this
command in a macro or anywhere else you can use an RSView32
command.
IMPORTANT You cannot run more than one global key file at a time. If you try to run
more than one file, the files are not merged. Instead, the second file
overrides the first file.
1
1
15-21 1
Setting up navigation
To start running a global key file, do one of the following:
In the Startup editor, select the Global Key File check box and
specify the file you want to run
On the command line or in a macro, type:
Key <file>
<file>
the name of the global key file without an
extension
To stop running a global key file:
On the command line or in a macro, type:
Key /R
/R
removes all key definitions
For a complete list of RSView32 commands and command syntax,
see Appendix A, RSView32 commands, or see Help.
1
1
1
15-22
16
Sharing data with other
Windows applications
Methods for sharing data
RSView32 is based on standards that allow data to be accessed and
shared among Windows applications. With RSView32, you can:
retrieve historical data using other Windows applications
RSView32 stores all historical data in dBASE IV (.dbf) format, so
you can access data from log files using any software that supports
this file format. With data logs, you also have the option of storing
the data in ODBC-compliant databases. With activity logs and
alarm logs, you can optionally send the data to an
ODBC-compliant database.
This chapter includes a procedure for accessing data from activity,
alarm, and data log files. It also shows one way to display
historical data using a pivot table created in Microsoft Excel.
access and update tag values
RSView32 works as a DDE (Dynamic Data Exchange) server and
client, as well as an OPC (OLE for Process Control) server and
client. This means you can exchange tag values with a wide range
of devices and other Windows applications.
1
1
16-1 1
Sharing data with other Windows applications
You can also use the RSView32 Object Model to read and write
tag values, or to execute RSView32 commands from another
application. For more information about using the RSView32
Object Model, see Getting Results with RSView32, and see Help.
This chapter describes how to set up RSView32 as a local server or
client for OPC and DDE, and includes an example of setting up
RSView32 as a DDE server that provides data to a Microsoft Excel
worksheet.
See Chapter 17, Using networks, for information about setting up
RSView32 as a server or client on a network.
use other Windows tools to manage tag databases
RSView32 stores tag and alarm information in a format that is
ODBC-compatible. This means you can use another Windows
application—such as Microsoft Access—to create a front end for
managing your tag database.
visually integrate with other Windows products
RSView32 supports object linking and embedding (OLE 2.0) so
you can link to other applications as well as files created in other
applications.
With this feature, you can:
provide management information from a remote database by
embedding a Microsoft Excel chart
allow operators to enter shift data into an external database by
activating an embedded database form
embed any OLE 2.0 server application that meets your specific
needs
You can link or embed OLE objects in the Graphic Display
editor. For details, see Chapter 11, Creating graphic displays.
insert an ActiveX object into a graphic display and link the object
to an RSView32 tag
For details, see Chapter 11, Creating graphic displays and
Chapter 12, Animating graphic objects.
1
1
1
16-2
Sharing data with other Windows applications
Retrieving historical data
All logged data is stored in files in dBASE IV or ODBC table
format, so you can retrieve data from log files using any software
that reads these formats. (ODBC format is available for data logs
only, not alarm or activity logs, unless you send the alarm log or
activity log data to an ODBC database online.) Many software
products are available for retrieving and analyzing data. This chapter
briefly describes how to bring data from .dbf log files into Microsoft
Excel. It also describes how to create a pivot table using .dbf data
from data log files.
For information about how alarm log files are named, see page 6-29.
For information about how the dBASE IV data log files are named,
see page 7-4. For information about how ODBC data log tables and
backup files are named, see page 7-8. For information about how
activity log files are named, see page 8-9. For information about how
to send activity log data or alarm log data to an ODBC database, see
page 6-30.
Before retrieving data, consider how the data will be used. This will
help you choose the best method for retrieving it. For example, you
can bring .dbf data from log files directly into Microsoft Excel.
However, it might be more valuable to limit the data you retrieve.
Suppose you want to examine the values of certain tags over time. To
do that, you could perform a query (with Microsoft Query) using
tag names and time as criteria so you retrieve only relevant data.
For detailed information about working in Microsoft Excel and
Microsoft Query, see your Microsoft documentation.
1
1
16-3 1
Sharing data with other Windows applications
Retrieving tag names from data log files
For data log models, RSView32 often uses an index file or table for
tag names. The file or table contains a list of all the tags used in the
model, together with an index number for each tag. Other data log
files or tables use the index number rather than the full tag name.
This storage
format
Stores tag information in this file or table
dBASE IV with
short file names
YYMMDDnt.dbf, where the t indicates this is the tag name file.
dBASE IV with
long file names
YYYY MM DD NNNN <Log File Identifier String> Tagname.dbf
ODBC
TagTable
This file is used for the wide .dbf storage format only if tag names
are greater than 10 characters long.
This file is used for the wide .dbf storage format only if tag names
are greater than 10 characters long.
This is the default name for the table. You can change the name.
Use of this table is optional. If this table isn’t used, RSView32
stores the full tag name in the FloatTable or StringTable.
When retrieving information from data log files, you will likely want
the tag names—not the tag index. Therefore, you may have to
retrieve data from more than one file or table. To do this, you have to
join the tables. For information about joining tables, see “Joining
tables and selecting data” on page 16-20.
1
1
1
16-4
Sharing data with other Windows applications
Bringing logged dBASE IV data into Microsoft Excel
Use the following procedure to bring the information from
dBASE IV log files into Microsoft Excel.789
1. Open Microsoft Excel.1011
2. On the File menu, click Open.
3. In the List Files of Type field, click dBase Files (*.dbf).
4. In the “Look in” field, choose a project directory and the
subdirectory containing the log files.
If you used the default logging paths when setting up logging, the
files will be in the following subdirectories (substitute the drive
and project name you used for C: and Example):
activity log files—C:\Example\Actlog
alarm log file—C:\Example\Almlog
data log file—C:\Example\Dlglog\Model name
Data log files
When this box is checked, RSView32 can write
data to the log file while the log file is open in
Excel.
1
1
16-5 1
Sharing data with other Windows applications
5. Select a .dbf file.
6. To allow RSView32 to continue writing data to the log file while
the file is open in Microsoft Excel, select the Read Only check
box.
If the Read Only check box is not selected, RSView32 cannot
write to the log file. If the Error category is selected in the
Activity Log Setup editor, an error is reported in the activity bar
and in the activity log file.
7. Click OK.
The contents of the log file appear in the spreadsheet.
This is a wide-format data log file. This format has
multiple tag values per time stamp.
1
1
1
16-6
Sharing data with other Windows applications
Understanding the content of the log files
Following is a description of the contents of the activity, alarm, and
data log files. Unless otherwise indicated, the illustrations show log
files that have been opened in Microsoft Excel.
Activity log files
This column
Contains
Type
The number of the activity type. The numbers are: 0 for error, 1 for
warning, and 2 for information. 8.
Id
The number of the RSView32 component that sent the log message.
This number is for RSView32 internal use only.
Date
The date the activity occurred. The date format is specified by the
Regional Settings in the Windows Control Panel.
Time
The time the activity occurred. The time format is specified by the
Regional Settings in the Windows Control Panel.
Militime
The number of milliseconds.
DstFlag
The Daylight Savings Time (DST) flag, where 1 means DST is in
effect and 0 means DST is not in effect. This number is for
RSView32 internal use only
Category
The activity category. For a description of these categories, see
page 8-12.
Source
The RSView32 component that generated the activity.
User
The user that was logged on when the activity occurred.
Dscrptn
The description of the activity.
UserStn
For future use.
LoggingStn
The name of the computer on which the logging server is running.
1
1
16-7 1
Sharing data with other Windows applications
Activity log—ODBC format
ODBC format activity log data uses one table. The illustrations
show ODBC tables that have been opened in Microsoft Query. For
more information about how the log files are named, see “The
ODBC storage format” on page 7-8.
1
1
1
16-8
This column
Contains
SQL Data Type
Length
Type
The number of activity type: 0 for
error, 1 for warning, 2 for
information.
SQL_SMALLINT
or SQL_INTEGER
2 or
4
Id
The number of the RSView32
component that sent the log
message (for RSView32 internal
use only).
SQL_INTEGER
4
DateAndTime
The time and date data was
logged.
SQL_TIMESTAMP
Driver
dependent
Millitm
Millisecond time when data was
logged.
SQL_SMALLINT
or SQL_INTEGER
2 or
4
DstFlag
The Daylight Savings Time (DST)
flag, where 1 means DST is in
effect and 0 means DST is not in
effect (for RSView32 internal use
only).
SQL_VARCHAR
or SQL_CHAR
1
Category
The activity category.
SQL_VARCHAR
or SQL_CHAR
20
Source
The RSView32 component that
generated the activity.
SQL_VARCHAR
or SQL_CHAR
20
UserID
The user that was logged on when SQL_VARCHAR
the activity occurred.
or SQL_CHAR
20
Dscrptn
The description of the activity.
SQL_VARCHAR
or SQL_CHAR
132
UserStn
For future use.
SQL_VARCHAR
orSQL_CHAR
15
LoggingStn
The name of the computer on
which the logging server is
running.
SQL_VARCHAR
or SQL_CHAR
15
Sharing data with other Windows applications
Alarm log files
This column
Contains
Date
The date the alarm was generated.
Time
The time the alarm was generated.
Militime
The number of milliseconds.
TransType
The type of alarm that was generated. The types are:
InAlm
In Alarm (severities 1 through 8)
OutAlm Out of Alarm
Acked
Acknowledged
RmAck Remote Acknowledged
InFlt
In Fault
OutFlt
Out of Fault
SupOn Suppress On
SupOf
Suppress Off
TagName
The name of the tag or alarm event that caused the alarm.
TagValue
The value of the tag at the time the alarm occurred.
TagType
The type of tag in alarm: A for analog, D for digital, S for string.
ThreshVal
The threshold value.
ThreshNum
The threshold number.
ThreshLabl
The threshold label.
Severity
The alarm severity (1 is highest severity and 8 is lowest severity).
1
1
16-9 1
Sharing data with other Windows applications
This column
Contains
DstFlag
The Daylight Savings Time (DST) flag, where Y means DST is in
effect and N means DST is not in effect. This number is for
RSView32 internal use only.
UserId
The user that was logged on when the alarm occurred.
AlarmType
The number RSView32 assigns to the transaction type.
Dscription
The message that is associated with the transaction (alarm) type.
UserStn
For future use.
LoggingStn
The name of the computer on which the logging server is running.
Alarm log files—ODBC format
ODBC format alarm log data uses one table. The illustrations show
ODBC tables that have been opened in Microsoft Query. For more
information about how the log files are named, see “The ODBC
storage format” on page 7-8.
1
1
1
16-10
This column
Contains
SQL Data Type
Length
DateAndTime
The time and date the alarm was
generated.
SQL_TIMESTAMP
Driver
dependent
Millitm
The millisecond time when the
SQL_SMALLINT
alarm transaction was generated. or SQL_INTEGER
2 or
4
TransType
The type of alarm that was
generated.
SQL_VARCHAR
or SQL_CHAR
5
TagName
The name of the tag or alarm
event that caused the alarm.
SQL_VARCHAR
or SQL_CHAR
40
TagValue
The value of the tag at the time
the alarm occurred.
SQL_DOUBLE or
SQL_INTEGER or
SQL_SMALLINT
8 or
4 or
2
Sharing data with other Windows applications
This column
Contains
TagType
The type of the tag in alarm: A for SQL_VARCHAR
analog, D for digital.
or SQL_CHAR
SQL Data Type
1
Length
ThreshVal
The threshold value.
SQL_DOUBLE or
SQL_INTEGER or
SQL_SMALLINT
8 or
4 or
2
ThreshNum
The threshold number.
SQL_SMALLINT
or SQL_INTEGER
2 or
4
ThreshLabl
The threshold label.
SQL_VARCHAR
or SQL_CHAR
20
Severity
The alarm severity.
SQL_SMALLINT
or SQL_INTEGER
2 or
4
DstFlag
The Daylight Savings Time (DST)
flag, where Y means DST is in
effect and N means DST is not in
effect (for RSView32 internal use
only).
SQL_VARCHAR
or SQL_CHAR
1
UserID
The user that was logged in when
the alarm occurred.
SQL_VARCHAR
or SQL_CHAR
20
AlarmType
The number RSView32 assigns to SQL_SMALLINT
the transaction type.
or SQL_INTEGER
2 or
4
Dscription
The message that is associated
with the transaction (alarm) type,
the log message for the alarm
event, or the alarm log remark.
SQL_VARCHAR
or SQL_CHAR
132
UserStn
For future use.
SQL_VARCHAR
or SQL_CHAR
15
LoggingStn
The name of the computer on
which the logging server is
running.
SQL_VARCHAR
or SQL_CHAR
15
If the ODBC database doesn’t support the SQL_TIMESTAMP data
type, then the data may be truncated. For example, the Oracle
ODBC driver does not support the SQL_TIMESTAMP type. Use
SQL_DATE instead to store both the date and time without
truncating the data in Oracle.
1
1
16-11 1
Sharing data with other Windows applications
Data log files—narrow .dbf format
Narrow .dbf format log files are created in sets of three. For more
information about .dbf data log files, see “The .dbf file format” on
page 7-3.9.
Floating point and string data
Log files for floating and string data are the same except one contains
analog and digital tag data and the other contains string tag data.
1
1
1
16-12
This column
Contains
Date
The date the tag values were logged.
Time
The time the tag values were logged.
TagIndex
The index number for the tag. The tag name that corresponds to
this number is listed in the tag name file.
Value
The analog, digital, or string value of the tag.
Status
Blank if communications are working properly.
D if a node is disabled.
E if a communication error occurred while RSView32 was trying to
acquire the tag value.
S if the tag value is stale; that is, if the value has been acquired
before but has not been updated.
U if the tag is uninitialized.
Marker
B when the DataLogOn command was issued and logging began.
E when the DataLogOff command was issued and logging ended.
S when the DataLogSnapshot command was issued.
Internal
Information relevant to RSView32 only.
Sharing data with other Windows applications
Tag name
This column
Contains
TagName
The tag name.
TTagIndex
The index number assigned to the tag name.
TagType
The tag type:
2—analog tag
3—digital tag
4—string tag
TagDataTyp
The tag data type:
0—long
1—float
2—string
Data log files—wide .dbf format
Wide .dbf format data log files are created in sets of two. For more
information about .dbf data log files, see “The .dbf file format” on
page 7-3.10.
Floating point and string data
Tag name
or index
Status Tag values
1
1
16-13 1
Sharing data with other Windows applications
This column
Contains
Date
The date the tag values were logged.
Time
The time the tag values were logged.
Marker
B when the DataLogOn command was issued and logging began.
E when the DataLogOff command was issued and logging ended.
S when the DataLogSnapshot command was issued.
Tag name/
Tag index
The tag name, if the name is 10 characters or less. Otherwise,
contains the index number for the tag. The tag name that
corresponds to the number is listed in the tag name file.
Status
D if a node is disabled.
E if a communication error occurred while RSView32 was trying to
acquire the tag value.
S if the tag value is stale; that is, if the tag value was acquired but
has not been updated.
U if the tag is uninitialized.
Blank if communications are working properly.
Tag values
The analog, digital, or string values for the tag.
Tag name
This column
Contains
Tagname
The tag name.
TTagIndex
The index number assigned to the tag name.
TagType
The tag type:
2—analog tag
3—digital tag
4—string tag
TagDataTyp
The tag data type:
0—long
1—float
2—string
1
1
1
16-14
Sharing data with other Windows applications
Data log—ODBC format
ODBC format log data uses up to three tables. The illustrations
show ODBC tables that have been opened in Microsoft Query. For
more information, see “The ODBC storage format” on page 7-8.
Floating point and string data
Log tables for floating and string data are the same except one
contains analog and digital tag data and the other contains string tag
data.
This column
Contains
SQL Data Type
Length
DateAndTime
The date and time the tag values
were logged.
SQL_TIMESTAMP
Driver
dependent
Millitm
The millisecond time the tag
values were logged.
SQL_SMALLINT
or SQL_INTEGER
4
TagIndex or
The index number for the tag. The SQL_SMALLINT
tag name that corresponds to this or SQL_INTEGER
number is listed in the tag name
table.
TagName
If the tag table isn’t used, the tag
name appears in this column.
SQL_VARCHAR
or SQL_CHAR
40
Val
The analog or digital value of the
tag.
SQL_DOUBLE or
SQL_INTEGER or
SQL_SMALLINT
8 or
4 or
2
The string value of the tag.
SQL_VARCHAR
or SQL_CHAR
82
2 or
4
1
1
16-15 1
Sharing data with other Windows applications
This column
Contains
SQL Data Type
Length
Status
Blank if communications are
working properly.
D if a node is disabled.
E if a communication error
occurred while RSView32 was
trying to acquire the tag value.
S if the tag value is stale; that is,
if the value has been acquired
before but has not been updated.
U if the tag is uninitialized.
SQL_VARCHAR
or SQL_CHAR
1
Marker
B when the DataLogOn command
was issued and logging began.
E when the DataLogOff command
was issued and logging ended.
S when the DataLogSnapshot
command was issued.
SQL_VARCHAR
or SQL_CHAR
1
This column
Contains
SQL Data Type
Length
TagName
The tag name.
SQL_VARCHAR
or SQL_CHAR
40
TagIndex
The index number assigned to the SQL_SMALLINT
or SQL_INTEGER
tag name.
2
TagType
The tag type:
SQL_SMALLINT
1
SQL_SMALLINT
2
Tag name
2—analog tag
3—digital tag
4—string tag
TagDataType
The tag data type:
0—long
1—float
2—string
1
1
1
16-16
Sharing data with other Windows applications
Creating a pivot table in Microsoft Excel
Use a pivot table to display and analyze data from any
narrow-format .dbf log file.
The basic steps for creating a pivot table are:
Open Microsoft Excel and start the PivotTable Wizard
Select the data source
Join tables and select data
Organize the pivot table
Once you have created the pivot table, you can then display the data
in a chart. This additional step is also described.
Starting the PivotTable Wizard
1. Open Microsoft Excel.
2. On the Data menu, click PivotTable Report.
If you did not install the Microsoft Office Data Access
components, the PivotTable Report item cannot be selected from
the Data menu in Excel.
The PivotTable Wizard appears.
1
1
16-17 1
Sharing data with other Windows applications
Selecting the data source
1. In the PivotTable Wizard, click External Data Source, and then
click Next.
Step 2 of the PivotTable Wizard appears.
2. Click Get Data.
This brings up Microsoft Query and the Select Data Source dialog
box. This dialog box displays a list of the available data sources. If
the ODBC data source you want to use (in this case, dBASE Files)
is not listed, you can add it by clicking the Browse button and
selecting a data source from the Program Files\Common
Files\Odbc\Data Sources directory.
3. Click dBASE Files (not sharable), and then click OK.
1
1
1
16-18
Sharing data with other Windows applications
The Add Tables dialog box appears.
4. In the “Look in” field, choose a project directory. Then choose
the directory containing the data log files.
If you used the default logging path, the files will be in
C:\Proj1\Dlglog\Model name, where Proj1 is the name of your
project and Model name is the name of the data log model.
5. Under Table Name, choose the file with a “t” before the .dbf
extension. For example: 990208at.dbf.
The “t” stands for tag name. It is important to select this file first
because it supplies the tag names for the other files.
The dBASE IV ODBC driver will not read files with long file
names. If you see the error message “Invalid string or buffer
length” after selecting a file, copy the file to a path that does not
contain long file names (for example, c:\data), and rename it, using
a short (8.3-character) file name. If you rename the file without
copying it, Trend objects will not be able to find the data in the
file.
1
1
16-19 1
Sharing data with other Windows applications
6. Click Add.
The table appears as a field list at the top of the Query window.
7. Choose one other file—either floating point data “f” or string data
“s”.
8. Click Add. The new field list appears beside the first field list.
Joining tables and selecting data
For narrow format .dbf files, the tag name file contains tag names
and index numbers. Each tag you create in the tag database is
assigned an index number. The tag index number is stored in the
floating point and string files; the tag name is not stored.
When retrieving data from log files, you will likely want the tag
names—not the tag index. Therefore, you have to retrieve data from
more than one table. To do this, you have to join tables. When you
join tables, you connect one or more fields in the tables. These fields
must have the same name and must contain the same type of data.
1. Join the TTagindex field in the tag name field list to the Tagindex
field in the other list.
When you drag
TTagindex from one
table to the
equivalent field in the
other table, a join is
formed.
1
1
1
16-20
Sharing data with other Windows applications
2. Select the fields in the floating point or string list that you want
data for. You can select the fields in any order.
To select fields, double-click them. The data for that field will
appear in the Query spreadsheet.
3. When you have selected all the fields you want, open the File
menu and then click Return Data to Microsoft Excel.
When you are back in Microsoft Excel, click Next in the
PivotTable Wizard.
1
1
16-21 1
Sharing data with other Windows applications
Organizing the pivot table
After you have selected the data for your pivot table, specify how
you want that data to appear.
Use these
buttons to
organize
your table.
1. In the Wizard, drag the field buttons and place them in the table.
2. When the table is set up, click Next.
3. Specify a location for the pivot table.
1
1
1
16-22
Sharing data with other Windows applications
4. To display the table, click Finish.
The pivot table is displayed in the worksheet.
Creating a chart
1. To create a chart from the pivot table, select the data you want to
use.
2. On the toolbar, click the Chart Wizard button.
3. Follow the instructions in the Wizard to create the type of chart
you want.
When you finish, the chart will be displayed in the worksheet.
1
1
16-23 1
Sharing data with other Windows applications
Sharing tag values locally
RSView32 works as both an OPC or DDE server and an OPC or
DDE client. This means you can share tag values with a wide range
of devices and other Windows applications. 4.
The rest of this chapter explains how to use OPC and DDE to
exchange values between different applications on the same
computer (that is, locally). For exchanging tag values between
multiple RSView32 computers over a network, OPC is the
recommended method. For details on exchanging values over a
network, see “Using OPC for peer-to-peer network
communications” on page 17-5.
Providing tag values to local OPC or DDE clients
When Windows applications request tag values from RSView32, the
requesting applications are OPC or DDE clients and the RSView32
project providing the tag values is an OPC or DDE server.
Enabling RSView32 as a server
To enable RSView32 as a server, do one of the following:
select the OPC/DDE Server check box on the Startup page of the
Startup editor and run the project
issue the RTDataServerOn command (from the command line or
another RSView32 component)
Setting up a local OPC client application
To use OPC, the OPC server must be registered on the computer.
The Node editor lists OPC servers that are registered on the
computer (click the Browse button next to the Server Name field).
1
1
1
16-24
Sharing data with other Windows applications
To request data from RSView32, a third-party OPC client
application on the same computer must use this information:
Server:
RSI.RSView32OPCTagServer
Type:
Local
Server
Computer
Name or
Address:
Since the client and server are on the same computer,
this field is inaccessible.
Access Path:
Project name. You can leave this blank.
If you specify a name, use the name of the open
project.
Update Rate: A rate in seconds.
Address:
Name or address of the tag in the server. (You specify
the address when you assign the OPC node to a tag
in the Tag editor.)
Each OPC client application uses different delimiters to separate
these fields; use the delimiters that are appropriate to your
application. For an example of how to set up an RSView32 station as
an OPC client, see “Using OPC for peer-to-peer network
communications” on page 17-5.
Setting up a local DDE client application
To request data from RSView32 a DDE client application on the
same computer must use this information:
Application:
RTData
Topic:
Project name
Item:
Tag name
Each DDE client application uses different delimiters to separate
these three fields; use the delimiters that are appropriate to your
application.
1
1
16-25 1
Sharing data with other Windows applications
Example: Using Microsoft Excel to read a tag value
This example describes how to use Microsoft Excel to read a tag
value. Microsoft Excel is the DDE client application. RSView32 is
the server application.
To read the value for Tag1 from an RSView32 project named Sample,
type the following in the spreadsheet cell:
=RTData|Sample!Tag1
Getting tag values from servers
When RSView32 requests tag values from other Windows
applications such as RSServer or another RSView32 project,
RSView32 is the OPC or DDE client and the application providing
the tag values is the OPC or DDE server.
Setting up RSView32 as the client
To request tag values from a server, you must set up an OPC or
DDE node and then use that node name when creating a tag. For
details about creating an OPC node, see page 3-5. For details about
creating a DDE node, see page 3-11. For details about creating tags,
see Chapter 4, Creating tags.
1
1
1
16-26
Sharing data with other Windows applications
Enabling RSView32 for tag writes
By default, other applications cannot write to tags in RSView32. To
enable writing to tags, you have to issue the RTDataWriteEnable
command (from the command line or another RSView32
component).
Example: Writing to a tag
The following example shows a Microsoft Excel macro that will
write to the Process\Ingred1\SP tag in the Samples project.
Microsoft Excel is the DDE client and RSView32 is the DDE server.
1
1
16-27 1
Sharing data with other Windows applications
Sending DDEExecute commands to other applications
You can use RSView32 to send DDEExecute commands to other
applications. However, RSView32 does not accept DDEExecute
commands from other applications. To send commands to RSView32
from other applications, use the RSView32 Object Model with a
programming language such as Visual Basic. For more information
about using the RSView32 Object Model, see Help.
1. Run the application to which the command is being sent.
2. Issue the DDEExecute <application>|<topic> <command>
command. You can issue this command from the command line or
from another RSView32 component.
For details about this command, see Appendix A, RSView32
commands, or see Help.
Example: Sending a command to RSLinx
The following example sends the Who_Active command to RSLinx
(application name = rslinx):
''(([HFXWH UVOLQ[_BB'ULYHUV >:KRB$FWLYH@
Drivers must be preceded by two underscores.
When this command runs, the default RSWho window is displayed.
1
1
1
16-28
17
Using networks
With RSView32 on a network, you can:
share project components among multiple workstations during
development and runtime
share data logged by one workstation
use OPC to share tag values among multiple workstations
Sharing project components during development and runtime
You can set up RSView32 to share project components during
development and runtime by storing common components on a file
server or shared drive.
Components can run from multiple stations concurrently, but only
one component file can be edited by a station at a time. Any change
in a component file is reflected in runtime stations the next time the
project runs.
Sharing components during development
If you set up RSView32 to share project components during
development, a group of engineers can develop a project
simultaneously. For example, one engineer can work on a graphic
display, another on derived tags, and so on.
1
1
17-1 1
Using networks
Sharing components at runtime
Sharing components at runtime allows you to centrally maintain a
project. For example, you could store the following components on
a central file server:
security
graphic displays
activity, alarm, and data logs
IMPORTANT You cannot share a tag database.
When setting up a project to share components, ensure you have
read and write access to the shared drive.
The following illustration shows two workstations with RSView32
installed. Both workstations have local tag databases but are
configured to point to the file server for project components such as
graphic displays and macros.
Network compatible with Windows
File Server
Workstation 1
1
1
1
17-2
Workstation 2
Using networks
How to share components
To share project components, follow these steps:
1. Create projects on each machine that will be accessing the shared
components.
2. On each machine, use the Project Paths dialog box to set up paths
to common components.
For detailed information about the Project Paths dialog box, see
“Setting the project path” on page 18-8.
Example: Data logging on one RSView32 station and displaying a
historical trend on another station
The following example outlines how to log data on one computer
and display a historical trend on another computer using that data.
For this example, \\Computer1 contains the remote data log model,
and \\Computer2 contains the trend object. \\Computer1 and
\\Computer2 must be on the same network.
1. Configure a data log model (call it LogModel) on Computer1.
LogModel’s data log path can use a drive on \\Computer1 that
\\Computer2 can map to, or a common network drive that both
\\Computer1 and \\Computer2 can map to (for our purposes on a
computer called \\NetworkComputer).
For this example we will use the common drive and path
\\NetworkComputer\RSVProj\Datalog.
When logging LogModel, data is written to this file:
\\NetworkComputer\RSVProj\Datalog\LogModel\
filename.dbf.
A file named LogModel.dlg is also created in the same LogModel
folder.
1
1
17-3 1
Using networks
2. On \\Computer2, in the Trend Configuration dialog box, select
Historical, and choose Remote for the Data Source.
Use the Browse button (...) to browse to this file:
\\NetworkComputer\RSVProj\Datalog\LogModel\
LogModel.dlg.
The LogModel folder and the LogModel.dlg file will not exist if
data logging for LogModel has not been started yet. In this case,
type this path in the Remote field:
\\NetworkComputer\RSVProj\Datalog\LogModel\
LogModel.dlg
1
1
1
17-4
Using networks
3. Start data logging for LogModel on \\Computer1 and start the
graphic display containing the trend object on \\Computer2.
\\Computer2 will read the logged data from \\NetworkComputer
and display it in the trend.
If the data log model on Computer1 is configured to use the ODBC
storage format and data source, Computer2 must have an ODBC
data source configured with the same name in order for the remote
historical trend to work.
Using OPC for peer-to-peer network communications
RSView32 supports the OPC 1.0a specification.
This section describes how to set up OPC to share tag values over a
network. You can set up one RSView32 station as an OPC client,
and another as an OPC server, to achieve peer-to-peer networking.
Using OPC, you can both read from and write to tags on another
RSView32 station on the network. Follow the steps below to set up
OPC in Windows 9x or Windows NT. If you are using
Windows NT, Service Pack 3 or Service Pack 4 must be installed as
well.
To use OPC:
you need a Windows NT network, with a Primary Domain
Controller to authenticate all computers on the network. All
computers on the Windows NT network must be in the same
domain.
Microsoft Distributed COM (DCOM) must be installed and
configured, both on the client and the server computers.
the OPC server must be registered on the OPC client machine.
The Node editor lists OPC servers that are registered on the client
machine (click the Browse button next to the Server Name field).
For more information about the requirements for using OPC on a
client/server network, see the RSView32 Release Notes.
1
1
17-5 1
Using networks
Identifying the RSView32 server computer
To uniquely identify an RSView32 server for OPC communications,
the computer must have a name or address.
To assign a name using the Universal Naming Convention:
open the Windows Control Panel
open the Network dialog box
click the Identification tab and type a name for the computer
To assign a name using the Domain Name System:
See your Microsoft NT Server documentation.
To set up a TCP/IP address:
open the Windows Control Panel
open the Network dialog box
in Windows 9x, click TCP/IP, click the Properties button, and
enter an IP address
in Windows NT, click the Protocols tab, click TCP/IP Protocol,
click the Properties button, and specify an IP address
Enabling an RSView32 OPC server for reading and writing
1. Enable RSView32 as an OPC server by doing one of the
following:
select the OPC/DDE Server check box in the Startup editor
and run the project
issue the RTDataServerOn command (from the RSView32
command line or another RSView32 component)
2. Enable RSView32 for writes by issuing the RTDataWriteEnable
command (from the RSView32 command line or another
RSView32 component).
1
1
1
17-6
Using networks
Configuring the RSView32 OPC client application
To request data from an RSView32 OPC server, you must set up a
node that references the server. You set up the node in the RSView32
project on the OPC client computer using this information:
Server:
RSI.RSView32OPCTagServer
Type:
Remote
Server
Computer
Name or
Address:
The name or address of the server computer. See
“Server Computer Name or Address” on page 3-8 for
information about the format to use.
Access Path:
Project name. You can leave this blank.
RSView32 automatically uses the open project on the
server computer.
Update Rate: A rate in seconds.
Address:
Name or address of the tag in the server. (You specify
the address when you assign the OPC node to a tag
in the Tag editor.)
For more information about creating the node see “Creating an
OPC node” on page 3-5.
Once you set up the node, assign it to tags that will read from or
write to the server. Create tags, select Device as the data source, and
assign the node that you have created. For details, see Chapter 4,
Creating tags.
1
1
17-7 1
Using networks
Example: Sharing tag values between two RSView32 stations
An RSView32 computer on the plant floor contains a tag called
RejectCount. You are the supervisor and want to include this tag’s
value in a graphic display on your computer.
For this example, assume that:
the client computer is your computer, and the computer is named
Supervisor
the server computer is the plant floor computer, and the computer
is named Plant
the project on the Plant computer is called Bottling and it contains
a tag called RejectCount
RSView32 OPC client
Computer name = Supervisor
OPC
Tag Values
RSView32 OPC server on plant floor
Computer name = Plant
Project name = Bottling
DH+
PLC Values
Area1
1
1
1
17-8
Using networks
How the Supervisor Gets Values
In the Node editor, you create an OPC node called Plant_Computer
that has the following information:
Server:
RSI.RSView32OPCTagServer
Type:
Remote
Server
Computer
Name or
Address:
\\Plant
Access Path:
Bottling (optional)
Update Rate: 5.000 seconds
You create a tag that points to the Plant computer. In the tag’s Node
field, you assign the Plant_Computer node. In the tag’s Address
field, you enter RejectCount, which is the tag you want values for.
The information in the Address field is the OPC tag address.
When the RejectCount tag is used anywhere in the Supervisor
computer, it gets its value from the RejectCount tag in the Bottling
project on the Plant computer.
You can also write to the RejectCount tag in the Bottling project
using the RSView32 Set or = (Equal) commands (if writes are
enabled in the realtime data server on the Plant computer). The write
will go through to the programmable controller.
1
1
17-9 1
Using networks
Connecting to RSLinx Gateway as a remote OPC server
RSLinx Gateway provides remote access to OPC clients, such as
RSView32, over a TCP/IP network. RSLinx Gateway supports up to
5 remote clients.
To use OPC with RSLinx Gateway, you must configure settings
both in RSLinx and in RSView32.
Configuring RSLinx Gateway
To use RSLinx Gateway, do the following in RSLinx:
configure RSLinx Gateway with drivers for each control network
RSLinx is connected to
create a DDE/OPC topic for each PLC on each control network
enable RSLinx Gateway
For information about configuring RSLinx Gateway, see the
documentation supplied with RSLinx.
Configuring RSView32 for use with RSLinx Gateway
To use RSLinx Gateway with RSView32, do the following in
RSView32:
use the RSLinxOPCRemote program provided on the RSLinx
CD to register the RSLinx Gateway on the computer on which
RSView32 is installed.
in the Node editor, set up a remote OPC node for each PLC. For
more information about setting up an OPC node, see page 3-5.
create tags. For more information about creating tags, see page
4-13.
At runtime, use the same login name and password for the computer
running RSLinx Gateway and for the computer running RSView32.
If this is not practical, on the computer running RSLinx configure
DCOM to grant the RSView32 user access to the RSLinx computer.
For more information about configuring DCOM, see the Help
supplied with the DCOMCNFG utility.
1
1
1
17-10
Using networks
Example: Configuring an OPC node for RSLinx Gateway
The following example describes how to create a node to connect to
RSLinx Gateway as a remote OPC server.
Server Name: RSLinx OPC Server or RSLinx Remote OPC Server
If you are using RSLinx 2.0, the driver name is
RSLinx OPC Server. If you are using RSLinx 2.1, the
driver name is RSLinx Remote OPC Server. You
don’t need to specify a vendor or version number.
Access Path:
PLC_HVAC1
The access path is the DDE/OPC topic name in
RSLinx.
The figure below shows how the node looks in the Node editor.
Once you have created the node, assign it to a tag in the Tag
Database editor. The address tells RSView32 where in the node to get
the data.
Address:
N7:12
The PLC-5 programmable controller called
PLC_HVAC1 has been previously set up as a
1
1
17-11 1
Using networks
DDE/OPC topic in RSLinx; N7:12 is the address in
the PLC.
If you don’t include the access path when configuring
the node, you can enter the tag’s address as
[PLC_HVAC1]N7:12.
The figure below shows how the tag looks in the Tag editor.
1
1
1
17-12
18
Running your project
Summary of steps
Once you have developed your project, you are ready to run it. The
steps involved in running a project are:
specifying startup settings
if necessary, moving the project to another drive, such as a
network drive, or to another computer
configuring communications and communication hardware if you
moved the project
running the project
1
1
18-1 1
Running your project
Specifying startup settings
In the Startup editor, specify how the project will look and what
components will run when the project starts.
To open the Startup Editor
1. In the Project Manager, open the System folder.
2. Open the Startup editor by doing one of the following:
double-click the Startup icon
right-click the Startup icon and then click Show
1
1
1
18-2
Running your project
Preferences
To specify how the project window will look at startup:
1. Click the Preferences tab.
If Title Bar is not
selected, or if
Switch to other
Apps is selected,
these fields are
grayed out.
2. Under Show at Runtime, select the check box for each item you
want at runtime. Each item is shown in the illustration on the
following page.
1
1
18-3 1
Running your project
Title bar
Control
box
Menu
bar
Project
Manager
Activity
bar
1
1
1
18-4
Close button
Maximize button
Minimize button
Running your project
3. Under Disable, select the check box for each item you want to
disable. To completely disable runtime access to other
Windows 9x programs, select all the check boxes.
On Windows 9x, disabling the key combinations and the ability
to switch to other Windows applications allows you to lock
operators into an RSView32 runtime application.
On Windows NT, you cannot disable Ctrl-Alt-Del through the
Startup editor. To lock users into an RSView32 runtime
application on Windows NT, use the NT 4.0 Desktop Lock tool
included in the RSView32 Tools program folder.
Ctrl-Alt-P: This key combination shows or hides the Project
Manager. Once the Project Manager is open, users can access all
parts of an RSView32 project. You can secure the Project Manager
by securing the ProjectShow command. For details about security,
see Chapter 10, Adding security. For details about the
ProjectShow command, see Appendix A, RSView32 commands,
or see Help.
Ctrl-Alt-Del: This key combination reboots the system. You can
only disable this key combination for Windows 9x. To disable
rebooting in Windows NT 4.0, use the NT 4.0 Desktop Lock tool
in the RSView32 Tools program folder.
Switch to other Apps: When Switch to other Apps is disabled,
the following occurs at runtime:
Alt-Tab, Alt-Shift-Tab, and Ctrl-Alt-Esc, which switch to other
applications, are disabled
Alt-F4, which closes RSView32, is disabled
Ctrl-Esc, which brings up the Start menu, is disabled in
Windows 9x
4. Click OK.
1
1
18-5 1
Running your project
Startup
To specify the project components you want to run at startup:
1. Click the Startup tab.
IMPORTANT The order items appear in the Startup editor is not the order in which
items will run. If you have created a project that has components that
must start in a particular order, create a macro that will run when the
project starts.
2. Check the box for each item you want to run when the project
starts. Where required, specify the file you want to run.
Alarming
Starts alarm monitoring. This is the same as using the AlarmOn
command.
Communication Status
Logs communication errors to the activity log file and/or the
activity bar if you set the project up to do this. To set this up,
open the Activity Log Setup editor and ensure the Log File and
Activity Bar check boxes are selected for the Communications
category.
1
1
1
18-6
Running your project
OPC/DDE Server
Enables RSView32 as an OPC and DDE server. This is the same as
using the RTDataServerOn command.
Data Logging
Starts running the specified data log model. This is the same as
using the DataLogOn command. Up to 20 data log model files can
run simultaneously, but only one can be specified in the Startup
editor. To run more files, list them in a startup macro.
Global Key File
Runs the specified global key file. This is the same as using the
Key <file> command.
Derived Tags
Runs the specified derived tags file. This is the same as using the
DerivedOn <file> command. Up to 20 derived tag files can run
simultaneously, but only one can be specified in the Startup editor.
To run more files, list them in a startup macro.
Event Detector
Runs the specified event file. This is the same as using the
EventOn <file> command. Up to 20 event files can run
simultaneously, but only one file can be specified in the Startup
editor. To run more files, list them in a startup macro.
Startup Macro
Runs the specified macro. A startup macro allows you to run a
series of commands when the project starts. Any macro can be
used as a startup macro.
Shutdown Macro
Runs the specified macro. Any macro can be used as a shutdown
macro.
Initial Graphic
Displays the specified graphic display file.
3. Click OK.
1
1
18-7 1
Running your project
Setting up a project in a new location
It is important to test your project in the location from which it will
run, if you will run the project from a different directory or different
computer than the one on which you configured the project.
1. Use the Project Transport Utility, provided with the RSView32
Resource Kit, to copy the project directory to the target location.
2. When the project is in the new location, ensure the project paths
are correct. See “Setting the project path,” next.
3. If you moved the project to a new computer, set up RSView32 for
communications. For details, see Chapter 2, Setting up direct
driver communications or see Chapter 3, Setting up OPC and
DDE communications.
4. If your project includes VBA programs that reference object
models, ensure that object references are installed and enabled.
Setting the project path
In the Project Paths dialog box you can change the application and
database paths for a project. A path consists of a drive letter,
directory, and subdirectory, and tells the system where a project’s
database and editor files are stored.
When you copy a project from one computer to another, RSView32
automatically changes the default paths to the drive and directory the
project has been copied to. Therefore, you need only change project
paths when:
a project that has editors configured to store files on a network
drive is moved to a computer with a different drive mapping
a project that was copied from another machine uses files in
directories other than the default directories (that is, the files were
added using Create Shortcut to Existing Component)
you move the files for an editor from their original location to
another location on the same computer
1
1
1
18-8
Running your project
When you change the default path for an editor, new files will be
stored in the new location. Existing files will remain in their original
location unless you physically move them using the Windows
Explorer or File Manager. To add the files to the project, use Copy
Existing Component into Project or Create Shortcut to Existing
Component on the context menu.
If you apply a new default path to files that are in their original
location, the files will be inaccessible (grayed out) in the Project
Manager.
To use the Project Paths dialog box:
1. With the Project Manager active, click Project on the menu bar
and then click Project Paths.
The Project Paths dialog box opens.
1
1
18-9 1
Running your project
2. Change the application or database paths as described below.
3. Click OK.
Changing application paths
The Application Paths tab lists RSView32 editors and shows the
current default path for all components associated with the editors.
When you change the default path for an editor, any new
components you create for it will automatically be stored in the new
path. To move existing components to the new path, move the files
using a tool such as Windows Explorer and then reference the new
path.
To change the default path for new components:
1. In the Name field, select an editor.
2. In the Default Path field, specify a new path.
3. Click OK.
To change the default path for existing components:
1. In Windows Explorer or File Manager, move the file to its new
location.
2. In the RSView32 Project Paths dialog box, click the Application
Paths tab.
3. In the Name field, select an editor.
The components associated with the editor are displayed in the
Components field.
4. In the Default Path field, click Browse to open the Browse for
Folder dialog box and specify the new path.
5. Click Apply Default Path.
The components are updated to the new path.
1
1
1
18-10
Running your project
6. Click OK.
To change the path for a single component:
1. In the Windows Explorer or File Manager, move the file to its new
location.
2. In the RSView32 Project Paths dialog box, click the Application
Paths tab.
3. In the Name field, select an editor.
The components associated with the editor are displayed in the
Components field.
4. Select a component.
5. In the New Path For Component field, specify a new path.
Specify the new
path here.
6. Click OK.
Changing the database path
In the Database Paths tab, you can change the database that will be
the data source for the project.
1. Click the Browse button beside the Path to Database field.
2. Select the new data source and then click Open.
3. Click OK.
4. Close and re-open the project to complete the operation.
1
1
18-11 1
Running your project
Specifying time, date, and number formats
If the target computer is configured for a different locale than the
development computer, and the new locale uses different time, date,
or number formats, follow these steps. Once the project is loaded on
the computer on which it will run, use the Windows Control Panel
to specify time, date, and number formats. These formats apply to
the runtime components of the project only. You can also change
these formats after the project is running, but you must close and
restart the project for the changes to take effect.
1. Click the Start button on the Windows task bar, point to Settings,
and then click Control Panel.
The Control Panel window opens.
2. Double-click Regional Settings.
The Regional Settings Properties dialog box opens.
3. On the Regional Settings tab, select the language whose settings
you wish to use. If you use Windows NT, click the “Set as system
default locale” check box.
4. Verify and/or customize the settings on the Number, Time, and
Date tabs.
5. Click OK.
For more information, see your Windows documentation.
1
1
1
18-12
Running your project
Running a project
When you are developing a project, you can test it by clicking the
Run Mode tab in the Project Manager and then clicking the Run
Project button. If you configured the Startup editor, the RSView32
project window will appear as configured and the selected
components will start when you click Run Project.
Click this button to
run a project.
Running a project automatically
You can set up a project to run automatically when Windows starts.
1. Click the Start button on the Windows task bar, point to Settings,
and then click Taskbar.
The Taskbar Properties dialog box opens.
2. Click the Start Menu Programs tab.
3. Click Add.
The Create Shortcut dialog box opens.
1
1
18-13 1
Running your project
4. In the Command Line field, type the path to RSView32 or click
Browse and locate RSView32. Add the project name and the /r
parameter to the command line. For example, for a project called
Norm’s Bakery, you would type the following on the command
line:
“C:\Program Files\Rockwell Software\RSView\RSView32.exe”
“C:\Norm’s Bakery\Norm’s Bakery.rsv” /r
If the path contains spaces, you must enclose it in double quotes.
The /r parameter must be outside the quotes.
5. Click Next.
6. In the Select Program Folder dialog box, select the StartUp folder.
7. Specify a name for the shortcut.
8. Click Finish.
For more information, see your Windows documentation.
Monitoring disk space
When you run an RSView32 project, be sure that the computer’s
disk space does not fall below 10 MB.
To monitor disk space, do one of the following:
use the System Agent utility available with the Windows 95 Plus
Pack or Microsoft Plus! 98.
in the RSView32 Events editor, create an event that uses the
free_bytes function and displays a message when disk space falls
below 10 MB
See page 14-19 for more information about the free_bytes
function. See Chapter 9, Configuring events, for information
about events.
1
1
1
18-14
Running your project
Stopping a project
To stop a project, do any of the following:
in the Project Manager, click the Stop Project button
issue the ProjectStop command
To issue the ProjectStop command, type it on the command line
or create a button or global key with ProjectStop as the action.
When the button or key is pressed, the ProjectStop command is
issued.
When a project stops
When a project stops, the following occurs:
open displays and RSView32 components close
running data log models stop
running derived tag files stop
running event files stop
alarm monitoring stops
the OPC or DDE server is disabled
execution of VBA programs stops, but events may continue to fire
if your VBA program does not destroy its objects
If a shutdown macro has been specified in the Startup editor, the
macro will run once the above components have closed and stopped
running.
1
1
18-15 1
A
RSView32 commands
This appendix describes:
where and how to use RSView32 commands
how to use the command line
RSView32 commands and their syntax
Using RSView32 commands
Where to use commands
You can use commands in the following places:
in a field that requires you to enter an action. For example, as the
press, release, or repeat action when you assign touch animation
to an object in a graphic display, or as the action for a button
in a macro or symbol
in a command line
1
1
A-1 1
RSView32 commands
How to use commands
When entering commands, keep the following guidelines in mind:
Parameters enclosed in angle brackets < > are required.
Parameters enclosed in square brackets [ ] are optional.
Commands and parameters are not case sensitive.
Parameters do not have to be entered in the order they are listed.
Start each new command on a new line or separate commands on
the same line with a semicolon (;).
Separate multiple parameters with a space.
Enclose long file names containing spaces with double quotes
when the file names are used as parameters. For example
ActivityLogSendToODBC “c:\mydsn\activity db.dsn”
ActivityTbl /UDerek /Ppasswd
The exclamation mark (!) indicates the start of a comment.
Everything after the exclamation mark is ignored unless the
exclamation mark and what follows it are enclosed in double
quotes.
Many commands accept wildcards. The wildcards are:
* — matches any number of characters, including the backslash (\)
and period (.) characters
? — matches any single character
If a command accepts wildcards, this fact is noted in the
description of the command.
1
1
1
A-2
RSView32 commands
Using placeholders in commands
To replace a tag name with its current value when the command is
evaluated, enclose the tag name in dollar signs ($) to create a
placeholder in the command. If the placeholder is enclosed within
double quotes, or nested in the string value of another placeholder in
the command, RSView32 does not substitute the tag value.
The maximum number of characters for floating point tag values
is 17. If the value uses more than 17 characters, it will be represented
in scientific format. The maximum command length is 255. The
command will be truncated if the substituted tag values cause the
command to exceed this length.
Using dollar signs to create a placeholder in the command is an
alternative to the Parse utility available in the RSView32 Resource
Kit. The dollar signs alternative offers better performance.
Example 1: A macro using placeholders in commands
Display Screen$Tag1$
Display $Tag3$$Tag2$
Valve23 = Open
When the macro runs, Tag1 = 1, Tag2 = 2, and Tag3 = Screen. Note
that these are all string tags.
RSView32 replaces the placeholders in the commands with the tags’
current string values. The graphic display Screen1 appears, then the
graphic display Screen2 appears, then the tag Valve23 is set to its
open state.
You don’t need to put braces around tag names when using
placeholders in commands.
1
1
A-3 1
RSView32 commands
Example 2: Changing the value of a tag and tag placeholders
In this example, Tag1’s initial value is zero. The value 4 is assigned to
the tag Tag1, which is then used in a macro. Type the following text
in a button’s press action:
Tag1 = 4
Set the value of Tag1 to 4.
Display_Detail Tag1
Execute the Display_Detail macro,
using Tag1 as a parameter.
In the Display_Detail macro, type the following:
Display Screen$%1$
Displays a graphic display whose
name is Screen plus the value of Tag1
(for example, Screen 4).
RSView32 replaces the placeholder in the command with the tag’s
current string value. The graphic display Screen4 appears.
Tag placeholders are evaluated before commands are executed. You
can ensure Tag1 evaluates to 4 by embedding the tag placeholder in a
macro, not in the button. If you include the tag placeholder in the
button, the tag placeholder evaluates before the value of the tag is set
to 4. $Tag1$ will therefore evaluate to zero (the tag’s initial value),
not 4.
You don’t need to put braces around tag names when using
placeholders in commands.
Precedence
Commands take precedence over macros. For example, if you have a
macro called Activity the Activity command will run whenever you
try to run the Activity macro.
1
1
1
A-4
RSView32 commands
Using the command line
Use the command line during development and runtime. To use a
command line, either:
create a command line within a graphic display by choosing the
Command Line tool from the Drawing Tools toolbox or by
choosing Command Line from the Objects menu
open the command line in the Project Manager by double-clicking
the Command Line icon, or right-clicking the icon and then
choosing Show
create a global key with the CommandLine command as the press
action
Using the Command Wizard
Use the Command Wizard to build command strings. The
Command Wizard lists all RSView32 commands and, where
applicable, lists the command’s parameters. The Wizard also lists any
macros that you have created.
To open the Command Wizard, do one of the following:
double-click in an action field or, in the Macro editor, double-click
anywhere in the editor
click the ... button beside an action field or any field requiring an
RSView32 command
This button opens the
Command Wizard.
in the Command Line editor, Security Codes editor, Events editor,
and Macro editor, click Commands on the Edit menu
1
1
A-5 1
RSView32 commands
Building a command string
1. Open the Command Wizard.
When you click a category
here . . .
the commands for
that category are
listed here.
To resize the list
boxes, drag this bar
to the left or right.
2. In the Command Categories list, click a folder.
To see the commands and macros you last used, click this folder:
To see all commands and macros, click this folder:
To see the commands that can be used for a particular part of the
system, click one of these folders:
1
1
1
A-6
RSView32 commands
3. Select a command by clicking it in the Commands field.
To change the order in
which commands are
listed, click the column
title.
To see all the
information for a
command, use the
scroll bar.
Command Name: Lists the commands in the open folder.
Command Description: Describes the command’s function.
Form: Shows the command syntax. Angle brackets < > indicate a
required parameter. Square brackets [ ] indicate an optional
parameter.
4. Click Next to add parameters or click Finish. If a command has
parameters the Next button will be active. If a command doesn’t
have parameters, only the Finish button will be active.
5. Choose parameters.
As you add parameters,
they are listed here.
6. When the command is complete, click Finish.
1
1
A-7 1
RSView32 commands
= (Equal)
[&]<tag_name> = <expression>
Writes the value resulting from an expression to a tag.
[&]
Forces the command to be executed asynchronously,
which makes the command faster.
<tag_name>
The name of the tag that will store the result of the
expression.
<expression>
A value, string, tag name, or a more complex
expression.
Enclose tag names that contain dashes or start with a
number in braces { } when you use them in an
expression. This distinguishes the characters in the
tag name from the characters in the expression.
Enclose strings in quotes. The string can contain any
character, and can include spaces.
Do not use braces for the tag name before the equal
sign.
You cannot nest braces.
You can attach security to the = (Equal) command just as you can for
any RSView32 command. For more information about security, see
Chapter 10, Adding security.
For more information about expressions, see Chapter 14,
Creating expressions.
1
1
1
A-8
RSView32 commands
Examples: The = (Equal) command
7DJ
7DJ Evaluates the command asynchronously. Increases the value of Tag1
by 1.
7DJ
7DJ
Sets the value of Tag1 to be the same as Tag2.
7DJ
7DJ 7DJ
Adds the values of Tag2 and Tag3 and stores the result in Tag1.
3XPS
^,QGXVWU\` ^3XPS`
Adds the values of Industry-2 and 2Pump and stores the result in
1Pump. Braces surround Industry-2 because of the dash in the name.
Braces surround 2Pump because the name starts with a number. No
braces are used for 1Pump because this name is on the left side of the
equal sign.
7DJ
LI 7DJ 7DJ WKHQ HOVH If Tag1 is less than Tag2, Tag1 is set to 3, but if Tag1 is equal to or
greater than Tag2, Tag1 is set to 4.
7DQN?0HVVDJH
´7DQN 2YHUIORZµ
Writes the string Tank1 Overflow to the Tank1\Message tag.
1
1
A-9 1
RSView32 commands
Abort
Abort [parameter]
Closes one or more windows. Without a parameter, the Abort
command closes the window that has focus.
[parameter]
One of the following:
me
Closes the window from which the command is
executed.
editor
Closes the specified editor, such as a graphic display
or an alarm summary. To name the editor, use the
RSView32 command that opens the editor. See the
examples below.
*
Closes all windows.
Ctrl-F4 also closes the active window.
Examples: The Abort command
$ERUW
Without a parameter, closes the window that has focus.
$ERUW PH
Closes the window from which the command is executed.
$ERUW 'LVSOD\
Closes all open graphic displays.
$ERUW 'LVSOD\ 3XPSV or $ERUW 3XPSV
Closes the graphic display called Pumps.
$ERUW 0RQLWRU
Closes all open tag monitors.
$ERUW Closes all windows.
1
1
1
A-10
RSView32 commands
Account
Account
Opens the User Accounts editor. To prevent security from being
changed at runtime, restrict access to this command.
Acknowledge
Acknowledge [tag_name]
Acknowledges an alarm or a group of alarms. This command gives
no indication that it has run but will display a message if not
executed properly.
If an acknowledge bit is associated with an alarm, acknowledging the
alarm sets the acknowledge bit.
[tag_name]
The name of the tag to be acknowledged. This can be
a tag name, a name with wildcards, or the [tag] literal
string.
If no tag is specified, this command acknowledges the
the most-severe, most-recent unacknowledged alarm.
[tag]
Specifying the word “tag” inside square brackets
acknowledges alarms for the tag associated with the
highlighted object in the active graphic display.
IMPORTANT If alarms are occurring rapidly, don’t run the Acknowledge command
without a tag name. The Acknowledge command could acknowledge a new
alarm rather than the intended alarm.
Examples: The Acknowledge command
$FNQRZOHGJH +RSSHU?)ORZ
Acknowledges all outstanding alarms for the tag Hopper1\Flow.
$FNQRZOHGJH +RSSHU?
Acknowledges all outstanding alarms for all tags in the folder called
Hopper1.
$FNQRZOHGJH Acknowledges all outstanding alarms.
1
1
A-11 1
RSView32 commands
$FNQRZOHGJH >WDJ@
Acknowledges the alarm for the tag associated with the highlighted
object in the active graphic display.
AcknowledgeAll
AcknowledgeAll
Acknowledges all outstanding alarms. This command runs more
quickly than Acknowledge *. It gives no indication that it has run
but will display a message if not executed properly.
If an acknowledge bit is associated with an alarm, acknowledging the
alarm sets the acknowledge bit.
There is no limit to the number of tags that can be acknowledged
with this command.
Activity
Activity
Opens the Activity Log Setup editor.
ActivityBarOff
ActivityBarOff
Hides the activity bar.
ActivityBarOn
ActivityBarOn
Shows the activity bar.
You can undock the activity bar and move it anywhere on the screen.
To move the bar, click between the Clear and Clear All buttons and
drag. To redock the activity bar, click the title bar and drag the bar
until it touches the RSView32 status bar.
To resize the activity bar, drag any corner or edge.
1
1
1
A-12
RSView32 commands
ActivityLogSend
ToODBC
ActivityLogSendToOdbc <data_source> <target_table_name>
[/Wn] [/Uuser_name] [/Ppassword]
Exports activity log data from DBF files to the ODBC database. The
connection to the ODBC database is maintained for the length of
time specified by the wait (/W) parameter.
<data_source> A valid ODBC data source name. If the name has a
space embedded in it, enclose the name in
quotes (“”).
<target_table_ The name of a table in the ODBC database where
name>
the data will be exported. If the table does not exist
RSView32 attempts to create it.
[/Wn]
The time the connection to the ODBC database will
be maintained. If nothing is specified, the wait time
defaults to about 5 minutes. A wait time of zero
keeps the connection open until the project is
stopped.
This parameter allows frequent exports to the
database without having to connect every time. Once
the connection is established, RSView32 waits the
specified time and, if another command is received to
export data, the command is executed and the wait
timer is reset. If no command is received within the
wait time, the connection is closed.
[/Uuser_name]A user ID that is valid on the data source.
[/Ppassword] A password that is valid on the data source.
ActivityOff
ActivityOff
Stops activity logging.
ActivityOn
ActivityOn
Starts activity logging.
Activity logging is on by default.
1
1
A-13 1
RSView32 commands
ActivityPrintOff
ActivityPrintOff
Turns off the printing of activity logging. By default, activity log
printing is turned on when you start an RSView32 project.
ActivityPrintOn
ActivityPrintOn
Turns on the printing of activity logging if it has been turned off by
the ActivityPrintOff command. By default, activity log printing is
turned on when you start an RSView32 project.
ActivityViewer
ActivityViewer
Opens the Activity Log Viewer.
Alarm
Alarm
Opens the Alarm Setup editor.
AlarmEvent
AlarmEvent <EventName> <EventType> [TagType] [/VTagValue]
[/SSeverity] [/H“Timestamp”] [/L“LogMessage”]
Creates an alarm event. Alarm events are not processed unless the
AlarmOn command is issued, and alarm events stop being processed
when the AlarmOff command is issued.
You cannot specify the threshold for an alarm.
<EventName> The name of the alarm event, up to 40 characters
long. The event name must follow the syntax of a tag
name, and can, but need not, be a tag name in the tag
database. The alarm event name cannot be the name
of an alarm tag.
1
1
1
A-14
RSView32 commands
<EventType> The type of alarm transaction, which must be one of
the following:
[IntoAlarm]
or [In]
Indicates that the tag has gone into
alarm.
[OutOfAlarm] Indicates that the tag has gone out of
or [Out]
alarm.
[InAndOut
OfAlarm]
or
[InAndOut]
[TagType]
Indicates that an alarm has occurred,
but the tag is again immediately out of
alarm, such as a digital change-of-state
alarm.
The type of tag which must be one of:
[/A]
Analog
[/D]
Digital
If you don’t specify either /A or /D, the alarm is
assumed to be analog.
[/VTagValue] A floating-point value associated with the alarm
event. If the floating-point value is not specified, the
tag value is 0.0.
If the name of an alarm event is the name of a tag in
the tag database, the value specified by this parameter
will not update the tag’s value in the value table.
[/SSeverity]
The alarm severity. The severity is an integer from 1
to 8. Alarm severity can be specified only for alarm
events of type IntoAlarm, or InAndOutOfAlarm. If
a value is not specified, the alarm severity is 1.
1
1
A-15 1
RSView32 commands
[/HTimestamp]
The time stamp associated with the alarm
transaction, in the format:<HH:MM:SS>[Date]:
<HH:MM:SS> The 24-hour military format for
time. You must use this format for
indicating the time.
[Date]
A date that can be specified in
the same format as the Windows date
style configured for your computer. If
you want to use a VBA program to
set the date, you can use any date
format that conforms to the MFC
class COleDateTime. If you do not
specify a date, the current date is
used.
If you specify a time stamp for an alarm, the alarm
may not appear as the most recent alarm in the
\system\AlarmBanner tag, even if it was logged after
an alarm with a more recent time stamp.
[/LLog
Message]
AlarmLogOff
The alarm message, up to 132 characters long, to be
logged to disk and/or printer. The log message can
contain any of the placeholders available to alarm
messages. If you do not specify a log message, the
user default message is used.
AlarmLogOff
Stops alarm logging.
AlarmLogOn
AlarmLogOn
Starts alarm logging.
Alarm logging is on by default.
1
1
1
A-16
RSView32 commands
AlarmLogRemark
AlarmLogRemark [“Text”] [/P] [/Sn] [/R] [/Ttagname]
Adds the specified text string as a transaction in the alarm log file.
[“Text”]
[/P]
A text string, up to 132 characters long. The text
can contain the following placeholders:
[\D]
the current date
[\T]
the current time
[\N]
the tag name. If the tag is in a local tag
database, you can also use the
placeholders [\S] tag description and
[\U] tag units.
Prompts the operator for a remark at runtime by
displaying a dialog box containing a text box. The
operator can type a remark up to 132 characters long.
The remark can also include the placeholders shown
above.
If both the Text parameter and the /P parameter are
specified, the contents of the Text parameter will
appear in the text field at runtime, and the operator
can modify or add to the contents of the Text
parameter before it is logged to the alarm log file. If
the tag name (/T parameter) is specified, the prompt
dialog box will display the tag name at runtime, but
the operator cannot change the tag name.
[/Sn]
Associates an alarm severity with the remark. The
severity is an integer from 1 to 8. This value is shown
in the Severity column of the alarm log file. If the
remark is logged to a printer, the alarm severity
determines which printer will print the remark.
If both the /P parameter and the /Sn parameter are
specified, the prompt dialog box will display the
alarm severity at runtime, but the operator cannot
change the severity.
1
1
A-17 1
RSView32 commands
AlarmLogSend
ToODBC
[/R]
Logs the remark to a printer as well as to the alarm
log file. If the alarm severity is not specified (/Sn
parameter), the printer for Severity 1 is used. If no
printer is assigned to the specified severity, the alarm
log remark is not printed.
[/Ttagname]
The string that is logged in the Tagname column of
the alarm log file. This string can be a tag name, the
name of a user-generated alarm event, or any other
string that matches the syntax of a tag name. You can
use this parameter to correlate remarks with specific
alarm transactions for generating reports later.
AlarmLogSendToODBC <data_source> <target_table_name>
[/Wn] [/Uuser_name] [/Ppassword]
Exports alarm log data from DBF files to the ODBC database. The
connection to the ODBC database is maintained for the length of
time specified by the wait (/W) parameter.
<data_source> A valid ODBC data source name. If the name has a
space embedded in it, enclose the name in
quotes (“”).
<target_table_ The name of a table in the ODBC database where
name>
the data will be exported. If the table does not exist
RSView32 attempts to create it.
[/Wn]
The time the connection to the ODBC database will
be maintained. If nothing is specified, the wait time
defaults to about 5 minutes. A wait time of zero
keeps the connection open until the project is
stopped.
This parameter allows frequent exports to the
database without having to connect every time. Once
the connection is established, RSView32 waits the
specified time and, if another command is received to
export data, the command is executed and the wait
timer is reset. If no command is received within the
wait time, the connection is closed.
1
1
1
A-18
RSView32 commands
[/Uuser_name]A user ID that is valid on the data source.
[/Ppassword] A password that is valid on the data source.
AlarmOff
AlarmOff
Stops alarm monitoring. Once this command has run, it displays a
message indicating that alarm monitoring has stopped.
AlarmOn
AlarmOn [/H]
Starts alarm monitoring. Once this command has run, it displays a
message indicating that alarm monitoring has started.
[/H]
Turns on handshaking the moment alarm monitoring
starts and sets the handshake bit for any tags in alarm
at that moment.
To have alarming start when a project starts, open the Startup editor
and click the Alarming check box.
AlarmPrintOff
AlarmPrintOff
Stops alarms from printing.
AlarmPrintOn
AlarmPrintOn
Starts alarm printing.
Alarm printing is on by default.
AlarmViewer
AlarmViewer
Opens the Alarm Log Viewer.
1
1
A-19 1
RSView32 commands
AppAbort
AppAbort <application>
Closes the specified Windows application.
<application> The name of a Windows application exactly as it
appears in the application’s title bar.
Example: The AppAbort command
If Notepad is open and contains an untitled file, the Notepad title
bar will read Untitled - Notepad. To close Notepad you must type
exactly what’s in the Notepad title bar as follows:
$SS$ERUW 8QWLWOHG 1RWHSDG
AppActivate
AppActivate <application>
Activates (pulls forward) the specified Windows application. The
application must already be running. (You can use the AppStart
command to start the application.)
<application> The name of the Windows application you want to
activate. Typically, this is the name that appears in the
application’s title bar.
AppStart
AppStart <application>
Runs the specified application, which can be another Windows
application or an “application extender” you’ve programmed.
<application> The path and executable required to start the
program.
1
1
1
A-20
RSView32 commands
Examples: The AppStart command
$SS6WDUW FZLQGRZV?QRWHSDG F?DXWRH[HFEDW
Opens Notepad and displays the autoexec.bat file.
$SS6WDUW F?3URJUDP )LOHV?3OXV?0LFURVRIW
,QWHUQHW?,H[SORUHH[H
Opens Internet Explorer.
Beep
Beep
Runs a wave file to produce a sound from the computer speaker. The
sound is a wave file assigned to the Default Beep in the Windows
Control Panel.
Channel
Channel
Opens the Channel editor.
Class
Class
Opens the Scan Class editor.
CommandLine
CommandLine
Opens the command line.
ComStatus
ComStatus
Obsolete. Use ComStatusOff or ComStatusOn.
1
1
A-21 1
RSView32 commands
ComStatusOff
ComStatusOff
Stops logging of communication errors.
ComStatusOn
ComStatusOn
Starts logging of communication errors if RSView32 is set up to do
so.
To log communication errors, ensure the Communications category
is selected in the Activity Log Setup editor.
To have error logging automatically start when a project starts, open
the Startup editor and click the Communication Status check box.
Database
Database
Opens the Tag Database editor.
DatabaseSync
DatabaseSync
Makes RSView32 convert the tag database into binary format the
next time the project opens. Use this command if you change the tag
database that a project uses (using the Project Paths dialog box), after
changing a node’s data source, or after changing a direct driver’s
device type.
To synchronize the tag database:
1. On the command line type DatabaseSync, and then press Enter.
2. Close the project.
3. Open the project. The database will be synchronized as the
project opens.
1
1
1
A-22
RSView32 commands
DataLog
DataLog [file]
Without the parameter, opens the Data Log Setup editor. With the
parameter, opens the specified data log file.
[file]
DataLog
ChangeRate
DataLogMerge
ToPrimary
The name of a data log model you want to edit in the
Data Log Setup editor. If you don’t specify a file
name, the editor opens so you can create a new model
file.
DataLogChangeRate <file> <value> [unit]
Changes the periodic log rate. The change affects the current logging
session only, and won’t be retained if data logging is stopped and
restarted.
<file>
The name of a data log model, without a file
extension.
<value>
The numeric portion of the time interval for the log
rate. For example, if you want to log data every 20
seconds, the value is 20. The value must be an integer
from 1 to 64,000.
[unit]
The time unit of the log rate: hundredths, tenths,
seconds, minutes, hours, or days. If you omit the
[unit] parameter, the default is seconds.
DataLogMergeToPrimary <parameter>
Moves data from the secondary or backup path to the primary path
or ODBC database, for a specified model or for all models that are
currently running.
<file>
The name of a data log model without a file
extension.
*
Moves data for all models that are currently running.
1
1
A-23 1
RSView32 commands
You can use the DataLogMergeToPrimary<file> command whether
or not the specified model is running. If a model is running when
you issue the DataLogMergeToPrimary command, RSView32
switches back to the primary path or ODBC database. If a model
uses the .dbf format, RSView32 moves all files on the secondary path
(including the current file set) to the primary path, begins a new file
set on the primary path, and continues logging to the new file set. If
a model uses the ODBC format, RSView32 merges the ODBC
backup files into the ODBC database and continues logging to the
ODBC database.
DataLogNewFile
DataLogNewFile <parameter>
Creates a new data log file for the specified model or for all models,
on the path RSView32 is currently logging to (either the primary
path or the backup path). If RSView32 is logging to an ODBC
database, RSView32 logs an End snapshot and then a Begin snapshot
when you issue this command.
DataLogOff
<file>
The name of the data log model without a file
extension.
*
Creates new files for all models that are currently
running.
DataLogOff <parameter>
Stops data logging for a specified model or stops data logging for all
models.
1
1
1
A-24
<file>
The name of a data log model without a file
extension.
*
Stops data logging for all models.
RSView32 commands
DataLogOn
DataLogOn <file>
Starts data logging for the specified model.
<file>
The name of a data log model without a file
extension.
To have data logging automatically start when a project starts, open
the Startup editor, click the Data Logging check box and specify a
file.
DataLogPath
DataLogPath <file>
Opens the Data Log Path editor. You can use the editor to change
the primary and secondary paths for dBASE IV data log models, and
the backup path for ODBC data log models. You cannot change the
ODBC database using the Data Log Path editor.
<file>
DataLog
RenameFile
The name of a data log model without a file
extension.
DataLogRenameFile <file> <LogFileIDString>
Changes the log file identifier string that is used as part of the file
name for dBASE IV log files and ODBC backup files that use long
file names. The change affects the current logging session only,
including the current set of log files.
<file>
The name of a data log model, without a file
extension.
<LogFileID
String>
The log file identifier string, up to 20 characters.
1
1
A-25 1
RSView32 commands
DataLogSnapshot
DataLogSnapshot <parameter>
Logs one snapshot of data to the data log file, for the specified model
or all models.
<file>
The name of the data log model without a file
extension.
*
Logs a snapshot of data for all models that are
running.
IMPORTANT The data log model must be running before the DataLogSnapshot
command is issued.
DataLog
SwitchBack
DDEExecute
DataLogSwitchBack <parameter>
Switches data logging back to the primary dBASE IV file path or
ODBC database for the specified model or for all models. This
command switches data logging for a model only if the model is
running, RSView32 is logging data to the secondary or backup path,
and the primary path or ODBC database is available. For .dbf files,
RSView32 creates a new set of files when it switches back to the
primary path.
<file>
The name of the data log model without a file
extension.
*
Switches data logging for all models that meet the
conditions outlined above.
DDEExecute <application>|<topic> <command>
Sends a command or series of commands to an application through a
DDE channel.
<application> The name of the server application you want to send
a command to. This is usually the name of the
application’s .exe file without the .exe extension.
<topic>
1
1
1
A-26
The name of the subject of the communication,
preceded by the | character. Many applications that
support DDE recognize a topic named System,
which is always available.
RSView32 commands
<command>
A command or series of commands recognized by the
server application. Multiple commands must be in
one string.
If the command string contains an exclamation mark (!), enclose the
string in quotes. If the string includes quotes, use double quotes.
IMPORTANT Before using the DDEExecute command, the server application must be
running (but it can be minimized).
Examples: The DDEExecute command
''(([HFXWH 56OLQ[_BB'ULYHUV >:KRB$FWLYH@
Sends the Who_Active command, which displays the default RSLinx
RSWho window.
Drivers must be preceded by two underscores.
''(([HFXWH :,1$%_6<67(0 65 Sends WINtelligent LOGIC 5Z (WINAB5) the Dot command
SR 3, which means search for Rung 3.
''(([HFXWH :,1$%_6<67(0 8,
Sends WINtelligent LOGIC 5 (WINAB5) the Dot command UI,
which displays the System Information window.
''(([HFXWH :LQUHFLS_,FRP'GH([H
>&21752/B3$1(/B'()$8/76 @
Sends WINtelligent RECIPEZ the
CONTROL_PANEL_DEFAULTS command, which opens the
default WINtelligent RECIPE Control Panel.
1
1
A-27 1
RSView32 commands
DDEPokeDisable
DDEPokeDisable
Obsolete. Use RTDataWriteDisable.
DDEPokeEnable
DDEPokeEnable
Obsolete. Use RTDataWriteEnable.
DDEServerOff
DDEServerOff
Obsolete. Use RTDataServerOff.
DDEServerOn
DDEServerOn
Obsolete. Use RTDataServerOn.
Define
Define <symbol> [string]
Creates a symbol. A symbol is an abbreviation for a command or a
command with parameters. The symbol can be used anywhere a
command can be used. You cannot nest symbols.
Symbol definitions are valid only during the current session; they
must be re-defined each time RSView32 is restarted. Symbols are
typically defined in a startup or login macro.
<symbol>
The abbreviated command. It cannot contain spaces.
[string]
An existing command with or without parameters. It
can contain spaces and other non-alphanumeric
characters. Omitting the [string] parameter deletes
the symbol definition.
See also Undefine.
1
1
1
A-28
RSView32 commands
Examples: The Define command
'HILQH 'L 'LVSOD\
Creates the symbol Di for the command Display. Typing Di as a
command in any valid command syntax will have the same effect as
typing Display.
'HILQH 6KRZ 'LVSOD\ 2YHUYLHZ &&
Creates the symbol Show for the command Display Overview /CC.
Whenever Show is used, the graphic called Overview is displayed in
the center of the screen.
'HILQH 'L
Deletes the symbol Di.
Derived
Derived [file]
In edit mode, without the parameter opens the Derived Tag editor.
With the parameter, opens the specified derived tag file.
[file]
DerivedOff
The name of a derived tag file without a file
extension.
DerivedOff <file>
Stops running the specified derived tag file.
<file>
The name of a derived tag file without a file
extension.
1
1
A-29 1
RSView32 commands
DerivedOn
DerivedOn <file>
Starts running the specified derived tag file.
<file>
The name of a derived tag file without a file
extension.
To have a derived tag file automatically start when a project starts,
open the Startup editor, click the Derived Tags check box and specify
a file.
Display
Display <file> [/B] [/E] [/U] [/O] [cache] [/Pfile] [/Ttag_name]
[/Hnnn] [/Wnnn] [/Min] [/Max] [position]
Runs the specified graphic display file. Parameters specified here
override settings in the Display Settings dialog box in the Graphic
Display editor.
If you are using the Cache After Displaying option in the Display
Settings dialog to cache displays, use the position parameters with
the Display command to ensure that displays open in the correct
position after caching. Otherwise, if a user moves a display at
runtime, the new position is remembered by the cache option.
Do not cache more than 40 displays using the [cache] parameter
and/or the Cache After Displaying option.
1
1
1
A-30
<file>
The name of a graphic display file without a file
extension.
[/B]
Displays the specified graphic display in the
background.
[/E]
Disables the Enter key so it does not download
values in numeric input fields to the programmable
controller or server, unless the Display On-Screen
Keyboard option is selected (in the Behavior tab of
the Display Settings dialog box).
[/U]
Updates tag values in all input fields when the display
first opens.
[/O]
Suppresses the display of the key list.
RSView32 commands
[cache]
Specifies how to load the specified graphic display
into the display cache, as follows:
/Z
Loads the specified graphic display
into the cache (but does not make it
visible), so the display appears
quickly when it is first used.
/ZA
Loads the specified graphic display
into the cache (but does not make it
visible) and continually updates the
graphic display, even when it is not
visible. For example, use /ZA for a
display that contains a realtime trend,
so that the trend displays data for its
entire time range when you view it.
To remove all displays from the cache, use the
FlushCache command. To remove a particular
display from the cache, use the FlushCache [file]
command.
[/Pfile]
The name of the parameter file that contains the tag
names to be substituted for placeholders in the
display. If the display does not contain placeholders,
do not use this parameter.
If the parameter file has a long file name, enclose the
file name in quotes, for example /P“Long file name”.
[/Ttag_name] One or more tags, separated by commas and no
spaces, to be substituted for placeholders in the
display. If the display does not contain placeholders,
do not use this parameter.
[/Hnnn]
Specifies the height of the graphic display in pixels.
[/Wnnn]
Specifies the width of the graphic display in pixels.
[/Min]
Runs the graphic display minimized (as an icon).
[/Max]
Runs the graphic display maximized (full-screen
size).
1
1
A-31 1
RSView32 commands
[position]
Specifies the position of the window as follows:
/Q1
top right corner
/Q2
top left corner
/Q3
bottom left corner
/Q4
bottom right corner
/CT
centered in the top half
/CB
centered in the bottom half
/CL
centered on the left side
/CR
centered on the right side
/CC
centered in the screen
/Xnnn
nnn pixels from the left edge
/Ynnn
nnn pixels down from the top
Examples: The Display command
'LVSOD\ 6DPSOH
The first time the graphic display called Sample is opened, it will be
positioned and sized as specified in its Display Settings dialog box.
When the display is closed, its size and position will be saved, so the
next time it is opened it will be the same size and position as when it
was last closed.
'LVSOD\ 3LFWXUH 31DPHV &%
Positions the graphic display called Picture in the bottom half of the
screen, using the file called Names to replace tag placeholders with
tag names.
'LVSOD\ 3LFWXUH + : &&
Makes the graphic display called Picture 300 pixels high and 400
pixels wide, and positions the display in the center of the screen.
1
1
1
A-32
RSView32 commands
Example: Replacing tag placeholders in a graphic display
If a graphic display called Canning uses three tag placeholders, and
you want to substitute tags for canning corn, you would type:
'LVSOD\ &DQQLQJ 7FRUQ?RIIFRUQ?RQFRUQ?ZHLJKW
Placeholder #1 is replaced by the corn\off tag, placeholder #2 is
replaced by the corn\on tag, and placeholder #3 is replaced by the
corn\weight tag.
Download
Download
Writes the value in the selected input field of the active graphic
display to the programmable controller or server.
This command operates on the active graphic display. If no display is
active, this command is ignored.
Ctrl-PgDn also downloads the value in the selected input field.
The Enter key also downloads the value in the selected input field.
However, if the /E parameter is used with the Display command, the
Enter key is disabled, unless the Display On-Screen Keyboard
option is selected (in the Behavior tab of the Display Settings dialog
box). If the selected input field is a recipe field, pressing the Enter
key opens the Recipe dialog box.
1
1
A-33 1
RSView32 commands
DownloadAll
DownloadAll
Writes the values in all input fields of the active graphic display to
the programmable controller or server.
This command operates on the active graphic display. If no display is
active, this command is ignored.
PgDn also downloads all the values in the input fields.
DriverPrimary
DriverPrimary <channel>
Switches from the secondary driver to the primary driver on the
specified channel.
<channel>
DriverSecondary
The number of the channel (1 through 4) that is being
switched from its secondary to primary driver.
DriverSecondary <channel>
Switches from the primary driver to the secondary driver on the
specified channel.
<channel>
DriverToggle
The number of the channel (1 through 4) that is being
switched from its primary to secondary driver.
DriverToggle <channel>
Switches from the current driver to the one not being used on the
specified channel.
<channel>
1
1
1
A-34
The number of the channel (1 through 4) that is being
switched from one driver to another.
RSView32 commands
EchoOff
EchoOff
Stops logging commands to the activity log file. Other activities,
such as errors and tag values, are still logged.
This command is normally used in macros to prevent the contents of
the macro from being logged.
EchoOn
EchoOn
Restores logging to normal after an EchoOff command.
Event
Event [file]
In edit mode, without the parameter, opens the Events editor; with
the parameter, opens the specified event file.
[file]
EventOff
The name of an event file without a file extension.
EventOff <file>
Stops running the specified event file.
<file>
EventOn
The name of an event file without a file extension.
EventOn <file>
Starts running the specified event file.
<file>
The name of an event file without a file extension.
To have an event file automatically start when a project starts, open
the Startup editor, click the Event Detector check box and specify a
file name.
1
1
A-35 1
RSView32 commands
FlushCache
FlushCache [file]
Without the parameter, unloads all graphic displays from the display
cache. With the parameter, unloads the specified graphic display
from the display cache.
[file]
The name of a graphic display file without a file
extension.
Displays can be added to the cache by using the [cache] parameter
with the Display command or by selecting the Cache After
Displaying option in the Display Settings dialog box of the Graphic
Display editor. You can cache up to 40 graphic displays.
If a display uses the Always Updating option with the Cache After
Displaying option, the display’s shutdown command is executed
when you issue the FlushCache command.
Graphic
Graphic [file]
In edit mode, without the parameter, opens the Graphic Display
editor; with the parameter, opens the specified graphic display file.
[file]
HandshakeOff
The name of a graphic file without a file extension.
HandshakeOff
Disables alarm handshaking, regardless of whether the individual
handshake bits are configured. This command gives no indication
that it has run but will display an error message if not executed
properly.
1
1
1
A-36
RSView32 commands
HandshakeOn
HandshakeOn
Enables alarm handshaking. By default this setting is off.
Handshaking can be disabled with the HandshakeOff command.
This command gives no indication that it has run but will display a
message if not executed properly.
IMPORTANT This command will not set the handshake bit for any tag already
in alarm when the command is executed.
Help
Help [word] [/Ffile]
Displays a Windows help file.
[word]
A word you want to search for in the help file. When
you specify a search word, the command will either:
open the help file at a topic if the word uniquely
identifies that topic
open a list of related topics
[/Ffile]
The name of a Windows help file. The default help
file is for RSView32.
If no search word is specified, the command opens the RSView32
help file and displays the Contents topic.
Example: Opening Help for the RSGauge ActiveX object
+HOS IF?ZLQGRZV?V\VWHP?56*DXJHKOS
Opens the RSTools help file for the RSGauge ActiveX object.
1
1
A-37 1
RSView32 commands
Identify
Identify [tag_name]
Runs the command or macro associated with the named tag, whether
or not the tag is in alarm.
[tag_name]
The name of the tag in alarm. The command or
macro associated with this tag will run. If no tag
name is specified, the Identify command runs the
command or macro associated with the most recent,
most severe unacknowledged alarm.
[tag]
Specifying the word “tag” inside square brackets runs
the identify command for the tag associated with the
highlighted object in the active graphic display.
Running the Identify command is not the same as acknowledging an
alarm.
IMPORTANT When many alarms are occurring rapidly, do not use the Identify
command without a tag name. A new alarm could become the current
alarm before the Identify command runs, and the command or macro that
runs might not be the one expected.
Examples: The Identify command
,GHQWLI\ +RSSHU?'LYLGHU
Runs the Identify command or macro for the tag Hopper1\Divider,
whether or not the tag is in alarm.
,GHQWLI\ >WDJ@
Runs the Identify command or macro for the selected tag in the
active graphic display.
,GHQWLI\
Runs the Identify command or macro for the most recent, most
severe unacknowledged alarm.
1
1
1
A-38
RSView32 commands
Invoke
Invoke <parameter>
Use this command with ActiveX objects. Use the command to:
call an object’s method
assign the value returned by a method to a tag
set an object’s property to a tag value or a constant
set a tag to the value of an object’s property
The easiest way to specify the <parameter> string for the Invoke
command is to use the Command Wizard.
The syntax for this command has four variations:
file.object.method(parameter1, parameter2, . . .) calls an object’s
method
file
The name of the graphic display that contains the
ActiveX object
me
An alternative to using file. At runtime it resolves
to the graphic file that has focus.
object
The name of the ActiveX object as specified in the
Object Name dialog box in the Graphic Display
editor.
method
The name of a function or sub-routine in the
ActiveX object. The method is initiated by an
external event such as the Invoke command.
parameter
The tag name or constant that the method will use.
You must specify all of the parameters, even those
that are optional.
tag_name=file.object.method(parameter1, parameter2, . . .) assigns
the value returned by a method to the specified tag
tag_name
The name of the tag to which the value returned
by the method will be assigned.
file.object.property(tag_name or constant) sets an object’s property
to the specified tag’s value or to a constant value
tag_name=file.object.property sets the specified tag’s value to the
value of the object’s property
1
1
A-39 1
RSView32 commands
Key
Key <parameter>
Starts or stops running the global key file.
<parameter> One of the following:
file
The name of a global key file without a file extension.
/R
Stops running the global key file.
To have a global key file automatically start when a project starts,
open the Startup editor, click the Global Key File check box and
specify a file.
KeyEdit
KeyEdit [file]
Without the parameter, opens the Global Key editor. With the
parameter, opens the editor and the specified file.
[file]
Login
The name of a key file without a file extension.
Login [username] [password]
Logs users into the system. To log in, users must have an account in
the User Accounts editor.
[username]
The user’s name as defined in the User Accounts
editor.
[password]
The user’s password as defined in the User Accounts
editor. If this parameter is omitted, a window appears
prompting the user to enter the password.
Using this command with both parameters logs the user into the
system. Using this command with only one parameter displays the
login dialog box.
1
1
1
A-40
RSView32 commands
Logout
Logout
Logs the current user off the system.
MacroEdit
MacroEdit [file]
Without the parameter, opens the Macro editor. With the parameter,
opens the specified macro file.
[file]
Monitor
The name of a macro file without a file extension.
Monitor [file][/Xnnn] [/Ynnn][/Ttag_name]
In edit mode, without the [file] parameter, opens the Tag Monitor
editor; with the [file] parameter, opens the specified tag monitor file.
In run mode, with the [file] parameter, opens the specified tag
monitor file. With the [/Ttag_name] parameter, opens a tag monitor
containing the specified tags.
[file]
The name of a tag monitor file without a file
extension.
[/Xnnn]
Positions the tag monitor nnn pixels from the left
edge of the screen. The width depends on screen
resolution.
[/Ynnn]
Positions the tag monitor nnn pixels from the top
edge of the screen. The height depends on screen
resolution.
[/Ttag_name] The name of a tag. You can use wildcards and can
name more than one tag. Precede each tag name with
a space and /T.
You can monitor up to 100 tags in one file.
1
1
A-41 1
RSView32 commands
Examples: The Monitor command
0RQLWRU 7+RSSHU?)ORZ
Opens a tag monitor displaying the tag Hopper1\Flow.
0RQLWRU 7+RSSHU?)ORZ 7+RSSHU?7HPS
Opens a tag monitor displaying the tags Hopper1\Flow and
Hopper\Temp.
0RQLWRU 7
Displays information on the first 100 tags in the tag database.
0RQLWRU 7+RSSHU?'LYLGHU
Displays information on the first 100 tags called Divider from all
folders beginning with Hopper.
0RQLWRU %UHDG
Displays the tag monitor file called Bread.
NextPosition
NextPosition
Moves focus to the object with the next highest index number.
This command operates on the active graphic display. If no display is
active, this command is ignored.
Tab also moves focus to the object with the next highest index
number.
See also Position and PrevPosition.
1
1
1
A-42
RSView32 commands
NextWindow
NextWindow
Moves focus to another open graphic display.
Ctrl-Tab and Ctrl-F6 also move focus to another open graphic
display.
See also PrevWindow.
Node
Node
Opens the Node editor.
NodeDisable
NodeDisable <node name>
Disables the specified node.
<node name> The name of the node you want to disable.
NodeEnable
NodeEnable <node name>
Enables the specified node.
<node name> The name of the node you want to enable.
NodeSwitch
NodeSwitch <node name> <parameter>
Permanently changes a device node’s address, an OPC node’s
computer name, server name, and access path, or a DDE node’s
application and topic.
<node name> The name of the node that you want to switch to
another programmable controller address, server, or
application.
1
1
A-43 1
RSView32 commands
<parameter> One of the following:
station
For device nodes, the physical address for the
programmable controller you want to switch to.
\\computer
name\server
name[|access
path]
For OPC servers, the computer name, server name,
and access path (if in use) for the OPC server you
want to switch to. Separate the access path from the
server name with the | character.
application|
topic
For DDE servers, the application and topic, separated
by the | character, for the DDE server you want to
switch to.
When you use the NodeSwitch command to change a node’s address
or server information, the change appears in the Node editor’s
spreadsheet. If the Node editor is open when you use the command,
the change won’t appear until you’ve refreshed the display by
closing and re-opening the editor.
Parameter
Parameter [file]
In edit mode, without the parameter, opens the Parameter editor;
with the parameter, opens the specified parameter file.
[file]
Password
The name of a parameter file without a file extension.
Password
Displays the Password dialog box so users can change their
password. Users must already be logged in to use this command.
1
1
1
A-44
RSView32 commands
Pause
Pause <seconds>
Specifies a pause between the execution of two commands. You can
use this command in macros, from the command line, or as an action
for a button.
All commands or macros that follow the Pause command must not
be asynchronous (preceded by the & sign), otherwise the Pause
command has no effect.
<seconds>
PlayWave
The number of seconds that will elapse between the
execution of the first and second command.
PlayWave <file>
Plays the specified wave file.
<file>
Position
The complete path to the wave file, including the
.wav extension.
Position <n>
Moves focus to the object with the specified index number.
<n>
The object’s index number.
These are the objects that use index numbers:
numeric and string input objects
buttons
objects to which you have assigned object keys
This command operates on the active graphic display. If no display is
active, this command is ignored.
See also PrevPosition and NextPosition
1
1
A-45 1
RSView32 commands
PrevPosition
PrevPosition
Moves focus to the object with the previous index number.
This command operates on the active graphic display. If no display is
active, this command is ignored.
Shift-Tab also moves focus to the object with the previous number.
See also Position and NextPosition.
PrevWindow
PrevWindow
Moves focus to another open graphic display.
Ctrl-Shift-Tab and Ctrl-Shift-F6 also move focus to another open
graphic display.
See also NextWindow.
PrintDisplay
PrintDisplay [parameter] [/Wait=tttt] [/U] [/Pfile] [/Ttag_name]
Prints the specified graphic display to the default printer. If no
display is specified, prints the display that has focus.
1
1
1
A-46
[parameter]
Specifies which graphic display to print, as follows:
file
The name of a graphic display file
without a file extension.
me
The current graphic display (the
display from which the command
is executed).
[/Wait=tttt]
Specifies the amount of time to wait before starting to
print, where tttt is the time in milliseconds. If you use
the /U parameter, specify enough time to allow for
the upload of tag values. If you do not specify a time,
the default is 2000 milliseconds.
RSView32 commands
[/U]
Initiates an update of tag values in all input fields
before starting to print. This parameter is not
necessary with input fields that are updated
continuously.
[/Pfile]
Specifies the name of a parameter file that contains
tag names to be substituted for placeholders in the
display.
[/Ttag_name] Specifies one or more tag names to be substituted for
placeholders in the display. Separate multiple tag
names with commas; do not use spaces.
If the specified display is not currently visible, RSView32 prints the
display without making it visible. If this command is issued without
specifying a display, and no display has focus, RSView32 logs an
error to the activity log.
PrintDisplay prints the entire runtime display, even if parts are
covered by other displays. However, PrintDisplay does not
necessarily print ActiveX or OLE objects in their runtime state.
The ScreenPrint command prints an image of whatever shows on the
monitor. Use ScreenPrint to ensure that the display is printed
showing all objects in their current, runtime state (provided they are
not covered by other displays).
If you issue the PrintDisplay command when RSView32 is in Edit
mode, RSView32 sends the last-saved version of the display file to
the printer. Any changes you make after saving the display are not
reflected in the printout. To ensure the printout is up-to-date, save
the display before printing it.
Project
Project
Obsolete. Use ProjectHide, ProjectRun, ProjectShow, or
ProjectStop.
1
1
A-47 1
RSView32 commands
ProjectHide
ProjectHide
Hides the Project Manager so it is not visible on the screen.
Ctrl-Alt-P also hides the Project Manager if it is visible.
ProjectRun
ProjectRun
Starts running the project. This is the same as choosing the Run
Project button in the Run Mode tab of the Project Manager.
ProjectShow
ProjectShow
Displays a hidden Project Manager.
Ctrl-Alt-P also shows the Project Manager if it is hidden.
ProjectStop
ProjectStop
Stops running the project. This is the same as choosing the Stop
Project button in the Run Mode tab of the Project Manager.
PullForward
PullForward <file>
Moves the specified graphic display in front of all other windows. If
the specified graphic display is of the Replace or Overlay type, and a
display of the On Top type is open, PullForward positions the
specified display behind the back-most On Top display and gives the
specified display focus.
<file>
The name of an open graphic display file without a
file extension.
If the specified display is of the Replace or Overlay types, and if no
other Replace or Overlay displays are open, nothing happens when
you issue this command.
1
1
1
A-48
RSView32 commands
PushBack
PushBack <file>
Moves the specified graphic display behind all other windows. If the
specified graphic display is of the On Top type, PushBack positions
the display behind any other open On Top displays, and in front of
any open displays of the Replace or Overlay type.
<file>
The name of an open graphic display file without a
file extension.
If the specified display is of the On Top type, and if no other On
Top displays are open, nothing happens when you issue this
command.
Quit
Quit [/R]
Quits RSView32, stopping all project components, and returns to
Windows.
[/R]
Ramp
Restarts the computer.
Ramp [/V] <tag_name> <value>
Increases or decreases a tag value by a particular value or by another
tag’s value.
Use this command only with analog tags.
[/V]
Performs a read immediately after the write to verify
that the value was altered in the programmable
controller or server.
This parameter is useful if the network is in poor
condition or susceptible to noise interference.
If the verification fails, the error message is logged to
the activity log, activity bar, or printer using the Tag
Write category. Specify where to send Tag Write
errors using the Categories tab of the Activity Log
Setup editor.
<tag_name>
The name of an analog tag.
1
1
A-49 1
RSView32 commands
<value>
The amount to add or subtract from the current
programmable controller value, as follows:
plus (+) or minus (-) a numeric value
plus (+) or minus (-) a percentage of a numeric
value in the form: +value%
plus (+) or minus (-) a tag
If Ramp calculates a value that is outside of the tag’s minimum and
maximum range, it will write the highest or lowest allowable value to
the programmable controller or server.
IMPORTANT If you use the Ramp command in a macro, you must use two percent
signs (%%) instead of one. A single percent sign is used in a macro to
indicate a parameter. For example, to create a macro that increases the
value of tag1 by 75%, you would type: Ramp tag1 + 75%%
Examples: The Ramp command
5DPS +RSSHU?/HYHO If the value of Hopper1\Level is 100, Min = -100 and Max = 900, the
command writes the value 600 to the programmable controller.
5DPS +RSSHU?/HYHO If Hopper1\Level is 900, Min = 0 and Max = 1000, the command
writes 1000 to the programmable controller because this is the
highest allowable value.
5DPS +RSSHU?/HYHO GHOWD
If Hopper1\Level is 1000 and delta is -200, the command writes 800
to the programmable controller.
RecipeEdit
RecipeEdit [file]
Without the parameter, opens the Recipe editor. With the parameter,
opens the specified recipe file.
[file]
1
1
1
A-50
The name of a recipe file without a file extension.
RSView32 commands
RecipeRestore
RecipeRestore <file>
Reads the values from a recipe file into all input fields in the active
graphic display. This command is used with the Recipe field.
<file>
The name of the file, without a file extension, tag
values are read from.
This command operates on the active graphic display. If no display is
active, this command is ignored.
RecipeSave
RecipeSave <file>
Saves the values in all input fields of the active graphic display to a
recipe file. This command works with the Recipe field.
<file>
The name of the file, without a file extension, to
which the values will be saved. If a file of this name
does not exist, it is created. If a file of this name does
exist, this command prompts you to overwrite it.
This command operates on the active graphic display. If no display is
active, this command is ignored.
Remark
Remark <comment>
Writes a text string to an activity log file, which is useful for
operators to store comments.
<comment>
A string up to 132 characters long. The string can
contain any characters, including spaces. Enclose the
exclamation mark (!) and the semi-colon (;) in single
or double quotes.
To log comments, the Remarks category must be selected in the
Activity Log Setup editor.
RTDataServerOff
RTDataServerOff
Stops running the RSView32 realtime data server.
1
1
A-51 1
RSView32 commands
RTDataServerOn
RTDataServerOn [/Quiet] [/NetDDE]
The RSView32 OPC or DDE server is also known as the realtime
data server. This command runs the RSView32 realtime data server,
allowing OPC and DDE client applications to read (but not write)
tag values.
To enable writes, use the RTDataWriteEnable command.
RTDataWrite
Disable
[/Quiet]
Makes RSView32 use the current Remote Users
accessibility setting in the Windows Registry.
Without this parameter or if the setting is not
configured correctly, RSView32 displays a dialog box
that allows you to specify the setting when you issue
the command.
[/NetDDE]
Enables RSView32 as a NetDDE server to remote
DDE clients. If the realtime data server is already
running, this parameter is ignored.
RTDataWriteDisable [/Quiet] [/NetDDE]
Disables writes by external Windows applications running OPC or
DDE, so these applications cannot change tag values in RSView32.
The RSView32 OPC or DDE server is also known as the realtime
data server. If the RSView32 realtime data server is not running—that
is, if the RTDataServerOn command has not been
run—RTWriteDisable also starts the RSView32 realtime data server.
1
1
1
A-52
[/Quiet]
Makes RSView32 use the current Remote Users
accessibility setting in the Windows Registry.
Without this parameter or if the setting is not
configured correctly, RSView32 displays a dialog box
that allows you to specify the setting when you issue
the command.
[/NetDDE]
Enables RSView32 as a NetDDE server to remote
DDE clients. If the realtime data server is already
running, this parameter is ignored.
RSView32 commands
By default, writes are disabled. Therefore, the RTDataWriteDisable
command is required only after the RTDataWriteEnable command
has been used.
RTDataWrite
Enable
RTDataWriteEnable [/Quiet] [/NetDDE]
Enables writes by external Windows applications using OPC or
DDE, so these applications can change tag values in RSView32.
The RSView32 OPC or DDE server is also known as the realtime
data server. If the RSView32 realtime data server is not running—that
is, if the RTDataServerOn command has not been
run—RTDataWriteEnable also starts the RSView32 realtime data
server.
[/Quiet]
Makes RSView32 use the current Remote Users
accessibility setting in the Windows Registry.
Without this parameter or if the setting is not
configured correctly, RSView32 displays a dialog box
that allows you to specify the setting when you issue
the command.
[/NetDDE]
Enables RSView32 as a NetDDE server to remote
DDE clients. If the realtime data server is already
running, this parameter is ignored.
By default, writes are disabled.
ScreenPrint
ScreenPrint
Generates a screen print on the default printer specified in Windows.
See also PrintDisplay.
Security
Security
Opens the Security Codes editor. To prevent users from changing
security at runtime, restrict access to this command.
1
1
A-53 1
RSView32 commands
SendKeys
SendKeys <“keystring”>
Sends the specified keystrokes to the active window.
<“keystring”> A list of keys. The quotes must be included.
The following syntax rules apply:
Use braces { } to enclose special keys, such as F3 or Enter; for
example, “{Enter}” sends Enter.
Use ^ to send a control key. For example, “^{F2}” sends Ctrl-F2.
Use + to send a shift key. For example, “+{F3}” sends Shift-F3.
Use % to send an alt key. For example, “%A” sends Alt-A.
Special keys can be in upper and/or lower case letters. You can type
any of the following to represent the special keys on the keyboard:
Backspace, BkSp, BS
End
Enter
Escape, Esc
Delete, Del
Down
F1 to F12
Home
Set
Insert
Left
PgDn
PgUp
PrtSc
Right
Tab
Up
[&]Set [/V] <tag_name> <value>
Writes a value to a tag.
IMPORTANT If a node has been disabled, the Set command changes the value in the
value table but not in the programmable controller.
[&]
1
1
1
A-54
Forces the command to be executed asynchronously,
which makes the command faster.
RSView32 commands
[/V]
Performs a read immediately after the write to verify
that the value was altered in the programmable
controller or server.
This parameter is useful if the network is in poor
condition or susceptible to noise interference.
If the verification fails, the error message is logged to
the activity log, activity bar, or printer using the Tag
Write category. Specify where to send Tag Write
errors using the Categories tab of the Activity Log
Setup editor.
<tag_name>
The name of a tag.
<value>
One of the following:
For analog tags:
Numeric value within the range specified by the tag’s minimum
and maximum values.
Percentage of the total min/max range. The formula is:
value = min + percentage/100 * (max - min)
Tag name of another analog or digital tag.
For digital tags:
Numeric value of 0 or 1.
Tag’s on or off label specified in the tag database. Setting a digital
tag to its on label writes the value 1, and setting the tag to its off
label writes the value 0.
Name of another analog or digital tag. If it is an analog tag with a
value that is not 0, the value 1 is written to the digital tag,
otherwise the value 0 is written.
For string tags:
String enclosed in quotation marks. The string can contain any
character and can include spaces.
Name of another string tag.
1
1
A-55 1
RSView32 commands
Examples: The Set command
6HW +RSSHU?)ORZ Hopper1\Flow is a tag. This command writes the value k10” to the
programmable controller or server.
6HW +RSSHU?/HYHO Hopper1\Level is a tag with the minimum specified as -100 and the
maximum defined as 900. This command writes the value k400” to
the programmable controller or server.
6HW 9DOYH? RSHQ
Valve\23 is a digital tag with its on label configured as open. This
command uses the on label for the tag to write the value “1” to the
programmable controller or server.
6HW +RSSHU?/HYHO 3UHVHW
Hopper1\Level is a tag and Preset is a tag with a value of “90.” This
command writes “90” to the programmable controller or server.
6HW 6WULQJ?VWULQJ ´RSHQµ
String\string1 is a string tag. This command writes “open” to the
programmable controller or server.
SetFocus
SetFocus <file>
Sets the focus to a particular graphic display.
<file>
1
1
1
A-56
The name of a graphic display file without a file
extension.
RSView32 commands
Silence
Silence <tag_name>
If the alarm for the specified tag is configured to use the internal bell,
this command silences the computer’s sound.
If the alarm for the specified tag is configured to use the external bell,
this command resets the tag associated with the external bell and
silences the associated audio device.
<tag_name>
SilenceAll
The name of a tag that is in alarm. You can use
wildcards.
SilenceAll
Silences the internal and external bells for all tags in alarm.
Using this command is faster than using the Silence command with
the asterisk (*) wildcard.
StartupConfig
StartupConfig
Opens the Startup editor.
Summary
Summary <file> [/Xnnn] [/Ynnn]
Runs the specified alarm summary file.
<file>
The name of an alarm summary file without a file
extension.
[/Xnnn]
Positions the X coordinate of the alarm summary
window to nnn pixels from the left edge of the
screen. Valid range depends on screen resolution.
[/Ynnn]
Positions the Y coordinate of the alarm summary
window to nnn pixels from the top edge of the
screen. Valid range depends on screen resolution.
1
1
A-57 1
RSView32 commands
Suppressed
Suppressed
Opens the Suppressed List editor.
SuppressOff
SuppressOff <tag_name>
Restores alarm reporting for the specified suppressed alarm.
<tag_name>
SuppressOffAll
The name of a tag that no longer requires alarm
suppression. You can use wildcards.
SuppressOffAll
Restores alarm reporting for all suppressed alarms.
This command is faster than the SuppressOff * command.
SuppressOn
SuppressOn <tag_name>
Suppresses reporting of alarms for the specified tag.
<tag_name>
The name of a tag, or a wildcard.
This command is useful when equipment repairs or maintenance
would otherwise result in alarms being generated. All alarms for each
threshold of the monitored tag are suppressed. Alarm suppression
can take place before or after issuing the AlarmOn command.
1
1
1
A-58
RSView32 commands
Toggle
Toggle [/V] <tag_name>
Reads the tag’s value and writes back a 1 or 0 as follows:
if the tag value is 0, Toggle changes it to 1
if the value is not 0, Toggle changes it to 0
[/V]
Performs a read immediately after the write to verify
that the value was altered in the programmable
controller or server.
This parameter is useful if the network is in poor
condition or susceptible to noise interference.
If the verification fails, the error message is logged to
the activity log, activity bar, or printer using the Tag
Write category. Specify where to send Tag Write
errors using the Categories tab of the Activity Log
Setup editor.
<tag_name>
Undefine
The name of an analog or digital tag.
Undefine <symbol>
Deletes a symbol definition that was created using the Define
command.
Example: The Undefine command
8QGHILQH WHVW
Deletes the definition for the symbol “test” that was previously
created with the Define command.
8QGHILQH Deletes all symbol definitions.
See also Define.
1
1
A-59 1
RSView32 commands
Upload
Upload
In a graphic display, reads a value from the programmable controller
or server and displays it in the selected input field.
This command operates on the active graphic display. If no display is
active, this command is ignored.
Ctrl-PgUp also uploads the value to the selected input field.
UploadAll
UploadAll
In a graphic display, reads values from the programmable controller
or server and displays them in all the input fields.
This command operates on the active graphic display. If no display is
active, this command is ignored.
PgUp also uploads all the values to the input fields.
VbaEdit
VbaEdit [program_name]
Opens the VBA integrated development environment (IDE) so you
can edit a VBA program.
[program
_name]
VbaExec
Any Sub statement in the ThisProject module. If you
don’t specify a program name, the IDE opens at the
first program. If you specify a program name, the
IDE opens with the cursor at the specified Sub
statement. The program name is not case sensitive.
VbaExec <program_name> [parameters]
Runs a VBA program.
1
1
1
A-60
<program
_name>
The name of the program as specified in the Sub
statement.
[parameters]
Any argument that a particular program requires.
Separate arguments must be separated with commas.
B
System tags
System tags are preconfigured tags created by RSView32. Use system
tags for read-only applications in your project.
Alarms
The following tags display alarm information:
Tag Name
Type
Displays information about
system\AlarmBanner
String
The most recent, most severe alarm.
If an alarm of an equal or higher
severity occurs, it replaces the first
alarm, even if the previous alarm has
not been acknowledged.
system\AlarmMostRecentDate
String
The date of the most recent, most
severe alarm.
system\AlarmMostRecentLabel
String
The threshold label of the tag of the
most recent, most severe alarm.
system\AlarmMostRecentSeverity
Analog
The severity of the most recent, most
severe alarm.
system\AlarmMostRecentTagDesc
String
The description of the tag of the most
recent, most severe alarm.
system\AlarmMostRecentTagname
String
The name of the tag of the most
recent, most severe alarm.
system\AlarmMostRecentTime
String
The time of the most recent, most
severe alarm.
1
1
B-1 1
System tags
Tag Name
Type
Displays information about
system\AlarmMostRecentUnits
String
The units of the most recent, most
severe alarm.
system\AlarmStatus
String
The number of unacknowledged and
suppressed alarms.
system\AlarmSummaryItems
Analog
The number of alarm transactions in
an unfiltered alarm summary.
system\AlarmSummaryItemsUnacked
Analog
The number of unacknowledged
alarms in an unfiltered alarm
summary.
system\AlarmSuppressedCount
Analog
The number of tags with alarm
suppression turned on.
Communications
The following tags record device communication information. These
tags are added to the system folder when you configure a channel in
the Channel editor. Each channel you configure will have these four
tags. The number on the end identifies the tags for each channel. For
example, system\ComErrorString1 is for channel 1.
To report communication errors, issue the ComStatusOn command.
1
1
1
B-2
Tag Name
Type
Displays information about
system\ComErrorString1
system\ComErrorValue1
system\ComStatusString1
String
Analog
String
Most recent device error message.
Internal number of most recent device error.
Current status of device communications. Will
be the same as system\ComErrorString1 if
the error condition still exists.
system\ComStatusValue1
Analog
Internal number indicating current status of
device communications. Will be the same as
system\ComErrorValue1 if the error condition
still exists.
System tags
The following tags record OPC client communication information.
These tags are added to the system folder when you configure an
OPC node in the Node editor.
Tag Name
Type
Displays information about
system\ComErrorStringOPC
system\ComErrorValueOPC
system\ComStatusStringOPC
String
Analog
String
Most recent OPC error message.
Internal number of most recent OPC error.
Current status of OPC communications. Will
be the same as system\ComErrorStringOPC if
the error condition still exists.
system\ComStatusValueOPC
Analog
Internal number indicating current status of
OPC communications. Will be the same as
system\ComErrorValueOPC if the error
condition still exists.
The following tags record DDE client communication information.
These tags are added to the system folder when you configure a
DDE node in the Node editor.
Tag Name
Type
Displays information about
system\ComErrorStringDDE
system\ComErrorValueDDE
String
Analog
Most recent DDE client error message.
Internal number of most recent DDE client
error.
system\ComStatusStringDDE
String
system\ComStatusValueDDE
Analog
Current status of DDE client communications.
Will be the same as
system\ComErrorStringDDE if the error
condition still exists.
Internal number indicating current status of
DDE client communications. Will be the same
as system\ComErrorValueDDE if the error
condition still exists.
1
1
B-3 1
System tags
Graphics
The following tags can be used to make graphic objects appear as
though they are blinking on and off:
Tag Name
Type
Function
system\BlinkFast
Digital
Toggles on and off every 100 ms (10 times
per second).
system\BlinkSlow
Digital
Toggles on and off every 500 ms (twice per
second).
A more efficient way to make graphic objects blink is to use the
blinking color option in color animation. For details, see page 12-13.
Time
The following tags record time and date information in various
formats:
Tag Name
Type
Provides this data
Read or write
system\Date
String
System date.
Read only
system\DateAndTimeInteger
Analog
Number of seconds elapsed since midnight
(00:00:00) January 1, 1970, coordinated
universal time (UTC).
Read only
system\DateAndTimeString
String
Complete date and time display
For example:
Read only
Monday, December 12 1997 10:47:50 AM
system\DayOfMonth
Analog
Day of the month (1 – 31).
Read only
system\DayOfWeek
Analog
Day of the week (1 – 7); Sunday = 1.
Read only
system\DayOfYear
Analog
Day of the year (1 – 366).
Read only
system\Hour
Analog
Hour of the day (0 – 23).
Read and write
system\Minute
Analog
Minutes (0 – 59).
Read and write
system\Month
Analog
Number for month.
Read only
system\MonthString
String
Name of the month.
Read only
system\Second
Analog
Seconds (0 – 59).
Read and write
system\Time
String
System time.
Read only
system\Year
Analog
The year (1980 – 2099).
Read only
1
1
1
B-4
System tags
Trends
The following tags are created each time you define a trend control
tag in the Trend configuration dialog box. These tags are not stored
in the system folder. Rather, they are stored in the folder that is
created when you name the trend animation tag.
For example, if you typed Trend as the control tag, you would find a
folder called Trend in the list of folders displayed in the Tag Database
editor. The folder would contain the tags listed in the following
table, but each tag would be prefixed with “Trend”. The
\CurrentPen tag would be Trend\CurrentPen, and so on.
Tag name
Type
Function
Read or Write?
\CurrentFile
Analog Number of the current data log file. Data
log files are numbered sequentially. You can
write to this tag if Choose File, Oldest File,
or Newest File is the trend’s data source.
Read and write
(see Function
column)
\CurrentPen
Analog Number of the current pen (1 – 16)
highlighted in the legend.
Read and write
\NewestFile
Analog Offset from current data log file to newest
data log file.
Read only
\NewestTime
Analog Time of the newest data sample available
for plotting.
Read only
\OldestFile
Analog Offset from current data log file to oldest
data log file.
Read only
\OldestTime
Analog Time of the oldest data sample available for
plotting.
Read only
\Paused
Digital A tag value of 1 pauses the trend.
Read and write
A tag value of 0 resumes movement of the
trend.
For a realtime trend, the \Paused tag has a
default value of 0 so the trend scrolls
initially. For a historical trend, the \Paused
tag has a default value of 1 so the trend
pauses initially.
1
1
B-5 1
System tags
Tag name
Type
\PenMask
Analog A 16-bit mask that controls the visibility of Read and write
the trend pens. If the bit corresponding to a
pen is set in this mask, the pen is
displayed. For example:
Function
Read or Write?
PenMask = 0000 0000 0000 0000 = 0
No pens are displayed.
PenMask = 0000 0000 0000 0100 = 4
Only Pen 3 is displayed.
\StartTime
Analog Integer tag specifying the time at the right
margin of the time scale.
Read and write
The start time value is the number of
seconds elapsed since midnight
(00:00:00), January 1, 1970, coordinated
universal time (UTC).
\StartTimeDate
String
String tag representing the start time and
date for the trend (at the right margin of
the time scale).
Read and write
For example, JAN 01 1998 13:00:00.
\TimeRange
Analog Time range of the time scale in seconds.
Read and write
\Updating
Digital Digital tag that indicates whether the trend
object is retrieving data log data. The tag
value is 1 if retrieving data, and 0 if not.
Read only
\YMag
Analog Magnification of the vertical axis in percent.
Read and write
0 No magnification
100 Twice the resolution (half the range)
-100 Half the resolution (twice the range)
\YOffset
1
1
1
B-6
Analog Offset of the vertical axis in percent. Moves
the view up or down but does not change
the time range.
Read and write
System tags
User
The following tag contains the name of the current user in the
activity log file:
Tag Name
Type
Function
system\User
String
Contains name of logged-in user.
Windows memory resources
The following tags are no longer valid.
Tag Name
Type
Provides this data
system\MemoryB1Meg
Analog
This tag is no longer valid and has a value of 0.
system\MemoryGDI
Analog
This tag is no longer valid and has a value of 0.
system\MemoryUser
Analog
This tag is no longer valid and has a value of 0.
system\MemoryVirtual
Analog
This tag is no longer valid. The value is unreliable.
1
1
B-7 1
C
Differences between RSView32
and ControlView
This appendix describes:
how to import ControlView and ControlView Builder projects
into RSView32
differences between RSView32, and ControlView, and
ControlView Builder
Importing ControlView projects
You can import most components from a ControlView or
ControlView Builder project into RSView32 using the ControlView
Project Import Wizard in the RSView32 Tools group.
For details, see the documentation accompanying this tool.
Activity log
Activity log files are not stored in a circular file set. Instead, you
configure when to create and delete files.
Information in the activity log file is stored in .dbf (dBase IV) file
format. You can access the information in the file with any
third-party software that reads .dbf, such as Microsoft Excel, Seagate
Crystal Reports, and Visual FoxPro.
1
1
C-1 1
Differences between RSView32 and ControlView
Alarms
Alarm banner and alarm status display
The alarm banner and alarm status display are not preconfigured in
RSView32. To include these items in your project, either use the
objects in the graphic library called Alarms or create them yourself
in the Graphic Display editor.
The information for an alarm banner and alarm status display comes
from system tags that report on alarms. System tags are
preconfigured tags provided with RSView32. These tags are in the
System folder in the Tag Database editor.
To create an alarm banner or alarm status display, use the numeric
display or string display objects with the appropriate alarm system
tags.
Alarm log
Alarm log files are not stored in a circular file set. Instead, you
configure when to create and delete files.
Information in the alarm log file is stored in .dbf (dBase IV) file
format. You can access the information in the file with any
third-party software that reads .dbf, such as Microsoft Excel, Seagate
Crystal Reports, and Visual FoxPro.
Alarm summary
The alarm summary is not preconfigured in RSView32. To include an
alarm summary in your project, either use the alarm summary object
in the graphic library called Alarms or create an alarm summary in
the Alarm Summary editor. A project can contain multiple alarm
summaries.
You can format an alarm summary in any way. The Alarm Summary
editor has tools for formatting headings, fonts, colors, and buttons.
You can also filter and sort data so only particular alarm information
is displayed.
1
1
1
C-2
Differences between RSView32 and ControlView
Commands
Obsolete commands
The following table lists commands not supported in RSView32. If
you import ControlView macros, event files, global key files, graphic
displays, or alarm definitions that use these commands, you will have
to revise them. CY
ABDiag
Documentor
ModemStatus
Print
AccountRpt
EventRpt
ModemString
PrinterConfig
ActivityRpt
GrafixRpt
MouseConfig
PrintInit
AlarmRpt
HangUp
NetConfig
Push
Archive
ICCBootOff
NetDiag
RemCopy
BeepOff
ICCBootOn
NetLogOff
Report
BeepOn
ICCConfig
NetLogOn
ReportOff
Capture
ICCInfo
NetStatus
ReportOn
Chain
ICCSessionOff
NodeRpt
Restore
ChainClr
ICCSessionOn
Novell
Revision
ClassRpt
KTConfig
NovRpt
RevisionRpt
Clock
List
OptConfig
S85Config
CmdLineOff
ListConfig
Optimize
SecurityRpt
CmdLineOn
Load
PanelOff
StartUp
CmdLineToggle
LPRCancel
PanelOn
Time
CmsConfig
LPRCapture
PathConfig
TopLevelOff
CVDos
LPRConfig
PCIMConfig
TopLevelOn
DataLogExport
Macro
Plot
TouchConfig
DataLogRpt
Menu
PMClear
TouchOff
DBExp
MenuBar
PMConfig
TouchOn
DBImp
MenuBoxOff
PMDisplay
Trend
DBRpt
MenuBoxOn
PMEventLog
TrendRpt
DCConfig
MenuBoxToggle
PMLimits
Unload
DerivedRpt
ModDiag
PMRealTime
UnsCacheOff
DeviceRpt
ModemCommand
PMSnapshot
UnsCacheOn
Dial
ModemDirectory
PMStatus
WindowConfig
ModemSetUp
PMWaveform
1
1
C-3 1
Differences between RSView32 and ControlView
Renamed commands
The following table lists ControlView commands that have been
renamed in RSView32:
This ControlView command
Is this RSView32 command
BatchRestore
RecipeRestore
BatchSave
RecipeSave
Hello
Login
Bye
Logout
Key
KeyEdit
Macro
MacroEdit
RSView32 still has a Key command, but this command runs a global
key file. The KeyEdit command opens a global key file for editing.
For a list of all RSView32 commands and a definition of the actions
they perform, see Appendix A, RSView32 commands, or see Help.
Data log
You cannot import ControlView data log models into RSView32.
In RSView32, data log files are not stored in a circular file set.
Instead, you configure when to create and delete files. Information in
the data log file is stored in .dbf (dBase IV) file format or in ODBC
storage format. You can access the information in the .dbf file with
any third-party software that reads .dbf, such as Microsoft Excel,
Seagate Crystal Reports, and Visual FoxPro, or store the data in any
ODBC-compliant database.
1
1
1
C-4
Differences between RSView32 and ControlView
Derived tags
You can import ControlView derived tag files into RSView32.
In RSView32, derived tags are processed on exception, not
sequentially. Therefore, do not create derived tags that depend on the
results of other derived tags, because they might not produce the
desired results.
You can store the result of a derived tag calculation in any tag, not
just a memory (local) tag.
The number of derived tag files is limited only by memory and disk
space. Each derived tag file can contain up to 1,000 derived tags as
compared to ControlView’s limit of 300 derived tags. You can run
up to 20 derived tag files simultaneously.
Events
You can import ControlView event files into RSView32.
In RSView32, events are processed on exception, not sequentially.
Therefore, do not create events that depend on the results of other
events, because they might not produce the desired results.
The number of event files is limited only by memory and disk space.
Each event file can contain up to 1,000 events as compared to
ControlView’s limit of 600 events. You can run up to 20 event files
simultaneously.
Global keys
You cannot import ControlView global key files into RSView32.
In RSView32, you cannot run more than one global key file at a
time. If you try to run more than one file, the files are not merged.
Instead, the second file overrides the first file.
1
1
C-5 1
Differences between RSView32 and ControlView
Graphics
In RSView32, you can:
import the following types of files: ControlView .mgx files,
ControlView Builder .gfx and .mgl files, AutoCAD .dxf files (for
AutoCAD 12 and earlier), and any files in the following formats:
.bmp, .clp, .gif, .pcx, and .wmf
drag and drop objects between RSView32 graphic files and other
Windows programs
use OLE (object linking and embedding) to insert third-party
objects, such as a Microsoft Excel spreadsheet, a Word document,
or a Visio® graphic
use ActiveX to insert third-party control objects
use the button drawing tool to create button objects that behave
as standard Windows buttons
use the full Windows color palette and all installed fonts
attach these new kinds of animation:
blinking color animation
horizontal and vertical position
horizontal and vertical size
rotation
horizontal and vertical fill
horizontal and vertical slider
OLE verb
RSView32 does not contain a tool for drawing bar graphs. To create
a bar graph, draw a rectangle and apply height, width, or fill
animation. If you import a bar graph from ControlView, the bar
graph will automatically be changed to a rectangle with the
appropriate type of animation and will work as it worked in
ControlView.
1
1
1
C-6
Differences between RSView32 and ControlView
Scan classes
In RSView32, scan class configuration has been simplified. There is
no distinction between scan classes for string tags and for other tag
types—one scan class can handle any tag type. Also, the number of
tags that can be assigned to a scan class is not limited, and a device
type is no longer required.
RSView32 has 12 scan classes: A through K.
SLC addressing syntax
The I/O address syntax for the fixed SLC, SLC 5/01, SLC 5/02, and
SLC 5/03 (OS300) has changed. If you import a ControlView
project with tags referencing I/Os from these SLC types, you must
modify the addresses for these tags. For details, see Appendix D,
Addressing syntax for Allen-Bradley programmable controllers.
The I/O address syntax for the SLC 5/03 (OS301) and SLC 5/04 has
not changed. If you import a ControlView project that references
I/Os from these SLC types, ensure the Type field of the Node editor
is set to SLC 5 (Enhanced).
Tag database
In RSView32, group tags and structure tags are not supported.
Instead, folders are used to organize tags. In RSView32, a local tag is
called a memory tag.
Tag names can be up to 40 characters long. Separate the folder name
from the rest of the tag name with a backslash (\).
RSView32 comes with a set of system tags. These preconfigured tags
are in the folder called System in the Tag Database editor. For a
complete list of system tags, see Appendix B, System tags.
1
1
C-7 1
Differences between RSView32 and ControlView
Trends
You cannot import a ControlView trend into RSView32. In
RSView32, trends are configured as part of a graphic display.
Realtime and historical trends are supported; x-y trends are not.
You can configure trends to be transparent, so one graph can be
placed over another. This lets you show a realtime trend over top of
a historical “ideal” trend to see when a variable deviates from
normal.
ControlView features integrated into RSView32
The Windows environment means that the following ControlView
options and tools are not required as separate features in RSView32:
Reporting option—for historical data, use any third-party
program that reads .dbf, such as Microsoft Excel, to access data in
log files. For realtime data, use RSView32’s OPC or DDE server
capabilities.
Modem option—use Windows and third-party products to
support a modem.
C-Toolkit tasks—use a tool such as scripting in RSView32 or
Visual Basic to create custom Windows applications that access
realtime data through the RSView32 Object Model or DDE, and
access historical data through ODBC/.dbf.
1
1
1
C-8
D
Addressing syntax for Allen-Bradley
programmable controllers
This appendix contains:
addressing syntax for Allen-Bradley PLCs
addressing syntax for Allen-Bradley SLCs
addressing syntax for SoftLogix 5 controllers
mnemonic tables
The information here is applicable only for tags that have device as
their data source. For detailed information about creating tags, see
Chapter 4, Creating tags.
1
1
D-1 1
Addressing syntax for Allen-Bradley programmable controllers
PLC addressing syntax
The following section provides addressing syntax for these types of
programmable controllers:
PLC-2
PLC-3
PLC-5, which includes the PLC-5/10, PLC-5/12, PLC-5/15, and
PLC-5/25
PLC-5 (Enhanced), which includes the PLC-5/11, PLC-5/20,
PLC-5/30, PLC-5/40, PLC-5/60, and PLC-5/80
PLC-2
aaaa/bb
aaaa
Address: 0 – 7777 octal
bb (optional)
Bit offset within word: 0 – 17 octal
Example of digital address: 11/17
Example of analog and string address: 1264
PLC-3 data table sections
Fnnn:wwww/bb
1
1
1
D-2
F
File type:
A = ASCII
B = Binary
N = Integer
D = Decimal (BCD)
O = Output
I = Input
F = Floating point
S = Status
H = High order integer
nnn
File number: 0 – 999 decimal
Addressing syntax for Allen-Bradley programmable controllers
wwww
Word address:
For I/O section: 0 – 7777 octal
For all others: 0 – 9999 decimal
bb (optional)
Bit offset within word: 0 – 17 octal
Bit offset not permitted in the F and H sections.
Example of digital address: B5:173/15
Example of analog address: N3:173
Example of string address: A1:126
PLC-3 timers and counters
FWWW:nnnn/bb
F
File type:
C = Counter
T = Timer
WWW
Structured word:
CTL = Control word
PRE = Preset value
ACC = Accumulated value
nnnn
Counter/Timer number: 0 – 9999 decimal
bb
Bit offset within word:
15 octal = done bit
16 octal = timing bit
17 octal = enable bit
Example of digital address: TCTL:125/17
Example of analog address: CPRE:125
1
1
D-3 1
Addressing syntax for Allen-Bradley programmable controllers
PLC-5 data files
Fnnn:eee/bb
F
File type:
B = Binary
N = Integer
D = Decimal (BCD)
F = Floating point
A = ASCII
nnn
File number: 3 – 999 decimal
For direct driver communication, binary, integer,
and floating point file types use the default file
number if the file number is absent. The default
numbers are 3 (binary), 7 (integer), and
8 (floating point).
eee
Element number: 0 – 999 decimal
bb (optional)
Bit offset within word: 0 – 15 decimal
Not applicable to floating point file types.
Example of bit address: B3:173/15
Example of word address: N7:12
PLC-5 binary files: optional syntax
Fnnn/bbbbb
F
File type:
B = Binary
nnn
File number: 3 – 999 decimal
For direct driver communication, the default file
number 3 is used if the file number is absent.
bbbbb
Bit offset from start of file: 0 – 15999 decimal
Example: B3/1024
1
1
1
D-4
Addressing syntax for Allen-Bradley programmable controllers
PLC-5 I/O and status files
F:ee/bb
F
File type:
O = Output
I = Input
S = Status
ee
Element number:
For I/O files:
PLC-5/10: 0 – 037 octal
PLC-5/12: 0 – 037 octal
PLC-5/15: 0 – 037 octal
PLC-5/25: 0 – 077 octal
For status files: 0 – 31 decimal
bb (optional)
Bit offset within word:
For I/O files: 0 – 17 octal
For status files: 0 – 15 decimal
Example: O:64/17
PLC-5 timers, counters, and control files
Fnnn:eee.MNE/bb
F
File type:
C = Counter
T = Timer
R = Control
nnn
File number: 3 – 999 decimal
For direct driver communication, timer, counter
and control file types use the default file number
if the file number is absent. The default numbers
are 4 (timer), 5 (counter), and 6 (control).
eee
Element number: 0 – 999 decimal
MNE
Member mnemonic (see mnemonic tables
starting on page D-23)
1
1
D-5 1
Addressing syntax for Allen-Bradley programmable controllers
bb (optional)
Bit number: 0 – 15 decimal
Only applies to analog word members.
Example: T57:38.ACC
PLC-5 (Enhanced) I/O and status files
F:eee/bb
F
File type:
I = Input
O = Output
S = Status
eee
Element number:
For I/O files:
PLC-5/11: 0 – 037 octal
PLC-5/20: 0 – 037 octal
PLC-5/30: 0 – 077 octal
PLC-5/40: 0 – 177 octal
PLC-5/60: 0 – 277 octal
PLC-5/80: 0 – 277 octal
For status files:
0 – 127 decimal
bb (optional)
Bit offset within word:
For I/O files: 0 – 17 octal
For status files: 0 – 15 decimal
Example: O:167/11
1
1
1
D-6
Addressing syntax for Allen-Bradley programmable controllers
PLC-5 (Enhanced) binary, BCD, integer, ASCII, float, and string
files
Fnnn:eee/bb
or
Fnnn:eeee/bb
F
File type:
B = Binary
D = Decimal (BCD)
N = Integer
F = Floating point
A = ASCII
ST = String
nnn
File number: 3 – 999 decimal
For direct driver communication, binary, integer,
and floating point file types use the default file
number if the file number is absent. The default
numbers are 3 (binary), 7 (integer), and 8 (floating
point).
eee
Element number: 0 – 999 decimal
or
eeee
Element number: 0 – 1999 decimal for PLC-5/80
Series E firmware
bb (optional)
Bit offset within word: 0 – 15 decimal
Bit offset is not supported for floating point and
string file types.
Example: B84:113/13
1
1
D-7 1
Addressing syntax for Allen-Bradley programmable controllers
PLC-5 (Enhanced) binary files: optional syntax
Fnnn/bbbbb
F
File type:
B = Binary
nnn (optional)
File number: 3 – 999 decimal
For direct driver communication, the default file
number 3 is used if the file number is absent.
bbbbb
Bit offset from start of file: 0 – 15999 decimal
Example: B27/248
PLC-5 (Enhanced) timer, counter, control, SFC status, message,
PID, block transfer, and token data files
FFnnn:eee.MNE[ss]/bb
1
1
1
D-8
FF
File type:
T = Timer
C = Counter
R = Control
SC = SFC status
MG = Message
PD = PID control
BT = Block transfer
TD = Token data
nnn
File number: 3 – 999 decimal
For direct driver communication, timer, counter,
and control file types use the default file number
if the file number is absent. The default numbers
are 4 (timer), 5 (counter), and 6 (control).
eee
Element number: 0 – 999 decimal
MNE
Member mnemonic (see mnemonic tables
starting on page D-23)
Addressing syntax for Allen-Bradley programmable controllers
ss
Submember
Only applies to .ADDR and .DATA members of
PID structure and .DATA member of
MSG structure.
bb (optional)
Bit number: 0 – 15 decimal
Only applies to analog word members.
Example: MG59:33.DATA[0]/15
SLC addressing syntax
The following section provides addressing syntax for these types of
programmable controllers:
SLC 5, which includes the fixed I/O SLC 5, SLC 5/01, SLC 5/02,
and SLC 5/03 (OS300)
SLC 5 (Enhanced), which includes the SLC 5/03 (OS 301),
SLC 5/04, and SLC 5/05
SLC 5 I/O files
F:ss.www/bb
F
File type:
I = Input
O = Output
ss
I/O slot number: 0 – 30 decimal
www (optional)
I/O word number expansion: 0 – 255 decimal
bb (optional)
Bit offset within word: 0 – 15 decimal
When input slot is 0: 0 – 23 decimal
Example: I:22.254/13
IMPORTANT Writing to the output files of an SLC 5 is not recommended. However, if
you do, be sure the SLC is not in RUN mode. If it is in RUN mode, the
write will fail and an error message will be logged to the activity log file.
1
1
D-9 1
Addressing syntax for Allen-Bradley programmable controllers
Important information for addressing SLC 5 I/O modules
The RSView32 I/O module addressing system differs from the
corresponding ControlView, APS, A.I. 500, and RSLogix 5 or
RSLogix 500 addressing systems. The RSView32 I/O data section
addressing does not match the physical slot of the I/O module.
In RSView32, the first physical module of each type (input or
output) is address slot number 0. The next module of the same type
in the next higher-numbered rack slot is address slot number 1, and
so on.
Example: SLC 5 I/O module addressing
1
1
D-10
RSView32 Address
I module slot 2
I/O module slot 0 (fixed)
I:2
I:0.0 or I:0
I:0.1
O:0
I:2
I:0.0 or I:0
I:0.1 or I:1
O:0
I module slot 1
O module slot 2
I/O module slot 0 (fixed)
I:1
O:2
I:0.0 or I:0
O:0
I:2
O:1
I:0.0 or I:0
O:0
I module slot 1
I module slot 2
CPU slot 0
O module slot 1
I module slot 2
O module slot 3
I:1
I:2
N/A
O:1
I:2
O:3
I:1
I:2
N/A
O:0
I:0
O:1
Rack Configuration
Fixed L40
I/O module slot 0 (fixed)
Fixed L30
Fixed L20
Modular
1
CV for DOS Address or
APS Address
I:0.0 or I:0
I:0.1
O:0
SLC Type
I:0.0 or I:0
I:0.1 or I:1
O:0
Addressing syntax for Allen-Bradley programmable controllers
SLC 5 status files
F:ww/bb
F
File type:
S = Status
ww
Word address:
SLC 500: 0 – 15 decimal
SLC 5/01: 0 – 15 decimal
SLC 5/02: 0 – 32 decimal
SLC 5/03: 0 – 68 decimal
bb (optional)
Bit offset within word: 0 – 15 decimal
Example: S:15/6
SLC 5 binary and integer files
Fnnn:www/bb
F
File type:
B = Binary
N = Integer
nnn (optional)
File number:
Binary: 3, 9 – 255 decimal
Integer: 7, 9 – 255 decimal
For direct driver communication, binary and
integer file types use the default file number if
the file number is absent. The default numbers
are 3 (binary) and 7 (integer).
www
Word address: 0 – 255 decimal
bb (optional)
Bit offset within word: 0 – 15 decimal
Example: N17:129/2
1
1
D-11 1
Addressing syntax for Allen-Bradley programmable controllers
SLC 5 binary files: optional syntax
Fnnn/bbbb
F
File type
B = Binary
nnn (optional)
File number: 3, 9 – 255 decimal
For direct driver communication, the default file
number 3 is used if the file number is absent.
bbbb
Bit offset from start of file: 0 – 4095 decimal
Example: B3/3999
SLC 5 timer, counter, and control files
Fnnn:eee.MNE/bb
F
File type:
T = Timer
C = Counter
R = Control
nnn (optional)
File number:
Timer: 4, 9 – 255 decimal
Counter: 5, 9 – 255 decimal
Control: 6, 9 – 255 decimal
For direct driver communication, timer, counter,
and control file types use the default file number
if the file number is absent. The default numbers
are 4 (timer), 5 (counter), and 6 (control).
eee
Element number: 0 – 255 decimal
MNE
Member mnemonic (see mnemonic tables
starting on page D-23)
bb (optional)
Bit number: 0 – 15 decimal
Applies to analog members only.
Example: R67:123.EN
1
1
1
D-12
Addressing syntax for Allen-Bradley programmable controllers
SLC 5 timer, counter, and control files
bit member addressing: optional syntax
Fnnn:eee/MNE
F
File type:
T = Timer
C = Counter
R = Control
nnn (optional)
File number:
Timer: 4, 9 – 255 decimal
Counter: 5, 9 – 255 decimal
Control: 6, 9 – 255 decimal
For direct driver communication, timer, counter,
and control file types use the default file number
if the file number is absent. The default numbers
are 4 (timer), 5 (counter), and 6 (control).
eee
Element number: 0 – 255 decimal
MNE
Bit member mnemonic (see mnemonic tables
starting on page D-23)
Example: C77:99/OV
SLC 5 timer, counter, and control files
bit member addressing by bit address: optional syntax
Fnnn:eee/bb
F
File type:
T = Timer
C = Counter
R = Control
1
1
D-13 1
Addressing syntax for Allen-Bradley programmable controllers
nnn (optional)
File number:
Timer: 4, 9 – 255 decimal
Counter: 5, 9 – 255 decimal
Control: 6, 9 – 255 decimal
For direct driver communication, timer, counter,
and control file types use the default file number
if the file number is absent. The default numbers
are 4 (timer), 5 (counter), and 6 (control).
eee
Element number: 0 – 255 decimal
bb
Bit number:
Timer: 13 – 15
Counter: 10 – 15
Control: 8 – 11, 13, 15
Example: T87:133/14
SLC 5 timer, counter, and control files
analog member addressing: optional syntax
Fnnn:eee.o/bb
1
1
1
D-14
F
File type:
T = Timer
C = Counter
R = Control
nnn (optional)
File number:
Timer: 4, 9 – 255 decimal
Counter: 5, 9 – 255 decimal
Control: 6, 9 – 255 decimal
For direct driver communication, timer, counter,
and control file types use the default file number
if the file number is absent. The default numbers
are 4 (timer), 5 (counter), and 6 (control).
Addressing syntax for Allen-Bradley programmable controllers
eee
Element number: 0 – 255 decimal
o
Word offset: 1 – 2 decimal
bb (optional)
Bit number:
0 – 15 decimal
Example: R44:72.1/14
SLC 5 (Enhanced) I/O files
F:ss.www/bb
F
File type:
I = Input
O = Output
ss
I/O slot number: 0 – 30 decimal
www (optional)
I/O word number expansion: 0 – 255 decimal
bb (optional)
Bit offset within word: 0 – 15 decimal
When input slot is 0: 0 – 23 decimal
Example: I:22.254/13
IMPORTANT Writing to the output files of an SLC 5 is not recommended. However, if
you do, be sure the SLC is not in RUN mode. If it is in RUN mode, the
write will fail and an error message will be logged to the activity log file.
SLC 5 (Enhanced) status files
F:ww/bb
F
File type:
S = Status
ww
Word address:
SLC 5/03: 0 – 68 decimal
SLC 5/04: 0 – 96 decimal
bb (optional)
Bit offset within word: 0 – 15 decimal
Example: S:15/6
1
1
D-15 1
Addressing syntax for Allen-Bradley programmable controllers
SLC 5 (Enhanced) binary, integer, float, ASCII, and string files
Fnnn:www/bb
F
File type:
B = Binary
N = Integer
F = Floating Point
A = ASCII
ST = String
nnn (optional)
File number:
Binary: 3, 9 – 255 decimal
Integer: 7, 9 – 255 decimal
Floating Point: 8, 9 – 255 decimal
ASCII: 9 – 255 decimal
String: 9 – 255 decimal
For direct driver communication, binary, integer,
and floating point file types use the default file
number if the file number is absent. The default
numbers are 3 (binary), 7 (integer), and
8 (floating point).
www
Word address: 0 – 255 decimal
bb (optional)
Bit offset within word: 0 – 15 decimal
Bit offset is not supported for floating point and
string file types.
Example: F8:129
1
1
1
D-16
Addressing syntax for Allen-Bradley programmable controllers
SLC 5 (Enhanced) binary files: optional syntax
Fnnn/bbbb
F
File type
B = Binary
nnn (optional)
File number: 3, 9 – 255 decimal
For direct driver communication, the default file
number 3 is used if the file number is absent.
bbbb
Bit offset from start of file: 0 – 4095 decimal
Example: B3/3999
SLC 5 (Enhanced) timer, counter, and control files
Fnnn:eee.MNE/bb
F
File type:
T = Timer
C = Counter
R = Control
nnn (optional)
File number:
Timer: 4, 9 – 255 decimal
Counter: 5, 9 – 255 decimal
Control: 6, 9 – 255 decimal
For direct driver communication, timer, counter,
and control file types use the default file number
if the file number is absent. The default numbers
are 4 (timer), 5 (counter), and 6 (control).
eee
Element number: 0 – 255 decimal
MNE
Member mnemonic (see mnemonic tables
starting on page D-23)
bb (optional)
Bit number: 0 – 15 decimal
Applies to analog members only.
Example: R67:123.EN
1
1
D-17 1
Addressing syntax for Allen-Bradley programmable controllers
SLC 5 (Enhanced) timer, counter, and control files
bit member addressing: optional syntax
Fnnn:eee/MNE
F
File type:
T = Timer
C = Counter
R = Control
nnn (optional)
File number:
Timer: 4, 9 – 255 decimal
Counter: 5, 9 – 255 decimal
Control: 6, 9 – 255 decimal
For direct driver communication, timer, counter,
and control file types use the default file number
if the file number is absent. The default numbers
are 4 (timer), 5 (counter), and 6 (control).
eee
Element number: 0 – 255 decimal
MNE
Bit member mnemonic (see mnemonic tables
starting on page D-23)
Example: C77:99/OV
SLC 5 (Enhanced) timer, counter, and control files
bit member addressing by bit address: optional syntax
Fnnn:eee/bb
F
1
1
1
D-18
File type:
T = Timer
C = Counter
R = Control
Addressing syntax for Allen-Bradley programmable controllers
nnn (optional)
File number:
Timer: 4, 9 – 255 decimal
Counter: 5, 9 – 255 decimal
Control: 6, 9 – 255 decimal
For direct driver communication, timer, counter,
and control file types use the default file number
if the file number is absent. The default numbers
are 4 (timer), 5 (counter), and 6 (control).
eee
Element number: 0 – 255 decimal
bb (optional)
Bit number:
Timer: 13 – 15
Counter: 10 – 15
Control: 8 – 11, 13, 15
Example: T87:133/14
SLC 5 (Enhanced) timer, counter, and control files
analog member addressing: optional syntax
Fnnn:eee.o/bb
F
File type:
T = Timer
C = Counter
R = Control
nnn (optional)
File number:
Timer: 4, 9 – 255 decimal
Counter: 5, 9 – 255 decimal
Control: 6, 9 – 255 decimal
For direct driver communication, timer, counter,
and control file types use the default file number
if the file number is absent. The default numbers
are 4 (timer), 5 (counter), and 6 (control).
1
1
D-19 1
Addressing syntax for Allen-Bradley programmable controllers
eee
Element number: 0 – 255 decimal
o
Word offset: 1 – 2 decimal
bb (optional)
Bit number:
0 – 15 decimal
Example: R44:72.1/14
SoftLogix 5 addressing syntax
The following section provides addressing syntax for SoftLogix 5
controllers.
SoftLogix 5 I/O and status files
F:eee/bb
F
File type:
I = Input
O = Output
S = Status
eee
Element number:
For I/O files: 0 – 277 octal
For status files: 0 – 511 decimal
bb (optional)
Bit offset within word:
For I/O files: 0 – 17 octal
For status files: 0 – 15 decimal
Example: O:167/11
1
1
1
D-20
Addressing syntax for Allen-Bradley programmable controllers
SoftLogix 5 binary, BCD, integer, long integer, ASCII, float, and
string files
Fnnnn:eeee/bb
F
File type:
B = Binary
D = Decimal (BCD)
N = Integer
L = Long integer
A = ASCII
F = Floating point
ST = String
nnnn
File number: 3 – 4095 decimal
For direct driver communication, binary, integer,
long integer, and floating point file types use the
default file number if the file number is absent.
The default numbers are 3 (binary), 7 (integer),
and 8 (floating point).
eeee
Element number: 0 – 4095 decimal
bb (optional)
Bit offset within word: 0 – 15 decimal
Bit offset is not supported for long integer,
floating point, and string file types.
Example: L4094:4090
SoftLogix 5 binary files: optional syntax
Fnnnn/bbbbb
F
File type:
B = Binary
nnnn (optional)
File number: 3 – 4095 decimal
For direct driver communication, the default file
number 3 is used if the file number is absent.
bbbbb
Bit offset from start of file: 0 – 65535 decimal
Example: B4095/65308
1
1
D-21 1
Addressing syntax for Allen-Bradley programmable controllers
SoftLogix 5 timer, counter, control, SFC status, message, PID,
block transfer, and token data files
FFnnnn:eeee.MNE[ss]/bb
FF
File type:
T = Timer
C = Counter
R = Control
SC = SFC status
MG = Message
PD = PID control
BT = Block transfer
TD = Token data
nnnn
File number: 3 – 4095 decimal
For direct driver communication, timer, counter,
and control file types use the default file number
if the file number is absent. The default numbers
are 4 (timer), 5 (counter), and 6 (control).
eeee
Element number: 0 – 4095 decimal
MNE
Member mnemonic (see mnemonic tables
starting on page D-23)
ss
Submember
Only applies to .ADDR and .DATA members of
PID structure and .DATA member of
MSG structure.
bb (optional)
Bit number: 0 – 15 decimal
Only applies to analog word members.
Example: MG4095:3000.DATA[0]/15
1
1
1
D-22
Addressing syntax for Allen-Bradley programmable controllers
Mnemonic tables
Timer mnemonics
Mnemonic
Instruction
Type
ACC
Accumulator Value
Analog
DN
Done
Digital
EN
Enable
Digital
PRE
Preset Value
Analog
TT
Timing
Digital
CZ
Counter mnemonics
Mnemonic
Instruction
Type
ACC
Accumulated Value
Analog
CD
Count Down Enable
Digital
CU
Count Up Enable
Digital
DN
Done
Digital
OV
Overflow
Digital
PRE
Preset Value
Analog
UN
Underflow
Digital
Update Accumulator Value
Digital
Mnemonic
Instruction
Type
DN
Done
Digital
EN
Enable
Digital
ER
Error
Digital
FD
Found
Digital
IN
Inhibit
Digital
LEN
Length
Analog
POS
Position
Analog
UL
Unload
Digital
For fixed I/O SLC only:
UA
Control mnemonics
For all programmable controllers except the fixed I/O SLC and the SLC 5/01:
EM
Empty
Digital
EU
Enable Unloading
Digital
1
1
D-23 1
Addressing syntax for Allen-Bradley programmable controllers
PID mnemonics
1
1
1
D-24
Mnemonic
Instruction
Type
Submember Range
ADDR[]
Address of Master Loop %
Analog
0–3
BIAS
Output Bias %
Analog
CA
Control Action
Digital
CL
Cascaded Loop
Digital
CT
Cascaded Type
Digital
DATA[]
Reserved / Internal Use
Analog
DB
Deadband
Analog
DO
Derivative Of
Digital
DVDB
Deviation Alarm Deadband
Analog
DVN
Deviation Alarm -
Analog
DVNA
Deviation High Alarm
Digital
DVP
Deviation Alarm +
Analog
DVPA
Deviation Low Alarm
Digital
EN
Enable
Digital
ERR
Error
Analog
EWD
Error Within Deadband
Digital
INI
PID Initialized
Digital
KD
Derivative Time
Analog
KI
Integral Gain
Analog
KP
Proportional Gain
Analog
MAXI
Input Range Maximum
Analog
MAXO
Output Limit High %
Analog
MAXS
Setpoint Maximum
Analog
MINI
Input Range Minimum
Analog
MINO
Output Limit Low %
Analog
MINS
Setpoint Minimum
Analog
MO
Mode
Digital
OLH
Output Limit High
Digital
OLL
Output Limit Low
Digital
OUT
Output
Analog
PE
PID Equation
Digital
PV
Process Variable
Analog
0 – 13
Addressing syntax for Allen-Bradley programmable controllers
PID mnemonics (continued)
Mnemonic
Instruction
Type
PVDB
Process Variable Alarm Deadband
Analog
PVH
Process Variable Alarm High
Analog
PVHA
Process Variable High Alarm
Digital
PVL
Process Variable Alarm Low
Analog
PVLA
Process Variable Low Alarm
Digital
PVT
Process Variable Tracking
Digital
SO
Set Output %
Analog
SP
Setpoint
Analog
SPOR
Setpoint Out of Range
Digital
SWM
Software A/M Mode
Digital
TIE
Tieback %
Analog
UPD
Update Time
Analog
Submember Range
Message mnemonics
Mnemonic
Instruction
Type
AD
Done
Digital
AE
Error
Digital
CO
Continuous
Digital
DATA[]
Reserved / Internal Use
Analog
DLEN
Done Length
Analog
DN
Synchronization Done
Digital
EN
Enable
Digital
ER
Synchronization Error
Digital
ERR
Error Code
Analog
EW
Enable Waiting
Digital
NR
No Response
Digital
RLEN
Request Length
Analog
ST
Start Transmission
Digital
TO
Time Out
Digital
Submember Range
0 – 51
1
1
D-25 1
Addressing syntax for Allen-Bradley programmable controllers
Block transfer mnemonics
Mnemonic
Instruction
Type
CO
Continue
Digital
DLEN
Done Length
Analog
DN
Done
Digital
ELEM
Element Number
Analog
EN
Enable
Digital
ER
Error
Digital
EW
Enable Waiting
Digital
FILE
File Number
Analog
NR
No Response
Digital
RGS
Rack Group Slot
Analog
RLEN
Requested Length
Analog
RW
Read Writes
Digital
ST
Start
Digital
TO
Time Out
Digital
Token data mnemonics
Mnemonic
Instruction
Type
LO
Low
Analog
HI
High
Analog
SFC status mnemonics
1
1
1
D-26
Mnemonic
Instruction
Type
DN
Done
Digital
ER
Step Error
Digital
FS
Forced Scan
Digital
LS
Last Scan
Digital
OV
Timer Overflow
Digital
PRE
Preset
Analog
SA
Scan Active
Digital
TIM
Active Time
Analog
E
Station addressing for nodes
connecting to Allen-Bradley devices
This appendix describes:
local station addressing
remote station addressing
Local station addressing
The following table lists valid address entries for a node connected to
the same network as the RSView32 system:
Communication Channel
Valid Entries
DH
0 – 376 (octal)
DH+
0 – 77 (octal)
DH-485
0 – 31 (decimal)
TCP/IP
Host name (as described below)
1
1
E-1 1
Station addressing for nodes connecting to Allen-Bradley devices
Host name
When entering a host name, use one of the following:
a direct IP (Internet Protocol) address in the form
www.xxx.yyy.zzz where www, xxx, yyy, and zzz are numbers
from 000 to 255
an alias for the address. An alias is an alphanumeric string from
one to eight characters. The first character must be a letter and the
name is case-sensitive.
Remote station addressing
This section outlines valid address entries for a node connected to a
remote network.
An RSView32 system can communicate with nodes on remote DH,
DH+, or DH-485 networks when connected to:
a DH+ network using a KT-family card (KT, KT2, KTX, KTXD,
PCMK)
a TCP/IP network using an Ethernet card
Remote DH or DH+ networks can be bridged by a 1785-KA
interface module or by a Pyramid Integrator that has an RM or KA
module.
Remote DH-485 networks can be bridged by a 1785-KA5.
DH and DH+ networks bridged by a 1785-KA
The format of the station address for nodes on remote DH and DH+
networks is:
1
1
1
E-2
Remote
Network
Station Address
DH
ll.sss
Valid Entries
ll
local bridge address
0 – 77 (octal)
sss
station address on remote DH
0 – 376 (octal)
Station addressing for nodes connecting to Allen-Bradley devices
Remote
Network
Station Address
DH+
ll.rrr.ss
Valid Entries
ll
local bridge address
0 – 77 (octal)
rrr
remote bridge address
0 – 376 (octal)
ss
station address on remote DH+
0 – 77 (octal)
ll
local bridge address
0 – 77 (octal)
rss
combined remote bridge address and
remote station address
0 – 376 (octal)
or
ll.rss
The address ll.rss is an offlink address shortened by
combining the remote bridge and remote station
addresses into one three-digit number. The system reads
only the first digit of the remote bridge address, and adds
the two-digit remote station address to produce a shorter
address that still points to the same node.
Example
The following figure shows an RSView32 system connected to a
DH+ network with a KT-family card. The local DH+ network is
bridged to a remote DH network, which is bridged to a second
remote DH+ network. The 1785-KA interface modules are used to
bridge the networks.
The valid station entries for the various nodes in the figure are:
Station Address
Valid Entries
14
14
220
7.220
21
7.310.21 or 7.321
1
1
E-3 1
Station addressing for nodes connecting to Allen-Bradley devices
Remote DH+
10
21
1785-KA
Remote DH
PLC-5
310
207
220
PLC-3
1785-KA
Local DH+
7
10
14
PLC-5
RSView32 with
KT-family Card
DH+ and DH-485 networks bridged by a 1785-KA5
Only bridging from DH+ to DH-485 is supported. The format of
the station address for nodes on the remote DH-485 network is:
Station Address
Valid Entries
ll.ss
ll
local bridge address
0 – 77 (octal)
ss
station address on remote DH-485
0 – 37 (octal)
Note: The 1785-KA5 link ID is not required for addressing.
IMPORTANT Only Enhanced SLC 5/03 (OS 301) nodes are supported.
1
1
1
E-4
Station addressing for nodes connecting to Allen-Bradley devices
Example
The following figure shows an RSView32 system connected to a
DH+ network with a KT-family card. The local DH+ network is
bridged to a remote DH-485 network using the 1785-KA5
communication adapter.
The valid station entries for the various nodes in the figure are:
Station Address
Valid Entries
7 (octal)
7
4 (octal)
4
10 (decimal)
17.12
11 (decimal)
17.13
SLC 5/03
(OS 301)
DH-485
SLC 5/03
(OS 301)
10 (decimal)
11 (decimal)
14 (decimal)
Link 1
1785-KA5
17 (octal)
DH+
RSView32 with
KT-family card
PLC-5/60
7 (octal)
Link 2
PLC-5/40
4 (octal)
1
1
E-5 1
Station addressing for nodes connecting to Allen-Bradley devices
Multiple DH+ networks connected by a Pyramid Integrator
The format of the station address for nodes on a remote DH+
network is:
Station Address
Valid Entries
ll:rrrrr.ss
ll
local bridge address
0 – 77 (octal)
rrrrr
PI Link number
0 – 65535 (decimal)
ss
station address on remote DH+
0 – 77 (octal)
The Pyramid Integrator (PI) link number for each DH+ network
must be unique. Use the 6200 Series Programming Software to
configure link numbers.
A PI chassis contains one RM module with two network channels. It
can also contain up to four KA modules, each with two network
channels. Using the RM and four KA modules, an RSView32 system
can communicate with programmable controllers on any or all of 10
DH+ networks.
Example
The figure on the following page shows an RSView32 system
connected to a DH+ network with a KT-family card. The PI routes
requests among four DH+ networks.
The valid station entries for the various nodes in the figure are:
1
1
1
E-6
Station Address
Valid Entries
12
12
3
6:2.3
23
6:3.23
10
6:4.10
Station addressing for nodes connecting to Allen-Bradley devices
1
R K
M A
Bridge
Address
2
2
3
3
E
I
4 5 6 7
PI Link 4
PI Chassis
DH+
10
PLC-5
PI Link 3
DH+
23
PLC-5
PI Link 2
DH+
3
PLC-5
PI Link 1
DH+
12
11
PLC-5
RSView32 with
KT-family card
1
1
E-7 1
Station addressing for nodes connecting to Allen-Bradley devices
DH and DH+ connected to a TCP/IP network by a Pyramid
Integrator
You can use a Pyramid Integrator (PI) with an Ethernet interface to
route requests from a TCP/IP network to either DH or DH+
networks. The PI chassis will contain one RM module with two
network channels and up to four KA modules, each with two
network channels. Using the RM and four KA modules, an
RSView32 system can communicate with programmable controllers
on any or all of 10 DH or DH+ networks. The RSView32 system
can also bridge from a DH+ channel to a DH network and back to a
DH+ network using 1785-KA modules.
IMPORTANT To communicate with programmable controllers connected through an
Ethernet interface, be sure to choose TCP/IP Bridge as the network type
in the Channel editor.
The format of the station address for nodes on remote DH or DH+
networks is:
host_name::PI_port_ID.station_address
host_name is either:
a direct IP (Internet Protocol) address in the form
www.xxx.yyy.zzz where www, xxx, yyy, and zzz are numbers
from 000 to 255
an alias for the address. An alias is an alphanumeric string from
one to eight characters. The first character must be a letter and the
name is case-sensitive.
1
1
1
E-8
Station addressing for nodes connecting to Allen-Bradley devices
PI_port_ID is the remote network connected to a channel, as
follows:
if connected on the RM, type: 0RM:n
where 0 is the PI slot number of the RM and n is the RM channel
number (2 or 3). The RM slot number is always zero, so you can
omit the 0RM and just use the channel number if you wish.
if connected on a KA, type: mKA:n
where m is the pushwheel number (1 to 4) on the KA and n is the
KA channel number (2 or 3).
station_address is one of the following:
Remote Network
Station Address
Valid Entries
DH
lll
local station address
0 – 376 (octal)
DH+
ll
local station address
0 – 77 (octal)
DH bridged by a
1785-KA module
ll.sss
ll
local bridge address
0 – 77 (octal)
sss
station address on remote DH+
0 – 376 (octal)
ll
local bridge address
0 – 77 (octal)
rrr
remote bridge address
0 – 376 (octal)
ss
station address on remote DH+
0 – 77 (octal)
ll
local bridge address
0 – 77 (octal)
rss
combined remote bridge address and
remote station address
0 – 376 (octal)
DH+ bridged by
two 1785-KA
modules
ll.rrr.ss
or
ll.rss
The address ll.rss is an offlink address that is
shortened by combining the remote bridge and
remote station addresses into one three-digit
number. The system reads only the first digit of
the remote bridge address, and adds the
two-digit remote station address to produce a
shorter address that still points to the same
node.
1
1
E-9 1
Station addressing for nodes connecting to Allen-Bradley devices
Example
The figure on the following page shows an RSView32 system
connected to a TCP/IP network through an Ethernet interface with
a PI.
The valid station entries for the nodes in the following figure are:
Station Address
Valid Entries
110
orion::1KA:2.110
17
orion::1KA:3.17
4
orion::ORM:2.4
14
orion::ORM:3.14
220
orion::ORM.3.7.220
21
orion::ORM:3.7.310.21
The name “orion” is a host name that maps to an IP address.
1
1
1
E-10
Station addressing for nodes connecting to Allen-Bradley devices
Orion
1
R K
M A
2
2
3
3
E
I
RSView32
Ethernet
DH
110
PLC-3
DH+
17
PLC-5
DH+
4
PLC-5
DH+
7
14
PLC-5
1785-KA
DH
207
310
220
PLC-3
DH+
1785-KA
10
21
PLC-5
1
1
E-11 1
G
Glossary
Acknowledge bit: A bit in the programmable controller that is set
when an alarm is acknowledged. The acknowledge bit is monitored
by all RSView32 stations, so when the bit is set by one RSView32
station all other stations then acknowledge the alarms associated
with that bit.
ActiveX object: A software component, supplied independently of
RSView32, that provides features that RSView32 can access using the
object’s properties, events, and methods. ActiveX objects are
sometimes known as ActiveX controls, OLE custom controls, or
OCXs. Configured in the Graphic Display editor. See also Event,
Method, and Property.
Activity log: An RSView32 component that records system activity
and stores it in log files. Useful for tracking operator activity,
diagnosing problems, or tracking system load. Configured in the
Activity Log Setup editor.
Advanced object: A type of graphic object. These objects are created
in the Graphic Display editor; some can also be created as separate
project components through the Project Manager.
Alarm fault: An RSView32-generated message that results from
improperly configured alarm thresholds.
1
1
G-1 1
Glossary
Alarm monitoring: The process by which a tag receives data, compares
this data to alarm limits, and reacts to values exceeding the limits.
Configured in the Analog Alarm or Digital Alarm editors of the Tag
Database editor.
Alarm severity: A range of eight severity levels you configure by
specifying what each level means and what actions each severity will
trigger. Configured in the Alarm Setup editor.
Alarm summary: A display of all alarms, including current and past
alarms. The display indicates whether or not alarms have been
acknowledged. Configured in the Alarm Summary editor.
Alarm threshold: A process value that sets operating limits
(thresholds) for an analog tag. If an analog tag value goes above or
below its thresholds, an alarm is triggered. Configured in the Analog
Alarm editor of the Tag Database editor.
Analog tag: A tag that has a range of values, and can represent
complex states, such as the position of rotary controls or a
temperature. Can be linked to an alarm. Configured in the Tag
Database editor.
Animated object: A graphic object that is linked to a tag and has a type
of animation attached to it so the object’s appearance changes to
reflect changes in the tag’s value.
Client: A program that requests data from a DDE or OPC server.
Communication channel: A connection from an RSView32 station to
the network to which the programmable controllers are attached.
Configured in the Channel editor.
ControlNet: An Allen-Bradley token-passing baseband link for a local
area network.
Data log: An RSView32 component that records tag values and stores
them in log files or tables. The logged data can then be used for
historical trending. Configured in the Data Log Setup editor.
1
1
1
G-2
Glossary
DDE: Dynamic Data Exchange; a Microsoft interprocess
communication standard. When two or more programs that support
DDE are running simultaneously, they can exchange information
and commands. When DDE is used over a network, it is called
NetDDE.
Deadband: A buffer to keep process fluctuations from triggering
unnecessary alarms. The deadband is linked to the alarm threshold:
for an increasing threshold, the deadband range lies below the
threshold; for a decreasing threshold, the deadband range lies above
the threshold. Configured in the Analog Alarm editor of the Tag
Database.
Derived tag: A tag whose value is calculated or derived from a
mathematical expression. Configured in the Derived Tags editor.
Device tag: An analog, digital, or string tag with device as its data
source. The tag’s value comes from a device external to RSView32,
such as a programmable controller, OPC server, or DDE server.
DH: Data Highway link; an Allen-Bradley floating-master baseband
link for a local area network.
DH-485: Data Highway 485 link; an Allen-Bradley token-passing
baseband link for a local area network based on the RS-485 standard.
DH+: Data Highway PlusZ link; an Allen-Bradley token-passing
baseband link for a local area network.
Digital tag: A tag that can represent two states, such as the positions
of switches, contacts, and relays, which can only be on or off. Its
value can be 0 or 1. Can be linked to an alarm. Configured in the Tag
Database editor.
Display cache: An area in RAM where up to 40 graphic displays can
be stored. Displays in the cache start up and change more quickly.
Displays can be added to the cache using the Cache After Displaying
option in the Graphic Display editor’s Display Settings dialog box,
or by using the /Z or /ZA parameter with the Display command.
1
1
G-3 1
Glossary
Display key: A type of control key that is attached to a graphic
display. Configured in the Graphic Display editor. See also Key
definition.
Editor: A tool for creating or configuring the files that make up an
RSView32 project. Editors can be accessed from the Project
Manager.
Event: (1) In the RSView32 Events editor, an expression and an
action. An action is an RSView32 command or macro. Whenever an
expression changes from false to true, the action is performed. (2) An
ActiveX attribute; the actions triggered by the ActiveX object in
response to an external action on the object, such as a mouse click.
Event Detector: An RSView32 component that, at runtime, monitors
events and triggers the specified actions.
Expression: An equation containing tag names, mathematical
operators, if-then-else logic, or built-in functions.
Folder: A tool in the Tag Database editor for organizing tags.
Form: A data-entry area in some editors. Typically used for single
record entry.
Global key: A type of key definition that is not restricted to a single
display but is active at all times. Configured in the Global Keys
editor. See also Key definition.
Graphic display: A picture created in the Graphic Display editor to
represent part of a plant or process.
Graphic object: An object in the Graphic Display editor.
Handshake bit: A bit in the programmable controller that RSView32
can set when a tag goes into alarm.
Historical trend: A trend display showing data from a data log file.
Created with the Trend drawing tool in the Graphic Display editor.
1
1
1
G-4
Glossary
Key definition: A command, symbol, macro, or series of replacement
keystrokes assigned to a key. The types of key definitions are global,
display, and object. Global key definitions are created in the Global
Keys editor; display and object key definitions are created in the
Graphic Display editor.
Key list: A list of the keys that are assigned to a graphic object or
graphic display. When a user presses one of the specified keys, a
command or macro runs. Configured in the Graphic Display editor.
Local station: A programmable controller or any other computer
attached to the same network as RSView32.
Log file: A file that stores data in .dbf (dBase IV) file format. An
alarm log file stores alarm messages and other data related to alarms.
An activity log file stores system activity information. A data log file
stores tag values. Data logs can also use the ODBC storage format.
See also ODBC.
Macro: A series of commands and/or symbols stored in an ASCII
text file. The name of the macro file is then used like a command.
When the file name is entered, the macro runs. Created in the Macro
editor.
Memory tag: An analog, digital, or string tag with memory as its data
source. The value for a memory tag comes from RSView32’s internal
value table. Configured in the Tag Database editor.
Method: An ActiveX attribute; the actions triggered by the ActiveX
object in response to an external action on the object, such as a
mouse click.
NetDDE: See DDE.
Node name: For communication with devices, a node name combines
a channel number and a station address to uniquely identify a
programmable controller. For DDE communications, a node name
combines a DDE application and topic to uniquely identify a DDE
server. For OPC communications, the name of the OPC server.
Generally referred to as a node in RSView32. Configured in the
Node editor.
1
1
G-5 1
Glossary
Object key: A type of control key that is assigned to a graphic object.
Configured in the Graphic Display editor. See also Key definition.
ODBC: Open Database Connectivity. Data log models using the
ODBC storage format store data directly in an ODBC-compliant
database.
OLE: Object Linking and Embedding; a way to transfer and share
information among Windows applications.
OLE object: A graphic object created by another Windows application
and inserted into a graphic display using OLE. Created in the
Graphic Display editor.
OPC: OLE for Process Control. OPC provides a way to transfer and
share information among automation control applications, as well as
communication devices.
Parameter file: A file that stores values for tag placeholders. Created
with the Parameter editor.
PLC: Programmable Logic Controller; an Allen-Bradley
programmable controller.
Poke: Used with DDE. A request from a DDE client to write a
value.
Project: A set of files created or configured using RSView32’s
editors.
Property: An ActiveX attribute; the named characteristics and values
of an object such as shape, color, position, or number.
Realtime trend: A trend displaying data that comes from the value
table as the data is collected. Created with the Trend drawing tool in
the Graphic Display editor.
Recipe file: A file storing the tag values that will replace the tag
placeholders in a graphic display. Created in the Graphic Display
editor or in the Recipe editor.
1
1
1
G-6
Glossary
Recipe management: A description of the process where operators
send or receive groups of process variables (tag values). The
components of recipe management are numeric and/or string input
objects, a recipe field, and a recipe file.
Remote station: A programmable controller or any other computer
attached to a different network than RSView32.
Remote trend: A trend displaying data from another computer as the
data is collected. Created with the Trend drawing tool in the Graphic
Display editor.
Scan: To periodically read the value found at a programmable
controller address. The scan rate determines how often the address is
read. Configured in the Scan Class editor.
Server: A program such as RSView32 that provides data to a DDE
or OPC client.
Simple object: A geometric shape, freehand shape, or text object that
is created using the drawing tools in the Graphic Display editor.
Spreadsheet: A data-entry area in some RSView32 editors. A
spreadsheet is a grid of columns and rows. One row in the
spreadsheet is called a record.
Station: Also referred to as station address; the address of a
programmable controller.
String tag: A tag that represents ASCII strings, that is, a series of
characters or whole words. Cannot be monitored for alarms.
Configured in the Tag Database editor.
Symbol: A short, simple name representing a longer command.
Defined in a macro or on the command line.
1
1
G-7 1
Glossary
System tag: An analog, digital, or string tag with the system as its
data source. The value for a system tag comes from the value table.
System tags are created by RSView32 and stored in the System folder
in the Tag Database editor.
Tag: A logical name for a data location in a programmable controller.
Tag database: The place where tags are stored. Use the Tag Database
editor to create tags and alarms. Use the Tag Browser to create tags.
Tag placeholder: A string that is replaced by a tag name at runtime. A
placeholder is the cross-hatch character (#) followed by a number
from 1 to 500.
TCP/IP: Transmission Control Protocol/Internet Protocol; a
communication network.
Threshold: See Alarm threshold.
Trend: A graphical depiction of tag values. Created in the Graphic
Display editor. See also Historical trend, Realtime trend, and Remote
trend.
Value table: The place in memory where RSView32 stores tag values.
These values are then accessible to all parts of RSView32.
VBA: Visual Basic for Applications; a programming language used to
create VBA sub-routines (programs) that run from within RSView32
and interact with RSView32 objects. You can create programs to do
conditional branching, issue RSView32 commands, or link
RSView32 data to other applications such as Microsoft Access. You
can run a VBA program from anywhere you can run an RSView32
command.
Wildcard: A character that can be used to represent one or many
characters. Used to search for groups of tags. The wildcards are:
1
1
1
G-8
This wildcard
Does this
*
Matches any number of characters, including the
backslash (\) character.
?
Matches any single character.
Index
Numbers
1784-KT/KTX, 2-2
1785-KA5, E-2, E-4
1785-KA, E-2, E-3
6200 Series Programming Software, E-6
A
Symbols
.bmp files, 11-99, 11-100
.clp files, 11-99
.dbf files
activity log, 8-1, 8-9, 8-16
alarm log, 6-8, 6-29
data log, 7-1, 7-2
retrieving data from, 16-3
.dxf files, 11-99
.gif files, 11-99
.jpg files, 11-99
.mgl files, 11-99
.mgx files, 11-99
.obf files, 7-8
.pcx files, 11-99
.rsv files, 1-1
.tif files, 11-99
.wav files, 6-33, A-21, A-45
.wmf files, 11-99
??? in input fields, 11-43, 11-46, 11-63
[tag] parameter, using, 12-46
as placeholder, 12-7
for display keys, 12-54
for object keys, 12-42
to acknowledge alarms, A-11
with the Identify command, A-38
= (Equal) command, 14-2, 14-6, A-8
and memory tags, 4-20
Abort command, 15-3, A-10
Access. See Microsoft Access
Account command, 10-6, A-11
Acknowledge bit, 6-16, 6-45, 6-50
Acknowledge command, 6-12, A-11
AcknowledgeAll command, 6-12, A-12
ActiveX events, 8-12, 12-36, G-4
ActiveX methods, 12-38, 12-39, A-39
ActiveX objects, 11-1, 11-28, 11-71
attaching control to, 12-2, 12-32
editing, 12-32
ActiveX properties, 12-32, 12-35, A-39
ActiveX Property Panel, 11-73, 12-32,
12-35
ActiveX Toolbox, 11-75
Activity bar, 8-13
Activity commands
Activity, A-12
ActivityBarOff, A-12
ActivityBarOn, A-12
ActivityLogSendToODBC, A-13
ActivityOff, 8-18, A-13
ActivityOn, 8-18, A-13
ActivityPrintOff, A-14
ActivityPrintOn, A-14
ActivityViewer, A-14
ComStatusOff, A-22
ComStatusOn, A-22
EchoOff, 8-13, A-35
EchoOn, 8-13, A-35
Remark, 8-12, A-51
1
1
I-1 1
Index
Activity log files
and third-party applications, 8-1
contents of, 8-17, 16-7
creating, 8-4
deleting, 8-8
exporting to ODBC, 8-10
labeling categories in, 8-13
logging destinations, 8-13
maximum number of files, 8-9
maximum number of records, 8-17
naming, 8-9
short file names, 8-4
sharing at runtime, 17-2
storage format, ODBC, 16-8
storing in version 6.0 format, 8-4
Activity Log Setup editor, 8-2
Activity Log Viewer, 8-16, 8-17
Activity logging, 8-1, G-1
and events, 8-7
creating expressions for, 14-2
differences from ControlView, C-1
editing, 8-13
monitoring communications with, 2-18
specifying activities to log, 8-12
starting and stopping at runtime, 8-18,
18-6
tracking users, 8-17, B-7
ActivityLogSendToODBC command,
A-13
ActivityPrintOff command, A-14
ActivityPrintOn command, A-14
Addresses
assigning, 2-12
differences from ControlView, C-7
specifying for tags, 4-19
station, E-1, G-7
Addressing syntax, D-1
PLC-2, D-2
PLC-3, D-2
1
1
1
I-2
PLC-5, D-4
PLC-5 (Enhanced), D-6
SLC 5, D-9
SLC 5 (Enhanced), D-15
SoftLogix 5, D-20
Advanced objects, 11-36, G-1
Alarm banner, 6-7, 6-10, C-2
alarm label in, 6-42, 6-47
Alarm bells, configuring, 6-33
Alarm buffer zone. See Alarm deadband
Alarm commands
Acknowledge, 6-12, A-11
AcknowledgeAll, 6-12, A-12
Alarm, A-14
AlarmEvent, A-14
AlarmLogOff, A-16
AlarmLogOn, A-16
AlarmLogRemark, A-17
AlarmLogSendToODBC, A-18
AlarmOff, 6-10, 6-72, A-19
AlarmOn, 6-18, 6-71, A-19
AlarmPrintOff, A-19
AlarmPrintOn, A-19
AlarmViewer, A-19
Execute, 6-13
HandshakeOff, A-36
HandshakeOn, 6-18, A-37
Identify, 6-14, A-38
configuring alarms with, 6-44, 6-49
Silence, A-57
SilenceAll, A-57
Summary, A-57
Suppressed, A-58
SuppressOff, A-58
SuppressOffAll, A-58
SuppressOn, 6-12, 6-69, A-58
Alarm deadband, 6-2, 6-5, 6-45
Alarm events, 6-18
Alarm faults, 6-5, G-1
Index
Alarm log files, 6-8
adding remarks at runtime, 6-38
and third-party applications, 6-8
contents of, 6-9, 6-51, 16-9
creating, 6-24
deleting, 6-28
exporting to ODBC, 6-30
logging destinations, 6-23, 8-3
maximum number of, 6-29
naming, 6-29
short file names, 6-24
sharing at runtime, 17-2
storage format, ODBC, 16-10
storing in version 6.0 format, 6-23
Alarm Log Viewer, 6-9, 6-51
Alarm logging. See Alarm monitoring
Alarm message types, 6-8, 6-34
in alarm, 6-42, 6-47
out of alarm, 6-44, 6-50
system default, 6-35
user default, 6-36
Alarm messages, 6-37
configuring, 6-34, 6-43, 6-48
Alarm monitoring, 6-1, G-2
acknowledge bit, 6-16, 6-45, 6-50
alarm events, 6-18
differences from ControlView, C-2
handshake bit, 6-18, 6-45, 6-50
starting and stopping, 6-71, 18-6
Alarm printing, suppressing, 6-68
Alarm Setup editor, 6-21, 6-22
Alarm severity, 6-7, G-2
configuring, 6-32, 6-42, 6-47
Alarm states, 6-7, 6-46
Alarm status display, C-2
Alarm summary, 6-10, G-2
configuring
alarm label, 6-42, 6-47
buttons, 6-59
colors, 6-7, 6-58
fonts, 6-57
headings, 6-56
creating, 6-52
displaying, 12-50
filtering data in, 6-62
sorting data in, 6-65
using commands in, 6-66, 6-67
using system tags in, 6-11
using wildcards in, 6-63
Alarm Summary editor, 6-52
Alarm system tags, 6-11, B-1
Alarm thresholds, 6-2, 6-4, 6-41
AlarmEvent command, A-14
AlarmLogRemark command, 6-38, A-17
using with Execute button in alarm
summary, 6-67
AlarmLogSendToODBC command, A-18
AlarmPrintOff command, 6-68, A-19
AlarmPrintOn command, 6-68, A-19
Alarms
acknowledging, 6-12, 6-16
adding to tags, 4-26, 6-2
assigning sounds to, 6-33
configuring, 6-4
for analog tags, 6-40
for digital tags, 6-46
using Tag Database editor, 6-2, 6-21,
6-39
expressions in, 6-15, 14-2
identifying, 6-14, 6-44, 6-49
suppressing, 6-12, 6-69
viewing suppressed alarms, 6-69
Allen-Bradley devices, 2-1, 2-3
ALM_ (alarm) functions, 6-15, 6-16, 14-14
Alt-key combinations, disabling, 18-5
Analog tags, 4-2, G-2
alarms for, 4-26, 6-2, 6-39
configuring, 4-13
1
1
I-3 1
Index
Animation, 12-1, 12-7, 12-60
checking, 12-57
defining range of motion for, 12-9
for ActiveX objects, 12-32
for grouped objects, 11-83, 12-56
setting minimum and maximum values
for, 12-8
testing, 12-6
using Current [Tag] parameter, 12-46
using display keys, 12-52
using object keys, 12-40, 12-43
using Object Smart Path, 12-6, 12-9
using tags and placeholders, 12-6
viewing, 12-58
Animation dialog box, 12-4
Animation types, 12-2
color, 6-10, 12-13
fill, 12-18
height, 12-23
horizontal position, 12-19
horizontal slider, 12-28
OLE verb, 10-10, 12-31
rotation, 12-24
touch, 12-27
vertical position, 12-20
vertical slider, 12-30
visibility, 6-10, 12-12
width, 12-21
Application commands
AppAbort, A-20
AppActivate, A-20
AppStart, A-20
Applications, Windows, A-20
sharing data with, 16-1, 16-3
Arc graphic object, 11-32
Arithmetic operators, 14-9
Arrow graphic object, 11-53
Asynchronous execution
and the = (Equal) command, 14-6, A-8
and the Set command, A-54
1
1
1
I-4
B
Background scan period, 2-16, 2-17
Bar graphs, importing from ControlView,
C-6
Beep command, A-21
Bells for alarms, 6-33
Bitwise operators
AND, &, 14-12
complement, ~, 14-12
exclusive OR, ^, 14-12
inclusive OR, |, 14-12
left shift, <<, 14-12
right shift, >>, 14-12
Blinking colors, 6-58, 12-14
Block transfer mnemonics, D-26
Built-in functions
file, 14-19
math, 14-20
tag, 14-14
time, 14-16
Buttons, 11-55
highlight, enabling or disabling, 11-56
C
C-Toolkit, C-8
Channel commands
Channel, A-21
DriverPrimary, 2-10, A-34
DriverSecondary, 2-10, A-34
DriverToggle, 2-10, A-34
Channel editor, 2-6
Channels, 2-2, G-2
configuring, 2-6, 2-19
configuring nodes for, 2-12
Circle graphic object, 11-30
Class command, A-21
Client, G-2
See also DDE; OPC
Index
Color
in alarm summaries, 6-58
in graphic displays, 11-6, 11-21, 11-93
animating, 6-10, 12-13
in trends, 13-19, 13-37
COMM_ERR function, 2-11, 14-14
Command line, using, A-5
Command Wizard, A-5
CommandLine command, A-21
Commands, 15-4, A-1
See also Individual command entries
assigning security to, 10-5
attaching to ActiveX events, 12-36
differences from ControlView, C-3
in buttons, 11-57
in events, 9-1
logging execution of, 8-12
placeholders in, 15-8, A-3
precedence over macros, A-4
startup and shutdown, 11-22
using with alarms, 6-13
Communications
DDE, configuring, 3-1
devices, 2-2
direct driver, configuring, 2-1
errors, 2-11, 14-14
logging, 2-18, 8-12
monitoring, 2-18, B-2
OPC, configuring, 3-1
setting up without hardware or software,
2-3, 2-9
setting up without network, 2-19
timeouts, preventing, 2-13, 3-6, 3-12
Communications commands
ComStatusOff, A-22
ComStatusOn, A-22
DriverPrimary, 2-10, A-34
DriverSecondary, 2-10, A-34
DriverToggle, 2-10, A-34
NodeDisable, 2-15, 3-14, A-43
NodeEnable, 2-15, 3-14, A-43
NodeSwitch, 2-15, 3-14, A-43
RTDataServerOff, A-51
RTDataServerOn, 16-24, 17-6, A-52
RTDataWriteDisable, A-52
RTDataWriteEnable, 16-27, 17-6, A-53
Components, 1-3, 17-1
Constants, in expressions, 14-9
Context menus, 11-3
Control. See Animation
Control mnemonics, D-23
ControlNet, 2-7, G-2
ControlView
differences from RSView32, C-1
features no longer supported, C-8
importing projects into RSView32, C-1
Counter mnemonics, D-23
Crystal Reports, 7-1, 8-1
Ctrl-key combinations, disabling, 10-18,
18-5
Current [Tag] parameter, 12-46
Current [tag] parameter, 12-54
D
Data log files
and third-party software, 7-1
bringing into Microsoft Excel, 16-5
creating, 7-28
deleting, 7-33
maximum at runtime, 7-1
naming, 7-4
sharing at runtime, 17-2
storage format, 7-2
narrow .dbf, 7-3, 16-12
ODBC, 7-1, 7-8, 16-15
wide .dbf, 7-3, 16-13
Data log models, 7-1, 7-11, 7-42
Data Log Setup editor, 7-9, 7-10, A-23
1
1
I-5 1
Index
Data logging, G-2
and events, 7-39, 9-1
changing rate at runtime, 7-44, A-23
choosing the data to log, 7-41
creating expressions for, 14-2
differences from ControlView, C-4
displaying data in trends, 7-45, 13-13
on demand, 7-38, 7-40, A-26
paths, 7-22, A-25
backup, 7-21
moving data between, 7-27, A-23
switching at runtime, 7-26, 7-42,
7-43, A-26
setting up, 7-1, 7-36, A-25
starting and stopping, 7-46, 18-7, A-24,
A-25
using a new ODBC data source, 7-13,
7-16
using an existing ODBC data source,
7-8, 7-13
Data logging commands
DataLog, A-23
DataLogChangeRate, A-23
DataLogMergeToPrimary, 7-27, A-23
DataLogNewFile, 7-32, A-24
DataLogOff, 7-47, A-24
DataLogOn, 7-46, A-25
DataLogPath, 7-43, A-25
DataLogRenameFile, A-25
DataLogSnapshot, 7-39, 9-1, A-26
DataLogSwitchBack, 7-26, A-26
Data source for tags, 4-2, 4-18
Data types for tags, 4-15
Database command, A-22
Database Import & Export Wizard, 4-21,
4-25, 4-26
DatabaseSync command, A-22
dBASE IV. See .dbf files
DCOM, 17-5
1
1
1
I-6
DDE, 3-4, G-3
and Microsoft Excel, 3-12, 16-25, 16-27
and RSLinx, 16-28, A-27
and RSServer, 3-1
and WINtelligent LOGIC 5, A-27
and WINtelligent RECIPE, A-27
poll rate, 3-15
RSView32 as client, G-2
assigning server to RSView32 tags,
4-19
requesting values from server, 16-26
setting up, 3-5, 3-11
RSView32 as server, G-7
enabling, 16-24, A-52
at startup, 18-7
for tag writes, 16-27, A-53
setting up local client, 16-25
DDE commands
DDEExecute, 16-28, A-26
NodeDisable, 3-14, A-43
NodeEnable, 3-14, A-43
NodeSwitch, 3-14, A-43
RTDataServerOff, A-51
RTDataServerOn, 16-24, 17-6, A-52
RTDataWriteDisable, A-52
RTDataWriteEnable, 16-27, 17-6, A-53
DDE nodes
assigning to tags, 4-19
changing at runtime, 3-14, A-43
creating, 3-11
enabling and disabling, 3-12
naming, G-5
Deadband for alarms, 6-2, 6-5, 6-45
Define command, 15-12, A-28
Derived tag commands
Derived, A-29
DerivedOff, 5-8, A-29
DerivedOn, 5-7, A-30
Index
Derived tags, G-3
and cached displays, 5-8
creating, 5-5
creating expressions for, 14-2
differences from ControlView, C-5
editing, 5-6
evaluation interval for, 5-4
maximum files at runtime, 5-2
maximum in a file, 5-2
starting and stopping processing, 5-7,
18-7
Derived Tags editor, 5-3
Device nodes, 2-3
assigning to tags, 4-18
changing at runtime, 2-15, A-43
creating, 2-12
enabling and disabling, 2-13
naming, G-5
station addressing for, E-1
Device tags, D-1, G-3
DH, 2-7, E-1, G-3
DH+, 2-7, E-1, G-3
DH-485, 2-7, E-1, G-3
Digital tags, 4-2, G-3
alarms for, 4-26, 6-7, 6-46
configuring, 4-16
Direct drivers, 2-2
backup, 2-9
configuring RSLinx, 2-5
None Loaded type, 2-9, 2-19
primary, 2-9
secondary, 2-9
selecting, 2-5
setting up, 2-3
setting up tags for, 4-18
switching at runtime, 2-10
Disk space, monitoring, 6-27
Display cache, 11-15, 15-4, G-3
Display command, 15-3, A-30
and events, 9-1
and graphic displays, 11-19, 11-20, 11-27
and key lists, 12-56
and parameter files, 11-38, 11-40
and trends, 13-26
Display editor. See Graphic Display editor
Display keys, 15-5, G-4
creating, 12-52
editing, 12-54
key list, 12-54
precedence among key types, 15-14
Display Settings dialog box, 11-11
Display types, 15-3
Displays. See Graphic displays
Documentation for RSView32, P-1
Download command, 11-47, 11-64, A-33
DownloadAll command, 11-47, 11-64,
A-34
Drawing objects. See Graphic object types;
Graphic objects
Driver commands
DriverPrimary, 2-10, A-34
DriverSecondary, 2-10, A-34
DriverToggle, 2-10, A-34
E
EchoOff command, 8-13, A-35
EchoOn command, 8-13, A-35
Edit mode. See Getting Results with
RSView32
Editors, G-4
Activity Log Setup, 8-2
Activity Log Viewer, 8-16
Alarm Log Viewer, 6-9, 6-51
Alarm Setup, 6-21, 6-22
Alarm Summary, 6-52
Channel, 2-6
Data Log Setup, 7-9, 7-10
Derived Tags, 5-3
1
1
I-7 1
Index
Editors (continued)
Display, 11-2
Events, 9-2
Global Keys, 15-19
Library, 11-103
Macro, 15-8
Node, 2-12, 3-5, 3-11
Parameters, 11-39
Recipe, 11-61
Scan Class, 2-17
Security Codes, 10-4
Startup, 18-2
Suppressed List, 6-12, 6-69
Tag Database, 4-4, 6-21, 6-39
Tag Monitor, 4-28
User Accounts, 10-12
Ellipse graphic object, 11-30
Ethernet, E-2, E-8
Event, ActiveX, 12-36, G-4
Event commands
Event, A-35
EventOff, 9-7, A-35
EventOn, 9-7, A-35
Event detector, G-4
Event-based alarms, 6-18
Events, G-4
creating, 2-11, 9-1, 9-5
creating expressions for, 9-6, 14-2
differences from ControlView, C-5
editing, 9-6
evaluation interval for, 9-4
for activity logging, 8-7
for on demand logging, 7-39
maximum files at runtime, 9-2
maximum in a file, 9-2
starting and stopping processing, 9-7,
18-7
Events editor, 9-2
Excel. See Microsoft Excel
Execute button, in alarm summaries, 6-13,
6-66
1
1
1
I-8
Execute command, 6-13
Exporting
activity log, to ODBC, 8-10
alarm log, to ODBC, 6-30
Expression, G-4
Expressions, 14-1
alarm events in, 6-20
and animation, 12-7
built-in functions in, 14-14
constants in, 14-9
copying, 14-4
creating, 14-3
formatting, 14-5
if-then-else logic in, 14-23
in activity logging, 8-7
in alarms, 6-15
in data logging, 7-39
in derived tags, 5-6
in events, 9-6
in the = (Equal) command, 14-6, A-8
operators in, 14-9
evaluation order of, 14-20
tags and placeholders in, 4-4, 12-4, 14-8
using to report communication errors,
14-14
using to retrieve alarm information, 6-15
F
F1, precedence, 15-15
Failure of primary network at runtime,
2-10
File names
and /P parameter, 1-8
and spaces, 1-8
in RSView32, 1-2
long, 1-8, 6-24
for data logs, 7-4, 7-8
maximum length of, 1-8
Index
File names (continued)
short, 8-4
for activity logs, 8-10
for alarm logs, 6-29
File types
graphics
importing, 11-99
using bitmaps, 11-100
log
.dbf, 16-3
activity, 8-1, 8-9, 8-16
alarm, 6-8, 6-29
data, 7-1, 7-2
.obf, 7-8
ODBC
activity, 8-10
alarm, 6-30
project, .rsv, 1-1
sound, .wav, 6-33, A-21, A-45
File-based trends, 7-45, 13-3, 13-13
Fill animation, 12-18
FlushCache command, 11-27, A-36
and realtime trends, 13-26
executing shutdown command with,
11-22
using when processing stops, 5-8, 7-47,
9-7
Folders, 4-3, G-4
adding tags to, 4-9
creating, 4-7
Fonts
in alarm summary, 6-57
in graphic displays, 11-34
resized to fit object, 11-83
substitution at runtime, 11-35
in trends, 13-37, 13-38
Foreground scan period, 2-16, 2-17
Forms, in editors, G-4
FoxPro, 7-1, 8-1
Freehand graphic object, 11-32
Functions. See Built-in functions
G
GE programmable controller, 3-13
Global key commands
Key, 15-22, A-40
KeyEdit, A-40
Global keys, 15-5, G-4
creating, 15-19
differences from ControlView, C-5
precedence among key types, 15-14
running a key file, 15-21
on startup, 18-7
Global Keys editor, 15-19
Graphic display commands
Abort, 15-3, A-10
Display, 15-3, A-30
and events, 9-1
and key lists, 12-56
and parameter files, 11-38, 11-40
caching, 11-27, 13-26
positioning, 11-20
sizing, 11-19
Download, 11-47, 11-64, A-33
DownloadAll, 11-47, 11-64, A-34
FlushCache, 11-27, A-36
and realtime trends, 13-26
executing shutdown command with,
11-22
using when processing stops, 5-8,
7-47, 9-7
Graphic, A-36
NextPosition, 12-43, A-42
NextWindow, A-43
Parameter, A-44
Position, 12-43, A-45
PrevPosition, 12-43, A-46
PrevWindow, A-46
PrintDisplay, 11-104, A-46
PullForward, 15-3, A-48
PushBack, 15-3, A-49
RecipeEdit, A-50
1
1
I-9 1
Index
Graphic display commands (continued)
RecipeRestore, 11-64, A-51
RecipeSave, 11-65, A-51
ScreenPrint, 11-104, A-53
SendKeys, A-54
SetFocus, 11-14, A-56
Upload, 11-47, 11-65, A-60
UploadAll, 11-47, 11-65, A-60
Graphic Display editor, 11-2
Graphic displays, G-4
background color of, 11-21
caching, 11-15, 15-4
with the Display command, 11-27,
A-30
creating, 11-1
creating a background for, 11-98
creating a template for, 11-12
differences from ControlView, C-6
displaying alarm information in, 6-10
displaying in background, A-30
downloading values from, 11-42, 11-46
moving among, 15-1, 15-3, A-48, A-49
positioning, 11-20, A-32
preventing scroll bars in, 11-18
printing, 1-8, 11-104, A-46
reducing call-up time of, 11-15, 11-27,
A-31
replacing text in, 11-66
running multiple copies of, 11-14
securing, 10-9, 11-21
sharing at runtime, 17-2
sizing, 11-17, 11-19, A-31
specifying runtime appearance of, 11-16
starting at runtime, 18-7
startup and shutdown commands for,
11-22
testing, 11-4
animation, 12-6
types, 11-13
uploading recipes to, 11-59, 11-63
uploading values to, 11-42, 11-46
1
1
1
I-10
using parameter files in, A-31
Graphic libraries. See Libraries
Graphic object types, 11-28
ActiveX, 11-71, 12-32
advanced objects, 11-36
alarm summary, 6-10, 6-54
arcs, 11-32
arrows, 11-53
buttons, 11-55
circles, 11-30
ellipses, 11-30
freehand, 11-32
labels, 11-52
lines, 11-30
numeric display fields, 6-10, 11-49
numeric input fields, 11-42
OLE objects, 10-10, 11-67
polygons, 11-31
polylines, 11-31
recipe fields, 11-59
rectangles, 11-29
simple objects, 11-28, G-7
squares, 11-29
string display fields, 6-10, 11-49
string input fields, 11-42
tag monitor, 4-28
text, 11-33
trend, 13-5
wedges, 11-32
Graphic objects, G-4
aligning, 11-88
animating. See Animation
arranging, 11-83, 11-91
converting, 11-100
to wallpaper, 11-98
copying from other Windows
applications, 11-1
creating expressions for, 14-2
cutting and pasting, 11-79
deselecting, 11-7
duplicating, 11-81
Index
Graphic objects (continued)
editing, 11-78, 11-86
flipping, 11-92
formatting, 11-93
grouping and ungrouping, 11-83
importing, 11-99
moving, 11-78
naming, 11-77, 12-34
positioning, 11-86
with grid, 11-8
replacing text in, 11-66
reshaping, 11-36, 11-59
resizing, 11-82
rotating, 11-9
using keys to work with. See Special
keys
using tags and placeholders in, 11-37
using with object keys, 12-40
viewing hidden objects, 11-96
Grid
in graphic displays, 11-8
in trends, 13-10, 13-13, 13-37
H
Handshake bit, 6-18, 6-45, 6-50
HandshakeOff command, A-36
HandshakeOn command, 6-18, A-37
Height animation, 12-23
Help, online, P-1
Help command, A-37
Help files, displaying, 12-49
Highlight, enabling or disabling, 11-24
for buttons, 11-56
Historical trends, 7-45, 13-13, G-4
See also Trends
Horizontal position animation, 12-19
Horizontal slider animation, 12-28
Host name, E-2, E-8
I
Identify command, 6-14, A-38
configuring alarms with, 6-44, 6-49
If-then-else expressions, 14-23
nesting, 14-24
Index numbers, 12-43
and buttons, 11-56
and numeric input objects, 11-44
and recipe files, 11-60
and string input objects, 11-45
Input field commands
Display, /U parameter, A-30
Download, 11-47, 11-64, A-33
DownloadAll, 11-47, 11-64, A-34
NextPosition, 12-43, A-42
Position, 12-43, A-45
PrevPosition, 12-43, A-46
SendKeys, A-54
Upload, 11-47, 11-65, A-60
UploadAll, 11-47, 11-65, A-60
Input fields
creating
numeric, 11-42
recipe, 11-59
string, 11-42
downloading values from, 11-42, 11-46
highlight, enabling or disabling, 11-24
question marks in, 11-43, 11-46, 11-63
specifying behavior for, 11-24
specifying color for, 11-23
updating tag values in, A-30
uploading values to, 11-42, 11-46
using at runtime, 11-46, 11-63
using keys with
Shift-Tab, A-46
special keys, 11-46
Tab, A-42
1
1
I-11 1
Index
Input focus, specifying behavior, 11-24
Interactive objects, 11-23
Internet address, E-2, E-8
Internet technical support, P-2
Invoke command, 12-39, A-39
IP address. See Internet address
K
KA modules, E-2, E-6, E-9
Key command, 15-22, A-40
Key definitions, 15-14, G-5
precedence of, 15-14
using to open displays, 15-5
Key list, 12-54, 12-55, G-5
Keyboard, on-screen, 11-25, 11-48, A-30
KeyEdit command, A-40
Keypad for numeric input, 11-26
Keys
See also Special keys
reserved, 15-17
tips for using, 15-19
KT card, E-2, E-3, E-6
L
Label graphic object, 11-52
Libraries, 11-1, 11-102
using for alarm displays, 6-10
using for trends, 13-35
Library editor, 11-103
Line graphic object, 11-30
Local station, E-1, G-5
Local tags. See Memory tags
Local trends, 13-3, 13-14
See also Trends
Log files, G-5
See also Activity log files; Alarm log
files; Data log files; File types;
ODBC storage format
1
1
1
I-12
Logging in
and Windows NT security, 10-19
at runtime, 10-19
Logging paths. See Data logging, paths
Logical operators, 14-11
Login
command, 10-5, 10-19, A-40
macro, 10-17
Logout
command, 10-5, A-41
macro, 10-17
Long file names, 1-8
for data logs, 7-4, 7-8
M
Macro editor, 15-8
MacroEdit command, A-41
Macros, 15-7, G-5
attaching to ActiveX events, 12-37
creating, 15-7
login and logout, 10-17
startup and shutdown, 11-22, 15-11,
18-7
using the Command Wizard, A-5
nesting, 15-11
precedence of, 15-7, A-4
securing, 10-5
using commands in, 15-8
using in events, 9-1
using in graphics, 12-7
using parameters in, 15-10
using to identify alarms, 6-14
Memory tags, 4-3, 4-20, G-5
Messages
See also Alarm messages
clearing in activity bar, 8-15
mnemonics, D-25
number of, on a channel, 2-8
unsolicited, 2-1
Method, ActiveX, 12-38, 12-39, A-39
Index
Microsoft Access, 6-8, 7-8, 16-2
Microsoft DCOM, 17-5
Microsoft Excel, 16-3
and activity logging, 8-1, 16-5, 16-7
and alarm logging, 6-8, 16-5, 16-9
and data logging, 7-1, 16-5, 16-12
and DDE, 3-12
and OPC, 3-2
creating a pivot table, 16-17
requesting data from RSView32 using,
16-2, 16-25
using to create tags, 4-21
viewing log files in, 16-7
Microsoft Query, 7-16, 16-3
displaying log data in, 16-8, 16-10, 16-15
Microsoft SQL Server, 7-8
Microsoft Visual Basic, 3-2, 6-8
Mnemonic tables
block transfer, D-26
control, D-23
counter, D-23
message, D-25
PID, D-24
SFC status, D-26
timer, D-23
token data, D-26
Modicon devices, 3-1, 3-2
Modules
KA, E-2, E-6, E-9
RM, E-2, E-6, E-9
Momentary Off button, 11-57
Momentary On button, 11-57
Monitor command, A-41
N
Narrow .dbf format data log files, 16-12
NetDDE, G-3
command parameter, A-52, A-53
Networks
See also OPC
choosing, 2-7
failure at runtime, 2-10
sharing project components over, 17-1
NextPosition command, 12-43, A-42
NextWindow command, A-43
Node commands
Node, A-43
NodeDisable, 2-15, 3-14, A-43
NodeEnable, 2-15, 3-14, A-43
NodeSwitch, 2-15, 3-14, A-43
Node editor, 2-12, 3-5, 3-11
Nodes. See DDE nodes; Device nodes;
OPC nodes
Non-Allen-Bradley devices, 3-1, 3-2
NT 4.0 Desktop Lock tool, 10-18, 18-5
NT user accounts, moving to Windows 9x,
10-16
Number format, 18-12
Numeric display graphic object, 11-49
Numeric input graphic object, 11-42,
11-46
and on-screen keyboard, 11-25, 11-48
O
Object keys, 15-5, G-6
creating, 12-40
editing, 12-54
key list, 12-42, 12-55
precedence among key types, 15-14
Object Smart Path, 12-6, 12-9
Objects. See Graphic objects
ODBC data logging. See Data logging
1
1
I-13 1
Index
ODBC storage format, 7-1, 7-8, G-6
activity log files, 16-8
alarm log files, 16-10
contents of tables, 16-3, 16-15
Offlink address, E-3
OLE objects, 11-28, 11-67, G-6
attaching verb animation to, 12-31
securing, 10-10
using to link to other Windows
applications, 16-2
On-screen keyboard, 11-25, 11-48, A-30
Online help, P-1
OPC, 3-3, G-6
and Microsoft Excel, 3-2
and peer-to-peer network
communications, 17-5
and RSLinx, 3-1, 3-9
and RSLinx Gateway, 17-11
and Visual Basic, 3-2
list of servers, 17-5
RSView32 as client, G-2
assigning server to RSView32 tags,
4-19
requesting values from server, 16-26
setting up, 3-5, 17-7
RSView32 as server, 17-6, G-7
enabling, 16-24, 17-6, A-52
at startup, 18-7
for tag writes, 16-27, 17-6, A-53
setting up local client, 16-24
update rate, 3-15, 17-7
using with RSLinx Gateway, 17-10
OPC commands
NodeDisable, 3-14, A-43
NodeEnable, 3-14, A-43
NodeSwitch, 3-14, A-43
RTDataServerOff, A-51
RTDataServerOn, 16-24, 17-6, A-52
RTDataWriteDisable, A-52
RTDataWriteEnable, 16-27, 17-6, A-53
1
1
1
I-14
OPC nodes
assigning to tags, 4-19
changing at runtime, 3-14, A-43
creating, 3-5, 17-9
enabling and disabling, 3-6
naming, G-5
P
Parameter command, A-44
Parameter files, 11-39, A-31, G-6
Parameters editor, 11-39
Password command, 10-20, A-44
Passwords, 10-14, 10-20
Pause command, A-45
Peer-to-peer network communications,
17-5
PI. See Pyramid Integrator (PI)
PID mnemonics, D-24
Pivot table, 16-17
Placeholders, 6-35
See also Tag placeholders
in commands, 15-8, A-3
PlayWave command, A-45
PLC, 2-3, G-6
address scanning, 2-15
addressing syntax, 4-19, D-1
setting up communication with, 2-1
type, selecting for device node, 2-14
PLC-2 addressing syntax, D-2
PLC-3 addressing syntax, D-2
PLC-5 (Enhanced) addressing syntax, D-6
PLC-5 addressing syntax, D-4
Poke, G-6
Poll rate for DDE nodes, 3-15
Polygon graphic object, 11-31
Polyline graphic object, 11-31
Position command, 12-43, A-45
Index
Precedence
among global, object, and display keys,
15-14
and the F1 key, 15-15
embedded ActiveX objects, 15-15
embedded OLE objects, 15-16
reserved keys, 15-17
PrevPosition command, 12-43, A-46
PrevWindow command, A-46
Primary drivers, 2-8
PrintDisplay command, 11-104, A-46
Printers, selecting, 1-9
Programmable controllers, E-6
See also PLC
PLC addressing syntax, D-2
SLC addressing syntax, D-9
SoftLogix 5 addressing syntax, D-20
Project, moving, 10-16
Project commands
ProjectHide, A-48
ProjectRun, A-48
ProjectShow, 10-18, 18-5, A-48
ProjectStop, 10-18, 18-15, A-48
Quit, A-49
Project files, 1-1, 1-2, 1-7
moving and copying, 18-8
Project Manager, 1-3
preventing runtime access to, 10-18, 18-5
Projects, 1-1, G-6
See also Components
developing without a communications
network, 2-19
importing from ControlView, C-1
running, 18-1, 18-13
setting up in new location, 18-8
startup settings for, 18-2
stopping, 18-15
testing, 18-8
Property, ActiveX, 12-32, 12-35, A-39
Property Panel, ActiveX, 11-73, 12-34,
12-35
PullForward command, 15-3, A-48
PushBack command, 15-3, A-49
Pyramid Integrator (PI), E-2, E-6, E-8
Q
Question marks, in input fields, 11-43,
11-46, 11-63
Quit command, A-49
R
Ramp command, A-49
ReadMe file, P-2
Realtime data, accessing and updating,
16-24
Realtime trends, 13-3, 13-13, 13-26
See also Trends
Recipe commands
Download, 11-47, 11-64, A-33
DownloadAll, 11-47, 11-64, A-34
RecipeEdit, A-50
RecipeRestore, 11-64, A-51
RecipeSave, 11-65, A-51
Upload, 11-47, 11-65, A-60
UploadAll, 11-47, 11-65, A-60
Recipe editor, 11-61
Recipes, 11-59
and on-screen keyboard, 11-25, 11-48
managing, G-7
using at runtime, 11-61, 11-63
using index numbers for, 11-60, 12-43
Rectangle graphic object, 11-29
Relational operators, 14-10
Remark command, 8-12, A-51
Remarks, adding to alarm log file, 6-38
Remote station, E-2, G-7
Remote trends, 13-3, 13-14, G-7
Reserved keys, 15-17
RM modules, E-2, E-6, E-9
Rockwell Software, contacting, P-2
1
1
I-15 1
Index
Rotation animation, 12-24
Rounded rectangle graphic object, 11-29
RSLinx, 2-3, 2-5
and DDE, 16-28, A-27
and OPC, 3-1, 3-9
RSLinx Gateway, and OPC, 17-10, 17-11
RSServer, 3-1, 3-13
RSView32 commands, A-1
See also Commands; Individual
command entries
RSView32 Resource Kit, RegConfig tool,
6-15
RSView32 tools
ControlView Project Import Wizard,
C-1
NT 4.0 Desktop Lock, 10-18, 18-5
RTDataServerOff command, A-51
RTDataServerOn command, 16-24, 17-6,
A-52
RTDataWriteDisable command, A-52
RTDataWriteEnable command, 16-27,
17-6, A-53
Run mode. See Getting Results with
RSView32
Runtime
changing logging paths, 7-26, 7-42, 7-43,
A-25
changing logging rate, 7-44, A-23
changing nodes, 2-15, 3-14
changing passwords, 10-20
failure of primary network, 2-10
font substitution, 11-35
logging in, 10-19
project window appearance, 18-3
switching drivers, 2-10
time, date, and number formats, 18-12
using recipes, 11-61, 11-63
using trends, 13-38
1
1
1
I-16
S
Scan Class editor, 2-17, A-21
Scan classes, differences from
ControlView, C-7
Scan rate, G-7
assigning to tags, 4-19
for DDE nodes, 3-15
for device nodes, 2-15
for OPC nodes (update rate), 3-15
ScreenPrint command, 11-104, A-53
Scroll bars, preventing on graphic displays,
11-18
Seagate Crystal Reports, 7-1, 8-1
Secondary drivers, 2-8
Security, 10-1, 10-3, 10-7
See also Passwords
disabling access to key combinations,
10-18, 18-5
locking users into RSView32, 10-18, 18-5
preventing access to the Project
Manager, 10-18
using NT 4.0 Desktop Lock, 10-18
Windows NT user list, 10-1, 10-12
at runtime, 10-19
changing passwords, 10-20
Security codes, 10-4
assigning to commands, 10-5
assigning to graphic displays, 10-9, 11-21
assigning to macros, 10-5
assigning to OLE objects, 10-10
assigning to tags, 4-13, 4-17, 4-18
assigning to user accounts, 10-12
default, 10-5
Security Codes editor, 10-4
preventing access to, 10-6
Security command, 10-6, A-53
SendKeys command, A-54
Index
Server, G-7
See also DDE; OPC
Set command, 4-20, 9-1, A-54
SetFocus command, 11-14, A-56
SFC status mnemonics, D-26
Short file names
for activity logs, 8-10
for alarm logs, 6-29
Siemens devices, 3-1, 3-2
Silence command, A-57
SilenceAll command, A-57
SLC 5 (Enhanced) addressing syntax, C-7,
D-15
SLC 5 addressing syntax, C-7, D-9
SoftLogix 5, 2-3, 2-8, 2-14
addressing syntax, D-20
Special keys
Alt-F4, 18-5
Alt-Shift-Tab, 18-5
Alt-Tab, 18-5
arrows, using with graphic objects, 11-83
Ctrl
copying objects with, 11-79
drawing objects with, 11-29, 11-30,
11-31, 11-32
resizing objects with, 11-82
rotating objects with, 11-10
selecting objects with, 11-7
Ctrl-Alt-Del, 18-5
Ctrl-Alt-Esc, 18-5
Ctrl-Alt-P, 10-18, 18-5
Ctrl-F6, A-43
Ctrl-PgDn, 11-47, A-33
Ctrl-PgUp, 11-47, A-60
Ctrl-R, 11-63
Ctrl-Shift-F6, A-46
Ctrl-Shift-Tab, A-46
Ctrl-Tab, 14-5, A-43
Ctrl-W, 11-63
Enter, 11-47, 11-65, A-33
disabling, A-30
using with on-screen keyboard,
11-48
Minus (-), using with graphic objects,
11-79
PgDn, 11-47, 11-65
PgUp, 11-47, 11-65
Plus (+), using with graphic objects,
11-79
reserved keys, 12-42, 12-53, 15-20
Shift-Tab, 12-45, A-46
Shift, using with graphic objects, 11-35,
11-79, 11-83
Tab, 11-47, 12-45, A-42
Spreadsheets, in editors, G-7
Square graphic object, 11-29
Startup
command in graphic displays, 11-22
macro, 15-11
settings, 18-2, 18-6
Startup editor, 18-2
StartupConfig command, A-57
States
in alarms, 6-46
in tag monitor, 2-18, 4-31
Station address, G-7
entering, 2-13
local, E-1
offlink, E-9
remote, E-2
Status bar, 11-3
String display graphic object, 11-49
String input graphic object, 11-42, 11-46
and on-screen keyboard, 11-25, 11-48
String tags, 4-2, G-7
configuring, 4-17
Summary command, A-57
Suppressed command, A-58
Suppressed List editor, 6-12, 6-70
SuppressOff command, A-58
1
1
I-17 1
Index
SuppressOffAll command, A-58
SuppressOn command, 6-12, 6-69, A-58
Symbol commands
Define, 15-12, A-28
Undefine, 15-13, A-59
Symbols, 15-7, 15-12, G-7
Syntax, addressing, for PLCs and SLCs,
D-1
System tags, 4-2, B-1, G-8
for alarms, 6-11, B-1
for communications, 2-18, B-2
for trends, 13-28, B-5
System time and date, B-4
T
Tag browser, using, 4-22
Tag commands
= (Equal), 14-2, 14-6, A-8
using for memory tags, 4-20
Database, A-22
DatabaseSync, A-22
Monitor, A-41
Ramp, A-49
Set, 4-20, 9-1, A-54
Toggle, A-59
Tag Database editor, 4-4, 6-21, 6-39
Tag folders, 4-7
Tag Monitor editor, 4-28
Tag monitor graphic object, 2-18, 4-27
Tag placeholders, 11-36, 12-6, G-8
creating, 11-38
parameter for Display command, A-31
replacing by listing tag names, 11-40
replacing using a parameter file, 11-38
using in commands, A-33
using in expressions, 14-8
using in trends, 13-19
using the [tag] parameter, 12-46
using with object keys, 12-47
Tag substitution, 11-66, 13-35
1
1
1
I-18
Tag values
changing, 4-20
displaying in a label object, 11-52
downloading, 11-42, 11-46
logging, 4-27, 7-41
sharing locally, 16-24
sharing over a network, 17-5
updating, 2-15, 3-15, 11-46
uploading, 11-42, 11-46
Tags, 4-1, 11-36, G-8
See also [tag] parameter; Analog tags;
Derived tags; Digital tags; String
tags; System tags
adding alarms to, 4-26, 6-2
addresses, 4-19
and events, 9-1
checking in a graphic display, 12-58
creating, 4-6, 4-20
data sources, 4-2, 4-18
data types, 4-15
differences from ControlView, C-7
editing, 4-12
importing, 4-21, 4-23, 4-25, 4-26
logging reads and writes, 8-12
securing, 10-11
states, 2-18, 4-32
using in expressions, 4-4, 12-4, 14-8
with built-in functions, 14-14
using in graphic objects, 11-37
using in trends, 13-19
using with object keys, 12-42, 12-54
using with placeholders in commands,
15-8, A-3
writing to, 16-27
TCP/IP, 2-9, E-8, G-8
channel network type, 2-7
station addressing, 17-6, E-1, E-2
Technical support, P-2
Text graphic object, 11-33
Thresholds for alarms, 6-2, 6-4, 6-41
Time and date, 18-12, B-4
Index
Timer mnemonics, D-23
Toggle command, A-59
Token data mnemonics, D-26
Toolbars, 11-3, 11-4
Toolbox, ActiveX, 11-75
Tooltips, adding to graphic objects, 11-77
Touch animation, 12-27
Trend dialog box, 13-2
Trends, 13-1, G-8
comparing data using, 13-27
configuring, 13-2, 13-5, 13-37
grid lines, 13-13
legend, 13-4, 13-17, 13-25
marker, 13-39
pens, 13-3, 13-18, 13-32
shading, 13-4, 13-22
time axis, 13-7
using the graphic library, 13-35
vertical axis, 13-12
x-axis. See time axis
y-axis. See vertical axis
controlling
with expressions, 13-31
with tags, 13-15, 13-27, 13-35
data source, 7-45, 13-3, 13-13
differences from ControlView, C-8
displaying tag values in, 13-3, 13-19
editing, 13-40
file-based, 13-13
historical, 13-13
local, 13-14
realtime, 13-13, 13-26
remote, 13-14
start time, 13-8, 13-33
using at runtime, 13-38
U
Undefine command, 15-13, A-59
Unsolicited messages, 2-1
Update rate for OPC nodes, 3-15
Upload command, 11-47, 11-65, A-60
UploadAll command, 11-47, 11-65, A-60
User account commands
Account, 10-6, A-11
Login, 10-5, 10-19, A-40
Logout, 10-5, A-41
Password, 10-20, A-44
User accounts, 10-12
assigning passwords to, 10-14
changing at runtime, 10-20
displaying current user, B-7
login and logout macros for, 10-17
maintaining in Windows NT, 10-1, 10-12
modifying after moving project, 10-16
tracking system usage by, 8-16
User Accounts editor, 10-12
preventing access to, 10-6
V
Value table, 4-1, 4-3, 5-1
updating, 2-15, 3-15
VBA commands
VbaEdit, A-60
VBAExec, 9-1
VbaExec, A-60
VBA programs. See Getting Results with
RSView32 Scripting
Vertical position animation, 12-20
Vertical slider animation, 12-30
Visibility animation, 6-10, 12-12
Visual Basic, 3-2, 6-8
Visual FoxPro, 7-1, 8-1
1
1
I-19 1
Index
W
Wallpaper, converting graphic objects to,
11-98
Wedge graphic object, 11-32
Wide .dbf format data log files, 16-13
Width animation, 12-21
Wildcards, 4-3, 4-6, 4-29
and commands, A-2
using to select tags, 6-63
1
1
1
I-20
using to suppress alarm monitoring, 6-69
Windows applications, A-20
preventing operator access to, 18-5
using with RSView32, 16-1
Windows NT, security, 10-1, 10-12, 10-20
WINtelligent LINX, 2-3
WINtelligent LOGIC 5, A-27
WINtelligent RECIPE, A-27
World Wide Web, using for technical
support, P-2