1
Netmon User Guide
Version 5.2
c 2011 Netmon, Inc.
Copyright Contents
1 Hardware Support in Netmon SE
Hardware Support . . . . . . . . . . . . . . . . . . . . . . . . . . . . . . . . . . . . . . . . . . . . .
2
2
2 Installation and Deployment Guide
Beginning the installation . . . . . . . .
Debian-installer . . . . . . . . . . . . . .
Network configuration with DHCP . . .
Partitioning disks . . . . . . . . . . . . .
Package Installation . . . . . . . . . . .
Completing the installation . . . . . . .
6
6
6
7
7
7
7
.
.
.
.
.
.
.
.
.
.
.
.
.
.
.
.
.
.
.
.
.
.
.
.
.
.
.
.
.
.
.
.
.
.
.
.
.
.
.
.
.
.
.
.
.
.
.
.
.
.
.
.
.
.
.
.
.
.
.
.
.
.
.
.
.
.
.
.
.
.
.
.
.
.
.
.
.
.
.
.
.
.
.
.
.
.
.
.
.
.
.
.
.
.
.
.
.
.
.
.
.
.
.
.
.
.
.
.
.
.
.
.
.
.
.
.
.
.
.
.
.
.
.
.
.
.
.
.
.
.
.
.
.
.
.
.
.
.
.
.
.
.
.
.
.
.
.
.
.
.
.
.
.
.
.
.
.
.
.
.
.
.
.
.
.
.
.
.
.
.
.
.
.
.
.
.
.
.
.
.
.
.
.
.
.
.
.
.
.
.
.
.
.
.
.
.
.
.
3 Getting Started
10
4 Monitoring Network Activity
17
5 Monitoring Network Services
27
6 Monitoring Devices
Introduction to Simple Network Management Protocol
Using the SNMP Automatic Discovery Service . . . .
Using the Devices Explorer . . . . . . . . . . . . . . .
Using the Device Toolbar . . . . . . . . . . . . . . . .
Using the Interface Explorer . . . . . . . . . . . . . . .
Device Dashboards . . . . . . . . . . . . . . . . . . . .
Browsing SNMP MIBs . . . . . . . . . . . . . . . . . .
Managing Custom SNMP MIBs . . . . . . . . . . . . .
Using the OID Tracker Service . . . . . . . . . . . . .
Processing SNMP Trap Messages . . . . . . . . . . . .
Using the Notes Manager . . . . . . . . . . . . . . . .
(SNMP)
. . . . .
. . . . .
. . . . .
. . . . .
. . . . .
. . . . .
. . . . .
. . . . .
. . . . .
. . . . .
.
.
.
.
.
.
.
.
.
.
.
.
.
.
.
.
.
.
.
.
.
.
.
.
.
.
.
.
.
.
.
.
.
.
.
.
.
.
.
.
.
.
.
.
.
.
.
.
.
.
.
.
.
.
.
.
.
.
.
.
.
.
.
.
.
.
.
.
.
.
.
.
.
.
.
.
.
.
.
.
.
.
.
.
.
.
.
.
.
.
.
.
.
.
.
.
.
.
.
.
.
.
.
.
.
.
.
.
.
.
.
.
.
.
.
.
.
.
.
.
.
.
.
.
.
.
.
.
.
.
.
.
.
.
.
.
.
.
.
.
.
.
.
.
.
.
.
.
.
.
.
.
.
.
.
.
.
.
.
.
.
.
.
.
.
.
.
.
.
.
.
.
.
.
.
.
.
.
.
.
.
.
.
.
.
.
.
.
.
.
.
.
.
.
.
.
.
.
.
.
.
.
.
.
.
.
.
.
.
.
.
.
.
.
.
.
.
.
.
.
30
30
32
33
35
36
38
38
39
40
42
43
7 Monitoring Windows Systems
44
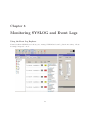
8 Monitoring SYSLOG and Event Logs
46
9 Monitoring Disks and Partitions
49
1
10 Monitoring Websites and Web Applications
54
11 Netmon Reports
56
12 File Management
64
13 Administration and Management
66
14 Troubleshooting Guide
80
15 Database Reference
agg netflow . . . . . . .
agg snmp log . . . . . .
alert commands . . . . .
alert handler2command
alert handlers . . . . . .
alert medias . . . . . . .
alert pending . . . . . .
alert triggers . . . . . .
alert types . . . . . . . .
alert vars . . . . . . . .
backup events . . . . . .
backups . . . . . . . . .
conditionals . . . . . . .
daemons . . . . . . . . .
daemonsconfig . . . . .
devices . . . . . . . . . .
devices notes . . . . . .
df server log . . . . . . .
df servers . . . . . . . .
fs directories . . . . . .
fs files . . . . . . . . . .
groups . . . . . . . . . .
hosts . . . . . . . . . . .
ignored http extensions
interfaces . . . . . . . .
localnets . . . . . . . . .
netflow . . . . . . . . . .
netmon . . . . . . . . .
netmon auth . . . . . .
oid log . . . . . . . . . .
oids . . . . . . . . . . .
permission2groups . . .
permission categories . .
permissions . . . . . . .
plugins . . . . . . . . . .
protocol breakdown . .
.
.
.
.
.
.
.
.
.
.
.
.
.
.
.
.
.
.
.
.
.
.
.
.
.
.
.
.
.
.
.
.
.
.
.
.
.
.
.
.
.
.
.
.
.
.
.
.
.
.
.
.
.
.
.
.
.
.
.
.
.
.
.
.
.
.
.
.
.
.
.
.
.
.
.
.
.
.
.
.
.
.
.
.
.
.
.
.
.
.
.
.
.
.
.
.
.
.
.
.
.
.
.
.
.
.
.
.
.
.
.
.
.
.
.
.
.
.
.
.
.
.
.
.
.
.
.
.
.
.
.
.
.
.
.
.
.
.
.
.
.
.
.
.
.
.
.
.
.
.
.
.
.
.
.
.
.
.
.
.
.
.
.
.
.
.
.
.
.
.
.
.
.
.
.
.
.
.
.
.
.
.
.
.
.
.
.
.
.
.
.
.
.
.
.
.
.
.
.
.
.
.
.
.
.
.
.
.
.
.
.
.
.
.
.
.
.
.
.
.
.
.
.
.
.
.
.
.
.
.
.
.
.
.
.
.
.
.
.
.
.
.
.
.
.
.
.
.
.
.
.
.
.
.
.
.
.
.
.
.
.
.
.
.
.
.
.
.
.
.
.
.
.
.
.
.
.
.
.
.
.
.
.
.
.
.
.
.
.
.
.
.
.
.
.
.
.
.
.
.
.
.
.
.
.
.
.
.
.
.
.
.
.
.
.
.
.
.
.
.
.
.
.
.
.
.
.
.
.
.
.
.
.
.
.
.
.
.
.
.
.
.
.
.
.
.
.
.
.
.
.
.
.
.
.
.
.
.
.
.
.
.
.
.
.
.
.
.
.
.
.
.
.
.
.
.
.
.
.
.
.
.
.
.
.
.
.
.
.
.
.
.
.
.
.
.
.
.
.
.
.
.
.
.
.
.
.
.
.
.
.
.
.
.
.
.
.
.
.
.
.
.
.
.
.
.
.
.
.
.
.
.
.
.
.
.
.
.
.
.
.
.
.
.
.
.
.
.
.
.
.
.
.
.
.
.
.
.
.
.
.
.
.
.
.
.
.
.
.
.
.
.
.
.
.
.
.
.
.
.
.
.
.
.
.
.
.
.
.
.
.
.
.
.
.
.
.
.
.
.
.
.
.
.
.
.
.
.
.
.
.
.
.
.
.
.
.
.
.
.
.
.
.
.
.
.
.
.
.
.
.
.
.
.
.
.
.
.
.
.
2
.
.
.
.
.
.
.
.
.
.
.
.
.
.
.
.
.
.
.
.
.
.
.
.
.
.
.
.
.
.
.
.
.
.
.
.
.
.
.
.
.
.
.
.
.
.
.
.
.
.
.
.
.
.
.
.
.
.
.
.
.
.
.
.
.
.
.
.
.
.
.
.
.
.
.
.
.
.
.
.
.
.
.
.
.
.
.
.
.
.
.
.
.
.
.
.
.
.
.
.
.
.
.
.
.
.
.
.
.
.
.
.
.
.
.
.
.
.
.
.
.
.
.
.
.
.
.
.
.
.
.
.
.
.
.
.
.
.
.
.
.
.
.
.
.
.
.
.
.
.
.
.
.
.
.
.
.
.
.
.
.
.
.
.
.
.
.
.
.
.
.
.
.
.
.
.
.
.
.
.
.
.
.
.
.
.
.
.
.
.
.
.
.
.
.
.
.
.
.
.
.
.
.
.
.
.
.
.
.
.
.
.
.
.
.
.
.
.
.
.
.
.
.
.
.
.
.
.
.
.
.
.
.
.
.
.
.
.
.
.
.
.
.
.
.
.
.
.
.
.
.
.
.
.
.
.
.
.
.
.
.
.
.
.
.
.
.
.
.
.
.
.
.
.
.
.
.
.
.
.
.
.
.
.
.
.
.
.
.
.
.
.
.
.
.
.
.
.
.
.
.
.
.
.
.
.
.
.
.
.
.
.
.
.
.
.
.
.
.
.
.
.
.
.
.
.
.
.
.
.
.
.
.
.
.
.
.
.
.
.
.
.
.
.
.
.
.
.
.
.
.
.
.
.
.
.
.
.
.
.
.
.
.
.
.
.
.
.
.
.
.
.
.
.
.
.
.
.
.
.
.
.
.
.
.
.
.
.
.
.
.
.
.
.
.
.
.
.
.
.
.
.
.
.
.
.
.
.
.
.
.
.
.
.
.
.
.
.
.
.
.
.
.
.
.
.
.
.
.
.
.
.
.
.
.
.
.
.
.
.
.
.
.
.
.
.
.
.
.
.
.
.
.
.
.
.
.
.
.
.
.
.
.
.
.
.
.
.
.
.
.
.
.
.
.
.
.
.
.
.
.
.
.
.
.
.
.
.
.
.
.
.
.
.
.
.
.
.
.
.
.
.
.
.
.
.
.
.
.
.
.
.
.
.
.
.
.
.
.
.
.
.
.
.
.
.
.
.
.
.
.
.
.
.
.
.
.
.
.
.
.
.
.
.
.
.
.
.
.
.
.
.
.
.
.
.
.
.
.
.
.
.
.
.
.
.
.
.
.
.
.
.
.
.
.
.
.
.
.
.
.
.
.
.
.
.
.
.
.
.
.
.
.
.
.
.
.
.
.
.
.
.
.
.
.
.
.
.
.
.
.
.
.
.
.
.
.
.
.
.
.
.
.
.
.
.
.
.
.
.
.
.
.
.
.
.
.
.
.
.
.
.
.
.
.
.
.
.
.
.
.
.
.
.
.
.
.
.
.
.
.
.
.
.
.
.
.
.
.
.
.
.
.
.
.
.
.
.
.
.
.
.
.
.
.
.
.
.
.
.
.
.
.
.
.
.
.
.
.
.
.
.
.
.
.
.
.
.
.
.
.
.
.
.
.
.
.
.
.
.
.
.
.
.
.
.
.
.
.
.
.
.
.
.
.
.
.
.
.
.
.
.
.
.
.
.
.
.
.
.
.
.
.
.
.
.
.
.
.
.
.
.
.
.
.
.
.
.
.
.
.
.
.
.
.
.
.
.
.
.
.
.
.
.
.
.
.
.
.
.
.
.
.
.
.
.
.
.
.
.
.
.
.
.
.
.
.
.
.
.
.
.
.
.
.
.
.
.
.
.
.
.
.
.
.
.
.
.
.
.
.
.
.
.
.
.
.
.
.
.
.
.
.
.
.
.
.
.
.
.
.
.
.
.
.
.
.
.
.
.
.
.
.
.
.
.
.
.
.
.
.
.
.
.
.
.
.
.
.
.
.
.
.
.
.
.
.
.
.
.
.
.
.
.
.
.
.
.
.
.
.
.
.
.
.
.
.
.
.
.
.
.
.
.
.
.
.
.
.
.
.
.
.
.
.
.
.
.
.
.
.
.
.
.
.
.
.
.
.
.
.
.
.
.
.
.
.
.
.
.
.
.
.
.
.
.
.
.
.
.
.
.
.
.
.
.
.
.
.
.
.
.
82
82
82
83
83
83
84
84
84
85
85
85
86
86
86
87
87
88
88
89
89
90
90
90
90
91
91
92
92
93
93
94
94
94
94
95
95
protocols . . . .
server log . . . .
servers . . . . . .
smb hosts . . . .
smb server log .
smb servers . . .
snmp log . . . .
snmp mib files .
snmp oid trans .
snmp traps trans
snmpoids . . . .
snmptrap log . .
snmptrapoids . .
syslog . . . . . .
syslog access . .
url log . . . . . .
urls . . . . . . .
user2groups . . .
user sessions . .
users . . . . . . .
web traffic . . . .
.
.
.
.
.
.
.
.
.
.
.
.
.
.
.
.
.
.
.
.
.
.
.
.
.
.
.
.
.
.
.
.
.
.
.
.
.
.
.
.
.
.
.
.
.
.
.
.
.
.
.
.
.
.
.
.
.
.
.
.
.
.
.
.
.
.
.
.
.
.
.
.
.
.
.
.
.
.
.
.
.
.
.
.
.
.
.
.
.
.
.
.
.
.
.
.
.
.
.
.
.
.
.
.
.
.
.
.
.
.
.
.
.
.
.
.
.
.
.
.
.
.
.
.
.
.
.
.
.
.
.
.
.
.
.
.
.
.
.
.
.
.
.
.
.
.
.
.
.
.
.
.
.
.
.
.
.
.
.
.
.
.
.
.
.
.
.
.
.
.
.
.
.
.
.
.
.
.
.
.
.
.
.
.
.
.
.
.
.
.
.
.
.
.
.
.
.
.
.
.
.
.
.
.
.
.
.
.
.
.
.
.
.
.
.
.
.
.
.
.
.
.
.
.
.
.
.
.
.
.
.
.
.
.
.
.
.
.
.
.
.
.
.
.
.
.
.
.
.
.
.
.
.
.
.
.
.
.
.
.
.
.
.
.
.
.
.
.
.
.
.
.
.
.
.
.
.
.
.
.
.
.
.
.
.
.
.
.
.
.
.
.
.
.
.
.
.
.
.
.
.
.
.
.
.
.
.
.
.
.
.
.
.
.
.
.
.
.
.
.
.
.
.
.
.
.
.
.
.
.
.
.
.
.
.
.
.
.
.
.
.
.
.
.
.
.
.
.
.
.
.
.
.
.
.
.
.
.
.
.
.
.
.
.
.
.
.
.
.
.
.
.
.
.
.
.
.
.
.
.
.
.
.
.
.
.
.
.
.
.
.
.
.
.
.
.
.
.
.
3
.
.
.
.
.
.
.
.
.
.
.
.
.
.
.
.
.
.
.
.
.
.
.
.
.
.
.
.
.
.
.
.
.
.
.
.
.
.
.
.
.
.
.
.
.
.
.
.
.
.
.
.
.
.
.
.
.
.
.
.
.
.
.
.
.
.
.
.
.
.
.
.
.
.
.
.
.
.
.
.
.
.
.
.
.
.
.
.
.
.
.
.
.
.
.
.
.
.
.
.
.
.
.
.
.
.
.
.
.
.
.
.
.
.
.
.
.
.
.
.
.
.
.
.
.
.
.
.
.
.
.
.
.
.
.
.
.
.
.
.
.
.
.
.
.
.
.
.
.
.
.
.
.
.
.
.
.
.
.
.
.
.
.
.
.
.
.
.
.
.
.
.
.
.
.
.
.
.
.
.
.
.
.
.
.
.
.
.
.
.
.
.
.
.
.
.
.
.
.
.
.
.
.
.
.
.
.
.
.
.
.
.
.
.
.
.
.
.
.
.
.
.
.
.
.
.
.
.
.
.
.
.
.
.
.
.
.
.
.
.
.
.
.
.
.
.
.
.
.
.
.
.
.
.
.
.
.
.
.
.
.
.
.
.
.
.
.
.
.
.
.
.
.
.
.
.
.
.
.
.
.
.
.
.
.
.
.
.
.
.
.
.
.
.
.
.
.
.
.
.
.
.
.
.
.
.
.
.
.
.
.
.
.
.
.
.
.
.
.
.
.
.
.
.
.
.
.
.
.
.
.
.
.
.
.
.
.
.
.
.
.
.
.
.
.
.
.
.
.
.
.
.
.
.
.
.
.
.
.
.
.
.
.
.
.
.
.
.
.
.
.
.
.
.
.
.
.
.
.
.
.
.
.
.
.
.
.
.
.
.
.
.
.
.
.
.
.
.
.
.
.
.
.
.
.
.
.
.
.
.
.
.
.
.
.
.
.
.
.
.
.
.
.
.
.
.
.
.
.
.
.
.
.
.
.
.
.
.
.
.
.
.
.
.
.
.
.
.
.
.
.
.
.
.
.
.
.
.
.
.
.
.
.
.
.
.
.
.
.
.
.
.
.
.
.
.
.
.
.
.
.
.
.
.
.
.
.
.
.
.
.
.
.
.
.
.
.
.
.
.
.
.
.
.
.
.
.
.
.
.
.
.
.
.
.
.
.
.
.
.
.
.
.
.
.
.
.
.
.
.
.
.
.
.
.
.
.
.
.
.
.
.
.
.
.
.
.
.
.
.
.
.
.
.
.
.
.
.
.
.
.
.
.
.
.
.
.
96
96
96
97
97
98
98
99
99
99
99
100
100
100
101
101
101
102
102
102
103
Chapter 1
Hardware Support in Netmon SE
Hardware Support
Netmon is implemented on the Debian Linux operating system. In theory, Netmon will run on any device
which meets the minimum hardware requirements for Netmon and runs Debian 5.0 for the “x86” processor
architecture. In practice, it is possible that device driver issues may cause problems in the normal operation
of Netmon. For this reason, we cannot guarantee that Netmon will be fully functional on any hardware not
tested by Netmon, Inc. directly or in production use by one of our customers.
Generally, the riskiest areas in terms of hardware support are networking and video. A buggy network
driver can be very problematic. A video card which works well with Debian is important since Netmon uses
the graphical desktop for some configuration utilities, such as configuring the network card.
As time goes on, the list of hardware that has been tested and verified to work with Netmon will grow.
Beyond the list of Netmon-certified hardware, and depending on your appetite for risk, there are a number
of options in determining whether your equipment is likely to work with Netmon. Some hardware vendors
(such as Hewlett-Packard) explicity detail the level of support on their hardware for Debian Linux. A list
of these vendors is provided here. It is very likely that Netmon will work well on any device that explicitly
supports Debian 5.0 (“lenny”). Although products from vendors offering support for other Linux distributions
may work, be careful since each distribution of Linux varies in many particulars, including driver support.
Occasionally the Debian project excludes drivers from their distribution for technical, legal or political reasons
and this may limit the effective support for some hardware.
To help bridge this gap, Netmon provides a hardware test CD which performs the same automated Debian
install that is performed when installing Netmon. By using this CD to install Debian 5.0 you will be able
to determine with 100% accuracy whether your hardware will be supported by Netmon. Be aware that the
hardware test CD is a destructive test which will delete any pre-existing data on your device’s hard disk.
You can download the hardware test CD from the Netmon web site.
Tested Hardware
The following hardware is known to work with Netmon:
Hewlett-Packard
We have certified the following systems from Hewlett-Packard as working “out of the box” with Netmon:
4
CHAPTER 1. HARDWARE SUPPORT IN NETMON SE
5
• BL465c G1 Blade System (with p200 RAID array)
• DL380 G5 (with p400 RAID array)
IBM
• IBM x305
• IBM x306
Network Interface Cards
If you are building your own server or have compatibility problems between Debian and the Network Interface
Card (NIC) in your equipment, you may need to purchase a NIC at retail. Intel produces a number of network
cards with gigabit support (a gigabit NIC is recommended for Netmon).
The “Intel Pro Desktop 10/100/1000 Gigabit PCI” NIC has been tested successfully with Netmon. This
NIC was chosen because of its wide availability at retail.
Vendors with Debian support
Hewlett-Packard
Hewlett-Packard supports Debian Linux on the following models:
• BL20p G4
• BL25p G2
• BL460c
• BL465c
• BL480cL
• BL685c
• DL320 G5
• DL360 G5
• DL365 G1
• DL380 G5
• DL385 G2
• DL580 G4
• DL585 G2
For an up-to-date list and details on hardware support check the HP web site. You can also refer to HP’s
Linux Capabilities Matrix. Some equipment may require HP-specific drivers not part of the normal Debian
distribution which will require you to perform a “manual” Netmon SE installation.
CHAPTER 1. HARDWARE SUPPORT IN NETMON SE
6
Dell
Dell does not officially support Debian on its hardware, but it does provide some guidance for the installation
of Debian on it’s PowerEdge 9G servers. For details, refer to the Dell Debian support page. Keep in mind
that Netmon SE uses only drivers bundled with Debian 4.0. Though it may be possible to use third-party
drivers (provided by Dell or otherwise) to get Netmon SE running, this would be an unsupported installation.
Problem Hardware
Hardware on this list has been reported to cause problems with Netmon SE.
Network Devices
• D-Link DGE 500T. This device uses the National Semiconductor DP83820 chipset. This devices appears
to have driver issues that render it unusable under the version of Debian Linux used in Netmon SE.
• Broadcom 5700. This device is not supported by Debian Linux.
Community Support
There are a number of resources maintained by the community around Debian and the wider Linux community, that may help clarify the driver support situation for your particular hardware. Netmon, Inc. has no
connection with these sources of information and can not guarantee their accuracy or applicability to Netmon
SE. They are listed here as a convenience.
• Debian GNU/Linux device driver check page.
This page allows you to paste the output of the Linux shell command “lspci -n” into a text area and get
a report showing the driver support provided by the Linux kernel. Keep in mind that the kernel version used
in Netmon SE (currently 2.6.18) may vary from the kernel version used by this page, which may result in
inconsistent information.
• Linux Documentation Project Hardware HOWTOs
This page provides a set of task-oriented guides (“HOWTO” documents in the Linux world) for configuring
hardware on Linux.
• Linux Compatible Hardware Database
This page provides a searchable database of hardware components with details on their compatibility
with Linux.
• Netmon Community Forums
The Netmon community forums are a place where you can interact with Netmon, Inc. staff and other
Netmon users. You may find useful information about hardware in the forums. If you don’t, feel free to ask
questions about your particular scenario.
CHAPTER 1. HARDWARE SUPPORT IN NETMON SE
7
Customer-Reported Hardware
Customers have reported successful installations of Netmon SE on the following hardware devices:
• Sun Fire X4200
System Requirements
For best performance, your Netmon server should have the following minimum performance specifications:
Hardware Requirements
• Pentium 4 processor or equivalent
• 1024 MB RAM
• 40 GB Hard Disk (SATA recommended)
• 10/100 NIC (Gigabit NIC recommended)
• 56k Modem (for paging support)
Some features require SNMP-capable equipment. Also, be aware that Netmon SE will not automatically
install on hard disks significantly smaller than the minimum requirement, although a manual install may be
possible. Keep in mind that with less than 40 GB of storage, your Netmon device will be extremely limited
in terms of its ability to keep historical data for any length of time.
Client System Requirements
Netmon uses a web-based client so requirements are fairly modest.
• Any operating system which provides a supported web browser
• Supported Browsers: Firefox 1.x or higher, Internet Explorer 6.x or higher, Opera 8.x or higher
• Flash 7.0 or higher
• Recommended 1024 MB of RAM
Chapter 2
Installation and Deployment Guide
Beginning the installation
To begin installing Netmon SE, insert the CD that came in your retail package (or that you burned from the
ISO image you downloaded) into the computer you will use to run Netmon and start the computer. Before
doing so, you should ensure that your computer’s BIOS settings are configured to boot from the CD drive.
A boot screen will appear almost immediately. At this screen you will be warned that the installation
process is destructive and will erase any existing data on your computer’s hard drive. Consider the warning,
then type “install” at the prompt and press ’Enter’ to begin the installation process.
Debian-installer
The software which performs the automated operating system installation is known as “Debian-installer”. It
uses a text-based user interface. In this interface, the Tab or Right-Arrow keys move “forward” and the
Shift-Tab or Left-Arrow keys move “backward” between displayed buttons and selections. The Up-Arrow
and Down-Arrow keys select different items in a scrolling list.
The automated Debian Linux installer will perform various hardware auto-detection routines, and download some basic software packages that are required for installation. No intervention is required until you
reach the “Partition Disks” prompt.
NOTE: the following virtual console access should only be used by advanced users or under the direction
of Netmon Support.
In the Debian-installer, there is a separate virtual console which error messages and logs are directed to.
You can see the output of this console by pressing Left Alt-F4. To return to the main installer process,
press Left Alt-F1.
You can also access a separate virtual console to issue operating system commands by pressing Left
Alt-F2. To return to the main installer process, press Left Alt-F1.
For more information on the Debian-installer itself, review the Debian GNU/Linux Installation Guide,
Chapter 6.1 How the Installer Works.
If the automated Debian Linux installer does not suit your needs, you can perform an unsupported manual
installation by typing “manual” at the boot prompt. Similar to installing Netmon SE on your own Linux
installation, you will not be supported for any issues relating to the operating system if you choose to perform
8
CHAPTER 2. INSTALLATION AND DEPLOYMENT GUIDE
9
a manual install. For some classes of hardware or unique situations (for example, if you would like to use
LVM to manage disk partitions) a manual installation may be your only option.
Network configuration with DHCP
The Netmon installer will attempt to configure your network interface card with DHCP, for the purpose of
downloading required software packages. Once Netmon is fully installed, you may manually configure the
network using the graphical desktop environment.
If you do not have DHCP in your environment, or if your DHCP server takes too long to respond, the
automated Debian Linux installer will display an error message, and you will have the option to retry network
autoconfiguration, or to enter network settings manually.
Partitioning disks
The Netmon installer will attempt to automatically partition your disk with the following partitions:
• A small “swap” partition (1.5 times the size of RAM)
• A 5 GB “root” partition
• A partition consuming the remainder of the available free space, mounted as “/var”, with the noatime
mount option enabled.
In the event that the guided partitioning does not work, you will have to manually partition your disks.
For best performance, use the XFS file system and the partitioning scheme described above. It is possible to
use other file systems such as ReiserFS or Ext3 with Netmon SE, however there can be a significant loss of
performance if a different file system is used.
For details on using the Debian utility for disk partitioning, refer to the Debian Installation Guide for
Debian 4.0, Section 6.3.2 Partitioning and Mount Point Selection.
Package Installation
Once you have partitioned disks, software installation will commence. Software packages come from multiple
sources and hence, there are varying ways that package installation is represented on-screen. Some packages
are installed from within the Debian installer and are represented with colourful progress bars. Other packages
(namely security updates) are installed by the Netmon installation script and are represented with text-based
progress indicators.
During the second phase of package installation, the Linux console’s built-in screen saver may become
active and blank the console. Pressing any key on the keyboard will de-activate the screen saver and restore
the console view.
Completing the installation
Once all operating system packages are installed, you will be prompted to take out the installation CD and
reboot your system. After the reboot, the Netmon software is downloaded and installed for you. Once this
CHAPTER 2. INSTALLATION AND DEPLOYMENT GUIDE
10
installation is complete, the system will reboot once again and you will be presented with the GNOME
graphical desktop login. At the login prompt, enter the username “netmon” and the password “netmon” to
gain access to the desktop.
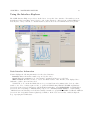
Configuring the network card
On the Netmon GNOME desktop you will find a number of icons, including one labeled “Network Admin”.
To configure your network card with a static IP address, double-click this icon. You will immediately be
prompted to enter the root password, which is “netmon”.
Once in the network administration tool itself, on the tab labeled “Connections”, select the network
interface you would like to use with Netmon and click the “Properties” button. You can now choose between
DHCP and static settings, and fill in the appropriate settings for your network. You can also use Network
Admin to configure your DNS settings. Click the “OK” button in the “interface properties” window, then
click “OK” in the “Network settings” window.
Activating Netmon
Once initial setup tasks are complete, you will be prompted for your product activation key as well as your
contact information.
Once you have activated Netmon, the Deployment Wizard will start.
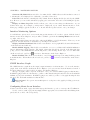
Netmon Deployment Wizard
On the Netmon desktop, you will find an icon labeled “Web Browser”. Double-click this icon to launch the
Debian fork of the Firefox web browser, which will open the Netmon web interface by default. The first time
you connect to the Netmon web interface you will be presented with the Netmon Deployment Wizard. This
is a set of four forms which will take care of the initial Netmon setup tasks for you.
Administrator Account
The first form in the deployment wizard is the Administrator Account. On this form, enter your contact
information and a desired username and password. This will be the first administrative account for Netmon.
Once you have completed filling out the form, click ’Next Step’ to proceed to the next form.
Network Ranges
After the administrator account has been created the Configure Network Ranges form will appear. In this
form you can add any significant network ranges for your environment. In the “Label” field, enter a meaningful
value for your environemnt (like “Wired LAN”). In the field labelled “Starting IP Address”, enter the first
usable IP address in this range. In the field labelled “Ending IP Address”, enter the last usable IP address
in this range (be sure to avoid including the subnet broadcast address).
If you would like to auto-discover SNMP devices in this range, check the “SNMP Discovery” checkbox.
If you would like this network range included in the port scan report, check the “Port Scanning” checkbox.
Once you’ve completed the values for a network range, click the button labelled “Add Range”. Do not
click “Next Step” without first adding the network range to the list, or you will lose your work.
CHAPTER 2. INSTALLATION AND DEPLOYMENT GUIDE
11
Configure SNMP Auto-Discovery Settings
Once you have defined network ranges, the Configure SNMP Auto-Discovery form will appear. This form
allows you to identify your SNMP settings.
In the “Community String” field, enter a comma-separated list of community strings that are in use in
your network. In the “Scanning port” field, enter the port used for SNMP by your network devices.
In the “SNMP Version” dropdown, select the version of SNMP which you would like to use on your
network.
Once you have selected the appropriate values, click “Next Step” to proceed to the final form.
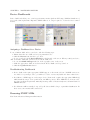
Network Diagnostics
The “Network Diagnostics” form will process then present you with a couple of important diagnostic messages.
A sample of network traffic will be taken to determine whether port mirroring is configured on your network,
and the wizard will ensure that the Netmon Update Service is reachable from your Netmon device.
Review all status messages and close the wizard with the “Close Wizard” button when finished.
Your installation is now complete. You are ready to move onto the next section,
Chapter 3
Getting Started
Once your server has been physically installed and basic setup has been completed, you are ready to log into
the Netmon application.
Logging Into the Netmon Application
To log in, simply type Netmon’s IP address into a web browser which can access that IP address, like this:
http://netmon_ip_address/
This will display the Netmon login screen, as follows:
12
CHAPTER 3. GETTING STARTED
13
Username and Password for Initial Login
If you are logging in for the first time, use the User ID admin with a password of netmon.
Once you log in, it is recommended that you complete the Initial Setup Tasks located in the Settings
console.
Performing Basic Setup Tasks
There are 4 quick steps which should be taken immediately after logging in for the first time. These steps
allow Netmon to begin discovering devices and services automatically, and also ensures that alert messages
can be properly relayed.
To start the Setup Wizard, click the Settings button in Netmon’s main menu at the top of the screen,
and look for the Initial Setup Tasks link. Click on it, and then click each of the 4 items in turn:
1. Define your Network Range(s) (see Managing Network Ranges)
2. Configure SNMP Automatic Discovery (see Using the SNMP Automatic Discovery Service)
3. Set up Netmon User Accounts (see Managing User Accounts)
4. Alert Testing Utility (see Troubleshooting Email Alerts)
CHAPTER 3. GETTING STARTED
14
Setting Up Traffic Sniffing
In order for Netmon’s packet analyzers to work properly, it must receive a copy of the packets going across
your network. This is accomplished using port monitoring (also known as port mirroring or port spanning)
on your switch. Most enterprise switches support this feature. The steps to enable port monitoring vary
from manufacturer to manufacturer, so consult the product documentation for your switch to determine
the necessary steps. For Cisco devices, the manufacturer has provided an excellent resource to get you up
to speed on the SPAN capabilities of Cisco devices and the configuration steps that are required, in this
document.
If you are using a hub, no configuration is necessary: hubs send all traffic to each port automatically.
Once you have traffic forwarding working on your switch, you must plug your Netmon device into the
forwarding port on your switch.
The recommended configuration is to have NIC #1 (which the operating system calls eth0) configured as
the Management Interface and NIC #2 (which the operating system calls eth1) as the Sniffing Interface.
This means that the Management Interface will be connected to a normal port on your switch for normal
network access, and the Sniffing Interface will be plugged into the mirrored port on your switch so it can
sniff network traffic. To accomplish this, configure your interfaces as described below.
Open the Network Admin icon on the desktop. On eth0, set the IP Address, Netmask and Gateway. On
eth1, set the IP Address and Netmask, but leave the gateway blank. Save your changes and reboot the
Netmon Server.
Open the Netmon application in your web browser, and go to Settings > Netmon Services. Set
the IP, HTTP, and eth plugins to ’automatic’. You can verify that Netmon is properly sniffing traffic by
clicking on Networks and noticing that traffic is being displayed in the Visual Network Explorer.
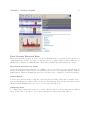
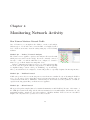
Introducing the Netmon Home Dashboard
The first screen you will see after logging into the system is the Netmon Home Dashboard. This screen is
designed to provide you with a high-level, up-to-the-moment overview of your network.
CHAPTER 3. GETTING STARTED
15
Panel: Recently Discovered Hosts
The Netmon network autodiscovery service detects new MAC/IP pairs on your network, and can alert you
of this situation if you wish. You can locate this panel at the top right of Netmon’s Home dashboard. It
displays any recently detected MAC/IP pairs. These entries remain in the panel until they are cleared.
How Network Auto-Discovery Works
Netmon uses the Address Resolution Protocol (ARP) to probe for new hosts on your local segment(s). It
issues periodic ARP broadcast requests, and checks the responses it receives against its database of known
MAC addresses. When a new MAC address is detected, Netmon can be configured to send an alert message.
Clearing Entries
You can remove entries from the recently discovered hosts panel by checking off the entries you wish to delete,
then click the Clear Selected button. There are also two additional buttons provided for convenience: Check
All and Uncheck All which allow you to select or deselect the entire list at once.
Configuring Alerts
To configure alert recipients for newly detected hosts, click the button on the Recently Discovered Hosts
panel. You’ll be able to specify one or more alert recipients in the dialog window that follows.
16
CHAPTER 3. GETTING STARTED
Panel: Top Activity Snapshot
This panel gives you a high-level overview of the 10 most active client-server conversations over the last 60
seconds, and also shows the TDP/UDP port of each conversation. If Netmon recognizes the port being used,
you’ll see a friendly name instead of the actual TCP/UDP port.
To get more information for the protocol(s) which are typically used on a particular port, just click the
friendly name (i.e. HTTP or FTP) and you’ll be taken to a page in the Help & Resources Panel which will
tell you what Netmon knows about this port. Netmon ships with a built-in dictionary for over 50 protocols.
Each entry in this dictionary contains a high-level overview of the protocol, as well as links to helpful web
resources for that protocol.
To get more detail for any host which is shown in this panel, simply click on it. This will take you to a
page where that particular host can be explored much more thoroughly.
Panel Actions
Print
an
instant
Quick
Report
by
clicking
this
button
in
the
panel.
Refresh the display with new data by clicking this button.
Panel: Top Web Destinations
This panel shows the top web destinations (based on HTTP requests), averaged over the last 20 seconds.
To get more detail for any destination which is shown in this panel, simply click on it. This will take you
to the Visual Network Explorer page where that particular host can be explored in more detail.
What is a ’Web Destination’ ?
A web destination is simply the recipient (i.e. the server) of HTTP requests. This could be any or all of the
following:
• Public websites like www.google.com or www.amazon.com
• Local intranets and web based applications
• Non-Web HTTP traffic (i.e. SOAP or XML-RPC calls)
Panel Actions
Print
an
instant
Quick
Report
by
clicking
Refresh the display with new data by clicking this button.
this
button
in
the
panel.
17
CHAPTER 3. GETTING STARTED
Panel: Top Web Users
This panel displays the top local hosts which are requesting HTTP web traffic. Traffic rates (averaged over
the last 20 seconds) are also provided for reference.
To get more detail for any host which is shown in this panel, simply click on it. This will take you to the
Visual Network Explorer page, where that particular host can be explored in more detail.
Panel Actions
Print
an
instant
Quick
Report
by
clicking
this
button
in
the
panel.
Refresh the display with new data by clicking this button.
Panel: Top Ethernet Protocols
This panel shows you the most active Layer 2 protocol usage, averaged over the last 20 seconds, and ordered
by the Ethernet frame type.
This panel is extremely useful to get an idea of your overall network traffic load. It aggregates all traffic
information for each major Ethernet protocol type, and displays information for each. Using this panel,
you can also monitor the usage of non-TCP/IP protocols like IPX/SPX, ARP, as well as network bridging
protocols like 802.1d. (Note that 802.1d is a much different protocol from the 802.11 wireless protocol suite).
On most TCP/IP networks, IPv4 (both TCP and UDP) should appear at the top of the list under
normal network conditions. Address Resolution Protocol (ARP) is a MAC-to-MAC addressing protocol, is
also generally present as well, though at a much lower level. (ARP poisoning attacks could be monitored
through this panel.)
Panel Actions
Print
an
instant
Quick
Report
by
clicking
this
button
in
the
panel.
Refresh the display with new data by clicking this button.
Using the Help & Resources Panel
The Help & Resources panel is a completely integrated, one-stop guide to your Netmon server appliance.
This panel is built right into the Netmon application, and provides direct access to a rich variety of resources.
Using this panel, you can:
•
Access the Netmon User Guide
•
Stay up-to-date on recent network security news with the Security & Monitoring News Center
CHAPTER 3. GETTING STARTED
•
18
Request technical support, through either the Live Chat system or by sending a message through
the built in Support Request Form.
• Learn more about specific parts of the Netmon application with context-sensitive buttons located
throughout the Netmon user interface.
Other Panel Actions
•
As you move between different pages in the Help & Resources panel, these buttons can
help you navigate.
•
All of the pages which are displayed in the Help & Resources panel are automatically printerfriendly. Just click this button for a perfect printed document.
Chapter 4
Monitoring Network Activity
How Netmon Monitors Network Traffic
One of Netmon’s core strengths is the ability to monitor and analyze
different types of local and remote network traffic, at a highly detailed
level. Netmon can monitor network activity using any of the following
facilities:
Method #1 — Packet / Protocol Analyzer
The Netmon server appliance captures and analyzes all network traffic
which passes across its network card(s). It is most commonly connected
directly to a hub or a switch, which has been configured to forward a
mirrored copy of all the frames traversing that device.
In these configurations, Netmon receives a copy of the packets traveling
across the network segment which is being monitored. This is typically
accomplished using a feature called port SPANning or port mirroring,
where your switch has been configured to forward all packets to a specially designated monitoring interface.
Method #2 — NetFlow Protocol
NetFlow is a perfect choice for monitoring remote networks from a centralized location. By using the NetFlow
protocol, your remote devices (typically routers) perform packet inspection of all traffic going into and out
of various network interfaces. Summaries of this activity are then forwarded as flow packets to a NetFlowcapable monitoring system like your Netmon server appliance.
Method #3 — sFlow Protocol
sFlow provides packet samples (instead of statistical summaries as with NetFlow). Because of the nature of
the VNE (short-term monitoring) and the inherent statistical error in small samples, this interface is only
marginally useful in comparison to the packet analyzer or NetFlow facilities. However, in some cases sFlow
might be the only data source you have for a remote network.
19
CHAPTER 4. MONITORING NETWORK ACTIVITY
20
Using Netmon’s Built-In Protocol Analyzers
Netmon features several built-in protocol analyzers which are designed to gather information which passes
across either of Netmon’s two gigabit network interfaces.
Netmon’s native protocol analyzers are generally used on networks to which the Netmon device is physically connected. See How Netmon Monitors Traffic above for more information.
Monitoring E-mail Traffic
Netmon has the capability to monitor and record email activity across the sniffed network. To enable or
disable this capability, take the following actions:
1. Configure your environment and Netmon for traffic sniffing as detailed in the Getting Started guide. 2.
Enable (or disable) the E-mail traffic plugins. In Settings > Netmon Services, look for the three plugins:
• IMAP Plugin to monitor IMAP traffic.
• POP3 Plugin to monitor POP3 traffic.
• SMTP Plugin to monitor SMTP traffic.
Collecting NetFlow Data Streams from Remote Devices
You can use Netmon to monitor and record live network activity on remote networks using Cisco’s NetFlow
protocol suite. Netmon can accept and process NetFlow v1, v5 and v7 datagrams.
Important In order to properly process incoming NetFlow packets, you must also enable SNMPv2 GET
on the device which sends NetFlow packets to Netmon. This allows your Netmon system to properly identify
all of the network interfaces on the device.
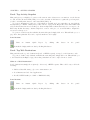
Activating NetFlow
There are three steps required to monitor NetFlow data from remote devices:
1. Configure your remote device(s) to send NetFlow packets to your Netmon server appliance. Once
Netmon detects incoming NetFlow data for a particular device, it will automatically add that device to your
Devices Explorer tree.
2. Enable NetFlow data collection for the newly-added device by clicking the Enable NetFlow checkbox
when you click on it in the Device Explorer. Once this step has been completed, you’ll see a purple NetFlow
icon (
) next to the device in the Devices Explorer.
3. Enable NetFlow for the desired interface(s) which are sending NetFlow packets to Netmon by opening
each interface and choosing the Enable NetFlow option.
Sending NetFlow Data Streams to Remote Devices
Netmon can provide summarized traffic data in NetFlow format to remote devices. This functionality is
designed for Netmon to Netmon communications but may also work for other consumers of NetFlow data.
To configure the Netmon NetFlow emitter, click on the “Settings” button on the Netmon menu bar. In
the Settings explorer, click on “Netmon Services”. Scroll down the list of services to find the “netflow emitter
plugin”. Click the “configure” link that is to the right of the plugin name.
CHAPTER 4. MONITORING NETWORK ACTIVITY
21
You can now specify the IP and UDP port of the target machine(s), the log level for the plugin, and the
aggregation period (in seconds) for the emitter. Note that the IP and port should be specified in the format
xxx.xxx.xxx.xxx:yyyy. If multiple targets are required, they should be specified separated by a comma. Click
the “update” button next to any values you change in the configuration settings.
Once this is complete, click again on “Network Services”, scroll down to find the netflow emitter section
and use the drop down boxes to start the plugin automatically whenever the Netmon device boots, or press
the “Start Plugin” button to start the plugin manually.
Netmon emits data in NetFlow v5 format. In addition to the UDP port specified, the target machine
must also be able to access the NetFlow emitter device using SNMP, and the device must be configured as
an SNMP device in the target Netmon device. Please review the Netmon documentation for [Monitoring
Network Activity] for full details.
Using the Visual Network Explorer
The Visual Network Explorer (VNE) component provides a dynamic, graphical view of your current network
activity on local or remote segment(s). You can customize this view in many different ways to find information
of interest.
VNE Basics
The VNE displays a live interactive graphical map of your current network activity. As your network traffic
patterns change, the display is updated automatically every 20 seconds.
You can move individual hosts around on the map by clicking and dragging on them. You can also move
the entire map itself: simply click and drag any empty space in the map. (This is particularly handy when
you’ve zoomed in to view a single part of the map).
You can also use the Zoom tool to your advantage: if a particular host appears too small, or if you simply
wish to zoom in for more focus, you can click and drag the Zoom slider. Zoom ranges from 50% to 250%
are provided. Don’t forget — you can click and drag anything (individual hosts or even the map itself) to
navigate the display more easily.
To select a host and view additional details about it, simply double-click on it. Double-clicking will
display the Active Connections Panel for that particular IP address, which displays all of the current network
connections coming from, or arriving to, that device.
Customizing Your View
The Visual Network Explorer can also be manipulated in a number of ways to help you refine your perspective,
and narrow your focus on specific host(s) and/or activities.
Traffic View Traffic view provides two distinct ways to view the network traffic itself — which is
represented by a series of dotted or solid lines in between individual hosts. Each of these methods provides
advantages in specific situations:
Absolute View displays all network traffic on an absolute scale. Each packet stream is displayed
according to the maximum speed your infrastructure can support — usually 100 Mbps or 1 Gbps. For a
reference on what each style of line represents, see the Activity Legend. Using Absolute View is usually the
best way to monitor traffic if you’re trying to understand your overall network load.
Relative View displays traffic according to the most active packet stream on the network. In this
scenario, the most active conversation on your network is displayed with a thick, bright red line (see the
Activity Legend) and all of the other conversations are scaled in a linear fashion according to this host.
CHAPTER 4. MONITORING NETWORK ACTIVITY
22
Relative View is the best option to use when you want to compare your network traffic to other network
traffic. It allows you to see how traffic from individual hosts compares against the traffic betweenother active
hosts.
Conversations Using this feature, you can customize your view to show the Top 16, Top 32, Top 48
or Top 64 conversations. Viewing fewer conversations at once can simplify the view, while viewing many
conversations at once can give you a broader perspective.
View Hosts By You can choose to view individual hosts by their IP address or by their host name.
If you choose to view by Host Name, Netmon displays the host using its friendly name, if one is available.
If a friendly name is not available, Netmon selects the first entry in its name database (giving preference to
NetBIOS names, followed by DNS names).
Apply Traffic Filter Using this selection, you can apply any one of Netmon’s traffic filters to the VNE
display. Click here for more information on traffic filters.
Apply Host Filter Using this selection, you can apply any one of Netmon’s host filters to the VNE
display. Click here for more information on host filters.
Zoom This tool lets you change the zoom level from 50% to 250%. Simply click on any zoom level, or
you can drag the Zoom handle to adjust your zoom visually.
Host Legend
•
Internal (Non-Routable) IPs — These hosts are displayed in green. (i.e. subnets
192.168.x.x, 10.x.x.x, 172.x.x.x, etc.)
•
External (Routable) IPs — These hosts are displayed in orange. (i.e. any IP
address not included in above non-routable ranges )
•
Broadcast IPs — Broadcast hosts do not actually physically exist, and are
displayed with a purple label, as well as a special icon.
•
Highlighted — Any host which has been highlighted with the mouse hovering over it
turns blue. (Hint: Click and drag!)
CHAPTER 4. MONITORING NETWORK ACTIVITY
23
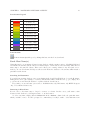
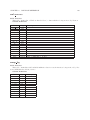
Activity Legend
Line Style
Absolute View
Relative View
32 Mbps and above
Most Active Host
16 Mpbs and above
8 Mbps and above
4 Mpbs and above
2 Mpbs and above
1 Mpbs and above
512 Kbps and above
256 Kbps and above
128 Kbps and above
64 Kbps and above
32 Kbps and above
16 Kbps and above
8 Kbps and above
4 Kbps and above
2 Kbps and above
Under 2 Kbps
Least Active Host
Other Panel Actions
Print an instant Quick Report of the current VNE display by clicking this button.
Realign Map: If you’ve moved the map too far, and have lost your view of the hosts and/or activity,
this button will realign the display for you.
CHAPTER 4. MONITORING NETWORK ACTIVITY
24
Using the Network Topology Mapper
The Network Topology Mapper (NTM or “mapper”) provides a persistent view of the structural topology
of your network. The devices on your network are automatically discovered by the mapper, which then
identifies as many attributes about the device as possible through a variety of means. For example, if you
are monitoring a device with SNMP, the mapper component uses that information to select an icon for the
device.
In addition to discovering device attributes, the mapper component also tries to discover the relationship
between devices on the network. When the mapper discovers a switch on your network, it will attempt to
identify all the connected devices and “attach” them to the switch on the map.
Mapper basics
The mapper is unique among Netmon components in that it opens in its own window (or tab in some
browsers). This is due to the space requirements of the map itself. If your browser blocks pop-ups, you may
have to allow pop-ups from your Netmon device’s URL before you can see the map.
The mapper displays an interactive map of your network topology. The display is static once loaded,
so newly-discovered devices can only be added by reloading the map component or clicking the “Refresh”
button in the upper-left hand corner of the map.
Working with the map
The map has a maximum resolution of 3200 x 3200 pixels. Netmon will try to lay out your devices for
maximum visibility in the smallest space, but you will most likely want to adjust the default layout. To move
a device, click and hold the mouse button down while the pointer is over the device icon. With the mouse
button held down, move the device to the desired location and release the mouse. The new location will be
stored in the Netmon database and restored the next time you reload the map.
Map Icons
The icon for each device is determined by the mapper based on information supplied by device dashboard
settings. If you would like a particular device to have a particular icon, you can influence that by configuring
the device for SNMP and selecting an appropriate dashboard.
If any trackers have been defined for a device it will be presented with an “aura”, either red or green,
depending on the state of the trackers. If you mouse over the aura, a brief description of the tracker and its
current status will be displayed in a tooltip.
At the top, bottom, and sides of the device icon there are four blue “handles”. These handles are used
to connect devices to one another. Click on a handle and hold down the mouse button, then drag to a
corresponding handle on another device. The mapper will create a persistent connection between the two
devices.
Ungrouped Devices
Once the mapper has exhausted all possible ways to identify connections between devices, it will place any
devices not yet connected into an area to the right of the autodiscovered map inside a box labeled “Ungrouped
devices”. Connect these devices to the appropriate infrastructure devices as described above, and drag them
out of the box as desired.
CHAPTER 4. MONITORING NETWORK ACTIVITY
25
Panel: Active Connections
This panel shows you all active connections during the last 60 seconds for the selected IP address. To use this
panel, you simply enter the IP address of the host you wish to explore, and then press ENTER. Alternatively,
you can double-click on any host in the Visual Network Explorer window to see all Active Connections for it.
If Netmon’s network sniffer detects any active connections for the selected IP address, they will be
displayed in the Active Connections Panel window. Each data stream is separated into its own row.
Traffic Stream Direction
The direction of the traffic stream is displayed with an icon, as follows:
This data is request traffic. Data from the selected host is being ’uploaded’ to the remote host which appears
in
this
row.
This data is response traffic. Data from the remote host which appears in this row is being ’downloaded’ to the selected host.
Host
The name or IP address of the destination host. The selected IP address has established a connection to
this host. If the host name can be resolved, Netmon displays the name of the host here. If the IP address
resolves to multiple names, Netmon displays the first hostname in its database , along with a icon, which can
be clicked to expand the list.
Port
Netmon identifies the TCP or UDP port of the data stream and shows it in this column. If Netmon recognizes
the port, it will apply a friendly label from its database (see Port Label Database). In addition, Netmon
contains a built-in protocol dictionary which provides detailed information for a wide variety of protocols.
To learn more about these ports and protocols, you can click the label for additional information, which
is displayed in the Help & Resources Panel.
Speed
The average speed, over the last 60 seconds, of the data stream.
Other Tips
Alternatively, you can use Active Connections Panel automatically (i.e. without having to manually enter
the IP address) through the Visual Network Explorer (VNE). To do this, simply locate the host you wish
to explore in the VNE, and double-click on it. This causes the [View Active Connections] IP address of the
host that was clicked to appear in the VNE toolbar. Then, simply click the View Active Connections button
(see illustration at left) to automatically open the Active Connections panel for the selected host.
CHAPTER 4. MONITORING NETWORK ACTIVITY
26
Panel Actions
Print an instant Quick Report by clicking this button in the panel.
Panel: Port Scan
Using Netmon’s Port Scanning Tool
With this tool, you can scan any IP address to see which TCP ports are open and accepting requests.
To scan a host, simply enter its IP address in the IP Address field of the Port Scan panel. Then, click
the Scan button to begin the scanning process. (If the Port Scan Panel is not visible, click on its title bar to
expand it.)
Caution: Be careful when scanning hosts that don’t belong to you. Probing a remote network with a port
scanning tool is often considered a form of intrusion attempt. Types of Port Scan
You can run up to 3 different types of scan with this tool:
Standard Scan This mode scans several hundred well-known ports. This type of scan is probably the
best choice for everyday audits, where an administrator’s biggest concern is typically focused toward the
exposure of common services like FTP, HTTP, or file and printer sharing. To run a standard scan, simply
select this option in the Port Scan Panel, and click the Scan button to begin. Standard scans against nonfirewalled hosts should be complete in under 10 seconds, while a scan against a firewalled host may take a
minute or more.
Complete Scan This mode scans all 65,535 possible ports. It takes longer to run a complete scan
(especially against a firewalled host) so generally it is best used when you suspect that a particular host may
have been compromised by intruders, viruses and/or other types of malware, or if you have concerns that
non-standard services may be exposed. To run a complete scan, simply select this option in the Port Scan
Panel, and click the Scan button to begin. (You’ll receive a warning
Custom Scan This mode scans a host for a user-specified port or port range. This type of scan is most
useful when you are looking for something very specific. To scan a single port, select the Range option, which
enables text to be entered in the Range text box. Enter the port number in this box, and then click the Scan
button. To scan a range, simply enter a starting port, a dash, and an ending port (i.e. 1000-2000). Scanning
Firewalled Hosts
Scanning a firewalled host can be a good way to ensure that the firewall is exposing only absolutely
necessary services. Keep in mind, however, that scanning a firewalled host tends to take much longer than
an equivalent scan against a non-firewalled host. This is due to the fact that firewalls do not acknowledge
connections on any port which is not permitted to pass through. Thus, the port scanner must wait until a
specified timeout period has been reached, before it can determine that a port is truly closed.
Scanning a fully firewalled host (i.e. a host in which no ports are open, or a host which has been configured
to ignore ICMP PING requests) can result in a ’Host is unresponsive or behind a firewall’ message. In
practice, a fully firewalled host should not appear to exist at all, so port scans against them are generally
pointless. Microsoft Windows XP SP2 machines have a particularly draconian firewall, and when they have
been configured for maximum security, they generally ignore inbound network requests entirely.
CHAPTER 4. MONITORING NETWORK ACTIVITY
27
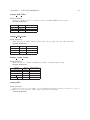
Port Scanner Legend
Symbol / Icon
Port Range
Ports 0 to 25
Ports 26 to 50
Ports 51 to 75
Ports 76 to 100
Ports 101 to 150
Ports 151 to 250
Ports 251 to 500
Ports 501 to 1000
Ports 1001 to 5000
Ports 5001 to 65535
Panel Actions
Print an instant Quick Report by clicking this button in the Port Scan Panel.
Panel: Host Name(s)
Using this panel, you can manage Netmon’s name database, which contains a variety of NetBIOS, DNS and
User-Defined host names. Each of these host names maps to an IP address, and often many different host
names map to the same IP address. This console allows you to manage names for any host (and even to
include your own User-Defined labels) as well as search Netmon’s database for host names which match a
particular search criteria.
Searching for Hostnames
To search Netmon’s name database, enter a search string in the Search Text/IP Address: box on the Hostname
Management console. (For example, to search for all hostnames which contain the text “google”, simply enter
google into the Search Text/IP Address: box) Then click the Search button.
If you wish, you can customize your search, to NetBIOS names only, DNS names only, HTTP Requests
only, or User-Defined Names only.
Removing A Host Name
In some cases, a host name may no longer be accurate or relevant. In these cases, you’ll want to trim
Netmon’s name database by deleting inaccurate or outdated names.
To delete any name, simply click the Delete link in the Actions column beside the particular name
which you wish to remove. You’ll be prompted to confirm that you really do wish to delete this name from
CHAPTER 4. MONITORING NETWORK ACTIVITY
28
the database. If you’re certain, click the OK button to proceed, and Netmon will remove the name from its
database.
Adding a User Defined Host Name
You can apply your own friendly host name to any IP address. Click the Add New Host button in the Manage
Hostname Database panel. An editing window will open in the Settings Editor panel on the right side of the
screen.
Enter the IP address and label, then click the Add Hostname button. Your IP address will now appear
as your friendly label throughout the application.
Network Tools
The Tools panel contains a variety of useful network diagnostic tools.
Capturing Raw Network Traffic with the Packet Capture Tool
Netmon features a low-level packet capture utility which can ”record’ network activity — payload and all —
for further analysis in a protocol dissector such as Ethereal / Wireshark1 .
To use the raw packet capture tool, take the following steps:
1. Click Network > Tools > Traffic Capture.
2. Choose the number of packets to capture from the available drop-down box. In most cases, it’s best to
start with smaller captures (100 to 500 packets) and progress toward larger ones (1000 or more) as necessary.
3. Add a label, if desired, to this capture. Labels are used to differentiate between capture files in the
File Manager. This step is optional.
4. Choose the network interface from which to capture packet data. You can choose any physical interface
which has been detected on your system.
5. Click the Begin Capture button to start the capture. Depending on the size of the capture, it may
take some time to become available for download in the File Manager.
DNS Lookup Tool
The DNS lookup Tool provides a quick method to perform a DNS record lookup for a particular hostname
or IP address.
Traceroute Tool
The Traceroute Tool is a handy tool that evaluates the performance of each network hop between the Netmon
server appliance and a target host / IP address 2 .
1 Ethereal (now known as Wireshark) is a free, open-source progocol analysis package. It is the world’s mode popular tool
for this purpoe. Download a free copy of Wireshark at www.wireshark.org
2 Some ISPs / carriers filter the network traffic which is used to support traceroute activity. In these situations, attempts to
perform a traceroute will fail at the gateway to that carrier.
Chapter 5
Monitoring Network Services
A Netmon system can monitor the availability and network performance of virtually any TCP-IP connected
device or service which is capable of responding to network requests.
How Netmon Monitors Devices and Services
If you simply want to determine if a host is alive or not, Netmon will use an ICMP PING request to establish
the status of the target device. If a PING fails, Netmon triggers any alerts which have been attached to this
tracker.
On the other hand, if you are monitoring a specific service, such as port 80 on a web server, or port 25
on an email server, Netmon uses TCP CONNECT method to determine if a service successfully responds to
a basic 3-way handshake request. If the handshake fails, Netmon triggers the appropriate email and pager
alerts which have been defined for the service monitor.
Introducing the Trackers Console
The Trackers console is where most of Netmon’s availability tools are located. To open the Trackers console,
click the Trackers button in the top toolbar.
Creating a New PING or TCP Service Tracker
To monitor a new device or service, take the following steps:
1. Click the Trackers button in the top toolbar, and then click the TCP Service Trackers or Ping
Trackers button.
2. Click the Add New Tracker button at the top of the Trackers Explorer. This opens the Tracker
Manager panel.
3. Transport Protocol: In the Tracker Manager panel, choose the type of monitor: TCP or ICMP.
TCP is used to monitor network services, and ICMP is used to monitor devices.
4. IP Address: Enter the IP address of the host to be monitored.
5. Friendly Name: Enter a friendly name / label for the host to be monitored.
6. Port: If you have specified a TCP service to be monitored, enter the Port number here. A valid port
number is any number between 1 an 65,535.
29
CHAPTER 5. MONITORING NETWORK SERVICES
30
7. Interval: The monitoring interval, in seconds. Monitoring too frequently can generate unnecessary
traffic, so try to balance polling intervals with your response needs. A monitoring interval of 60 seconds often
a good choice for non-critical devices, and an interval of 20 seconds is optimal for mission-critical devices.
8. Timeout: The timeout is the amount of time Netmon will wait for an unresponsive service before
queuing an alert, in minutes.
9. Logging Threshold: Choose the type of historical data Netmon. By default, Netmon will only log
entries to the database when it detects that the device or service is DOWN. You can, however, choose various
levels of logging verbosity, from Disable Logging all the way to Log Everything 1 .
10. Once you have entered all of the required information, click the Add Tracker button to add the service
or device to Netmon’s monitoring database.
11. Netmon begins monitoring your new device or service within about 10 seconds after adding it.
Attaching Alerts to a PING or TCP Service Tracker
You can attach any number of email and pager alerts to a service or device tracker. To configure alerts for
a particular tracker, click the Alerts link in the appropriate row in the Trackers Explorer. This opens the
Alerts management panel on the right side of the screen.
When monitoring services, you have the option of being notified when the service goes down entirely, or
when network latency for that service crosses a certain threshold (such as 200ms). This feature can often
identify failing services before a complete stoppage has occurred.
To add an email alert, take the following steps:
1. Choose a user account from the drop-down list in the Email Alert column.
2. Choose a value for Max Latency. You can choose Service Down or a latency value from 100ms to
1500ms.
3. To attach a Conditional to this alert, select the appropriate Conditional from the available drop-down
list. If no Conditionals are configured, ’NONE’ is the only option. Complete the action by clicking the Add
Alert button. Click here for more information on Conditionals.
Removing an Existing Alert
To remove an alert which has already been set, click the Delete link next to the associated alert.
Modifying a PING or TCP Service Tracker
To modify the tracking parameters for a device or service which has already been set up, take the following
steps:
1. Locate the device or service you wish to modify in the Trackers Explorer.
2. Click the Edit link which appears in the same row as the selected service. This opens the Tracker
Manager window, and displays all of the configurable information for this particular service. Some items
cannot be changed, such as the IP address or the Protocol / Port information.
3. Once you have made your desired changes, click the Update Tracker button.
1 If you want to be able to subsequently create a Latency analysis report for a particular device or service, choose the “Log
Everything” option.
CHAPTER 5. MONITORING NETWORK SERVICES
31
Removing a PING or TCP Service Tracker
To remove an existing service monitor, take the following actions:
1. Locate the service you wish to remove in the Trackers Explorer.
2. Click the Del link which appears in the same row as the tracker you wish to remove.
3. A confirmation window appears, asking if you’re sure you want to remove this service from the database.
If you’re sure, click OK, otherwise click the Cancel button.
Chapter 6
Monitoring Devices
Netmon has a wealth of features for monitoring highly detailed performance metrics on network-connected
devices such as routers, firewalls, switches, servers, printers, UPS systems and more.
Introduction to Simple Network Management Protocol (SNMP)
Effective network monitoring encompasses a broad range of responsibilities. You need to understand your
network traffic from several vantage points, but it also becomes important to monitor the health, availability
and load of many different kinds of mission-critical devices.
The solution is the Simple Network Management Protocol (SNMP): a widely supported monitoring and
management protocol for network-aware devices. Managed devices, as SNMP-capable devices are otherwise
known, can include things like switches, routers, multi-function printers, fax stations, firewalls, thin clients,
wireless transmitters, and much more. Thousands of different devices support the SNMP protocol.
SNMP provides the ability to query and update a managed device remotely. Using this protocol, you can
retrieve a potentially rich set of information about a particular device: data such as inbound and outbound
traffic levels, current connections, CPU load, memory status, usage history, error messages, device status,
and countless other details. This is really nice stuff to know. Furthermore, SNMP ’write’ operations can
even allow devices to be configured and managed remotely.
Devices can also be configured to automatically ’push’ SNMP data to a remote monitoring or management
system. For example, you might configure a laser printer to send information about current toner level. These
UDP datagrams are known as SNMP traps, and they’re generally sent to a remote monitoring system where
they’re collected and handled appropriately. (Netmon 3.5 will feature an SNMP trap handling engine.) The
SNMP Protocol
The SNMP protocol itself is a relatively simple request-response protocol. It works at the application
layer, and typically utilizes UDP ports 161 and 162.
The choice of UDP may seem a bit unusual for a request-response protocol, but SNMP was designed from
the outset to move across the network as ’non-critical’ traffic. In high load situations, UDP packets that are
dropped from the network are not resent by the originating host. This reduces network congestion in critical
load situations. To ensure that SNMP traffic doesn’t unnecessarily burden a network, its designers skipped
the higher overhead of a full-blown TCP connection in favor of a more graceful failure scenario.
Every managed device keeps a hierarchical database of values, known as a Management Information Base
(MIB). These MIBs are sent as numerical indexes (known as object identifiers, or OIDs) in the SNMP packet
32
CHAPTER 6. MONITORING DEVICES
33
payload, and each one represents some type of configuration detail. Each MIB has an associated meaning,
such as the following:
MIB: Cisco Router OID: 1.3.6.1.4.1.9.1.1
The Good, the Bad and the Ugly
While it is certainly true that SNMP can provide you with a rich source of information for every managed
device on your network(s), it also comes with a few drawbacks.
First off, while SNMP is indeed a ‘simple’ protocol, its real world implementation is not very simple at
all. SNMP data is built around the idea that any kind of information can be stored and communicated by a
managed device. Of course, different devices will want to communicate different kinds of data. Switches will
tell you how much traffic is going in and out of each port, and so will firewalls, but printers might tell you
how many pages have been printed today, or how much ink is left in each of the cartridges.
The result is that every device implements SNMP data structures in their own unique way, and there
are only a handful of standard OID/MIB interfaces which are available across all types of devices. This
makes the task of using SNMP data in a comprehensive monitoring or management system a non-trivial
undertaking. SNMP management systems tend to be large, unwieldy and tremendously expensive systems,
and their complexity can make one question the benefits of using SNMP in the first place.
SNMP and Security
The introduction of any new protocol on the network merits some attention, and SNMP deserves more
scrutiny than most. Unfortunately, the most popular implementations of SNMP (known as SNMP v1 and
SNMP v2) are not particularly well known for their strong security. In fact, SNMP’s security record is so
dismal, it has picked up a new dual meaning: Security Not My Problem (SNMP).
SNMP services and protocols are not necessarily a direct security threat themselves: attacks on SNMP are
relatively uncommon. This is probably due to the fact that there are thousands of different implementations
out there — any kind of attack would likely have to be narrowly focused at a single device, or class of devices.
However, a much larger security threat exists with the information that SNMP makes available to a
potential intruder. SNMP data is transmitted in clear text, which could pose a problem if you’re sending
certain kinds of information over a non-private, unprotected network such as the Internet. In fact, unfettered
SNMP read access could allow an attacker to gather hundreds of configuration details about your network.
Many SNMP-capable devices are shipped and installed with weak (or well-known) SNMP community
strings. A community string is the closest thing to a password in SNMP v2 and earlier devices, so it’s
incredibly important to ensure that you change these strings to strong passwords that meet modern security
standards.
Fortunately, some of the most pressing security issues have been resolved with SNMP v3, the latest and
greatest implementation of this protocol. Encrypted traffic is now supported, along with much stronger
authentication mechanisms. However, there are still relatively few devices which support this new implementation of the protocol, despite its age — nearly 7 years at the time of writing.
In the meantime, you should review your managed devices, and evaluate their roles in your monitoring
strategy. Check for the following:
1. Does the SNMP service on this device need to be active at all? Do I really need to gather performance
data from this device? (In many cases the answer is Yes.)
2. Is the Community String set to a strong password phrase?
CHAPTER 6. MONITORING DEVICES
34
3. What kind of SNMP data is being polled from this device? Is it safe for this information to traverse
the LAN/WAN/Internet?
4. Have SNMP write operations been disabled?
SNMP’s Role in Network Monitoring
SNMP has a few warts, but can nevertheless occupy a very effective role in an overall network monitoring
strategy.
Despite the rich variety of information it makes accessible, SNMP really shouldn’t be used to monitor
the network itself. Many monitoring and management systems use the SNMP protocol exclusively to gather
information about the network, but if this is the only way you are monitoring, then you’re likely to be missing
out on the big picture.
Think about it. In most cases, you will probably value the integrity of your entire network over that of
any individual host. SNMP is great to gather data about devices, but in these situations you just can’t beat
a packet sniffer to get a real understanding of your network’s actual state. Nevertheless, SNMP plays an
important role in an overall network monitoring strategy.
Netmon is capable of retrieving traffic-related information from a wide variety of SNMP-capable devices,
and the nice part is that it can grab data for each distinct network interface. This is especially helpful for
switches, firewalls and routers, where you’ll want to monitor traffic levels across each physical port. To work
with this information, you’ll need to take two steps.
To gather SNMP traffic data from your device, first enable SNMP on your managed device, and configure
it to allow SNMP read (or “polling”) operations. This process varies greatly by manufacturer. Some devices
(like switches and routers) may need to be configured through a command line interface, while other devices
(such as printers and other multifunction products) may provide a nice slick web interface. Be sure to specify
a strong community string pass phrase wherever possible.
The second step is to add your SNMP device in Netmon’s SNMP Device Explorer. You’ll have to supply
your device’s community string to Netmon. Once you have added your device, the Netmon SNMP Service
will begin polling that device for information. For additional configuration information, see the Netmon User
Guide.
Once these steps are completed, you should start to see SNMP traffic data within a few minutes. Netmon’s
SNMP viewing tools allow you to easily spot trends and spikes for each distinct device interface, and you can
historical charts and graphs as well.
Using the SNMP Automatic Discovery Service
The simplest and easiest way to add new SNMP-capable devices to your Netmon server appliance is to let
Netmon do most of the work for you. In most cases, Netmon can identify a large number of SNMP-capable
devices automatically in just a few minutes.
The SNMP Auto Discovery service scans your local network range(s) for SNMPv2-capable devices, and
attempts to connect to them with the default community string public. If a successful connection is made,
Netmon automatically adds the device to your Device Explorer collection. Devices which have been discovered
in this fashion have a icon next to them in the Device Explorer tree.
35
CHAPTER 6. MONITORING DEVICES
Using a Different Community String?
Netmon’s automatic discovery service can be configured to use any community string you wish. To make
changes to the community string used by the SNMP Auto Discovery service, take the following steps:
1. Click Settings > Netmon Services.
2. Locate the SNMP Autodiscovery service in the list, and click the Configure link next to it.
3. Enter your custom community string in the community text box, and then click the Update button
next to it.
4. Click Settings > Netmon Services again.
5. Locate the SNMP Autodiscovery service in the list, then stop it using the Stop Service button. When
the page reloads, click the Start Service button. This will restart the SNMP Autodiscovery Service using
your new Community string 1 .
Using the Devices Explorer
Netmon displays all SNMP devices in a tree format in the Device Explorer.
You can reach the Devices console by clicking the Devices button in the
top toolbar.
Within the Device Explorer, you can create groups of devices for organizational purposes. These groups can be manipulated through drag-anddrop and via the buttons at the top of the Device Explorer interface.
To create a new group in the Device Explorer, click the “New Group”
button. A new group will appear in the device explorer with the “empty
group” icon, and the label of the group will filled in with the text “New
Group”. When first created, the name text will be highlighted and you
can type a new name for the group.
You can add devices or existing groups to the group by clicking on the
device’s icon and dragging it onto the group icon. Once a group has at
least one device or group inside it, the icon will change to a “folder” icon.
To modify a group click on its name in the Device Explorer. The center
pane of the Netmon interface will be replaced with a group management
interface, where you can edit the group name or delete the group. When
deleting a group you will be given the option to either delete all the devices
and groups existing inside the group, OR to delete only the group and
place the devices and groups in it at the top level of the Device Explorer
interface.
SNMP-capable devices are identified with the following icons:
Designates a host/device which has been automatically detected by Netmon as SNMP- or NetFlowcapable. It is then up to you to activate one (or both) of these services on the device, and assign the appropriate
Device Dashboard
.
Designates
1 It
a
host/device
that
supports
SNMP.
is not strictly necessary to restart the Autodiscovery Service after changing the Community string. However, doing so will
ensure that the service begins scanning using your new Community string right away. If the service is not restarted, Netmon
will complete its current scan using the old Community string.
36
CHAPTER 6. MONITORING DEVICES
Designates
Designates
a
a
host/device
host/device
that
that
supports
provides
NetFlow
packet
streams.
sFlow
packet
samples.
Designates a host/device that is not responding to SNMP queries.
To view a high-level overview of a device and all of its interfaces, simply click the device in the SNMP
Device Explorer, which displays a global view of the device, along with a summary view for each interface.
Input and output is displayed on an LED-style graph.
To drill further down and view detailed information for each individual interface, simply click the port
icon next to the device, and select an interface node from the tree by clicking on it. This will bring up the
SNMP Interface Explorer window, which provides a detailed view of that specific interface.
Adding a New SNMP Device
First, you must enable SNMP v2 GET requests (or polls, as they are sometimes known) on your managed
device. This process varies from manufacturer to manufacturer, so consult the documentation for your device
to determine what steps are necessary to enable this capability.
Be sure to specify, or take note of, the device’s Community string. The Community string is essentially
a password for retrieving SNMP data, and this string will need to be provided to Netmon.
Once you have enabled SNMP on your managed device, take the following steps in Netmon:
1. Click the New Device button at the top of the SNMP Device Explorer.
2. Enter the IP address of the device into the IP Address field.
3. In the Label field, specify a friendly name for your device, such as ’London Office Router’.
4. Choose a sampling interval and enter it into the Sample Every: text box. Netmon uses a default value
of 180 seconds, but you can specify any interval you like.
5. Enter the community string that your SNMP managed device requires in order to answer SNMP v2
queries.
6. Be sure the Enable SNMP checkbox is checked.
7. If you anticipate receiving NetFlow data streams from this device, check the Enable NetFlow
checkbox. Otherwise, leave it unchecked. Alternately, if you anticipate receiving sFlow packet samples from
this device, check the Enable sFlow checkbox. Only one of these two checkboxes can be enabled at one
time.
8. Click the Add Device button.
Note: Once you have added a new SNMP device, it can take Netmon several minutes or more to discover
all of the interfaces and begin gathering SNMP data. In some cases, it could take as long as one hour for
data to appear in Netmon’s console.
Updating an Existing SNMP Device
You can update the sampling frequency, community string or friendly label of any SNMP device by doing
the following:
1. Locate the device you wish to modify in the SNMP Device Explorer, and click on the main device
node.
2. Update the necessary fields, and click the Update button or press ENTER to save your changes.
37
CHAPTER 6. MONITORING DEVICES
Removing an SNMP Device
To remove an SNMP device, take the following steps:
1. Locate the device you wish to remove in the SNMP Device Explorer, and click on the main device
node.
2. Locate the Remove Device button in the detail window and press it. You’ll be asked to confirm that
you really want to delete this device. If you’re sure, click OK to proceed with the delete operation.
Caution: Deleting an SNMP device can take a long time, because all of the historical data that was
collected for it must also be deleted. Depending on the size of your database, this procedure could take
anywhere from 10 seconds, to several minutes or more.
Using the Device Toolbar
The device toolbar appears at the top of all device-related pages. It corresponds to the collapsing menu
which can be seen in the Device Explorer tree, so you can use whichever navigation style you prefer.
To
see
a
brief
Device
description
Dashboard
Device
Notes
for
any
Return
View
toolbar
to
notes
button,
the
simply
home
history
hold
dashboard
for
the
your
mouse
for
this
selected
over
it.
device.
device.
Network Activity View network activity statistics for the selected device, or manage network activity monitoring preferences. (If the selected device does not have a Dashboard associated with it, this page becomes
its
dashboard.)
Events
and
Logs
Review Syslog and Event Log history for the selected device.
SNMP MIB Walk (Full) Performs an SNMP walk on all known branches of the management
tree. Depending on the amount of management information exposed by the selected device, this operation
can be a resource-intensive operation. In extreme cases, it can take up to one minute for the walk to complete.
SNMP MIB Walk (Enterprise) Performs an SNMP walk on the enterprise-specific branches of the
management object tree.
This operation is less resource intensive than a full SNMP walk.
SNMP Object (OID) Trackers
Browse OID object trackers for the selected device.
SNMP Trap Messages View SNMP trap messages which have been sent by the selected device to
your Netmon system. Click here to learn more about Netmon’s SNMP Trap Handler Service.
CHAPTER 6. MONITORING DEVICES
38
Using the Interface Explorer
The SNMP Interface Explorer provides a detailed view of a specific device interface. For switches, routers,
firewalls and other networking-oriented devices, each of these interfaces could represent a physical Ethernet
network jack, or they could also be ’virtual’ interfaces, such as those used for VLANs and local loopbacks.
Basic Interface Information
Netmon displays the following information for the selected interface:
Interface This is the interface number reported by the device.
Speed This is the maximum speed of the interface, measured in bits per second (bps).
MAC Address If Netmon is able to resolve the MAC address of the interface, it is displayed here.
Otherwise, you’ll see the text Unresolved.
Technical Note: To attain the MAC address of a port, first Netmon determines if the device is a Cisco
switch or not. If so, it first acquires a list of operational VLANs using CISCO-VTP-MIB::vtpVlanState
(1.3.6.1.4.1.9.9.46.1.3.1.1.2). It then uses each VLAN index in this list to query BRIDGE-MIB::dot1dTpFdbPort
(1.3.6.1.2.1.17.4.3.1.2) using a community string composed of ’community@VLAN INDEX’ to obtain a listing
of MAC addresses and virtual ports. It uses the virtual port number to query BRIDGE-MIB::dot1dBasePortIfIndex
(1.3.6.1.2.1.17.1.4.1.2) which returns a physical port number. If the device is not a Cisco switch, it skips the
step of querying the VLAN states.
CHAPTER 6. MONITORING DEVICES
39
Connected IP/MAC If Netmon is able to determine the IP or MAC address of the host that is connected
to this interface, it is displayed here. Otherwise, you will see Unresolved.
Label This is the interface’s friendly label. By default, Netmon displays the label provided by the SNMP
host. However, you can override this label by typing your own text into the textbox, and clicking the Update
button.
Display on Home Page This checkbox allows you to show recent activity for this interface on your
Netmon home page. For example, you may want to display all of your outside Internet interfaces on the
Home page. Simply toggle the checkbox on or off, and click the Update button to save your changes.
Interface Monitoring Options
Several different options can be set for monitoring specific interfaces. To set these options, click the desired
interface in the Device Explorer, and you will see available options in the Settings Editor window in the
top right of the screen.
Label By default, Netmon uses the ifDesc value in the MIB tree to label the interface. However, you can
apply your own custom labels to an interface by entering a new value here.
Display on Home Dashboard This checkbox sets whether or not a graph will be shown for this interface
on the Netmon home dashboard.
Enable SNMP Logging This checkbox sets whether or not to record historical bandwidth utilization
data for this interface in the database. The length of time that data is kept depends on the historical data
policy you set for the SNMP Interface Monitoring Service, and can range from 1 day to forever. When this
checkbox is selected, you’ll see a
icon next to that interface in the Device Explorer.
Enable NetFlow This checkbox sets whether or not Netmon should expect incoming NetFlow packets
from this interface. When this checkbox is selected, you’ll see a
Explorer.
icon next to that interface in the Device
SNMP Interface Graph
The SNMP interface graph shows the input/output information for that interface. To view the interface
graph, click on the interface itself in the Device Explorer (or locate it in the Network Interfaces branch of
the Device Explorer tree) and you’ll be brought to the Interface Explorer.
The type of graph you’ll see depends on whether or not you’ve enabled SNMP logging for that interface.
If SNMP logging is enabled for the interface, you’ll see a line chart showing inbound and outbound bandwidth
utilization going back 30 minutes. If SNMP logging is not enabled, you’ll see a bar graph showing the last
inbound/outbound traffic statistics for that interface.
Did you know? You get an exact traffic figure for each point on the graph by holding your mouse
over the data point.
Configuring Alerts for an Interface
Netmon can send an email or pager alert when any specified interface goes above a user specified % utilization.
To add or remove email or pager alerts, simply click the appropriate selections from the Alert Management
panel, and choose Add or Del, respectively.
CHAPTER 6. MONITORING DEVICES
40
Device Dashboards
Device dashboards allow you to view key performance metrics (such as CPU usage, RAM and much more)
for several common platforms. Expensive SNMP walks are no longer required to review the most common
metrics.
Assigning a Dashboard to a Device
To use a built-in dashboard for your device, take the following steps.
1. Ensure that there is a dashboard for your particular device.
2. Click the Devices button in the top toolbar.
3. Locate your device in the Device Explorer on the left side of the screen. When you find your device,
click on its name. This will open the device’s current dashboard.
4. Locate the SNMP Manager window on the top right corner of the screen.
5. Make the appropriate dashboard selection in the Device Dashboard drop-down box.
6. Click the Update Device button.
Troubleshooting Dashboards
• Device dashboards require appropriate SNMP support on the monitored host. If SNMP services are
not enabled on your target device, you will not be able to retreive any dashboard data for that device.
• In addition to SNMP support on the target device, Netmon also requires the appropriate MIB file(s)
which match the target device profile in its own MIB repository. These MIB files are, in most cases,
stored in your Netmon system automatically, but it is possible to inadvertently remove them in Netmon’s
MIB File Browser.
• Not all metrics will necessarily be exposed by all devices which belong to a particular classification. In
these cases, some metrics will be unresolved.
Browsing SNMP MIBs
How Netmon Retrieves Management Information
CHAPTER 6. MONITORING DEVICES
41
Netmon uses the SNMP Walk facility to explore the exposed Management Information Base (MIB) tree
for a particular device.
Caution SNMP Walks can be very resource-intensive operations, and have been known to crash some
older devices. You should always exercise caution when walking mission-critical devices, especially ones which
are already under a heavy workload.
What is a MIB?
A Management Information Base (MIB) generally defines the set of parameters that an SNMP management
station can query (or set) in in an SNMP-enabled device. It is essentially a collection (or more than one) of
information that can be gathered from an SNMP-enabled device.
Common MIB Data Types
Netmon automatically recognizes the following common MIB data types:
32 Bit — Any 32-bit value. This value is generally expressed as an integer.
Gauge — Any 32-bit value. This value is generally expressed as an integer.
Hex — A 32-bit hexadecimal number.
Integer — Any valid integer.
Host Address — An IP address.
OID — A numeric OID reference string.
String — A string value.
Timeticks — usually expressed in milliseconds or microseconds.
Managing Custom SNMP MIBs
Netmon permits the uploading of custom MIBs to its repository. Once imported, OIDs specific in the MIB
definition will be replaced with the translated, human-friendly representations.
Uploading a Custom MIB
To upload a custom MIB, click the Manage Custom MIBs button at the bottom of the SNMP Device Explorer
panel. This opens the MIB File Manager in the middle pane.
Click the Upload New MIB button, which opens the SNMP Manager window in the rightmost panel.
Click the Browse button to locate the MIB file on your local system. Once you have selected a file, click the
Upload button to import it into Netmon.
In order to successfully import a MIB, all of its dependent MIBs must already be present in the system.
If Netmon detects that a MIB being imported is missing any of these dependencies, it may reject the upload
with an error message. You must identify the missing dependent MIBs (usually by examining the IMPORTS
declaration at the very top of the MIB definition).
Viewing a MIB Definition
To view an uploaded MIB, simply click on its name, or select the View link in the Actions column next to
the MIB you wish to examine.
CHAPTER 6. MONITORING DEVICES
42
Using the OID Tracker Service
Netmon’s SNMP OID tracker service allows you to watch a specific OID management point for changes. This
is an extremely flexible service that can be used to monitor hundreds or thousands of different performance
metrics from SNMP-capable devices.
What is an OID?
An Object Identifier (OID) represents a single piece of information about your device. OIDs belong to a
much larger information repository known as a Management Information Base (MIB). A MIB is a tree-like
structure (similar to the Windows Registry) which has OIDs as its branches and leaves.
Many network devices can expose hundreds, thousands, or even tens of thousands of OIDs, with each one
representing some piece of data related to the configuration and operation of that device.
Browsing OIDs with the MIB Browser
You can browse different branches of the MIB tree with Netmon’s built in MIB Browser. See Browsing SNMP MIBs
for more information.
When you find an OID of interest in the MIB Browser, you can click the Add Tracker link next to it to
have Netmon watch that object at any desired interval.
Creating an OID Tracker
Netmon allows you to track virtually any OID management point on the MIB tree. OIDs can contain different
types of data. The most common data types are:
CHAPTER 6. MONITORING DEVICES
43
• Integer [Example: 125658]
• Counter [Example: 40002]
• Gauge [Example: 55]
• String [Example: “HP LaserJet 4600DN”]
When tracking OIDs, Netmon renders Integer, Counter and Gauge data types in a similar fashion. Text
data types are displayed as a small datagrid.
When you find an OID of interest in the MIB Browser, you can click the Add Tracker link next to it
to have Netmon watch that object at any desired interval. You will then be prompted to enter the following
information:
Label Apply a descriptive label to this OID Tracker. Netmon will suggest a label based on the OID
you have selected, but it can often be beneficial to add additional information here. This label is the main
descriptive field used for Netmon’s email and pager alerts.
Sample Every The number of seconds between successive polls. Be sure to choose an appropriate value
here.
Enable Logging When this box is checked, it tells Netmon to record all historical poll results for the
specified OID Tracker. If the box is left unchecked, Netmon simply records the latest result to the database.
Display on Home Dashboard If this is an important OID Tracker, you can display it on the Netmon
Home Dashboard. Depending on the logging selection you have made (see above) this tracker will appear as
a line chart or a single-value panel.
Attaching Alerts to OID Trackers
In addition to tracking OID values, Netmon can notify you when the value of an OID exceeds a specific
threshold. For example, you may want to be notified if CPU utilization exceeds 90%, or if temperature in a
rack enclosure exceeds 85 degrees, or if the operational state of a service is anything except “running”.
To attach an Alert to an OID Tracker, take the following steps:
1. Locate the desired device in the Device Explorer window on the left side of the Devices console and
click on it.
2. Click the OID Trackers button
in the device toolbar.
3. Locate the Tracker you wish to attach alert parameters to, and then click the Alerts link next to it.
4. Enter the comparison value and expression in the boxes provided, and click the Add Alert button.
Netmon will evaluate the comparison expression at each polling interval. If the comparison expression
evaluates to false during any checkup, an alert message is relayed.
Modifying an Existing OID Tracker
To edit the tracker, click Edit. To delete the alerts for a tracker, click Alerts next to the tracker and then
press Del next to the alert you wish to delete.
Note: It is not possible to edit existing alert parameters. To modify an alert, you must delete it and
create a new one.
CHAPTER 6. MONITORING DEVICES
44
Removing an OID Tracker
To delete your new tracker, simply press Del next to your tracker in the list of OID Trackers for that device.
All associated alerts for that OID will also be removed automatically.
OID Tracking Tips
• The OID Tracker service is ideal for monitoring specific metrics that may not be exposed on a Device
Dashboard. In many cases, hundreds or even thousands of data points are available, but only a handful
of the most common metrics are displayed on the dashboard.
• OID tracking is used to monitor the operating state of Windows services. See Monitoring Windows Servicesfor
more information.
• Choose an appropriate monitoring interval for your OID tracking metrics. This saves processing resources and also keeps your database size optimized. For example, you may want to monitor RAM
utilization on your router as frequently as every 60 seconds, while monitoring the pages printed on a
network printer every 2 hours.
Processing SNMP Trap Messages
Traps are messages that are sent by managed devices automatically in response to some activity or condition
taking place. Your Netmon system can process these incoming trap messages, and can (optionally) log them
to the database and/or alert you when they arrive.
Sending SNMP Traps to Netmon
In order for Netmon to process SNMP trap messages, you must first configure your SNMP device to send
trap messages to Netmon’s IP address. Netmon expects to receive SNMP trap messages over UDP port 162,
which is the most widely used port for this service.
Once you begin sending trap messages from your device, Netmon will identify unique traps that arrive,
and record them in its database. Once Netmon identifies a trap, then you have the option of logging it and/or
attaching an alert to it.
Logging SNMP Traps
In order to log an SNMP trap, Netmon must first recognize it. If you click the SNMP Trap Messages button,
you will see a summary of all trap messages which Netmon has identified. To activate logging for a particular
trap, simply locate it in the list, and click the Enable Logging button. Netmon will then record incoming
traps from that OID to its database.
Trap Alert Services
If you’d like to be alerted when a particular type of SNMP trap message arrives, you must first enable logging
for that trap (see above). Once you have enabled logging, click the Alert
button next to the trap you
wish to receive alerts for. The SNMP Manager panel opens, and you can add an alert recipient to the trap.
CHAPTER 6. MONITORING DEVICES
45
Using the Notes Manager
Starting with Netmon 4.0, you can now associate one or more notes to specific devices. Using this facility,
you can record service histories, backup configurations, and virtually any information that can be stored in
a plaintext format.
Adding a New Note
To add a new note to a specific device, take the following steps:
1. Locate the device in the Devices Explorer and expand the selection so that its sub-items are visible.
2. Click the Notes selection in the Device tree, followed by the Add New Note button in the middle
panel.
3. Enter a subject line (required) for the note.
4. Enter (or paste) the contents of the note into the Note textbox.
5. Click the Save Changes button to commit the note to the database.
Modifying an Existing Note
To modify an existing note, take the following steps:
1. Locate the note you wish to modify in the Notes Explorer, and click the Edit link.
2. Make any necessary changes to the note’s subject or contents in the SNMP Manager window on the
right side of the screen.
3. When you have finished making changes, click the Save Changes button to commit the updated note
to the database. Netmon also automatically records the date/time that the note was modified.
Removing a Note
To remove/delete an existing note, locate the note and click the Delete link next to the Note title.
Chapter 7
Monitoring Windows Systems
Netmon can monitor your Windows services such as IIS, FTP, or any other program that runs as a Windows
service.
This is done using SNMP, so first you must configure SNMP support on your Windows system. This can
be done as follows:
Part I — Enabling SNMP support on Windows 2000/XP/2003 Hosts
If you have already enabled SNMP on your Windows system, you can skip this step.
1. Click Start > Control Panel > Add/Remove Programs.
2. Select the Add/Remove Windows Components button.
3. Ensure that the Management and Monitoring Tools option is checked.
4. Click Start > Control Panel > Administrative Tools > Services. Locate the service called
’SNMP Service’ and make sure it is running.
5. Right click the SNMP Service and select the Properties option.
6. Select the Agent tab and make sure all the services are checked.
7. Select the Security tab, where you can configure the community string, and which hosts SNMP will
accept requests from. (Be sure to make a note of this community string. You’ll need to provide it to Netmon
later.)
8. Click the OK button.
9. Restart the SNMP service, by right clicking on it and choosing Restart Service.
Part II — Monitoring a Windows Service in Netmon
Now that SNMP is running on your Windows server, we can now configure Netmon to monitor Windows
services. This is done through the Devices section, as follows:
1. Click the Devices button in the Netmon top toolbar.
2. Add the Windows device to your SNMP device list, if it is not already present. (See Adding a New SNMP Device
for more information). Be sure you specify an appropriate Windows dashboard.
3. In the Device Explorer, click on the Windows device. This will bring up its dashboard, where you will
be able to see various pieces of information for the target system. You will also see a section called Services
46
CHAPTER 7. MONITORING WINDOWS SYSTEMS
47
Summary. Click on the link below the header to see a list of Windows services 1 .
4. Locate the service you wish to monitor, and click the Add Tracker button: (
)
5. Enter the Label you wish to use for the tracker. Netmon will pre-fill the OID value here (svSvcOperatingState) but it is a good idea to over-write this label with the name of the service you are monitoring.
6. Choose how often you want it to sample (Sample Every), whether you want this tracker logged or not,
and check off Display on Home Dashboard if you would like this tracker to appear as a Dashboard on your
home screen.
7. Click Add Tracker to finish.
8. Now that the tracker is added, we can attach an alert onto it to send us emails when the tracker value
changes. To do this, select OID Trackers under the device in Device Explorer and click Alerts next to the
tracker we just created. Windows uses the following values for service status:
-1 = not present or not running 1 = running 2 = continue pending 3 = pause pending 4 = paused
9. Here you can set up your alert. Enter a Label for this alert and select a Recipient and the Media Type
by which to send the alert. Enter a Value Threshold of 1, and select Comparison Expression to be ’Not
Equal’.
10. Click Add Tracker to finish.
11. Your alert is now set up. You should receive an alert when a Windows Service stops running.
Modifying an Existing Windows Service Tracker
To edit the tracker, click the Edit link next to your tracker in the list of OID Trackers for that device.
Note: It is not possible to edit existing alert parameters. To modify an alert, you must delete it and
create a new one.
1 Don’t see this header on your device dashboard? It is most likely that you have not associated the correct Windows
dashboard to the device. See Device Dashboar for more information on assigning a dashboard to your device.
Chapter 8
Monitoring SYSLOG and Event Logs
Using the Event Log Explorer
Netmon’s built-in SYSLOG server allows you to manage SYSLOG and event log data from a variety of hosts
in a single, integrated console.
48
CHAPTER 8. MONITORING SYSLOG AND EVENT LOGS
49
Setting Up SYSLOG Clients
In order to manage event log data in Netmon, you must first configure your SYSLOG-capable clients to send
log messages to Netmon’s IP address.
Important: Netmon expects to receive log data over UDP port 514. Most SYSLOG message systems
should be configured by default to send messages over this port. However, if you’re not seeing expected SYSLOG data in Netmon, you may want to ensure that your client software is configured to use this protocol/port
combination.
Once you have configured your client device(s), take the following steps in Netmon:
1. Click the Manage SYSLOG Clients option in the SYSLOG Explorer window.
2. Click the Add New SYSLOG Client button in the Manage SYSLOG Clients window.
3. Enter the necessary information in each field (as detailed below) and then click the Add Now button.
Netmon requires the following information:
IP The IP address of the SYSLOG client.
Facility The message facility to collect. This option defaults to any (or all) facilities.
Min. Severity The minimum message severity level that Netmon should collect. Netmon will ignore all
SYSLOG messages which fall beneath this severity threshold.
Browsing SYSLOG Data in Netmon
You can look for specific kinds of log messages easily with Netmon’s Event Log Explorer. You can choose
any of these three options:
Browse by Client Using this option, you can browse log messages sorted by each SYSLOG client device.
Browse by Severity With this option, you browse SYSLOG data from any one of 8 different severity
levels: INFO, DEBUG, NOTICE, WARNING, ERROR, ALERT, CRITICAL, EMERGENCY.
Browse by Facility This option allows you to search by a wide variety of message facilities, including:
KERN, USER, MAIL, DAEMON, AUTH, SYSLOG, LPR, NEWS, UUCP, CRON, AUTHPRIV, FTP, NTP,
LOGAUDIT, LOGALERT, and LOCAL0 through LOCAL7.
Monitoring Windows Event Logs
Netmon can monitor Event Logs on Windows systems, and collect these logs in the same way that SYSLOG
messages are handled. The same alerting and reporting facilities are also available. A software agent is
required to facilitate this task.
Considerations for Event Log Monitoring
SYSLOG is a ’push’ oriented format, so most systems that support it are capable of sending log data to a
monitoring system with a few small configuration changes.
Windows Event Logs, on the other hand, were not designed to be forwarded to other systems, but are
instead are stored only locally in the file system. An agent is therefore required to retrieve these logs and
perform the task of sending them to a remote system.
Using the SNARE Windows Agent
Netmon recommends (and distributes with all Netmon products on CD-ROM) the SNARE for Windows
Agent, which gathers Event Log data and sends it in a SYSLOG-compatible format to your Netmon system.
CHAPTER 8. MONITORING SYSLOG AND EVENT LOGS
50
The SNARE Windows Agent is highly respected open-source package, which has no licensing costs (so
you can deploy it on as many systems as you desire) and is also supported by Netmon technical staff.
Netmon can provide you with a copy of SNARE Agent for Windows at no charge 1 . Contact technical
support for more information.
Searching the Log Repository
Netmon provides several quick-search options in the Event Log Explorer, but there are times when you
want to perform more finely-grained searches of your log repository.
Using the Event Log Search panel, located on the rightmost side of the Event Log console, you can
search the log repository by any (or all) of the following parameters:
• A specific time range (to a granularity of 1 minute);
• A specific facility (or group of facilities);
• A specific severity (or group of severities);
• A specific host (or group of hosts);
• A specific text pattern (or regular expression pattern);
Configuring Log Alerts
Netmon can alert you when a particular type of log message is collected by the system. You can be notified
when specific types, severities or payloads appear in a log entry. Netmon can even perform sophisticated
pattern matches on incoming log messages through built-in support for regular expressions 2 .
To set up an Event Log Alert, take the following steps:
1. Click the Manage Syslog Clients link in the Event Log Explorer window.
2. Locate the client you wish to monitor for incoming alerts, and click the Alerts link next to it.
3. Choose the appropriate matches to associate with the incoming alert. In the Text / Regex field, you
can enter a text string (for basic patter matches) or a regular expression (for advanced matching).
4. Click the Add New Alert button.
1 Per
the License Agreement, we can also supply you with a copy of the source code.
expression are created using a powerful expression language which is capable or preforming very sophisticated text
pattern search matching. A discussion of regular expressions is unfortunately outside the scope of this text. For an introduction
to regular expressions, visit www.regular-expressions.info.
2 Regular
Chapter 9
Monitoring Disks and Partitions
Netmon provides system administrators with the ability to monitor the amount of free space on networkR NT/2000/XP/2003 systems,
connected disks and partitions. Netmon can keep track of disks on Windows
as well as Unix or Unix-like hosts.
It can alert you when occupied space exceeds your defined threshold, and can also help you monitor volume
growth over time, which helps in capacity planning. Custom alert thresholds and notification parameters can
be set for each share, along with custom monitoring intervals and timeout periods.
How does Netmon monitor disks and partitions?
R NT-based systems, Netmon uses the Server Message Block (SMB) protocol to connect to
On Windows
your shared folders. The SMB protocol returns information to Netmon about the amount of free space on
the disk.
On Linux and Unix type systems, Netmon uses the df utility to work with inetd or xinetd super servers.
Netmon connects to the specified port number, parses the df output, and extracts the necessary disk information.
Monitoring Windows Volumes
Netmon can monitor public or administrative shares on Windows servers and workstations.
Adding a New Windows Share
To monitor Windows shared folders and drives, do the following:
1. If you have not already done so, create a shared folder on your Windows machine according to the
security considerations listed below.
2. Open the Disk Trackers console by clicking on Trackers > Disk Trackers.
3. Click the Add New Disk button on the Disk monitoring panel, and choose Windows for disk type.
4. Fill in the following fields, and then click the Add Disk button:
Domain Name This is the name of the domain (or workgroup) to which the host belongs.
IP Address This is the IP address of the Windows host.
Username This is the login or account name which has permission to access the share.
Password This is the password for the account which has permission to access the share.
51
CHAPTER 9. MONITORING DISKS AND PARTITIONS
52
Share Name If you have entered a valid domain, IP address, username and password, this field will
automatically display a list of available shares. If the information supplied is invalid, an error message will
appear here.
Timeout Specify how long, in minutes, Netmon should spend trying to connect to the remote host. The
default timeout period is 5 minutes, but this can be set to any interval you choose.
Interval Specify how frequently, in seconds, Netmon should check the remote share. The default interval
is 300 seconds (5 minutes) but this can be set to any interval you choose.
Threshold When this percentage of space is exceeded, Netmon will trigger an alert. You can enter any
value between 1 and 100.
Modifying Disk Parameters
To modify the monitoring parameters for a disk, take the following steps:
1. Open the Disk Trackers panel by clicking Trackers > Disk Trackers.
2. Click the Edit link next to the Disk you wish you modify.
3. Make the necessary adjustments to your Tracker parameters, and click the Update Disk button.
Removing a Monitored Disk
To remove a monitored disk, open the Disk Trackers panel, and click the Delete link next to it. You will
be prompted to confirm deletion. If you’re sure, click OK and the tracker will be deleted from your system.
Configuring Alerts for a Monitored Disk
To configure email and/or pager alerts for a disk, open the Disk Trackers panel, and click the Alerts link
next to the desired Disk. This opens the Alerts window for that particular disk, where email / pager alerts
can be added or removed from the disk.
Security Considerations for Monitoring Windows Shares
R folder requires that Netmon log in to the remote system with a valid
Monitoring a shared Windows
username and password.
Since the transmission of a non-encrypted user-name and password across the network is a security risk,
R shares safely:
use the following technique to ensure that Netmon can monitor remote Windows
1. Create a new, empty share on the drive or partition you wish to monitor, and set the access privileges
for this share to read-only. Do not place any data in this folder.
2. Create a separate user account on the target machine with the minimum access privileges required to
access the monitoring share.
Monitoring Linux and Unix Partitions
On Unix type systems, Netmon uses the df utility to work with inetd or xinetd super servers. Netmon
connects to the specified port number, parses the df output, and extracts the necessary disk information.
Note: If you wish to monitor Netmon’s own disk, it is recommended you follow this method instead of
the one described below.
On Solaris 10, inetd has become part of the “smf” service management system. See below for details on
this.
CHAPTER 9. MONITORING DISKS AND PARTITIONS
53
Adding a New Unix Partition (inetd Method)
Use this method if your system uses inetd. Monitoring a Unix partition requires a minor change to two
configuration files on the remote system. These files are called /etc/services and /etc/inetd.conf.
1. Insert the following line into /etc/services:
df 5001/tcp #DF
(We have specified port 5001 here, but you can actually choose any port number you wish. However,
you’ll have to remember to specify the same port number when adding this information to Netmon.)
2. Insert the following line into /etc/inetd.conf:
df stream tcp nowait root /usr/bin/df df -k
On some systems, the “df” utility will not be located at /usr/bin/df. Search for the location of this utility
with “which”:
which df
If the output of this command does not match “/usr/bin/df” then replace this bit of text in step 2 with the
output of this command. For example, if the output of “which” is:
/bin/df
You would modify the configuration line for /etc/inetd.conf to read as follows:
df stream tcp nowait root /bin/df df -k
3. Restart inetd with the following command:
killall { HUP inetd
Alternatively, you can use the following command:
kill-HUP <inetd PID>
On a Solaris 10 system, restarting inetd will have no effect, you must instead convert the inetd.conf entries
into the new format:
inetconv
This will convert your service definition to the smf format.
4. Open the Disk Trackers panel, located in the Trackers console.
5. Click the Add New Disk button on the Disk Monitoring panel, and choose UNIX for disk type.
6. Fill in the following fields, then click the Add Disk button:
IP Address This is the IP address of the UNIX host.
Port Specify the port number to which Netmon must connect. This should be the same port number as
entered in Step 1 above.
Partition Enter the device name of the partition (i.e. /dev/sda1 or /dev/hda1).
CHAPTER 9. MONITORING DISKS AND PARTITIONS
54
Timeout Specify how long, in minutes, Netmon should spend trying to connect to the remote host. The
default timeout period is 5 minutes, but this can be set to any interval you choose.
Interval Specify how frequently, in seconds, Netmon should check the remote partition. The default
interval is 300 seconds (5 minutes) but this can be set to any interval you choose.
Threshold When this amount of space is ex-ceeded, Netmon will trigger an alert. The default threshold
is 90%, but this can be set to any amount you choose.
Adding a New UNIX Partition (xinetd Method)
Use this method if your system uses xinetd. Monitoring a Unix partition requires a minor change to two
configuration files on the remote system. These files are called /etc/services and /etc/inetd.conf.
1. Insert the following line into /etc/services:
df
5001/tcp
#DF
(We have specified port 5001 here, but you can actually choose any port number you wish. However,
you’ll have to remember to specify the same port number when adding this information to Netmon.)
2. Create the ’df’ script in /etc/xinetd.d with the following content:
service df
{
disable = no
flags = REUSE
socket_type = stream
wait = no
user = root
server = /bin/df
}
3. Restart xinetd with the following command:
killall { HUP inetd
Alternatively, you can use the following command:
kill-HUP <inetd PID>
4. Open the Disk Trackers panel, located in the Trackers console.
5. Click the Add New Disk button on the Disk Monitoring panel, and choose UNIX for disk type.
6. Fill in the following fields, then click the Add Disk button:
IP Address This is the IP address of the UNIX host.
Port Specify the port number to which Netmon must connect. This should be the same port number
as entered in Step 1 above.
Partition Enter the device name of the partition (i.e. /dev/sda1 or /dev/hda1).
Timeout Specify how long, in minutes, Netmon should spend trying to connect to the remote host. The
default timeout period is 5 minutes, but this can be set to any interval you choose.
Interval Specify how frequently, in seconds, Netmon should check the remote partition. The default
interval is 300 seconds (5 minutes) but this can be set to any interval you choose.
Threshold When this amount of space is exceeded, Netmon will trigger an alert. The default threshold
is 90%, but this can be set to any amount you choose.
CHAPTER 9. MONITORING DISKS AND PARTITIONS
55
Modifying Disk Parameters
To modify the monitoring parameters for a disk, take the following steps:
1. Open the Disk Trackers panel by clicking Trackers > Disk Trackers.
2. Click the Edit link next to the Disk you wish you modify.
3. Make the necessary adjustments to your Tracker parameters, and click the Update Disk button.
Removing a Monitored Disk
To remove a monitored disk, open the Disk Trackers panel, and click the Delete link next to it. You will
be prompted to confirm deletion. If you’re sure, click OK and the tracker will be deleted from your system.
Configuring Email or Pager Alerts for a Monitored Disk
To configure email and/or pager alerts for a disk, open the Disk Monitoring panel, and enter the IP address
of the device.
Click the Alerts link next to the disk which is to be configured with alerts. This opens the Alerts window
for that particular disk, where email / pager alerts can be added or removed from the disk.
Chapter 10
Monitoring Websites and Web
Applications
Netmon can monitor websites and web applications by analyzing the results of an HTTP request. You can
use this service to monitor your corporate website, company intranet, or any other web-based system.
Introducing the URL Tracking Service
Netmon requests a user-specified URL at user-configurable intervals. It receives the resulting HTML web
page (or XML, or any other HTTP payload) and inspects the contents for a user-specified text pattern.
If Netmon finds a matching copy of the text pattern or phrase in the response, it assumes the website (or
web application) is functioning normally. If Netmon does not find a matching string in the response content,
it can be configured to queue an alert message.
Creating a New URL Tracker
To create a new URL Tracker, take the following steps.
1. Click the Trackers button in the top toolbar, followed by the URL Trackers button.
2. Click the Add New URL Tracker button.
3. Specify the desired URL in the URL text box. If you wish to include additional GET parameters, append them to the end of the URL in the usual querystring format (i.e. http://www.someweb.com/somescript.php?var1=true&v
4. Specify a text Pattern to use when matching the incoming HTTP response. You can specify a simple
text string, or use a Regular Expression (PCRE) for more sophisticated matching capabilities.
5. Choose a monitoring interval, in seconds. In most cases, the 5 minute (300 second) interval is suitable.
6. Click the Create Tracker button.
Attaching Alerts to a URL Tracker
Netmon can alert you by email or pager when it detects an invalid response from your website(s) or web
application(s). To attach an email or pager alert recipient to an URL Tracker, take the following steps:
1. Click the Trackers button in the top toolbar, followed by the URL Trackers button.
2. Locate the URL Tracker you wish to attach an alert to, and click the Alerts link next to it.
56
CHAPTER 10. MONITORING WEBSITES AND WEB APPLICATIONS
57
3. Assign the alert a Label, if desired. This step is optional.
4. Specify a Netmon user account to be the alert recipient.
5. Specify the Alert Media to be used (email or pager).
6. Specify one or more Alert Command(s) to associate with the alert condition, if desired and if
available.
7. Click the Add Alert button.
Modifying a URL Tracker
To modify an existing URL Tracker, take the following steps:
1. Locate the URL Tracker in the URL Tracker Explorer, and click the Edit link next to it.
2. Make the desired changes to the URL Tracker paramters.
3. Click the Update Tracker button.
Removing a URL Tracker
To remove an existing URL Tracker, take the following steps:
1. Locate the URL Tracker in the URL Tracker Explorer, and click the Del link next to it.
2. You will be prompted to confirm deletion. If you are sure, click OK.
3. The URL Tracker will be deleted.
Chapter 11
Netmon Reports
To access the Netmon Reports console, click the Reports button in the top toolbar. Netmon ships with
selection of built-in reports, which can be customized and saved depending on your needs.
Creating and Saving Custom Reports
You can save any of Netmon’s core reports as a custom report, for later retrieval. To save a report, simply
provide a friendly Report Name in the text box which appears at the top of the Report Builder panel. Then,
click the Save button to save the parameters you have entered.
When saving a report, Netmon retains all of the information you enter, except for custom date/time
ranges.
Network Activity Report
The Network Activity Report allows you to query Netmon’s network traffic database for any type of activity,
for any host.
To run a Network Activity Report, simply click the Network Activity Report icon in the Netmon
Report Explorer, and take the following steps:
1. Choose a source interface from the available drop-down box. You can select Netmon’s built-in Local
Packet Analyzer, or any NetFlow-enabled interface.
2. Choose a host (or group of hosts) to include in your query, and make the selection in the Hosts:
selection boxes. You can run a Network Activity report against All Hosts in the database, or you can narrow
your search by applying a host filter or specifying an individual host to scan. You can even look for hosts
which have a specific text pattern in their names.
3. Choose a reporting period. Available choices are Today, Yesterday, Last 7 Days and Custom. If you
choose Custom, you will need to enter a valid date and time range.
4. Choose the type of TCP/IP traffic to scan. You can scan for All Activity, or you can narrow your
search by applying a traffic filter, or specifying an individual protocol/port combination.
5. Finally, you can limit your result set and choose the ordering of the information with the Limit Results
To: and Order Results By: selection boxes.
6. Click the Generate Report button.
58
CHAPTER 11. NETMON REPORTS
59
Panel Actions
Print an instant printer-friendly report by clicking this button in the Network Activity Report window.
Conversation Report
The Conversation Report allows you to examine network activity between two hosts, or two groups of hosts.
To run a Conversation Report, simply click the Conversation Report icon in the Netmon Report Explorer,
and take the following steps:
1. Choose a source host (or group of hosts) to include in your query, and make the selection in the Source
Host(s): selection boxes . You can run a Conversation Report against All Hosts in the database, or you can
narrow your search by applying a host filter or specifying an individual source host.
2. Choose a destination host (or group of hosts) to include in your query, and make the selection in the
Destination Host(s): selection boxes . You can run a Conversation report against All Hosts in the database,
or you can narrow your search by applying a host filter or specifying an individual destination host to scan.
3. Choose a reporting period. Available choices are Today, Yesterday, Last 7 Days and Custom. If you
choose Custom, you will need to enter a valid date and time range.
4. Choose the type of TCP/IP traffic to scan. You can scan for All Activity, or you can narrow your
search by applying a traffic filter, or specifying an individual protocol/port combination.
5. Finally, you can limit your result set and choose the ordering of the information with the Limit Results
To: and Order Results By: selection boxes.
6. Click the Generate Report button.
Panel Actions
Print an instant printer-friendly report by clicking this button in the Conversation Report window.
Web Traffic Report
The Web Traffic Report allows you to query Netmon’s HTTP Request Plugin, which keeps track of URLs
which have been requested from your network.
To run a Web Traffic Report, simply click the Web Traffic Report icon in the Netmon Report Explorer,
and take the following steps:
1. Choose a host (or group of hosts) to include in your query, and make the selection in the Hosts:
selection boxes. You can run a Web Traffic report against All Hosts in the database, or you can narrow your
search by applying a host filter or specifying an individual host to scan.
2. Choose a reporting period. Available choices are Today, Yesterday, Last 7 Days and Custom. If you
choose Custom, you will need to enter a valid date and time range.
3. Enter a keyword or partial text string to narrow your search, if desired. This field is optional.
4. Click the Generate Report button.
Panel Actions
Print an instant printer-friendly report by clicking this button in the Web Traffic Report window.
CHAPTER 11. NETMON REPORTS
60
UP / DOWN Time Report
This report provides a summary of the availability of each of your monitored services and disks, for the time
interval specified.
To run an UP/DOWN Time Report, simply click the UP/DOWN Time Report icon in the Netmon
Report Explorer, and take the following steps:
1. Choose a reporting period. Available choices are Today, Yesterday, Last 7 Days and Custom. If you
choose Custom, you will need to enter a valid date and time range.
2. Click the Generate Report button.
Panel Actions
Print an instant printer-friendly report by clicking this button in the UP/DOWN Report window.
Bandwidth Activity Report
A Bandwidth Activity Report plots bandwidth utilization for SNMP device interfaces (such as those found
on routers, firewalls, switches and servers) for a given time interval.
Note You can only run a Bandwidth Activity Report if you have enabled historical logging for an interface.
To run a Bandwidth Activity Report, simply click the Bandwidth Activity Report icon in the Netmon
Report Explorer, and take the following steps:
1. Choose a device from the SNMP Device drop-down menu.
2. Choose an interface for the selected device from the Interface drop-down menu.
3. Choose a reporting period. Available choices are Today, Yesterday, Last 7 Days and Custom. If you
choose Custom, you will need to enter a valid date and time range.
4. Click the Generate Report button.
Panel Actions
Print an instant printer-friendly report by clicking this button in the Bandwidth Activity Report
window.
Bandwidth Consumption Report
The Bandwidth Consumption Report allows you to measure total network activity for particular subnet(s) or
IP range(s). This report is useful to identify the largest bandwidth consumers (and providers) on a particular
monitored network. Before you run a Bandwidth Consumption Report, familiarize yourself with the following
report parameters:
Source Network(s) This is the subnet or IP range you wish to measure. Every IP address in the selected
range will be accounted for in the resulting report (assuming there is network activity for that address).
Network(s) to Exclude Any activity between the source network(s) and the network(s) specified here is
excluded from the reporting result. This feature is useful, for example, if you want to measure Internet-bound
bandwidth for a subnet, while filtering out any local activities (i.e. activity which is switched internally, inside
the network border). Or, you may wish to filter out traffic which is destined to a particular branch office.
CHAPTER 11. NETMON REPORTS
61
Traffic Filter You can use traffic filters to limit the report result to a specific protocol or group
of protocols by making a selection here. The default selection includes all network activity, regardless of
protocol.
Order Results By You choose to produce a report for each individual IP address selected as Source
Network(s), or you can produce a report which summarizes the data for each network subnet/range.
Running a Bandwidth Consumption Report
To run a Bandwidth Consumption Report, click the Bandwidth Consumption Report icon in the Netmon
Report Explorer, and take the following steps:
1. Choose Source Network(s) from the available drop-down selection.
2. Choose Network(s) to Exclude from the available drop-down selection.
3. Select a reporting period. You can choose from any one of several pre-defined values, or specify a
custom time interval by choosing the Custom option.
4. Choose a Traffic Filter, if desired, to limit the protocols which are included in the reporting results.
5. Click the Generate Report button.
Panel Actions
Print an instant printer-friendly report by clicking this button in the Bandwidth Consumption Report
window.
Disk Activity Report
The Disk Activity Report allows you to plot disk utilization over a specified time interval.
To run a Disk Activity Report, simply click the Disk Activity Report icon in the Netmon Report
Explorer, and take the following steps:
1. Choose a disk, share or partition to include in your query, and make the selection in the Disk/Share/Partition selection box.
2. Choose a reporting period. Available choices are Today, Yesterday, Last 7 Days and Custom. If you
choose Custom, you will need to enter a valid date and time range.
3. Click the Generate Report button.
Panel Actions
Print an instant printer-friendly report by clicking this button in the Disk Activity Report window.
Email Traffic Inspection
The Email Traffic Inspection Report provides details on non-encrypted email traffic across a monitored
network. For each email that matches the filter critera, a line showing the sender, recipient and subject is
displayed. Further details for individual messages can be revealed by clicking the link labelled “Show” on
a particular line. This will reveal full details about the email message — client and server IP, attachments,
message size and headers.
CHAPTER 11. NETMON REPORTS
62
In order to run Email Traffic Inspection Reports you must enable the IMAP, POP3 and SMTP plugins
for your sniffing interface in Settings > Netmon Services.
To run an Email Traffic Report, click Reports > Email Traffic Inspection and take the following
steps:
1. Choose a host filter from the Host(s) dropdown, or leave the default selection of “all hosts”. This
will limit the results to a particular set of servers or clients, if you have previously defined them as filter
collections. Find more information on filter collections in Administration and Management.
2. Select a results limit. The Limit Results dropdown allows you to select how many rows of results
you will see. By default the report will return the top 25 results. You can select various quantities of results
up to “No Limit”.
3. Set keyword filters. To filter a report you must input both a keyword (or word fragment — wildcards
are automatically added to the beginning and end of any text entered here) and select a filter type: Sender,
Recipient, Subject, or Attachment. The input keyword will be matched against the selected filter type data
(ie, if you set your keyword to ’[email protected]’ and your filter type to ’Sender’ you will see only mails
sent to ’[email protected]’ in the output). To add more filters click the button labelled + to the right of the
Keyword text box. You can apply up to five filters to this report.
4. Choose a reporting period. Available choices are Today, Yesterday, Last 7 Days and Custom. If you
choose Custom, you will need to enter a valid date and time range.
5. Click the Run Report Now button.
Email Traffic Statistics
The Email Traffic Statistics Report provides a high-level summary of the non-encrypted email traffic across
a monitored network. Broken down by the type of report output you select, you will see a summary of the
e-mail messages sent and receieved, their acerage and total size for the selected report period.
In order to run an Email Traffic Statistic Reports you must enable the IMAP, POP3 and SMTP plugins
for your sniffing interface in Settings > Netmon Services.
To run an Email Traffic Statistics Report, click Report > Email TRaffic Statistics and take the
following steps:
1. Choose a report type. Available types are:
• Address (Summary of emails sent and received by email address)
• Client (Summary of emails sent and received by client IP)
• Domain (Summary of emails sent and received by email domain)
• Server (Summary of emails sent and recieved by server IP)
For the purposes of the Email Traffic Statistics Report, a “Client” is any system sending SMTP messages
to a server or receiving POP / IMAP traffic from a server, and a “Server” is any system receiving SMTP
messages or sending POP / IMAP traffic.
2. Select a keyword filter. If desired, type some text into the text box labeled Keyword Filter to only
see results for values of the selected report type matching the filter text. For example, to only see statistics
for emails sent to and from the domain ’netmon.ca’, select Address as the report type and fill in ’netmon.ca’
in the keyword filter.
3. Choose a reporting period. Available choices are Today, Yesterday, Last 7 Days and Custom. If you
choose Custom, you will need to enter a valid date and time range.
4. Click the Run Report Now button.
CHAPTER 11. NETMON REPORTS
63
Latency Report
The Latency Report analyzes all of the TCP Service Trackers, PING Service Trackers and Disks which have
been configured in the Netmon Trackers console, and provides an average latency (in milliseconds) for each
service, for the time interval specified.
Please note that in order to run a Latency Report for a specific device/service, you first need to enable
full historical logging for that device/service. By default, Netmon does not keep historical data for devices
or services, for performance reasons.
To run a Latency Report, simply click the Latency Report icon in the Netmon Report Explorer, and
take the following steps:
1. Choose a reporting period. Available choices are Today, Yesterday, Last 7 Days and Custom. If you
choose Custom, you will need to enter a valid date and time range.
2. Click the Generate Report button.
Panel Actions
Print an instant printer-friendly report by clicking this button in the Latency Report window.
OID Tracker Report
An OID Tracker Report allows you to examine historical values for any SNMP management object (OID)
through Netmon’s OID Tracker Service. Though this is a very simple report, it is extremely flexible and
useful for a variety of tasks.
Note: In order to run a report for any OID Tracker, you must first ensure that the Enable Logging
selection has been checked in the OID Tracker Manager.
To run an OID Tracker Report, take the following steps:
1. Choose OID Tracker Report from the Netmon Report Explorer.
2. Select a Device from the available list. (If no Devices are visible, see Note above)
3. Choose an OID Tracker from the available list.
4. Choose a reporting period. Available choices are Today, Yesterday, Last 7 Days and Custom. If you
choose Custom, you will need to enter a valid date and time range.
5. If desired, check the Delta Report option by clicking the checkbox. When this option is checked,
Netmon plots the rate of change of the management object over the desired time interval, as opposed to
absolute values.
6. Click the Generate Report button.
Panel Actions
Print an instant printer-friendly report by clicking this button in the OID Tracker Report window.
CHAPTER 11. NETMON REPORTS
64
URL Tracker Report
A URL Tracker Report allows you to evaluate the performance of websites and web applications. You can
monitor the performance (latency) of URL request delivery, as well as accuracy (expected results returned)
through the same report.
Note: In order to run a report for any URL Tracker, you must first ensure that the Enable Logging
selection has been checked in the URL Tracker Manager.
To run a URL Tracker Report, take the following steps:
1. Choose URL Tracker Report from the Netmon Report Explorer.
2. Select a URL from the available list. (If no URLs are visible, see Note above)
3. Choose a reporting period. Available choices are Today, Yesterday, Last 7 Days and Custom. If you
choose Custom, you will need to enter a valid date and time range.
4. Click the Generate Report button.
Panel Actions
Print an instant printer-friendly report by clicking this button in the URL Tracker Report window.
Port Scan Report
A Port Scan Report summarized the results of Netmon’s background port scanning service, which probes
hosts on your various network range(s) for open ports.
Netmon scans each host on your network range(s) every 2 hours, and records the results of its scan to the
database. A port scan report shows all scanned hosts, along with the open ports for each host.
To get more detail on a particular port/protocol, just click on it.
Configuring Network Service Alerts
Netmon can notify you when it detects a new network service (i.e. open port) that was not identified on a
previous scan. To configure alerting options for this service, click the Configure Alerts button at the top
of the Port Scan Report output window.
Panel Actions
Print an instant printer-friendly report by clicking this button in the Port Scan Report window.
Alert History Report
The Alert History Report displays a list of all email and pager alerts which have been generated across the
entire Netmon system for the specified period of time.
To run an Alert History Report, simply click the Alert History Report link in the Netmon Report
Explorer, and take the following steps:
1. Choose a reporting period. Available choices are Today, Yesterday, Last 7 Days and Custom. If you
choose Custom, you will need to enter a date and time range.
2. Click the Generate Report button.
CHAPTER 11. NETMON REPORTS
65
Panel Actions
Print an instant printer-friendly report by clicking this button in the Alert History Report window.
Netmon Login Report
The Netmon Login Report displays a list of all Netmon login activity for the specified period of time.
To run a Netmon Login Report, simply click the Netmon Login Report icon in the Netmon Report
Explorer, and take the following steps:
1. Choose a reporting period. Available choices are Today, Yesterday, Last 7 Days and Custom. If you
choose Custom, you will need to enter a valid date and time range.
2. Click the Generate Report button.
Panel Actions
Print an instant printer-friendly report by clicking this button in the Netmon Login Report window.
Chapter 12
File Management
The Netmon Files Manager console provides a central location for managing various kinds of files, including
data backups, traffic captures, proprietary SNMP MIBs and more. Here, you can view, download or delete
files as needed.
To use the files manager, simply click the Files button in the top toolbar, and then make the appropriate
selection from the Folder Explorer on the left side of the window.
Managing the Backups Folder
The Backups folder contains your Netmon data backups as well as various system-level backup files (including
package repositories). This is the location where you can view, download or delete these items, by clicking
the appropriate link next to each item.
icon next to any file, it means that Netmon does not recognize the file type. The default
If you see a
action for these file types is Download.
Managing the Enterprise MIBs Folder
The Enterprise MIB folder contains proprietary, enterprise-specific MIB files which have been uploaded
through Netmon’s Custom MIBs feature. You can view these files, download them, or print them.
icon next to any file, it means that Netmon does not recognize the file type. The default
If you see a
action for these file types is Download.
Managing Netmon Log Files
The Netmon Logs folder contains logging output for each of Netmon’s background services, such as the IP
Protocol Analyzer or Syslog Server. You may be directed to review these logs, or send them via email to
Netmon Technical Support personnel.
The size and contents of these log files depends on the level of logging verbosity you have specified in
Settings > Netmon Services.
icon next to any file, it means that Netmon does not recognize the file type. The default
If you see a
action for these file types is Download.
66
CHAPTER 12. FILE MANAGEMENT
67
Managing Traffic Capture Files
The Netmon Traffic Captures folder contains .cap files which have been created using Netmon’s low level
packet capture utility. These files are prepared in a format which can be read and understood by Ethereal / Wireshark
client software.
Traffic capture files need to be downloaded to your local system for analysis. They cannot be used from
within Netmon itself.
If you see a
icon next to any file, it means that Netmon does not recognize the file type. The default
action for these file types is Download.
Chapter 13
Administration and Management
Using the Settings Console
The Netmon Settings console is where most administrative tasks are performed. To open this console, click
the Settings button in Netmon’s main toolbar, and choose from a number of maintenance and administrative
snap-ins, including:
• Basic Setup Tasks
• Define Alert Conditionals
• Customize Alert Templates and Alert Commands
• Use Data Management Tools which can help you perform data backups
• Manage Traffic and Host Filters
• Manage Netmon’s Host Name Database
• Define Local Networks for reporting and display purposes
• Manage Netmon System Services
• Manage the Port Label Database
• Manage Netmon User Accounts
68
CHAPTER 13. ADMINISTRATION AND MANAGEMENT
69
Managing Alert Conditionals
What is an Alert Conditional?
An Alert Conditional provides fault tolerance for false alert situations. Imagine what might happen if the
Netmon server itself were to become disconnected from the rest of the network. Since it would be unable to
reach any of the services and devices it is monitoring, it might (incorrectly) assume that all of those services
and devices were down — and trigger the appropriate email and pager alerts. Nobody wants to receive an
avalanche of alert emails and/or pager beeps.
False alerts can be prevented with the use of a Conditional, which is simply an IP address that Netmon
checks in order to ensure that an alert situation is genuine.
If the IP address specified in the Conditional is determined to be alive (through a simple ICMP PING/echo
request) Netmon knows that the alert situation is real. On the other hand, if the IP address specified in your
Conditional is unresponsive, Netmon withholds the alert, since this would indicate that Netmon itself had a
connectivity problem.
Are Conditionals Mandatory?
No. Conditionals are optional, and you do not have to specify any. Their use is recommended only to prevent
unwanted false alarm situations.
CHAPTER 13. ADMINISTRATION AND MANAGEMENT
70
Using Conditionals Effectively
In most cases, you only need to set up two conditionals: one which tests internal connectivity (such as the IP
address of a domain controller or other high-uptime device) and another which tests external connectivity. For
external connectivity tests, choose the IP address of a highly-available web destination (such as Google.com).
Adding an Alert Conditional
To add a new conditional, select Alert Conditionals from the Settings Explorer, and click the Add
New Conditional button. A dialog window opens in the Settings Editor panel on the right side of the
screen.
Enter the IP address of the conditional in the IP Address, and specify a friendly name in the Conditional
Name field. To add this conditional to the database, press the Add Conditional button when you have
finished entering the preceding information.
Removing an Alert Conditional
To remove an alert conditional from Netmon’s database, select Alert Conditionals from the Settings
Explorer, and click the Delete link next to the conditional you wish to remove. You’ll be prompted to
confirm your decision: click OK to proceed with removal of the selected conditional, or Cancel to abort the
operation.
If you remove a conditional, you will also remove that conditional from any previously configured alerts.
Other previously configured conditionals for existing alerts will remain unchanged.
Managing User Accounts
Each individual who uses Netmon should have an individual user account. These people might include
network administrators, system technicians or even management / administrative personnel. Logging in with
Netmon’s admin account for normal everyday system usage is not recommended.
Viewing Account Details
To quickly view expanded details for a user account, such as group membership or pager information, click
the Details link in the Actions column, next to the desired account.
Adding a New User Account
To add a new user account, click the Add New User button in the middle panel. This will cause the
Settings Editor panel to open on the right side of the screen, displaying a form for the entry of new user
information. To read more about each of these , see Editing User Account Properties.
Modifying a User Account
To update group membership, an email address or other user details, click the Edit link in the Actions
column next to the account to be modified.
CHAPTER 13. ADMINISTRATION AND MANAGEMENT
71
Deleting a User Account
To remove a Netmon user account, simply click the Delete link in the Actions column next to the account
to be deleted. You’ll be asked to confirm if this is what you really want to do. If you confirm, the selected
user account will be removed from the system, and logins under that account will no longer be permitted.
Suspending a User Account
Suspending a user account has almost the same effect as deleting the account: future logins for that account
are disabled. However, when you suspend a user account, you have the later option to re-activate it. This
can be a useful option in cases where access should be temporarily disabled, but not permanently revoked.
For example, you may wish to temporarily disable the user accounts of technicians or administrators who
are away on vacation.
To suspend an active account, click Suspend in the Actions column. To reactivate an account which
has been previously suspended, click Reactivate in the Actions column.
Managing Account Groups
Account groups allow you to logically group individual Netmon user accounts, and bind them to a specific
set of permissions that is common between them. For example, you may want to prevent network technicians
from deleting data or making changes to Netmon’s configuration, while providing senior administrators with
more control.
Netmon ships with four built-in account groups. You can modify the individual permission settings in each
of these groups, create your own groups, or even remove groups that are not required in your environment.
Administrators By default, this group has full control over the Netmon software application. It is
strongly recommended that you do not change the permission structure of this group, nor should it be
removed.
Backup Users This group is only permitted to perform backup operations, such as configuration backups,
database compact operations, and complete data backups.
Standard Users This is the ’normal’ account group that should be used for most of your Netmon user
accounts. It grants access to the entire Netmon application, but prevents members from deleting data or
performing administration functions.
Report Users By default, this group has read-only access to the entire Netmon application, but is prevented from altering data or performing system administration or maintenance functions. You can customize
the individual permissions in this group to allow/disallow access to specific areas of Netmon.
Understanding Permission Inheritance
A user account can belong to one or more groups. When a user account belongs to two groups or more, the
user inherits all available permissions from both groups.
Group A has permissions X and Y. Group B has permissions Z. A user who is a member of both groups
inherits permissions X, Y and Z.
Viewing Group Details
To quickly view expanded details for an account group, click the Details link in the Actions column, next
to the desired group.
CHAPTER 13. ADMINISTRATION AND MANAGEMENT
72
Adding a New Group
To add a new user account, click the Add New Group button in the middle panel. This will cause the
Settings Editor panel to open on the right side of the screen, displaying a form for the entry of new group
information. To read more about each of these, see Modifing Group Properties.
Modifying a Group
To update permission assignments for an existing group, click the Edit link in the Actions column next to
the group to be modified. Check/uncheck the desired values, and click the Update button in the Settings
Editor panel.
Deleting a Group
To remove a Netmon account group, simply click the Delete link in the Actions column next to the group
to be deleted. You’ll be asked to confirm if this is what you really want to do. If you confirm, the selected
group will be removed from the system.
Note: You should not remove the Administrators group, nor should you delete all groups. Doing so
could result in an unexpected lockout from administrative functions.
Managing Alerts
Netmon has a central facility for managing alerts from all sections of the application. Navigate to Settings
> Manage Alerts to see a list of all configured alerts.
Each alert is listed in its own information box. At the top of the information box, the alert type is listed
in blue, along with the alert description. The alert’s configuration is fully detailed in the lines below.
Along the top of the Alert Management interface are three buttons, Pause Selected, Resume Selected,
and Delete Selected. These buttons work in conjunction with the checkboxes next to each listed alert,
and the Toggle all checkboxes checkbox. Using the checkboxes, select the alerts you would like to take
immediate action on and click the appropriate button. You can take the same actions against a single alert
by clicking the Delete or Pause / Resume links on the right-hand side of the alert’s information box.
To modify an existing alert, click the Edit link to open the Settings Editor for this alert. Here you can
modify the alert’s conditions, descriptions, or recipients. When finished, click Update Alert to save your
changes.
To create a maintenance window for a specific alert, click the Schedule Maintenance link in the alert’s
information box. The Settings Editor will now show the Maintenance Schedule Builder. Use this
interface to schedule a maintenance window, during which the alert will not be triggered. Once a maintenance
window has been created, it will be listed in the information box and can be deleted by clicking delete next
to the schedule description.
Managing Alert Message Templates
Netmon allows you to customize the alert messages which are sent from various monitoring facilities through
the use of simple templates. Simply navigate to Settings > Alert Message Templates, and expand the
tree to see a complete list of available templates.
CHAPTER 13. ADMINISTRATION AND MANAGEMENT
73
Customizing an Alert Message Template
To customize any template, select it from the available list in the Settings Explorer. An editing window
will appear, showing the current alert text.
In any alert message, special information is inserted (such as the name and IP address of a service
which has failed, for example) via specially tagged keys into the template. These keys look like {$host} or
{$ip address}, and they help Netmon to understand where to place important alert information.
You can insert these tags anywhere in your template using the specially provided buttons. Simply position
the cursor where you’d like to place the data, and then click the desired button on the right side of the editing
window. You can also use standard cut & paste tools to move tags around your message.
You must click the Save Template button to permanently commit any changes you make to a template.
Restoring Default Templates
To restore any template to its factory default settings, select it from the template list, and click the Restore
Default Template button. The window contents will be immediately populated with the factory default
alert message for that particular alert. You must then click the Save Template button to commit any
changes to Netmon’s database.
Managing Alert Response Commands
Netmon can run special scripts or commands in response to an alert event. For example, you may wish to
run a port scan against a newly-discovered host, or receive a list of large files when a disk capacity alert is
issued. Using this facility, you can also issue a restart to an unresponsive Windows service.
Alert commands are associated with alert events, and they are managed on the same screen as Managing Alert Templates.
Once a command has been associated to a particular alert event, you then have the option to run that command for any alerts of that type.
Note that alert commands do not run automatically in response to alert events. You must still associate
any desired commands you wish to run with each new alert you create. This area simply allows you configure
which commands are available for a specified alert type.
Creating a New Alert Command
To create a new alert command, take the following steps:
1. Click Settings > Alert Message Templates and locate the alert condition to which you wish to
attach a new command. 2. Fill out the appropriate fields (outlined below) and click the Create Command
button.
Label A friendly name or label for this command.
Command The actual command syntax. The text specified here is run as a shell command on the
Netmon server. You can use the Insert Variable buttons on the top of the Alert Template window to insert
dynamically changing values (i.e. the device IP address, hostname, etc.) into your command string. Netmon
will substitute these values for each individual alert.
Timeout The number of seconds Netmon should wait to run the command before giving up.
Process Asynchronously / Add Output To Alert You can choose to process the command before
the alert message is sent by selecting the Add Output to Alert radio box. In this case, Netmon will append the
results of the command to the alert message you receive. Alternatively, you can run the command separately
CHAPTER 13. ADMINISTRATION AND MANAGEMENT
74
from the alert message by selecting the Process Asynchronously radio box, so that the command and alert
message are both processed separately from one another.
Modifying an Existing Alert Command
Any existing commands will be listed in the Alert Template editing window. To modify an existing command,
simply click the Edit link next to it. Make any necessary adjustments, and then click the Update Command
button.
Removing an Alert Command
To remove a command from the available selections, simply click the Del link next to it. You’ll be prompted
to confirm deletion. Once a command has been deleted from this area, any existing alerts which may have
called that command will continue to function, however, they will no longer run that command.
Sophisticated Alert Response Mechanism (SARM)
Overview
The most significant update to Netmon 4.5 to date is the introduction of a new facility that allows you to
configure custom commands to be executed when an alert is triggered. You can create your own scripts,
use built-in commands available as part of the Debian GNU/Linux Operating System, or use some of the
commands we have created just for you. Alert commands are associated with alert “Types”, and you can
create/edit/delete “Response Commands” by clicking on the Settings button of the top toolbar, then clicking
on the Alert Message Templates item in the tree. Some alert templates will not display the command
association dialog in order to avoid redundancy with other templates.
Creating Alert Commands
After clicking on the alert template that is of interest to you, you will see a new area at the bottom of the
template dialog with a form that allows you to configure your new command. The form contains the following
fields:
• Label: The value you enter in that field is the “Name” of your command, and is the value Netmon will
use to populate the “Command Association” dropdown when you create a new alert. Pick something
that briefly describes what the command does.
• Command: Enter the command Netmon will execute when the alert is triggered. This is typically the
name of your command, followed by specific arguments. You can pass any of the variables available on
top of that dialog to your command by clicking on the variable’s button.
• Process Asynchronously: If you select this option, Netmon will first dispatch the alert notification, and
then execute the specified command. This is useful if you want to ensure your alerts will be dispatched
quickly, but not recommended because you have no way of finding out if your command has failed.
• Add output to Alert: If selected, Netmon will first execute the specified command, collect its complete
output, and then add the output of the command to the alert notification message. This means that
Netmon must wait for your command to finish executing before it can send the alert. We recommend
using this setting, but you must also make sure that your command can complete in timely fashion to
ensure you will receive your alerts.
CHAPTER 13. ADMINISTRATION AND MANAGEMENT
75
• Conditions: Use the “Process on Failure” and “Process on Recovery” checkboxes to instruct Netmon
to execute the command when the alert condition is first met and also when the alert condition is no
longer met. This allows you, for example, to have Netmon execute your command when a server goes
down, and then again when that same server comes back up.
Upon creating your command, it will be immediately added to the commands list located right under the
alert creation form. You can click on the delete link beside any of the commands to delete it, or click on the
’Edit’ link to display an edit form, which you can use to update your command.
Associating Commands to individual Alerts
Builtin Alert Response Scripts
Examples
Pix Response Example
Portscanning new hosts that join your network
Restarting IIS on a Windows WebServer
Managing Host Names
Using this console, you can manage Netmon’s name database, which contains a variety of NetBIOS, DNS
and user-defined host names. Each of these host names maps to an IP address, and often many different
host names map to the same IP address. This console allows you to manage names for any host (and even
to include your own user-defined labels) as well as search Netmon’s database for host names which match a
particular search criteria.
Searching for Hostnames
To search Netmon’s name database, enter a search string in the Search Text/IP Address: box on the Hostname
Management console. (For example, to search for all hostnames which contain the text “google”, simply enter
google into the Search Text/IP Address: box) Then click the Search button.
If you wish, you can customize your search, to NetBIOS names only, DNS names only, HTTP Requests
only, or user-defined names only.
Removing a Host Name
In some cases, a host name may no longer be accurate or relevant. In these cases, you’ll want to trim
Netmon’s name database by deleting inaccurate or outdated names.
To delete any name, simply click the Delete link in the Actions column beside the particular name
which you wish to remove. You’ll be prompted to confirm that you really do wish to delete this name from
the database. If you’re certain, click the OK button to proceed, and Netmon will remove the name from its
database.
CHAPTER 13. ADMINISTRATION AND MANAGEMENT
76
Adding a User Defined Host Name
You can apply your own friendly host name to any IP address. Click the Add New Host button in the
Manage Hostname Database panel. An editing window will open in the Settings Editor panel on the right
side of the screen.
Enter the IP address and label, and then click the Add Hostname button. Your IP address will now
appear as your friendly label throughout the Netmon application.
Managing Filter Collections
One of the most powerful features in Netmon is the use of filters. Filters allow you to look for specific kinds
of traffic, or narrow your view to a certain set of IP addresses — or both! You can use filters in the Visual
Network Explorer (VNE) and they can also be used when creating reports. Netmon uses two kinds of filters:
Traffic Filters
Traffic filters allow you to refine your view (or a report) to look for specific TCP or UDP ports or protocols.
You can look for an individual protocol/port combination (i.e. UDP 514) or you can include a wide range of
different ports into a single filter.
Netmon ships with a series of built-in traffic filters, but you can also create your own traffic filters in the
Settings > Filter Collections > Traffic Filters console.
Host Filters
Host filters permit you to create logical groups of hosts, and narrow your search to a specific IP address, or
a group of related IP addresses. You can assign a friendly name to this group.
Netmon does not ship with any predefined host filters, as these are dependent on the IP addresses which
are important to you. You can create your own host filters in the Settings > Filter Collections > Host
Filters console.
Managing Network Ranges
For reporting and automatic discovery services, Netmon needs to know the IP range(s) that belong to
you. In many cases, your network range(s) will be LAN addresses which use non-routable IP ranges (such
as 192.168.xxx.xxx or 10.xxx.xxx.xxx) — however this does not necessarily have to be the case. (When
monitoring a WAN, for example, remote IP ranges could be listed here).
Each range should consist of a block of addresses, such as:
• 10.10.1.1 to 10.10.1.255 or
• 10.10.2.1 to 10.10.3.100
Adding a New Network Range
To add a new IP range to Netmon’s database, press the Add New Network Range button, under Settings
> Define Network Range(s), which makes an editing window visible. Enter the following values in the
boxes provided:
Starting Address The starting IP address of a contiguous block.
CHAPTER 13. ADMINISTRATION AND MANAGEMENT
77
Ending Address The ending IP address of a contiguous block.
Enable SNMP AutoDiscovery A checkbox indicating whether Netmon should attempt to scan this
range for SNMP-capable devices. If you do not want Netmon to perform automatic device discovery on this
range, uncheck this box.
Enable Background Port Scans A checkbox indicating whether Netmon should attempt to perform
background port scans against devices in this range. If you do not want Netmon to perform automatic port
scans on this range, uncheck this box.
Once the correct information has been entered, press the Add Network button.
Modifying an IP Range
To make changes to an existing IP Range, locate it in the Manage Network Range(s) panel, and click
the Edit link next to the range you wish to modify.
Make the necessary changes to your IP Range in the Settings Editor window, and then click the Update
Network Range button.
Removing an IP Range from the Database
To remove an IP range from the Netmon database, simply locate it in the Manage Network Range(s)
panel, and click the Delete link next to the range you wish to delete.
Using the Netmon Update Service
The Netmon Update Service is a background service that checks for new patches or updates for your Netmon
product automatically, every 24 hours. This service is capable of updating any component of your Netmon
system, including:
• Operating System / Security Updates
• Background Services / Netmon Engine
• Application / Middleware
• User Interface and Documentation
The Netmon Update Service uses the RSYNC protocol to communicate with the update server at Netmon
headquarters. It therefore requires your Netmon server appliance to establish outbound connections on TCP
Port 873. If your firewall rules do not permit this type of connection, you’ll need to install updates manually
from CD-ROM.
Checking for Updates Manually
You can also force Netmon to check for new updates anytime outside of its normal 24 hour interval. For
example, you may be instructed by Netmon Technical Support personnel to request an update, or you may
wish to apply a new update ahead of schedule. To manually trigger an update request, take the following
steps:
1. Click the Settings button in the top toolbar.
2. Choose Netmon Update Service from the Settings Explorer tree.
3. Click the Check for New Updates Now button.
CHAPTER 13. ADMINISTRATION AND MANAGEMENT
78
Installing Updates from CD-ROM
If your network does not permit outbound connections on TCP Port 873, you will need to apply patches and
updates manually from a CD-ROM image, which is available at the following location:
Link: http://www.netmon.ca/support/downloads/
Managing the Port Label Database
When Netmon recognizes a particular port (i.e. TCP port 80) it applies a friendly label (i.e. HTTP) from
this table. Netmon ships with nearly 2,000 built-in port labels.
To manage the port label database, click Settings > Port Label Database.
Adding a New Port Label
To add a new port label to Netmon’s database, press the Add New Port Label button, which makes an
editing window visible. Enter the following values in the boxes provided:
Transport Layer Choose between TCP and UDP.
Port Number Provide a valid port number, from 1 to 65535.
Label Enter a brief (36 character maximum) friendly label to apply to this protocol/port combination.
Once the correct information has been entered, press the Create Port Label button.
Modifying a Port Label
To change an existing port label, click the Edit link next to the label you wish to modify. An edit window
will appear in the Settings Editor on the right side of the screen. Made the desired changes to the transport
protocol, port number or label, and click the Update Port Label button to save your changes.
Removing a Port Label from the Database
To remove a port label from the Netmon database, simply click the Delete link next to the particular label
you wish to delete. You’ll be prompted to confirm each delete operation.
Built-In Protocol Dictionary
If an entry for a particular protocol exists in Netmon’s protocol dictionary, Netmon displays it when you click
the protocol’s friendly label. If Netmon does not recognize the protocol, a generalized entry is displayed.
Managing Netmon System Services
Netmon uses a variety of background services (known as ’daemons’ in the UNIX world) to perform its many
monitoring tasks. The Netmon Services Manager lets you monitor and manage each of these services for your
Netmon server appliance.
CHAPTER 13. ADMINISTRATION AND MANAGEMENT
79
Starting and Stopping Services
Each of Netmon’s background services can be started or stopped using this console. Under normal operating
conditions, it is generally not be necessary to start or stop any of these services. However, if you wish to
customize various services for different deployment scenarios, or if your Netmon server appliance is behaving
unexpectedly, this panel can be a quick way to tell if Netmon’s core services are alive and running.
icon, and services which are off have a
icon.
Services that are running are denoted with a
To change the start/stop status of any service, simply click the Start Service or Stop Service button
next to the service you wish to modify. Note that changes made in this panel are not preserved after reboot,
so they will need to be made again if you need to restart your Netmon server appliance.
Overview of Individual Services
ARP Probe Service Analyzes ARP packets and records MAC/IP pairs. This service is used to support
new host detection in the Recently Discovered Hosts panel, on the Netmon Home Dashboard.
Background Port Scanning Service With this service enabled, Netmon performs regular port scans
all of the IP address ranges defined in your Local Network range(s).
Email Alert Service This service supports the forwarding of email alerts to your mail server.
IP Packet Analyzer (Master Process) This is Netmon’s primary network traffic inspection and
protocol analysis service. The “IP” is a misnomer – this service is responsible for analyzing network activity
at many different OSI layers. This service coordinates each instance of a packet analyzer plugin (see Packet
Analyzer Plugin below) allowing incoming data from each interface to be properly managed.
Packet Analyzer Plugins (Interfaces 0 to 3) These plugins examine particular types of network
traffic. For example, the mod eth plugin examines Layer 2 frame activity, while the mod http plugin looks
specifically for HTTP requests at Layer 7. Simply start the desired plugin for each physical interface which
is to be monitored for that type of activity.
Name Resolution Service Responsible for resolving DNS and NetBIOS names for hosts which appear
in Netmon’s protocol analyzers. This service is generally best left active, unless you have specific reasons for
not resolving DNS names.
NetFlow Collector This service analyzes incoming NetFlow datagrams and processes them according
to the rules and policies set forth in the Devices section and the service configuration settings.
Pager Alert Service This service manages Netmon pager alert system. If you are not using pager alerts,
you can safely stop this service.
Service Monitor This service handles ICMP and TCP Trackers in the Netmon Trackers console. In
most cases, this service should be left running.
SNMP AutoDiscovery Service This service scans your Local Network range(s) for SNMP-capable
devices, and tries to connect to those devices. If Netmon discovers an SNMP-capable device, it adds it to a
list of discovered hosts in the SNMP console.
SNMP Interface Monitor This service monitors and records bandwidth utilization for network interfaces on SNMP-capable devices.
SNMP OID Tracker Service This service is responsible for monitoring user-defined management points
on SNMP-capable devices. If you are not monitoring custom Object IDentifiers (OIDs), you can disable this
service.
SNMP Trap Handler This service processes and stores SNMP trap messages, and optionally hooks
into Netmon’s email and pager alert system.
CHAPTER 13. ADMINISTRATION AND MANAGEMENT
80
SYSLOG Server Starts and stops Netmon’s built-in SYSLOG server. If you are not using the SYSLOG
server console, you can safely stop this service.
UNIX Partition Monitoring Service This service is responsible for monitoring Linux/UNIX disks
and partitions. If you are not monitoring Linux or UNIX partitions, you can disable this service.
URL Monitoring Service This service is responsible for monitoring websites and web applications. If
you are not monitoring these systems, you can disable this service.
Windows Share Monitoring Service This service is responsible for monitoring Windows NT/2000/XP
shared folders and disks. If you are not monitoring Windows disks with Netmon, you can safely turn this
service off.
Configuring Individual Services
Many Netmon Services have customizable settings. For example, the Email Alert Service allows you to specify
SMTP settings for outbound mail alert messages, and the Packet Analyzer Service allows you to adjust your
historical data retention policy for that service.
To configure custom parameters for specific services, click the Configure link next to the associated
service. You’ll be brought to a page where you can configure all available items for that service.
Data Retention Policies
Netmon stores data for a specified period of time. This ensures the disk will not get filled up with data as the
services continue to log network traffic and other information over long periods of time. Netmon allows you
to configure how long data will be stored in the system for each background service. This is configured under
Settings > Netmon Services > configure > data archival. The data archival setting is specified as
weeks. A data archival setting set to 6 weeks will mean that data will be deleted a month and a half after
it is recorded.
Below is a reference to point you towards which background service you will want to edit the data retention
policy for. In the below list, find the feature you want to limit data retention for, find the service name above
it, and click ’configure’ next to that service name in under Settings > Netmon Services.
Features and Their Associated Background Service
• Snmp Interface Monitor
– Bandwidth Activity Report
– Bandwidth Graphs
– OID Tracker Report
• ip plugin
– Network Activity Report
– Conversation Report
– Bandwidth Consumption Report
– Visual Network Explorer Traffic
• http plugin
CHAPTER 13. ADMINISTRATION AND MANAGEMENT
81
– Web Traffic report
• Syslog Server
– Events and Logs
Changing Service Startup Behavior
By default, Netmon is configured to start most background services when the appliance is booted. However, you may want to configure your system to start additional services (or services on additional network
interfaces) upon a system boot. You may also wish to turn certain services off at boot time.
To change the startup behavior for a particular service (or plugin) you change the Automatic / Manual
flag next to it. Setting a service/plugin to Automatic will tell your Netmon server to start that service/plugin
upon system boot. Choosing Manual will tell your system to leave that service off at system boot.
Shutting Down and Restarting the Netmon Server Appliance
To properly shut down or reboot the Netmon server appliance properly, you’ll need to log into the operating system console,
and issue one of the following commands:
Restarting the Server
To restart the server appliance, issue the following console command, and press Enter when complete:
shutdown -r now
Shutting Down the Server
To restart the server appliance, issue the following console command, and press Enter when complete:
shutdown -h now
Chapter 14
Troubleshooting Guide
Finding Help
Need help with your Netmon server appliance? We’re here to help. For Registered Product Subscribers,
assistance is just a call or click away.
• Use the Live Chat feature on the Netmon website: http://www.netmon.ca/support
• Email us at [email protected]
• Call us toll-free at 1-800-944-4511
Troubleshooting the Packet Analyzer
Here are a series of tips for troubleshooting Netmon’s packet analyzer:
No Visible Traffic
• Ensure that one or both network cards are plugged into a port on the switch which is receiving a copy
of all of the network traffic through port forwarding, SPAN, port mirroring or a similar mechanism.
• Ensure there is a valid network link by verifying that the network jack itself displays a flashing or solid
green light for both network cable connections.
• Be sure you have not applied a traffic filter or host filter in the Visual Network Explorer which is not
present on your network, causing no devices and traffic to be shown in the VNE.
Seeing Partial Traffic
• If you’re seeing mostly broadcast traffic (directed to x.x.x.255 addresses) and only a few instances
of other types of activity, chances are that port forwarding is not configured correctly your switch.
Netmon’s secondary network card operates in promiscuous mode, which means that it will capture all
broadcast traffic for the entire network segment being monitored, regardless of whether or not port
monitoring is correctly configured.
82
CHAPTER 14. TROUBLESHOOTING GUIDE
83
Troubleshooting Email Alerts
Here are some tips for troubleshooting Netmon’s email alerts:
1. Click Settings > Initial Setup Tasks > Alert Testing Utility.
2. Choose an appropriate Recipient from the available list.
3. Click the Send button.
Netmon will attempt to send a test alert message to the specified recipient. You will see the output
provided by your mail server in the window. If the alert was relayed successfully, you’ll receive it by email,
along with an OK message in the output window.
If the alert was not relayed successfully, you will see the error message returned by your mail server in
the output window. The most common problem seen here is that the mail server is not configured to permit
the Netmon server appliance to relay email messages.
Troubleshooting Pager Alerts
Here are some tips for troubleshooting Netmon’s pager alerts:
• Be sure the modem on your Netmon server appliance is connected to a dial tone via the supplied
telephone cable. This line should be a plain analog line, similar to what would be required for a FAX
machine. Certain phone systems do not provide a dial tone that is usable by the Netmon server.
• It’s important to distinguish between the Pager Terminal Number and the Pager Number. The
Pager Number is usually the number that people dial when they wish to send you a page. The Pager
Terminal Number is a special access line provided by your paging company. Instead of a voice prompt, it
provides a TAP-compliant handshake to facilitate electronic communications with a system like Netmon
for automated paging. In most cases, you’ll need to contact your paging service provider to acquire
this number.
Chapter 15
Database Reference
agg netflow
Table Overview
Contains aggregated network traffic data from the NetFlow Collector service. This is the table which is
used to construct Network Activity reports and Conversation Reports.
Column Definitions
Name
octets
out iface
in iface
timestamp
lowest port
flow src
dst ip
src ip
Type
int8
int4
int4
int4
int4
inet
inet
inet
Description
Source IP Address
agg snmp log
Table Overview
Contains aggregated bandwidth utilization information for SNMP devices
Column Definitions
84
CHAPTER 15. DATABASE REFERENCE
Name
outresets
outoctets
inresets
inoctets
agg log id
timestamp
interface
ip
Type
int8
int8
int8
int8
int8
int4
int4
inet
85
Description
IP Address of SNMP client
alert commands
Table Overview
This table contains the custom commands to be triggered while dispatching alerts.
Column Definitions
Name
perform on recovery
perform on failure
async
id
timeout
alert type id
command
label
Type
bool
bool
bool
int4
int4
int4
varchar
varchar
Description
Label associated with this canned command.
alert handler2command
Table Overview
This table maintains the associations between alert handlers and custom alert commands.
Column Definitions
Name
command id
handler id
Type
int4
int4
Description
Foreign key that refers to alert handlers.id
alert handlers
Table Overview
Netmon’s email and pager alerting mechanism relies on this table to determine how an alert should be
dispatched.
Column Definitions
CHAPTER 15. DATABASE REFERENCE
Name
alert template id
trigger id
id
required retries
user id
conditional id
media id
Type
int4
int4
int4
int4
int4
int4
int4
86
Description
Foreign key for the media
alert medias
Table Overview
Contains information on how alerts are dispatched.
Column Definitions
Name
id
name
Type
int4
varchar
Description
pager, sms, email, console, etc...
alert pending
Table Overview
Catalog of alerts waiting to be (re)processed
Column Definitions
Name
dispatch timestamp
trigger timestamp
id
retries processed
handler id
parsed alert message
parsed subject
sent
Type
int4
int4
int4
int4
int4
text
varchar
bit
Description
1 if this alert has been dispatched successfully, 0 otherwise.
alert triggers
Table Overview
The alert triggers table stores conditions that the system will attempt to match against the status of a
particular service or device to determine whether or not to trigger the associated alert, which will, in turn,
be dispatched through the use of the associated alert handlers.
Column Definitions
87
CHAPTER 15. DATABASE REFERENCE
Name
active
triggered
throttle interval
trigger id
trigger timeout
trigger threshold
reference pkey val
comp exp
label
pattern
reference table name
Type
bool
bool
int4
int4
int4
int4
int4
varchar
varchar
varchar
varchar
Description
Name of reference table
alert types
Table Overview
This table describes the conditions that constitute an alert situation.
Column Definitions
Name
id
original template
default template
default subject
description
name
Type
int4
text
text
varchar
varchar
varchar
Description
Type name of the alert
DF SERVICE DOWN, etc...)
(e.g.
SMB ABOVE THRESHOLD,
alert vars
Table Overview
This table describes what elements are available for a specific type of alerts.
Column Definitions
Name
id
alert type id
label
var name
Type
int4
int4
varchar
varchar
backup events
Table Overview
Description
Name of the var that the C back-end will export.
CHAPTER 15. DATABASE REFERENCE
88
This table tracks individual events associated with Netmon backup.
Column Definitions
Name
timestamp
backup id
id
event
Type
int4
int4
int4
varchar
Description
backups
Table Overview
This table maintains a history of all previous Netmon backups.
Column Definitions
Name
init timestamp
id
description
tables
status
notify
owner
Type
int4
int4
text
text
varchar
varchar
varchar
Description
Owner of the backup
conditionals
Table Overview
This table contains a list of IP addresses which Netmon can use to perform secondary checks before queuing
an alert. See Alert Conditionals in the Netmon User Guide for more information on how Conditionals work.
Column Definitions
Name
cond id
ip
name
Type
int8
inet
varchar
Description
Friendly name for the conditional (e.g. google)
daemons
Table Overview
Contains a list of installed background services / daemons.
Column Definitions
CHAPTER 15. DATABASE REFERENCE
Name
start auto
id
description
name
component type
Type
bool
int4
text
text
varchar
89
Description
daemonsconfig
Table Overview
Contains configuration parameters for various Netmon background services (daemons).
Column Definitions
Name
id
daemon id
docstring xml
value
var
Type
int4
int4
varchar
varchar
varchar
Description
Name of the config option
devices
Table Overview
This table contains Netmon’s master list of devices, along with a series of flags which denote various
device capabilities configured in Netmon. Items in this table appear in the Devices Explorer.
Column Definitions
CHAPTER 15. DATABASE REFERENCE
Name
enable sflow
enable netflow
enable snmp
examined
pending
index
group id
timestamp
interval
snmp port
id
sysdescr
ip address
status
profile
snmp community
label
Type
bool
bool
bool
bool
bool
int4
int4
int4
int4
int4
int4
text
inet
varchar
varchar
varchar
varchar
Description
Label for the device
devices notes
Table Overview
This table associates custom notes to specified devices
Column Definitions
Name
last modified
created
id
owner id
device id
note
subject
Type
int4
int4
int4
int4
int4
text
varchar
Description
Subject of the note
df server log
Table Overview
This table contains historical records for Netmon’s UNIX Disk/Partition Monitoring Service.
Column Definitions
90
CHAPTER 15. DATABASE REFERENCE
Name
srv id
log id
total
available
timestamp
status
Type
int8
int8
int4
int4
int4
int4
91
Description
Status of the monitor when check occured
df servers
Table Overview
This table contains a list of UNIX/Linux disks, volumes or partitions which are currently being monitored
by Netmon.
Column Definitions
Name
srv id
available
total
timestamp
status
threshold
interval
timeout
port
ip
pending
message
servername
partition
Type
int8
int4
int4
int4
int4
int4
int4
int4
int4
inet
varchar
varchar
varchar
varchar
Description
partition name, ie /dev/sda
fs directories
Table Overview
This table contains a list of directories which should be included in Netmon’s Files Explorer.
Column Definitions
Name
id
notes
permissions
real path
label
Type
int4
text
varchar
varchar
varchar
Description
Label for this directory
CHAPTER 15. DATABASE REFERENCE
92
fs files
Table Overview
This table contains a list of files which are currently available in the FILES console.
Column Definitions
Name
busy
directory id
id
description
filename
label
Type
bool
int4
int4
text
varchar
varchar
Description
Label for this file
groups
Table Overview
This table simply specify what user groups are available. This can be used as Role Management, or
simply User Grouping (recommended for flexibility)
Column Definitions
Name
id
group name
Type
int4
varchar
Description
Name of the user group.
hosts
Table Overview
This is a catalog of hosts that were identified on the network at some point.
Column Definitions
Name
id
timestamp
ip
node type
hostname
host name type
Type
int4
int4
inet
varchar
varchar
varchar
Description
Type of hostname (SMB host, Custom name, DNS resolved name, etc...)
ignored http extensions
Table Overview
This table contains a list of file extensions which will be ignored by Netmon’s HTTP Request Analyzer
service
93
CHAPTER 15. DATABASE REFERENCE
Column Definitions
Name
id
extension
Type
int4
varchar
Description
interfaces
Table Overview
This table contains Netmon’s master list of network interfaces. It is closely related to the devices table,
as each interface in this table belongs to an entry in the devices table.
Column Definitions
Name
enable shm
enable logging
homedisplay
shm key
last outbound
last inbound
speed
outresets
inresets
device id
interface
id
last outbound throughput
last inbound throughput
mac
description
name
Type
bool
bool
bool
int8
int8
int8
int8
int4
int4
int4
int4
int4
float8
float8
varchar
varchar
varchar
Description
Name of the interface
localnets
Table Overview
This is a catalog of local networks on which the netmon box sits. Netmon uses the ranges defined in this
table for several services, including the Background Port Scanning Service and ARP Probe Service.
Column Definitions
CHAPTER 15. DATABASE REFERENCE
Name
enable portscan
enable snmp discovery
id
label
broadcast
network
Type
bool
bool
int4
varchar
varchar
varchar
94
Description
Network IP range
netflow
Table Overview
This table is a temporary storage location for incoming NetFlow datagrams. Every 30 minutes, data from
this table is aggregated into agg netflow, and the contents of this table are truncated.
Column Definitions
Name
packets
octets
protocol
out iface
in iface
timestamp
end time
start time
dst port
src port
flow src
dst ip
src ip
Type
int8
int8
int2
int4
int4
int4
int4
int4
int4
int4
inet
inet
inet
Description
Source IP address
netmon
Table Overview
This table is used internally to track registration information
Column Definitions
CHAPTER 15. DATABASE REFERENCE
Name
devices
company country
registration key
contact phone ext
contact phone
contact email
contact last name
contact first name
company state
company city
company address
activation key
company name
expires
is trial
Type
int2
varchar
varchar
varchar
varchar
varchar
varchar
varchar
varchar
varchar
varchar
varchar
varchar
date
bit
95
Description
netmon auth
Table Overview
This table contains a record of Netmon login activity.
Column Definitions
Name
timestamp
id
ip
medium
status
username
Type
int4
int4
inet
varchar
varchar
varchar
Description
User name
oid log
Table Overview
This table contains the historical values of OIDs which are being monitored by Netmon’s OID Tracker
Service
Column Definitions
Name
oid id
timestamp
id
message
Type
int8
int4
int4
varchar
Description
Message of the log entry
CHAPTER 15. DATABASE REFERENCE
96
oids
Table Overview
This table contains a list of OIDs being monitored by Netmon’s OID Tracker Service.
Column Definitions
Name
homedisplay
enable logging
timestamp
interval
device id
id
prev message
datatype
label
message
Type
bool
bool
int4
int4
int4
int4
varchar
varchar
varchar
varchar
Description
Message for the OID
permission2groups
Table Overview
Many-to-many relationships allowing groups to be assigned individual permission bits.
Column Definitions
Name
group id
permission id
Type
int4
int4
Description
The ID # of the permission
permission categories
Table Overview
This is a catalog of the categories available for each permission (for sorting and clear presentation of
permission bits)
Column Definitions
Name
id
name
Type
int4
varchar
permissions
Table Overview
Description
Name of the major category (e.g. User Management, Administration,
Reporting, etc...)
CHAPTER 15. DATABASE REFERENCE
97
Permissions are simple bits that the system uses to determin is a specific user is allowed to perform a
specific action at some point in time.
Column Definitions
Name
id
category id
name
Type
int4
int4
varchar
Description
Name of the permission (e.g. create new users, delete users, edit users,
activity report, portscan report, etc...)
plugins
Table Overview
The plugins db table contains all plugins which are used by netmon daemons. Netmond reads the content
of this table, loads and starts all plugins who have ’start auto’ set to ’t’. Plugins (which are dlls or shared
object) are found in /usr/local/lib
Column Definitions
Name
start auto
daemon id
id
description
running ifaces
start ifaces
name
Type
bool
int4
int4
text
varchar
varchar
varchar
Description
Name of the plugin
protocol breakdown
Table Overview
This table is used to provide data for Netmon’s Protocol Breakdown graphs (NetFlow).
Column Definitions
Name
timestamp
end time
start time
device
interface
id
ports
octets
Type
int4
int4
int4
int4
int4
int4
int4
int8
Description
CHAPTER 15. DATABASE REFERENCE
98
protocols
Table Overview
This is a catalog of protocol/ports pairs (similar to /etc/services)
Column Definitions
Name
id
threat level
port
name
protocol
Type
int4
int4
int4
varchar
varchar
Description
Transport-layer protocol for the protocol.
server log
Table Overview
This table contains a collection of server uptime and latency statistics over time.
Column Definitions
Name
srv id
log id
log timeout
interval
latency
timestamp
message
status
Type
int8
int8
int4
int4
int4
int4
varchar
varchar
Description
Status when checked
servers
Table Overview
This table contains a list of UNIX/Linux disks, volumes or partitions which are currently being monitored
by Netmon.
Column Definitions
CHAPTER 15. DATABASE REFERENCE
Name
srv id
log timeout
latency
timestamp
timeout
interval
port
ip
pending
message
status
protocol
name
Type
int8
int4
int4
int4
int4
int4
int4
inet
varchar
varchar
varchar
varchar
varchar
99
Description
Label of server
smb hosts
Table Overview
smb hosts inherits from hosts and adds the “domain” field to it.
Column Definitions
Name
id
timestamp
ip
smb domain
node type
hostname
host name type
Type
int4
int4
inet
varchar
varchar
varchar
varchar
Description
How the hostname was acquired
smb server log
Table Overview
This table contains historical disk utilization information for Netmon’s Windows Share Monitoring Service
Column Definitions
Name
srv id
log id
timestamp
blocksize
available
total
Type
int8
int8
int4
int4
int4
int4
Description
CHAPTER 15. DATABASE REFERENCE
100
smb servers
Table Overview
This table contains a list of Windows shared folders / volumes which are being monitored by Netmon.
Column Definitions
Name
srv id
threshold
timestamp
blocksize
available
total
status
interval
timeout
ip
pending
message
domain
servername
password
username
share
Type
int8
int4
int4
int4
int4
int4
int4
int4
int4
inet
varchar
varchar
varchar
varchar
varchar
varchar
varchar
Description
Name of SMB share to monitor
snmp log
Table Overview
This table contains historical bandwidth utilization data for network interfaces being monitored by Netmon’s SNMP Interface Monitor service.
Column Definitions
Name
outresets
outoctets
inresets
inoctets
log id
status
timestamp
interface
ip
pnotified
notified
Type
int8
int8
int8
int8
int8
int4
int4
int4
inet
bpchar
bpchar
Description
CHAPTER 15. DATABASE REFERENCE
101
snmp mib files
Table Overview
This table contains a reference of all the user-uploaded SNMP MIB files in the system
Column Definitions
Name
id
mib path
mib file
Type
int4
varchar
varchar
Description
Name of mib file
snmp oid trans
Table Overview
This table stores the OID to human-readable names. It is populated through calls to mib2xml
Column Definitions
Name
id
description
name
Type
int4
text
varchar
Description
OID name
snmp traps trans
Table Overview
This table is used to translate an SNMP trap’s OID to a human-readable format
Column Definitions
Name
mib id
id
trap description
trap name
trap oid
Type
int4
int4
text
varchar
varchar
Description
OID of Trap
snmpoids
Table Overview
This table is used to store the OIDs of received SNMP Trap messages. If the store flag is set to true for
an snmpoid record, then Netmon will log all incoming traps for that OID.
Column Definitions
CHAPTER 15. DATABASE REFERENCE
Name
store
id
snmpoid
ip
Type
bool
int4
text
inet
102
Description
IP address of device
snmptrap log
Table Overview
This table contains historical SNMP traps which have been collected by Nemton’s SNMP Trap Handler.
Column Definitions
Name
id
timestamp
port
trapoid
ip
Type
int8
int4
int4
text
inet
Description
IP address of device
snmptrapoids
Table Overview
This table is used to store the payloads of incoming SNMP traps messages.
Column Definitions
Name
log id
value
snmpoid
Type
int4
text
text
Description
OID
syslog
Table Overview
This table contains historical SYSLOG message data.
Column Definitions
Name
msg id
severity
facility
timestamp
ip
message
Type
int8
int4
int4
int4
inet
varchar
Description
The syslog message
CHAPTER 15. DATABASE REFERENCE
103
syslog access
Table Overview
This table contains a list of SYSLOG clients which Netmon will accept incoming SYSLOG messages from.
Column Definitions
Name
syslog id
severity
facility
ip
Type
int8
int4
int4
inet
Description
IP address of syslog client
url log
Table Overview
This table contains the historical status of websites and web applications being monitored by Netmon’s
URL Monitoring Service.
Column Definitions
Name
url id
latency
timestamp
id
status
message
Type
int8
int4
int4
int4
varchar
varchar
Description
Message of log entry
urls
Table Overview
This table contains a list of URLs being monitored by Netmon’s URL Monitoring Service (websites and
web applications).
Column Definitions
Name
enable logging
latency
timestamp
interval
id
status
message
pattern
url
Type
bool
int4
int4
int4
int4
varchar
varchar
varchar
varchar
Description
URL to monitor
CHAPTER 15. DATABASE REFERENCE
104
user2groups
Table Overview
This many-to-many relationship allows users to belong to multiple groups.
Column Definitions
Name
group id
user id
Type
int4
int4
Description
ID # identifying the user entry.
user sessions
Table Overview
Sessions represent currently active users. This table is used to track active sessions (session variable can
follow a user between requests) and meta-data allows the sessions to automagically expire, allow users to be
kicked out of the system, etc...
Column Definitions
Name
session userid
session ttl
session start
session time
session stack
session id
Type
int4
int4
int4
int4
text
varchar
Description
The session id is not sequence-based. It is generated by PHP using a
uuid algorithm.
users
Table Overview
This table stores basic information about every user that has access to the system. This table should
be used to retrieve pager #’s, email addresses, and other personal information while triggering alerts or
generating reports.
Column Definitions
Name
active
id
pager terminal
passwd
username
pager number
email
last name
first name
Type
int2
int4
varchar
varchar
varchar
varchar
varchar
varchar
varchar
Description
First name of the user.
CHAPTER 15. DATABASE REFERENCE
105
web traffic
Table Overview
This table contains a list of HTTP requests which have been sent from hosts defined in your Local Network
range(s).
Column Definitions
Name
timestamp
id
dst ip
src ip
content type
host name
url
Type
int4
int4
inet
inet
varchar
varchar
varchar
Description
URL requested