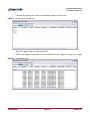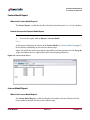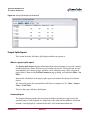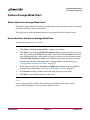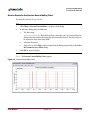
1
User
Manual
Version 3.2
Document Status: Preliminary
Updated: 10/18/09
www.licensetracker.ca
© License Tracker Inc.
Copyright
Copyright © 2004, 2005, 2006, 2007, 2008, 2009 License Tracker Inc.
All rights reserved.
No part of this document may be reproduced, stored in an information retrieval system,
translated or retransmitted in any form or by any means, electronic or mechanical,
including photocopying and recording, without prior written permission from the
copyright owner, License Tracker Inc.
www.licensetracker.ca
Trademarks
IBM LUM™, Flexlm™, License Tracker™, MySQL™, Oracle™, Petrel™, Novell™,
Reprise ™,Windows™, Solaris™, Linux™, MS-Access™, and Sentinel™ are
product names that are mentioned for identification purposes only and are trademarks
of their respective owners.
User Manual
ii of 117
Version 3.2
www.licensetracker.ca
© License Tracker Inc.
Table of Contents
Table of Contents .....................................................................................................................1
License Tracker 3.12 User Manual ..........................................................................................7
Document History ........................................................................................................................... 7
Legal Notifications ........................................................................................................................... 8
Trademarks ................................................................................................................................. 8
Copyright ................................................................................................................................... 8
About this Document ...............................................................................................................9
Purpose of this Document .............................................................................................................. 9
Audience ........................................................................................................................................... 9
Conventions used in this Document .............................................................................................. 9
Menu Items and Dialogs ................................................................................................................ 10
Description of Major Sections ..................................................................................................... 11
Fundamental Concepts ..........................................................................................................12
Log Files ......................................................................................................................................... 12
Content Scopes ............................................................................................................................. 13
Report Scopes ................................................................................................................................ 13
Filters .............................................................................................................................................. 14
Models ............................................................................................................................................. 14
User Model ................................................................................................................................ 16
Feature Model ........................................................................................................................... 17
Session Source Model ............................................................................................................. 18
License Models ........................................................................................................................ 19
Budget Models ......................................................................................................................... 22
Types of Users ............................................................................................................................... 22
Token Based Reporting ................................................................................................................. 23
Project Reporting ........................................................................................................................... 23
Global Licenses ............................................................................................................................. 23
Editions of License Tracker .......................................................................................................... 24
Server DataBase Edition ......................................................................................................... 24
File DataBase Edition .............................................................................................................. 24
Limited Edition ......................................................................................................................... 24
Starting License Tracker .......................................................................................................25
Installing License Tracker ............................................................................................................. 25
How to Install License Tracker ............................................................................................... 25
Getting a Valid License Tracker License ..................................................................................... 26
“License not for this release” Problem .................................................................................. 26
Producing License Tracker Reports .....................................................................................27
About Reports ................................................................................................................................ 27
The Reports Menu .................................................................................................................... 27
Version 3.2
1 of 117
User Manual
www.licensetracker.ca
© License Tracker Inc.
User Interface for Reports ....................................................................................................... 28
Changing the presentation of a report with “Tree View” and “Group By” ................... 29
Filter Parameters for Reports and Charts .............................................................................. 32
What are Filter Parameters for Reports and Charts? ..................................................... 32
How to Change Filter Parameters for Reports and Charts ............................................ 32
Date Range for Reports and Charts ....................................................................................... 35
What is the Date Range for a Report or Chart? ............................................................... 35
How to set the Date Range for a Report .......................................................................... 35
Database Summary Reports ......................................................................................................... 37
Database Information Report .................................................................................................. 37
What is the Database Information Report? ..................................................................... 37
How to Generate a Database Information Report ........................................................... 38
Data Sources Report ............................................................................................................... 39
What is the Data Sources Report? ................................................................................... 39
How to Generate the Data Sources Report ...................................................................... 40
Users Report ............................................................................................................................ 40
What is the Users Report? ................................................................................................ 40
How to Generate the Users Report ................................................................................... 41
Feature Model Report ............................................................................................................. 42
What is the Feature Model Report? .................................................................................. 42
How to Generate the Feature Model Report .................................................................... 42
License Model Report ............................................................................................................. 42
What is the License Model Report? ................................................................................. 42
How to Generate the License Model Report .................................................................... 43
Feature Use Summary Report ................................................................................................ 43
What is the Feature Use Summary Report? .................................................................... 43
How to Generate the Feature Use Summary Report ....................................................... 44
Groups Report .......................................................................................................................... 45
What is the Groups Report? ............................................................................................. 45
How to Generate the Groups Report ................................................................................ 46
Budget Report .......................................................................................................................... 47
What is the Budget Report? .............................................................................................. 47
How to Generate the Budget Report ................................................................................ 47
General Usage Reports ................................................................................................................. 47
Concurrent Use Report ........................................................................................................... 48
What is the Concurrent Use Report? ............................................................................... 48
How to Generate the Concurrent Use Report .................................................................. 48
Tabular Report ......................................................................................................................... 50
What is the Tabular Report? ............................................................................................. 50
How to Generate the Tabular Report ................................................................................ 50
Denial Detailed Report ............................................................................................................. 52
User Manual
2 of 117
Version 3.2
www.licensetracker.ca
© License Tracker Inc.
What is the Denial Detailed Report? ................................................................................ 52
How to Generate the Denial Detailed Report ................................................................... 52
Denial Summary Report .......................................................................................................... 54
What is the Denial Summary Report? .............................................................................. 54
How to Generate the Denial Summary Report ................................................................ 54
Long Session Report ............................................................................................................... 56
What is the Long Session Report? ................................................................................... 56
How to Generate the Long Session Report ..................................................................... 56
Financial Reports ........................................................................................................................... 58
Group Splits Report ................................................................................................................. 58
What is a Group Splits Report? ........................................................................................ 59
How to Generate a Group Splits Report .......................................................................... 60
Project Splits Report ............................................................................................................... 63
What is a project splits report? ....................................................................................... 63
Summary Report ................................................................................................................ 63
Other Reports .................................................................................................................... 64
How to Generate a Project Splits Report ........................................................................ 65
Summary Invoice Report ......................................................................................................... 68
What is the Summary Invoice Report? ............................................................................ 69
How to Generate the Summary Invoice Report ............................................................... 69
Detailed Invoice Report ........................................................................................................... 70
What is the Detailed Invoice Report? ............................................................................... 70
How to Generate the Detailed Invoice Report ................................................................. 71
License Model Efficiency Report ............................................................................................ 72
What is the License Model Efficiency Report? ............................................................... 72
How to Generate the License Model Efficiency Report .................................................. 73
Producing License Tracker Charts .......................................................................................75
About Charts .................................................................................................................................. 75
The Charts Menu ...................................................................................................................... 75
Setting Filter Parameters for Charts ...................................................................................... 77
What are Filter Parameters for Charts? ........................................................................... 77
How to set Filter Parameters for Charts .......................................................................... 77
Setting the Date Range for Charts .......................................................................................... 79
What is the Date Range for Charts? ................................................................................. 79
How to set the Date Range for Charts .............................................................................. 79
Setting the Chart Format to Pie or Bar ................................................................................... 80
What is the Format for Charts? ........................................................................................ 80
How to set the Format for Charts to Pie or Bar ............................................................... 81
Users Chart ..................................................................................................................................... 83
What is the Users Chart? ........................................................................................................ 83
How to Generate the Users Chart ........................................................................................... 83
Version 3.2
3 of 117
User Manual
www.licensetracker.ca
© License Tracker Inc.
Features Chart ................................................................................................................................ 85
What is the Features Chart? ................................................................................................... 85
How to Generate the Features Chart ...................................................................................... 85
License Usage Level Chart ........................................................................................................... 88
What is the License Usage Level Chart? ............................................................................... 88
How to Generate the License Usage Level Chart ................................................................. 89
Feature Average Week Chart ........................................................................................................ 90
What is the Feature Average Week Chart? ............................................................................ 90
How to Generate the Feature Average Week Chart .............................................................. 90
Concurrent Use Chart .................................................................................................................... 91
What is the Concurrent Use Chart? ....................................................................................... 91
How to Generate the Concurrent Use Chart .......................................................................... 91
Concurrent Use Analysis Chart .................................................................................................... 92
What is the Concurrent Use Analysis Chart? ........................................................................ 92
How to Generate the Concurrent Use Analysis Chart .......................................................... 93
Change In Usage Chart ................................................................................................................. 94
What is the Change In Usage Chart? ..................................................................................... 94
How to Generate the Change In Usage Chart ........................................................................ 95
Sessions Chart ............................................................................................................................... 96
What is the Sessions Chart? .................................................................................................. 96
How to Generate the Sessions Chart ..................................................................................... 97
Sessions Length Chart .................................................................................................................. 98
What is the Sessions Length Chart? ...................................................................................... 98
How to Generate the Sessions Length Chart ........................................................................ 98
Group Use Chart ............................................................................................................................ 99
What is the Group Use Chart? ................................................................................................ 99
How to Generate the Group Use Chart .................................................................................. 99
Denial Density Chart .................................................................................................................... 100
What is the Denial Density Chart? ........................................................................................ 100
How to Generate the Denial Density Chart .......................................................................... 100
Feature Unavailability Chart ....................................................................................................... 101
What is the Feature Unavailability Chart? ........................................................................... 101
How to Generate the Feature Unavailability Chart .............................................................. 102
Pay-per-Use (PPU) Summary Chart .......................................................................................... 103
What is the PPU Chart? ........................................................................................................ 103
How to Generate the PPU Chart .......................................................................................... 103
The Web Tracker Module ....................................................................................................105
Accessing the Web Tracker module ......................................................................................... 105
How to Access the Web Tracker module ............................................................................. 105
Generating Web Tracker reports ............................................................................................... 106
How to Generate License Tracker Reports with Web Tracker ........................................... 106
Viewing Web Tracker Reports ................................................................................................... 108
Home ....................................................................................................................................... 109
User Manual
4 of 117
Version 3.2
www.licensetracker.ca
© License Tracker Inc.
Features ................................................................................................................................. 110
Users ...................................................................................................................................... 111
Groups ................................................................................................................................... 112
Analyses ................................................................................................................................ 113
Support and Contact Information ......................................................................................116
Version 3.2
5 of 117
User Manual
www.licensetracker.ca
© License Tracker Inc.
User Manual
6 of 117
Version 3.2
www.licensetracker.ca
© License Tracker Inc.
License Tracker 3.2 User Manual
This is the end-user manual for License Tracker 3.2.
Administration information is available in the License Tracker 3.2 Administration Manual.
Document History
License Tracker 3.2, July 2009
Minor Release
Introduction of Project Reporting, pg 59
Introduction of Token-Based Reporting, pg 19
Introduction of Enhanced Debug Log (.enh), pg 11
Introduction of attributes to Feature Model, pg 12
Introduction of Global Licenses. pg 18
Introduction of Project Reporting, pg 18
Introduction of Session Source Models, pg 13
License Tracker 3.1 August 2008
Minor release.
Introduction of time-variable end-user attributes.
Introduction of tree view and sort of data.
License Tracker 3.0 November 2007
Major release.
Introduction of centralized MySQL and Oracle databases and administration.
Administration capability removed from end-users.
License Tracker 2.8, January 2007
Minor release.
Miscellaneous improvements to reports and charts. Support for new log formats.
Version 3.2
7 of 117
User Manual
www.licensetracker.ca
© License Tracker Inc.
Legal Notifications
This section details various legal notifications.
Trademarks
IBM LUM™, Flexlm™, License Tracker™, MySQL™, Oracle™, Petrel™, Novell™,
Reprise ™,Windows™, Solaris™, Linux™, MS-Access™, and Sentinel™ are product names that
are mentioned for identification purposes only and are trademarks of their respective owners.
Copyright
Copyright © 2005, 2006, 2007, 2008,2009 License Tracker Inc. All rights reserved.
No part of this document may be reproduced, stored in an information retrieval system,
translated or retransmitted in any form or by any means, electronic or mechanical, including
photocopying and recording, without prior written permission from the copyright owner,
License Tracker Inc.
See www.licensetracker.ca for current contact information.
User Manual
8 of 117
Version 3.2
www.licensetracker.ca
© License Tracker Inc.
About this Document
This section describes this manual.
Purpose of this Document
The purpose of the License Tracker User Manual is to explain the License Tracker application
clearly and effectively so you can use it to produce reports and analyze your license usage data.
This document also describes the procedures for using the Web Tracker module. This module
helps you streamline the process of building and displaying comprehensive usage reports.
A separate manual, the License Tracker Administration Manual, discusses the creation and
maintenance of License Tracker databases, model management, scope management, and
automating License Tracker with AutoTracker.
Audience
This document is intended for end-users of License Tracker.
Generally end-users need to generate reports that help them track the cost and usage of licensed
software. End-user responsibilities, at corporate and local level, are varied but often include:
•
maximizing the value of software assets,
•
managing and forecasting software license usage,
•
reducing software maintenance costs,
•
optimizing software license agreements, and
•
administering fair departmental billing.
This document is not intended for administrators of the license usage data. For more
information on administration functions please see the License Tracker 3.2 Administration
Manual.
End-users who wish capture and use license information locally should also refer to the License
Tracker 3.2 Administration Manual.
Conventions used in this Document
This document follows these conventions:
Version 3.2
9 of 117
User Manual
www.licensetracker.ca
© License Tracker Inc.
•
Buttons and menu items are referenced in bold font, for example, File, or displayed as a
screen capture.
•
Menu paths are also displayed in bold font, for example, File > Create File DB...
•
References to the License Tracker application, the Web Tracker module, the Auto Tracker
module, the Auto Tracker Alerts module and the License Tracker Manual are displayed in
italics.
•
In the sections that follow, references to the License Tracker application, the Web Tracker
module, the Auto Tracker module and the Auto Tracker Alerts module are shortened to
License Tracker, Web Tracker, Auto Tracker and Auto Tracker Alerts respectively.
•
Clickable links such as cross references and Internet addresses are in blue font.
•
Critically important information that affects the proper functioning of the software or the
report generated is prefaced by the word IMPORTANT. For example:
IMPORTANT:
•
An example of IMPORTANT information.
Clarifications and reminders are generally prefaced by the word NOTE. For example:
NOTE:
An example of a note or clarification.
•
Graphic changes between minor releases are marked as UPDATED. New user interface
elements are marked as NEW. Graphic changes between the last minor release and a new
major release are not flagged in any way.
•
User input, generally on the command line or in a dialog is in Courier font. For example
This is text entered in a dialog or the command line.
Menu Items and Dialogs
The pull-down menus and dialogs in the License Tracker screen follow these conventions:
•
•
User Manual
Menu items that are:
–
Followed by dots (for example, Reports...) open a dialog where you enter information.
–
Followed by an arrow display a pull-down menu with further options from which
you select one item.
–
Without arrows or dots (for example, Users) immediately display the selected item.
Check boxes are used as toggles to turn a parameters ON or OFF. A parameter or filter is
active when it contains a check mark. Click in the box to place the check mark and click
again in the box to deselect it.
10 of 117
Version 3.2
www.licensetracker.ca
© License Tracker Inc.
•
In dialogs there are areas that:
–
List items in a common category, for example users or licenses. These lists usually
allow selection using the mouse and the SHIFT or CONTROL key. To select a single
item, click on it. To select items in sequence, use the mouse and the SHIFT key. To
select items out of sequence, use the mouse and the CONTROL key.
–
Display headings in a table format. These usually require some type of data entry
using a button located near the window, for example ADD, or direct input using the
keyboard.
–
Text fields require a typed response or a button click.
–
To fill in directory location and filename fields, for example User Model, click on
Browse....
Description of Major Sections
The License Tracker Manual contains the following major sections.
•
“About this Document” on page 9 describes the License Tracker application, the
components that define it, the general screen layout, and how the menu items function.
•
“Purpose of this Document” on page 9 describes how to use the License Tracker Manual,
outlines the most recent updates to the application from previous software versions, and
identifies the contact numbers for License Tracker support.
•
“Fundamental Concepts” on page 12 explains the fundamental concepts you need to
understand to make the best use of License Tracker.
•
“Starting License Tracker” on page 25 describes how to install and start-up the License
Tracker application and how to assign preferences (default parameters).
•
“Producing License Tracker Reports” on page 27 describes how to produce individual
reports with License Tracker.
•
“Producing License Tracker Charts” on page 75 describes how to produce individual
charts with License Tracker.
•
“The Web Tracker Module” on page 105 outlines the purpose and function of Web
Tracker and describes how to produce additional comprehensive displays of multiple
License Tracker reports.
Version 3.2
11 of 117
User Manual
www.licensetracker.ca
© License Tracker Inc.
Fundamental Concepts
This section provides an overview of the fundamental concepts that must be understood to use
the License Tracker toolset.
License Tracker analyzes a variety of software usage log formats generated by most high-value
software packages. These log files are typically generated by license managers used to control
access to the software packages, or in some cases they are directly generated by the software
packages themselves.
License Tracker processes the supported logfiles and inserts the usage data into a License
Tracker database.
Once the log information is captured in a database in a standard format, License Tracker can
analyze the data further and generate useful cost and license usage information. This
information, captured in reports and charts, can then be used for controlling and reviewing
license usage and cost.
Users and administrators need to understand several key concepts to make effective use of the
capabilities built into License Tracker. These concepts include logfiles, content scopes, report
scopes, filters, models, administrator versus end-users and server databases versus file
databases.
Log Files
Software license usage is recorded in log files (session login and logout times, denial of access,
server startup and other events) on a continual basis. License Tracker accepts log files in the
following formats and uses them to create a license usage database; Auto Tracker Loader also
requires these formats and extensions:
Table 1: Table 1: Supported formats
Format
Extension
FLEXlm™ debug
.out
Flex Raw Report - RIF
.rif
Sentinel LM™
.sen
Reprise™
.rep
Petrel™SLOG
.pet
User Manual
12 of 117
Version 3.2
www.licensetracker.ca
© License Tracker Inc.
Format
Extension
Petrel Usage Report
IBM LUM™Basic Report
.lum
License Tracker ASCII
.lta
Enhanced Flex Debug
.enh
Content Scopes
The concept of scopes is fundamental to getting the most value from License Tracker and Web
Tracker.
From a technical point of view a content scope is simply a view into the database. It allows
administrators to specify exactly the data that should be extracted and analyzed to produce
reports and charts. In License Tracker, a content scope is a fairly coarse definition of a subset of
the whole database.
Administrators define scopes for end-users. Typically a content scope will be used to provide
the end-user access to all of license information for a particular location (Houston or Calgary),
a management unit (Division 1, Division 2), or a particular vendor (Vendor A, Vendor B) or
some combination of categories and attributes for users and features.
Defining a set of content scopes users will want to use has a significant impact on the load that
will be placed on a server database. If every end-user has access to a useful content scope, then
every report generated will require searching a dataset much smaller than the whole database.
Once an end-user selects a predefined content scope that best applies to them, the data can be
further refined by the end-user with filters.
Report Scopes
Report scopes are used to specify the contents for a set of Web Tracker reports. They are used
primarily as a control mechanism when using the Auto Reporter module of Auto Tracker to
generate many (potentially different) sets of Web Tracker reports.
From a technical point of view a report scope report scope is simply a definition of the contents
for a set of Web Tracker output. It allows administrators to specify which of types of reports
(feature, user, group and analyses) should be produced, as well as which components of the
selected reports are to be produced. The report scope also allows an administrator to specify
Version 3.2
13 of 117
User Manual
www.licensetracker.ca
© License Tracker Inc.
which user categories are to be included in the group reports and the group analysis component
of the feature reports.
Defining a set of report scopes recognizes that different information is needed for various usage
analysis requirements, and more importantly that certain reports are not needed for many
purposes. Typically an organization will create a report scope specifying all reports and then
create other report scopes reducing the number of reports generated (and therefore the
computation time required to generate the set of Web Tracker reports) for specific purposes.
Once an end-user selects a predefined report scope that best applies to their Web Tracker
reporting needs, they can further refine the report set definition in the Web Tracker report
selection dialog.
Filters
Filters, like content scopes, also define a subset of data but at a finer level of detail. Filters are
generally applied to data that has already been limited by a content scope defined by the
administrator.
End-users generally select a scope that best applies to their situation, for example, a location
such as “Calgary”. Within this content scope they can filter the data to define finer grained
report criteria, for example specific users, groups, vendors, or features.
This combination of content scope and filter accomplish two objectives simultaneously:
1)
Filters allow end-users complete freedom in defining exactly what information appears
in their reports, based on any criteria available in the data.
2)
Content scopes allow administrators to define commonly used views into the database.
End-users can apply filters to the entire database if they wish. If end-users do this frequently it
may indicate that there is a mismatch between the existing content scopes and end-users
reporting requirements. The easiest way to determine what the problem is to talk to end-users
who apply filters to the entire database.
Models
License Tracker makes extensive use of
•
user,
•
feature,
•
license
User Manual
14 of 117
Version 3.2
www.licensetracker.ca
© License Tracker Inc.
•
budget, and
•
session source
models in its interaction with software usage databases.
These models either:
•
Add attributes to data captured from logfiles that can be used to refine a query (for
example, Business Unit and Role associated with userIDs) or to control a computation
(for example, a false denial threshold).
•
Add information to data captured from logfiles that enhances understanding of the raw
data in reports (for example, what is the first name, last name and telephone number for
each userID).
All of these models are managed by the License Tracker administrator. They are important
because they determine to a large extent what can appear in a License Tracker report.
Creating a License Tracker database usually involves collecting and assembling information in
a user model, feature model, license models and budget models as well as importing the log files
that will provide the basic data for the License Tracker reports and charts.
Strictly speaking, only the log files are required before generating reports, but most
organizations will want to access the reports based on information captured in the user model,
feature model, license models and budget models.
The models can be prepared in other tools and imported as comma-separated value (CSV) files
or created and modified with the License Tracker editors. The user model, feature model,
license model and budget model files can be edited from within License Tracker -- this is the
normal way of editing these files. However,.csv files can be built using other tools and then
imported into License Tracker. This capability may be useful when setting up reporting for large
numbers of users and groups.
You can obtain the information for a model from a computer-account-management system by
exporting a .csv file containing the required information, and then edit the file in a
spreadsheet program to ensure the correct column order and headings.
You can also create a model file from an existing database using the export option, for example,
File > Export > User Model.... Models created in one database can be exported for use in
creating other databases in the future.
For more information please speak with your License Tracker adminitrator.
Version 3.2
15 of 117
User Manual
www.licensetracker.ca
© License Tracker Inc.
User Model
The user model is a simple ASCII .csv file. It links a userID, called a User Name, found in the
license usage data to a user’s
•
first name,
•
last name,
•
e-mail address, and
•
phone number,
•
and two built-in comment fields.
All of these fields in the user model provide information which is displayed in the header of the
Web Tracker user reports.
There is only one user model per License Tracker database.
The default user model contains the following headings on the first line of the ASCII file. These
heading names are reserved and significant to License Tracker. Heading order is not important
in the model.
User Name
The computer login name (that is, the userID) found in the license server log files.
UserName is the only required heading in a user model.
First Name
The real first name of the user.
Last Name
The real last name of the user.
Email Address
The user's e-mail address.
Phone Number
The user's phone number.
Comment 1 Date
A comment about the user.
Comment 2
A comment about the user.
User Manual
16 of 117
Version 3.2
www.licensetracker.ca
© License Tracker Inc.
Date
The date from which the user attributes specified in this row are valid.
Other headings may be added to the model by an administrator. These are treated as category
names by License Tracker. For example:
•
Category_1 ... Category_n
Categories (also known as group types) correspond to extra, administrator-defined columns in
the user model. Category names usually correspond to something significant to the
organization tracking license use. Examples included in the sample user model file are
“Location”, “Division”, and “Role”.
Each cell in a category column is an attribute (also know as a group) that can be used to further
refine categorization. For example, the category “Location” might be subdivided with the
attributes “Calgary”, “Houston”, and “Denver”.
A sample user model is shipped with License Tracker. The sample contains all of the headings
from the default model and some category columns with attributes entered in the cells.
User models are most often generated by exporting information from an LDAP or other
account management system to a CSV file. Some modification of the headings may be required
to make them match License Tracker user model requirements.
There is one user model per License Tracker database.
Feature Model
The feature model is a simple ASCII .csv file. It specifiesfeatures (or software packages) found
in the logfiles provided
•
a vendor name,
•
feature name,
•
license sharing strategy (no sharing, host, user, user + host, or vendor) and
•
a false denial threshold value.
Each of these items corresponds to a column that appears in the .csv file and in the Feature
Model window in License Tracker.
A sample feature model is shipped with License Tracker. The sample contains all of the
headings from the default model and some category columns with attributes entered in the
cells.
Version 3.2
17 of 117
User Manual
www.licensetracker.ca
© License Tracker Inc.
The sharing strategy specifies under what conditions License Tracker should deem multiple
user sessions from the logfile are using the same license. Most often, computation intensive
features have no sharing while interactive software frequently has user+host sharing (same user
at the same computer may have multiple sessions of the software using the same license). Any
sharing information provided in the license manager logfiles will override those specified in the
feature model.
Removing denials caused by license server chains or high frequency failed requests can be
particularly useful. The false denial threshold is used to control this. A duplicate denial (same
feature, same user, same host) found within the threshold of another denial is deemed to be
false; also, a denial for which a license is granted (same feature, same user, same host) within
the threshold is also deemed false.
Other headings may be added to the model by an administrator. These are treated as category
names by License Tracker. For example:
• Category_1 ... Category_n
Categories correspond to extra, administrator-defined columns in the user model. Category
names usually correspond to something significant to the organization tracking license use.
The examples included in the sample feature model file is “ApplicationType”.
Each cell in a category column is an attribute that can be used to further refine categorization.
For example, the category “ApplicationType” might be subdivided with the attributes “finite
element solver”, "layout" and “reservoir modeller”.
There is one feature model per License Tracker database.
Session Source Model
The Session Source Model provides details of each log file imported into a License Tracker
database. It has default headings:
Name
The name of the file loaded.
Type
The format of the logfile.
Vendor
The name of the vendor whose usage data was in the file.
Import Date
The date the file was loaded into the License Tracker database.
User Manual
18 of 117
Version 3.2
www.licensetracker.ca
© License Tracker Inc.
Start Date
First date in the log file.
End Date
Last date in the log file.
Sessions Read
Number of sessions read from the file
Sessions Loaded
Number of sessions actually loaded (may have been filtered out due to date, length, etc.).
Server
Name of the license server that this log file came from.
Other headings may be added to the model by an administrator. These are treated as category
names by License Tracker. For example:
•
Category_1 ... Category_n
Categories correspond to extra, administrator-defined columns in the user model.
Each cell in a category column is an attribute that can be used to further refine categorization.
For example, the category “ServerLocation” might be subdivided with the attributes “Kuala
Lumpur”, "Calgary" and “London”.
License Models
The license model is a simple ASCII .csv file. It links feature names found in the log files to
•
vendor names,
•
the number of licenses owned,
•
the ownership cost of licenses (average purchase and maintenance cost per license), and
•
software rental details
Version 3.2
–
rental rates: yearly, monthly, weekly, daily, or hourly;
–
rental mode: by the second, hourly, capped, etc.) and
–
minimum duration of sessions that are to be considered when calculating rentals.
19 of 117
User Manual
www.licensetracker.ca
© License Tracker Inc.
Multiple license models can be created for different financial analyses of the software usage
data.
NOTE:
License models are associated with content scopes and will not be considered in any
analyses until such an association is created. A single license model may be associated with
multiple content scopes. For more information please speak with your License Tracker
adminitrator.
A license model contains the headings listed below on the first line of the ASCII file. Only the
Feature Name and License Count headings are required. If more than one line are in a license
model for a single feature then they must have different valid “from” dates.
Vendor Name
The vendor's name. This is only used for adding new features found in the license model
to the feature table of the License Tracker database. If the feature is already in this table
then the contents of this field are ignored.
Feature Name
The software feature name as found in the license server logfiles.
Date
This is the date from which the data on this line is valid. This is to support the fact that
license counts and costs change over time. Use the format YYYY-MM-DD.
License Count
The number of licenses purchased (owned, not rented).
Product Cost
The average cost to purchase a single license.
Maintenance Cost
The average annual maintenance fee for a single purchased license.
Annual Cost
The annual rental license fee.
Monthly Cost
Monthly rental license fee.
Weekly Cost
Weekly rental license fee.
Daily Cost
Daily rental license fee.
User Manual
20 of 117
Version 3.2
www.licensetracker.ca
© License Tracker Inc.
Hourly Cost
The hourly rental license fee. If rental billing is by the second, provide the hourly rate
(PerSecondRate x 3600) in this column.
Mode
The type of rental mode. The rental mode, options are:
•
ANNUAL
•
MONTHLY
•
WEEKLY
•
DAILY
•
HOURLY
•
HOURLY_CAPPED.
If total hourly rentals exceed monthly rental costs then a monthly rental is added
and hourly rentals are recalculated; superseded by HR_CAP_MON.
•
HR_CAP_MON.
If total hourly rentals for a single rented license exceed monthly rental costs then it
is deemed to be rented for the month and hourly rentals are recalculated.
•
SECOND
•
SC_CAP_MON.
If billing by the second for a single license exceeds the monthly rate then the license
is deemed to be rented by the month and by the second rentals are recalculated.
Minimum Duration
This is minimum session length (in seconds) to be considered when calculating rentals
costs. All sessions shorter in duration will be ignored.
NOTE:
The last six columns in the license model file refer to rental fees (annual, monthly, weekly,
daily and hourly rates), and minimum duration. The mode indicates which rental model should
be used by License Tracker. If you do not use rental licenses, then leave these columns blank in
your file.
Budget Models
The budget model is a simple ASCII .csv file. It is a simple list of the budgeted rental costs per
month in an organization; if your organization does not have software rental arrangements
with any of your software vendors then you will not need to create or use budget models.
Version 3.2
21 of 117
User Manual
www.licensetracker.ca
© License Tracker Inc.
Multiple budget models can be created for specific views of the software usage data. A typical
example is a budget model for each budgeting unit in a corporation, or for rental budgets for
specific software vendors.
NOTE:
Budget models are associated with content scopes and will not be considered in any
analyses until such an association is created. A single budget model may be associated with
multiple content scopes. For more information please speak with your License Tracker
adminitrator.
A budget model must contain the following headings on the first line of the ACII .csv file:
Year
The year of the data.
Month
The actual calendar month name.
Amount
The money allotted to license usage for each month.
Types of Users
All users have administrative privileges for file databases.
Users who do have administration privileges on the License Tracker database do have access to
the Admin menu.
From License Tracker Admin menu administrators can:
•
import and delete software usage data,
•
create and manage user, license, budget and feature models, and
•
create and manage report scopes and content scopes for the organization.
Administrators can also use License Tracker as an end-user themselves.
License Tracker administrator privileges are also required to configure and run the Auto
Tracker modules.
User Manual
22 of 117
Version 3.2
www.licensetracker.ca
© License Tracker Inc.
Token Based Reporting
Traditionally, software vendors have used a feature-based licensing system where the customer
purchases or rents a certain number of per-user licenses for each software feature provided by
the vendor.
This model creates the situation where at certain stages of business activity, one feature might
run out of licenses while another does not, creating a situation where the business must pay for
more licenses of one feature while those of an already paid for feature are not used.
A token-based licensing system differs from a feature-based system in that instead of buying
licenses for each user, the business buys a certain number of tokens that go into a ‘token pool’.
The software vendor then defines how many tokens each software feature is worth, and when
that software feature is in use by any user, the corresponding number of tokens is removed
from the pool. When the user stops using the software, the tokens are added back into the pool.
When a user tries to use a piece of software, the token pool is checked to see if there are enough
tokens. If so, the user is allowed to use the software, if not, the user is denied.
License Tracker version 3.2 allows for the analysis and tracking of this sort of license model.
Typically with a token model, it is only possible to analyze the usage of the tokens. With License
Tracker version 3.2 it is possible to track the actual usage of each software feature within a token
pool.
Project Reporting
Frequently software usage is associated with a specific project within an enterprise. Whenever
this information is provided in a log file License Tracker will capture this information and store
it in its database. This information can then be used to divide software costs among projects
within the enterprise.
Global Licenses
Global licenses are purchased by software vendors to make License Tracker available to their
customers for the analysis of usage data from that vendor only. Users can download global
licenses from the License Tracker website at no cost; global licenses from many software
vendors can be installed at once, allowing the user to analyse data from all of them in a single
database. Enterprises making use of global licenses have complimentary access to the User
Manual and the Administrator Manual; access to all other support capabilities (such as User
Forum and regularly schedule webinars) requires a separate support contract.
Version 3.2
23 of 117
User Manual
www.licensetracker.ca
© License Tracker Inc.
Editions of License Tracker
This section describes the editions of License Tracker available for different data usage
requirements.
Server DataBase Edition
The Server DB Edition of License Tracker maintains its databases by interacting with a database
server. The two databases that are supported are: Oracle 10 and MySQL 5. The database server
and the License Tracker software may be running on the same machine, or they may be running
on separate machines. A separate license is required for the database server. The Server DB
Edition may be used on all platforms supported by the Java Runtime Environment 1.5 (i.e.,
Windows, Solaris, and Linux).
The Server DB Edition is appropriate for large organizations that need to analyze usage data
measured in the 100,000s to 100,0000,000s of user sessions.
File DataBase Edition
The File DB Edition of License Tracker maintains its databases in MS-Access files. The files are
always created and used within the filesystem that is accessible from the user’s computer. A
separate copy of MS-Access is not required. The File DB Edition can only be used with
Windows systems.
The File DB Edition is appropriate for organizations with small or moderate usage analysis
volumes measured in the 10,000s to low 100,000s of user sessions.
Limited Edition
The Limited Edition of License Tracker is a special version of the File DB Edition. This is the
default mode of License Tracker when started without a License Tracker license. The Limited
Edition restricts all databases to a maximum of 10 users and 15 software features. In addition,
the Limited Edition does not provide access to the Auto Tracker capabilities.
The Limited Edition is appropriate for small organizations with very low software usage. It may
also be used for evaluation of the License Tracker product.
User Manual
24 of 117
Version 3.2
www.licensetracker.ca
© License Tracker Inc.
Starting License Tracker
This section describes the basic procedures for starting-up License Tracker and setting-up your
database.
Installing License Tracker
License Tracker is easy to install; just ensure that your system is sufficient for the application
and follow the installation procedure.
How to Install License Tracker
PREREQUISITE The minimum system requirements for running License Tracker are:
•
Windows XP operating system
•
512 megabytes of RAM (or higher)
•
Java run-time environment, version 1.5 (or higher), and
•
your screen resolution should be 1024 X 768 pixels (or greater).
To install License Tracker:
TASK
1.
Access the License Tracker web site www.licensetracker.ca and download the zip™
file onto your hard drive.
2.
Extract the following folders from the zip™ file into a License Tracker directory:
•
•
•
•
bin contains executable files (extension .jar), a license file (extension .lic) and
a shortcut file.
conf this is where you install the license file (extension.dat).
data contains sample user, license and budget models.
doc contains the files for the License Tracker User Manual and License Tracker
Administration Manual (with extension .pdf).
3.
Install the license.dat file in the conf folder. This file was e-mailed to you as part of
the download process.
4.
To start License Tracker, open the bin folder and double-click on the License Tracker
shortcut file.
Version 3.2
25 of 117
User Manual
www.licensetracker.ca
© License Tracker Inc.
Getting a Valid License Tracker License
Part of the License Tracker download process is requesting a demonstration or regular license.
You should have received the appropriate license by e-mail from licensetracker.ca before
installation.
If you did not receive an e-mail with the appropriate license, please contact
[email protected].
As of version 2.7, the License Tracker license is tied to the version number of the software. A
new license is required for each new version of the License Tracker software.
If you do not have a valid license, License Tracker will start in Limited Edition mode.
“License not for this release” Problem
If the License Tracker reports an “invalid license” problem when the software is started after an
update, follow this procedure.
TASK
1.
Reinstall the “license.dat" file received from License Tracker as part of the upgrade
process. Make sure that you have copied the correct license.dat file to the conf directory.
STEP RESULT: If the problem persists go to the next step.
2.
Reinstall the software update as described in “How to Install License Tracker” on page
25.
STEP RESULT: If the problem persists go to the next step.
3.
User Manual
Contact License Tracker support. Contact information is listed under “Support and
Contact Information” on page 116.
26 of 117
Version 3.2
www.licensetracker.ca
© License Tracker Inc.
Producing License Tracker Reports
This section guides you through the procedures that create and display spreadsheet-like reports
in License Tracker.
PREREQUISITE:: This section assumes that you already understand the fundamental concepts of
License Tracker. If you are not familiar with License Tracker then go to “Fundamental
Concepts” on page 12.
PREREQUISITE:: This section also assumes that you have opened a database and have selected a
content scope.
The topics include:
•
“About Reports” on page 27,
•
“The Reports Menu” on page 27,
•
“Filter Parameters for Reports and Charts” on page 32,
•
“Date Range for Reports and Charts” on page 35,
•
“Database Summary Reports” on page 37,
•
“General Usage Reports” on page 47, and
•
“Financial Reports” on page 58
About Reports
The following headings contain descriptions that help you identify the various License Tracker
reports and define the report parameters:
•
“The Reports Menu” on page 27
•
“Filter Parameters for Reports and Charts” on page 32
•
“Date Range for Reports and Charts” on page 35
The Reports Menu
License Tracker reports are listed under the Reports menu item and are clustered by type of
report:
•
Version 3.2
“Database Summary Reports” on page 37,
27 of 117
User Manual
www.licensetracker.ca
© License Tracker Inc.
Figure 1:
•
“General Usage Reports” on page 47,
•
“Financial Reports” on page 58, and
•
Web Tracker menu items are also listed under Reports. Web Tracker generates reports
that can be viewed in a web browser. For more information see “The Web Tracker
Module” on page 105.
List of License Tracker Reports
User Interface for Reports
As of release 3.1 License Tracker introduced significant changes to the interaction between the
end-user and the data displayed in a report. These changes, the “Tree view” or “Explorer view”
and the “Group By” widget, are described below.
User Manual
28 of 117
Version 3.2
www.licensetracker.ca
© License Tracker Inc.
Changing the presentation of a report with “Tree View” and “Group By”
Most License Tracker reports consist of tables of data. As of release 3.1 the user can change how
data is presented in these tables with the “Group By” widget at the top of the table.
When first displayed, most reports look something like this:
Figure 2:
Initial view of a License Tracker Report (example)
This initial view can be modified by selecting a primary key from the “Group By” dropdown
list:
Figure 3:
Choose a primary key
Version 3.2
29 of 117
User Manual
www.licensetracker.ca
© License Tracker Inc.
Choosing the primary key results in the following compressed tree view:
Figure 4:
Initial compressed tree view
Note the + sign in front of each primary field.
Click on the + sign to expand the rest of the information (the + sign then changes to a - sign):
Figure 5:
Expanding the tree
User Manual
30 of 117
Version 3.2
www.licensetracker.ca
© License Tracker Inc.
The use of the Group By option can be extended even more:
Figure 6:
Extended use of the Group By option
You can change the tree structure by grabbing a heading and dragging it to a new position in
the “Group By” line-up:
Figure 7:
Changing the tree structure (1)
Version 3.2
31 of 117
User Manual
www.licensetracker.ca
© License Tracker Inc.
The resulting tree structure is shown below:
Figure 8:
Changing the tree structure (2)
Filter Parameters for Reports and Charts
What are Filter Parameters for Reports and Charts?
In License Tracker, there are different dialogs that allow you to refine the data that you display
in a report or chart:
How to Change Filter Parameters for Reports and Charts
In License Tracker, there are two ways to refine the data that you display in a report or chart,
the filter dialog and report specific parameter dialogs.
TASK
1.
User Manual
Set data filters in the Filter > Set Filter... > Select the Filter Parameters dialog and then
click the Use Filter button to activate them with a check mark.
ADDITIONAL INFORMATION: To deactivate the filters, simply click on the Use Filter button
again, to remove the check mark and License Tracker will use all of the data in your
32 of 117
Version 3.2
www.licensetracker.ca
© License Tracker Inc.
database. For more information, go to “Filter Parameters for Reports and Charts” on
page 32.
There are two ways to access this dialog:
a
Click Filter > Set Filter....
b
Press the Filter button in any report dialog.
ADDITIONAL INFORMATION: Not all reports display a dialog.
2.
Menu items under Reports and Charts that have dots in the name (for example,
Tabular...), display a dialog that you must fill in before producing the report or chart.
a
b
Different dialogs offer different parameters for your selection under the following
categories:
Data parameters - user names, license names, or group names, depending on the
report or chart
Usage parameters - total usage, overage, cost, or concurrent usage
Time parameters - days, months, years, session duration, or time range
Click the Filter button at the bottom of the dialog to display the Select the Filter
Parameters dialog then click the Use Filter button to activate the parameters you
have selected.
3.
Menu items under Reports and Charts without dots in the name (Groups for example),
immediately produce the requested report or chart without displaying a dialog. In these
situations, you need to filter your data under Filter > Set Filter....
4.
Select the tab of the parameter that you want to set (for example, Features, see Figure
below).
5.
Move the data that you want to use as a filter (i.e., that you want to use in your report or
chart) to the column on the right, using the arrow buttons in the center of the dialog.
6.
Similarly, move the data that you do not want to use to the column on the left.
ADDITIONAL INFORMATION: Please note that, if all data is moved to the left hand side, no
filtering of this parameter will take place, i.e., all data will be used in the report or chart.
7.
Version 3.2
Click on OK.
33 of 117
User Manual
www.licensetracker.ca
© License Tracker Inc.
EXAMPLE:
Figure 9:
The Filter Parameter Dialog
User Manual
34 of 117
Version 3.2
www.licensetracker.ca
© License Tracker Inc.
Figure 10: Refining Data in a Report Dialog
Date Range for Reports and Charts
What is the Date Range for a Report or Chart?
Only few report dialogs allow you to specify a date range in the text fields labelled Start Date
and End Date directly in the report dialog. They are the:
•
“Concurrent Use Report” on page 48
•
“Summary Invoice Report” on page 68
•
“Detailed Invoice Report” on page 70
Most other reports allow you to set the date range by selecting Filter > Set Filter... and editing
the Select the Filter Parameters dialog.
How to set the Date Range for a Report
When you first open one of these report dialogs, there is a time interval already specified in
these fields that originates from one of the following sources.
Version 3.2
35 of 117
User Manual
www.licensetracker.ca
© License Tracker Inc.
•
The date range specified in the Select the Filter Parameters dialog, accessed under Filter
> Set Filter..., that was activated with a check mark beside Use Filter.
•
If Use Filter was not activated with a check mark, the time interval is taken from the data
range defined in your content scope.
TASK
1.
To further limit the time interval displayed in your report, fill in the fields for Start Date
and End Date, using one of the following procedures.
a
Double-click on the text field values and type in new ones using the format
YYYY-MM-DD (year-month-day), or
b
Open the calendar by clicking the square button beside the text field. Select the year
and month from small pull-down menus and then click on the actual calendar day.
Close the calendar by clicking the square button, in the upper right corner. The new
date displays automatically in the field.
ADDITIONAL INFORMATION: If the calendar is shadowed and is not accessible, then you
have selected a date when no data exists in your License Tracker database. At this
point, you must choose another date when data exists, or import more data to cover
the time you need for the report.
EXAMPLE:
Figure 11: Setting a Report Time Span
User Manual
36 of 117
Version 3.2
www.licensetracker.ca
© License Tracker Inc.
Database Summary Reports
The License Tracker reports that display a summary of database information include:
Database Information
Describes the data for your current content scope.
Data Sources
Describes the data used to create your License Tracker database.
Users
The users listed in your License Tracker database.
Feature Model
The feature model for your License Tracker database.
License Model
The licenses model for your License Tracker database.
Feature Use Summary
A summary of usage of the licenses listed in your License Tracker database.
Groups
Displays the total license usage by a group.
Budget
Displays the monthly fees that define your annual-license budget.
For all of these reports, you simply click on the menu item and License Tracker immediately
displays the resulting data in table format.
Database Information Report
What is the Database Information Report?
The Database Information report contains three tables that describe what database you are
connected to, what content scope you have selected (and its characteristics), and some statistics
about the data in database conforming to your content scope.
Version 3.2
37 of 117
User Manual
www.licensetracker.ca
© License Tracker Inc.
How to Generate a Database Information Report
TASK
1.
To create this report, click on Reports > Database Information.
RESULT:
A table appears with information under the following headings:
Database Information
Location
Display details of the current database including type, ID logged in, and either full path
to file (for File databases) or database name, server and port (for Server databases).
Scope
Name
The name of the current content scope.
License Model
The name of the license model associated with this content scope.
Budget Model
The name of the budget model associated with this content scope.
Features
A list of vendor names used to restrict features in this content scope.
Users
A list of user attributes used to restrict users in this content scope.
Session Statistics
Displays information about the sessions in the database conforming to your selected
content scope.
Date Range
The start date of the first session and the end date of the last session.
Duration Range (hours)
The minimum and maximum session lengths in hours.
Number of Sessions
The total number of distinct sessions.
Number of Licenses
Total number of distinct licenses.
User Manual
38 of 117
Version 3.2
www.licensetracker.ca
© License Tracker Inc.
Number of Users
The total number of distinct users.
Number of Denials
The total number of true and false license denials.
Figure 12: Database Information Report
Data Sources Report
What is the Data Sources Report?
The Data Sources report is a table that describes:
•
the table ID of the data imported,
•
the names of the datafiles imported,
•
the server,
•
vendors appearing in the data,
•
original format of the data,
•
the date the data was imported,
Version 3.2
39 of 117
User Manual
www.licensetracker.ca
© License Tracker Inc.
•
the start and end date of the sessions recorded in the data,
•
the number of sessions read from the data file, and
•
the number of sessions actually loaded in the database.
How to Generate the Data Sources Report
TASK
1.
To create this report, click on Reports > Data Sources.
RESULT:
A table appears with information under the following headings:
•
ID
•
Data File
•
Last Name
•
E-mail Address
•
Server
•
Vendor
•
Format
•
Import Date
•
Start Date
•
End Date
•
Sessions Read
•
Sessions Loaded.
Users Report
What is the Users Report?
The Users Report is a table that describes the users listed in your License Tracker database.
User Manual
40 of 117
Version 3.2
www.licensetracker.ca
© License Tracker Inc.
How to Generate the Users Report
TASK
1.
To create this report, click on Reports > Users.
RESULT:
A table appears displaying the content of the User Model (see “User Model” on page 16) for
the users conforming to your selected content scope.
NOTE:
The initial view of the report may be expanded by selecting parameters in the Group By
widget and clicking on the + sign in front of the selected group parameters.
Figure 13: Users Report: Initial view
Figure 14: Users Report: Expanded view
Version 3.2
41 of 117
User Manual
www.licensetracker.ca
© License Tracker Inc.
Feature Model Report
What is the Feature Model Report?
The Feature Report is a table that describes the features listed in your License Tracker database.
How to Generate the Feature Model Report
TASK
1.
To create this report, click on Reports > Feature Model.
RESULT:
A table appears displaying the content of the Feature Model (see “Feature Model” on page 17)
for the features conforming to your selected content scope.
NOTE:
The initial view of the report may be expanded by selecting parameters in the Group By
widget and clicking on the + sign in front of the selected group parameters.
Figure 15: Feature Model Report
License Model Report
What is the License Model Report?
The License Model Report is a table that displays the number and costs of licenses for the
license model associated with the current content scope.
User Manual
42 of 117
Version 3.2
www.licensetracker.ca
© License Tracker Inc.
How to Generate the License Model Report
TASK
1.
To create this report, click on Reports > License Model.
RESULT:
A table appears displaying the content of the License Model (see “License Models” on page 19)
associated with your selected content scope.
NOTE:
The initial view of the report may be expanded by selecting parameters in the Group By
widget and clicking on the + sign in front of the selected group parameters.
Figure 16: License Model Report
Feature Use Summary Report
What is the Feature Use Summary Report?
The Feature Use Summary report is a table that shows usage statistics for the features
conforming to your content scope.
Version 3.2
43 of 117
User Manual
www.licensetracker.ca
© License Tracker Inc.
How to Generate the Feature Use Summary Report
TASK
1.
To create this report, click on Reports > Feature Use Summary.
2.
Click Filter to open the Select the Filter Parameters dialog, review your values or set new
ones and activate the Use Filter button with a check mark.
ADDITIONAL INFORMATION: The Filter button should have a check mark in it when you want
to use the parameters from the Select the Filter Parameters dialog, and should be empty
when you do not want any data filtering. For more information about setting parameters
in this dialog, go to “Filter Parameters for Reports and Charts” on page 32.
3.
Define a time interval in the Start Date and End Date text fields using the procedures
described under the heading “Date Range for Reports and Charts” on page 35.
4.
Select one or more license names from the list.
ADDITIONAL INFORMATION: License Tracker informs you when you select a license that was
not used during the specified time range.
5.
Click OK to produce the Feature Use Summary report.
RESULT:
A table appears with information under the following headings:
Vendor
The name of the Vendor associated with the feature.
Feature Name
Lists individual feature names as they appear in the log files.
Count
Lists the number of purchased licenses.
Peak Use
Maximum number of licenses concurrently in use for this feature, over the time span
specified in your Select the parameters for a filter dialog.
Effective Peak
Shows the maximum number of licenses concurrently in use when rounding down peak
values as specified by the effective peak threshold parameter in the user preferences.
Users
The number of distinct users of this feature.
User Manual
44 of 117
Version 3.2
www.licensetracker.ca
© License Tracker Inc.
Users/Peak Use
The average number of users per license.
Denials
The number of denials for each feature.
Rental Cost
The total cost of all rentals for each feature.
NOTE:
The initial view of the report may be expanded by selecting parameters in the Group By
widget and clicking on the + sign in front of the selected group parameters.
Figure 17: Feature Use Summary Report
Groups Report
What is the Groups Report?
The groups report displays a listing of the number of members of each group in the License
Tracker database where a group is defined by a combination of a user category (group types)
and attributes (specific group names) within the categories.
Version 3.2
45 of 117
User Manual
www.licensetracker.ca
© License Tracker Inc.
How to Generate the Groups Report
TASK
1.
To create this report, click on Reports > Groups to display a table of information under
the following headings:
RESULT:
A table appears with information under the following headings:
Category
Lists the various categories used to define user groups. This name could also define a
region or a department within a company.
Attribute
Lists the various group names associated with each category.
Number of Users
Lists the total number of users within a group.
NOTE:
The initial view of the report may be expanded by selecting parameters in the Group By
widget and clicking on the + sign in front of the selected group parameters.
Figure 18: Groups Report
User Manual
46 of 117
Version 3.2
www.licensetracker.ca
© License Tracker Inc.
Budget Report
What is the Budget Report?
The budget report is a table that displays the monthly planned rental expenditures as defined
in the budget model associated with the current content scope.
How to Generate the Budget Report
TASK
1.
To create this report, click on Reports > Budget.
RESULT:
A table appears displaying the content of the budget model associated with the selected content
scope.
NOTE:
The initial view of the report may be expanded by selecting parameters in the Group By
widget and clicking on the + sign in front of the selected group parameters.
Figure 19: Budget Report
General Usage Reports
The License Tracker reports that display general license usage include:
Version 3.2
47 of 117
User Manual
www.licensetracker.ca
© License Tracker Inc.
Concurrent Use Report
Identifies which users were on what machines, using a specific license, during a certain
time period.
Tabular Report
Displays a spreadsheet defined by X and Y axes where you determine the data headings
and also choose the information to display within the table.
Denial Detailed Report
Displays license availability and identifies which users were refused access to a specific
license, on what date(s).
Denial Summary Report
Summarizes the number of denials for specific users and for specific licenses in two
distinct tables.
Long Session Report
Displays information about the long-term usage of a license, by distinct users.
For the menu items Denial Detailed and the Denial Summary, you simply click on the menu
item and License Tracker immediately displays the resulting data in table format.
For the menu items Concurrent Use..., Tabular..., and Long Sessions..., License Tracker
requires that you fill in a dialog before producing the report in table format.
Concurrent Use Report
This section describes the concurrent use report and how to generate it.
What is the Concurrent Use Report?
The concurrent use report is a table that identifies which users were on what machines, using
a specific feature, during a certain time period.
How to Generate the Concurrent Use Report
To create this License Tracker report:
TASK
1.
User Manual
Click Reports > Concurrent Use... to open a report dialog.
48 of 117
Version 3.2
www.licensetracker.ca
© License Tracker Inc.
2.
Click Filter to open the Select the Filter Parameters dialog, review your values or set new
ones and activate the Use Filter button with a check mark.
ADDITIONAL INFORMATION: The Filter button should have a check mark in it when you want
to use the parameters from the Set the Filter Parameters dialog, and should be empty
when you do not want any data filtering. For more information about setting parameters
in this dialog, go to “Filter Parameters for Reports and Charts” on page 32.
3.
Define a time interval in the Start Date and End Date text fields using the procedures
described under the heading “Date Range for Reports and Charts” on page 35.
4.
Select one feature name from the list.
ADDITIONAL INFORMATION: License Tracker informs you when you select a license that was
not used during the specified time range.
5.
Click OK to produce the Concurrent Use Report.
RESULT:
A table appears with information under the following headings:
Date
Lists specific dates and times at which the number of concurrent users for the specified
feature changed.
Numbered columns
The column numbers indicate the number of users accessing the same feature at the same
time. The items identify the user name and the host at the time.
NOTE:
The initial view of the report may be expanded by selecting parameters in the Group By
widget and clicking on the + sign in front of the selected group parameters.
Version 3.2
49 of 117
User Manual
www.licensetracker.ca
© License Tracker Inc.
Figure 20: Concurrent Use Report
Tabular Report
This section describes the tabular report and how to generate it.
What is the Tabular Report?
The tabular report displays a spreadsheet defined by X and Y axes where you determine the
data headings and also choose the information to display within the table.
How to Generate the Tabular Report
To create this report:
TASK
1.
Click Reports > Tabular... to open the Tabular Report dialog.
2.
Click Filter to open the Select the Filter Parameters dialog, review your values or set new
ones and activate the Use Filter button with a check mark.
ADDITIONAL INFORMATION: The Filter button should have a check mark in it when you want
to use the parameters from the Set the Filter Parameters dialog, and should be empty
when you do not want any data filtering. For more information about setting parameters
in this dialog, go to “Filter Parameters for Reports and Charts” on page 32.
3.
User Manual
Click OK to return to the Tabular Report dialog.
50 of 117
Version 3.2
www.licensetracker.ca
© License Tracker Inc.
4.
Specify the Horizontal Axis.
ADDITIONAL INFORMATION: In the report, this field appears as column headings across the
top of the report. To identify a heading, click the button beside the text field to display a
pull-down menu and select one option. Typically, a time value is selected for the
horizontal axis (days, months, or years).
5.
Specify the Vertical Axis.
ADDITIONAL INFORMATION: In the report, this field appears as row headings down the left
side of the report. To identify a heading, click the button beside the text field to display a
pull-down menu and select one option. Typically, a database feature is selected for the
vertical axis (i.e., feature, user, or group).
NOTE: If you selected “Group” for one of the axis, a second dropdown menu will appear
providing a list of the user categories to select from.
6.
Specify the Data for Report. In the report, this field identifies the statistics displayed
within the report. To identify your data, click the button beside the text field to display a
pull-down menu and select one of the following options:
•
•
•
•
•
•
•
7.
Total Use (hr.)- the total hours spent using a license for the specified feature or
features (actual figures, not rounded up values).
Overage (hr.)- the number of hours that a licenses were signed-out from the rental
pool (not purchased licenses).
Peak Concurrent Usage- the maximum number of distinct users that signed-out a
license at a time.
Concurrent Overage- the maximum number of signed-out licenses that exceeded
your purchased limit.
Cost- the rental costs charged to you for non-owned license use.
Unique User Count- the number of unique userIDs that signed-out a license for the
specified feature or features over the specified period.
Session Count- the number of sessions.
Click OK to generate the report.
RESULT:
A computation window opens and shows the progress of the calculation of the selected
statistics.
When the computation is complete the calculation window closes and the Tabular Report is
displayed.
NOTE:
The initial view of the report may be expanded by selecting parameters in the Group By
widget and clicking on the + sign in front of the selected group parameters.
Version 3.2
51 of 117
User Manual
www.licensetracker.ca
© License Tracker Inc.
Figure 21: Tabular Report
Denial Detailed Report
This section describes a denial detailed report and how to generate it.
What is the Denial Detailed Report?
The denial detailed report is a table that displays which users were denied access to a license for
the specified feature or features, when they were denied, and which host they were using at the
time.
How to Generate the Denial Detailed Report
TASK
1.
To create this License Tracker report, click on Reports > Denial Detailed... to open the
Denial Detailed Report dialog.
2.
Click Filter to open the Select the Filter Parameters dialog, review your values or set new
ones and activate the Use Filter button with a check mark.
ADDITIONAL INFORMATION: The Filter button should have a check mark in it when you want
to use the parameters from the Set the Filter Parameters dialog, and should be empty
when you do not want any data filtering. For more information about setting parameters
in this dialog, go to “Filter Parameters for Reports and Charts” on page 32.
3.
User Manual
Click OK to return to the Denial Detailed Report parameters dialog.
52 of 117
Version 3.2
www.licensetracker.ca
© License Tracker Inc.
4.
Select the date range of the report.
ADDITIONAL INFORMATION: For more information about setting a date range, go to “Date
Range for Reports and Charts” on page 35.
5.
Select the license(s) you want to include in the report.
6.
Click OK to generate the Denial Detailed Report.
RESULT:
A table appears with information under the following headings:
User Name
The computer login name (userID) of the user who was denied access to a license.
Feature Name
Name of the feature that could not be accessed by a user.
Host
The name of the user's computer.
Date
The date and time a user was denied access to a license.
True Denial
Whether or not the denial was a true denial or for some other reason.
Reason
Displays the reason why access to a license was denied to a user. For example, the
license-accessed limits were reached, the server was down, or the user did not have
permission that particular license.
NOTE:
These explanations come from the log files. They are not generated by License
Tracker. They may be clear or hard to understand, depending on the license software
generating the logs.
NOTE:
The initial view of the report may be expanded by selecting parameters in the Group By
widget and clicking on the + sign in front of the selected group parameters.
Version 3.2
53 of 117
User Manual
www.licensetracker.ca
© License Tracker Inc.
Figure 22: Denial Detailed Report
Denial Summary Report
This section describes the denial summary report and how to generate it.
What is the Denial Summary Report?
The denial summary report summarizes the number of denials for specific users and for
specific features in two distinct tables within the same window.
NOTE: This report is limited to the filters you applied in the Set the Filter Parameter dialog. To
review those parameters, click on Filter > Set Filter to open the filter dialog and review your
parameters. Filters are activated when the Use Filter button has a check mark in it.
How to Generate the Denial Summary Report
TASK
1.
To create these two reports, click Reports > Denial Summary Report... to open the
Denial Summary Report Parameters dialog.
2.
Click Filter to open the Set the Filter Parameters dialog, review your values or set new
ones and activate the Use Filter button with a check mark. The Filter button should have
a check mark in it when you want to use the parameters from the Set the Filter
Parameters dialog, and should be empty when you do not want any data filtering. For
User Manual
54 of 117
Version 3.2
www.licensetracker.ca
© License Tracker Inc.
more information about setting parameters in this dialog, go to “Filter Parameters for
Reports and Charts” on page 32.
3.
Define a time interval in the Start Date and End Date text fields using the procedures
described under the heading “Date Range for Reports and Charts” on page 35.
4.
Select one or more license names from the list.
ADDITIONAL INFORMATION: License Tracker informs you when you select a license that was
not used during the specified time range.
5.
Click OK to produce the Denial Summary Report.
RESULT:
A table appears with two sets of information:
First set of three columns
Displays a list of user names and identifies the number of times that each user was denied
access to a license, as numbers of true denials and false denials.
Second set of three columns
Displays a list of feature names and identifies the number of times that access was denied
to each feature, as numbers of true denials and false denials.
NOTE:
The initial view of the report may be expanded by selecting parameters in the Group By
widget and clicking on the + sign in front of the selected group parameters.
Figure 23: Denial Summary Report
Version 3.2
55 of 117
User Manual
www.licensetracker.ca
© License Tracker Inc.
Long Session Report
This section describes the Long Session Report and how to generate it.
What is the Long Session Report?
The Long Session Report is a table that displays information about which users had a license
for specific features in use for longer than a specified time limit.
Normal cycles of use for a license
This refers to the productivity cycle of a license. For example, you may think that a license
requires only a few hours for proper use, and may find that most users require more time
than you originally estimated for that specific license. This affects how you purchase
licenses and allocate hours to a project/user.
Power users of a license
This refers to those people who use a software product for long periods of time because
they are the experts users or because of work load or other project requirements. These
people work more continuous hours than the average user without being abusive to the
license.
Users that abuse a license
This refers to users that monopolize a license for long periods of time, to ensure the
availability of that license for their specific needs, and in so doing, prevent other users
from gaining access to a specific feature. For example, a user that accesses the software
and stays logged in for days or weeks, would fall into this category.
How to Generate the Long Session Report
To create this report:
TASK
1.
Click on Reports > Long Sessions... to open a Long Sessions Report parameter dialog.
2.
Click Filter to open the Set the Filter Parameters dialog, review your values or set new
ones and activate the Use Filter button with a check mark. The Filter button should have
a check mark in it when you want to use the parameters from the Set the Filter
Parameters dialog, and should be empty when you do not want any data filtering. For
more information about setting parameters in this dialog, go to “Filter Parameters for
Reports and Charts” on page 32. Click OK to close the Set the Filters Parameter dialog
and return to the Long Sessions Report dialog.
User Manual
56 of 117
Version 3.2
www.licensetracker.ca
© License Tracker Inc.
3.
Select Users and Licenses. These windows list the computer UserIDs and licenses
available in your License Tracker database. In each window, use your mouse with the
SHIFT or CONTROL keys to select individual items or click Select All to highlight the
entire window.
4.
Enter the Minimum session duration (hours). Double-click in the text field and enter a
number that acts as a marker; any session lengths greater than this number are displayed
in your report.
5.
Click OK to immediate produce the Long Sessions Report.
RESULT:
The Long Session report contains information under the following headings:
Feature
Lists the selected features, in alphabetical order.
User
Lists the userIDs associated with the long sessions. Items are sorted alphabetically, first
by feature name and then by userID.
Start Date
Identifies the start date and time that a specified user accessed a license for the specified
feature. These values are first arranged alphabetically by feature and then by user.
End Date
Identifies the end date and time that a specified user returned the license. These values are
arranged chronologically, first by feature and then by user.
Duration (Hours)
The total hours of consecutive time accumulated on a license, by a user, in a single login
session that exceeds the indicated minimum time (Minimum Session Duration). These
hours represent the time elapsed between the Start Date and the End Date.
Resulting Denials
The total number of times access to a license for a particular feature was denied to any
userID during the session defined by the Start Date and End Date.
NOTE:
The initial view of the report may be expanded by selecting parameters in the Group By
widget and clicking on the + sign in front of the selected group parameters.
Version 3.2
57 of 117
User Manual
www.licensetracker.ca
© License Tracker Inc.
Figure 24: Long Session Report
Financial Reports
The License Tracker reports that display financial information about license usage include:
•
Group Splits Report - displays the break-down of license usage by a group.
•
Summary Invoice Report - summarizes the number of rental license(s) and indicates the
total cost per license over a specified time period (pay-per-use data).
•
Detailed Invoice Report - displays detailed information about license usage over time.
•
License Model Efficiency Report - displays peak license usage and cost consequences.
For the Group Splits Report and the License Model Efficiency Report, you simply click on the
menu item and License Tracker immediately displays the resulting data in table format.
For the menu items Summary Invoice Report and Detailed Invoice Report, License Tracker
requires that you fill in a dialog before producing the report in table format.
NOTE:
Financial reports ignore any user specifications in the Set the Filter Parameter dialog, as
all users must be considered for accurate calculations.
Group Splits Report
This section describes the Group Splits Report and how to generate it.
User Manual
58 of 117
Version 3.2
www.licensetracker.ca
© License Tracker Inc.
What is a Group Splits Report?
The Group Splits Report is a table that displays the break-down of software usage between
selected groups in a specific user category. The feature and group names are determined by you
and selected in the Set Filter Parameters dialog accessed under Filter > Set Filter....
Many of the calculations in the group split reports are based on the concept of the value of a
software feature.
The total value or cost of a software license is also computed from the license model. This
number, under the “Value" heading in the report, is
•
the total maintenance cost + rental costs
•
over the period of the report.
The value each group has consumed for each license is computed as; V = Value * (group time)
/ (total time).
There are four types of Group Split Reports.
Summary Report
The Summary Report provides the percentage breakdown of software usage between the
specified groups (each displayed as a unique row in the table) for four different
calculation methods (each displayed with a column in the table). The calculation methods
are:
•
Total Use: the percentage of the total time for all selected features.
•
Hours: the percentage of the total time weighted by the value of each feature.
•
User Count: the percentage of number of unique users of each feature weighted by
the value of the features.
•
Peak: the maximum number of concurrent users in the group for each feature
weighted by the value of the features.
The numbers in each cell of the table are calculated by considering the value the group
has consumed for each feature, where
•
For Hours, V=Value* (GroupTime / TotalTime)
•
For User Count, V=Value* (GroupUsers / TotalUsers)
•
For Peak, V=Value* (GroupPeak / TotalPeak)
The total value each group consumed for all licenses is the sum of the value consumed for
each license. (TGV).
Version 3.2
59 of 117
User Manual
www.licensetracker.ca
© License Tracker Inc.
Adding all the values for all groups and all licenses gives the total value consumed by the
organization (TV).
The percent of value used by each group is the TGV / TV * 100.
Other Reports
The other three Group Splits reports provide the detailed data behind the calculations in
the Summary Report. These reports have a common format with columns:
•
Product - the name of the feature
•
Value - the value for the product, calculated as described above
•
Group1...Groupn - a column for each group containing that group’s metric for that
feature (Hours - time in seconds; UserCount - number of distinct users; Peak - the
maximum number of concurrent users of that feature in the group)
•
Total - the sum of the Groupx columns
Each cell under the group name headings represents the number of active users in that
group for that license.
The numbers under the “Value" heading are the same as they are in the Time Splits
Report and are calculated in the same way.
How to Generate a Group Splits Report
To create this report:
TASK
1.
Click Reports > Group Splits.
2.
Select one of the options:
•
•
•
•
Summary
Time Splits
User Splits
Peak Splits
3.
Select the groups you want to include in the report from the Group Selector dialog, and
click OK.
4.
Click Filter to open the Set the Filter Parameters dialog, review your values or set new
ones and activate the Use Filter button with a check mark. The Filter button should have
a check mark in it when you want to use the parameters from the Set the Filter
Parameters dialog, and should be empty when you do not want any data filtering. For
more information about setting parameters in this dialog, go to “Filter Parameters for
User Manual
60 of 117
Version 3.2
www.licensetracker.ca
© License Tracker Inc.
Reports and Charts” on page 32. Click OK to close the Set the Filter Parameters dialog
and return to the Group Selector dialog.
5.
Click OK to produce the report.
RESULT:
A computation window appears on your screen. It displays the progress of the calculations for
the report.
When the calculation is complete the computation window disappears and the report is
displayed.
The four different types of Group Splits Reports are shown below:
NOTE:
The initial view of a report may be expanded by selecting parameters in the Group By
widget and clicking on the + sign in front of the selected group parameters.
NOTE:
The Peak Concurrent User Count cost splitting method is based on the average of the
twenty highest daily peaks during the period. This ensures that a single day aberration does not
result in an excessive share of the costs for a single group (or project).
Figure 25: Group Splits Report (Summary)
Version 3.2
61 of 117
User Manual
www.licensetracker.ca
© License Tracker Inc.
Figure 26: Group Splits Report (Time Method
Figure 27: Group Splits Report (User Method)
User Manual
62 of 117
Version 3.2
www.licensetracker.ca
© License Tracker Inc.
Figure 28: Group Splits Report (Peak Method)
Project Splits Report
This section describes the Project Splits Report and how to generate it.
What is a project splits report?
The Project Splits Report displays information about selected projects in a specific category,
including the project name, the features used, number of users etc. The feature and user are
determined by your content spcope, and these can be refined by using a filter. Selection of
project filters is done in the Set Filter Parameters pop up dialog, accessed under Filter > Set
Filter …
Many of the calculations in the project splits report are based on the concept of a software
feature.
The value each project has consumed for each license is computed as V = Value * (Project
Time) / (Total Time).
There are four types of Project Split Report.
Summary Report
The Summary Report provides the percentage breakdown of software usage between the
specified projects (each displayed as a unique row in the table) for four different calculation
methods (each displayed by a column in the table). The calculation methods are:
Version 3.2
63 of 117
User Manual
www.licensetracker.ca
© License Tracker Inc.
Total Use:
the percentage of the total time for all selected features
Hours:
The percentage of the total time weighted by the value of each feature
User Count:
The percentage of numbers of unique users of each feature weighted by the value of the
features
Peak:
The maximum number of concurrent users in the project for each feature weighted by the
value of the features.
The numbers in each cell of the table are calculated by considering the value the project has
consumed for each feature, where:
•
For Hours, V = Value * (ProjectTime / TotalTime)
•
For User count, V = Value * (ProjectUsers / TotalUsers)
•
For Peak, V = Value * (ProjectPeack / TotalPeak)
The total value of each project for all licenses is the sum of the value consumed for each license
. This is called the Total Project Value (TPV).
Adding all the values for all projects and all licenses gives the total value consumed by the
organization. This is called the Total Value (TV).
The percent of value used by each project is the number: TPV / TV * 100.
Other Reports
The other three Project Splits reports provide the detailed data behind the calculations in the
Summary Report. These reports have a common format with columns:
Product:
the name of the feature
Value:
the value for the product, calculated as described above
Project1...Projectn:
a column for each project containing that project’s metric for that feature (Hours - time
in seconds
User Manual
64 of 117
Version 3.2
www.licensetracker.ca
© License Tracker Inc.
UserCount:
number of distinct users; Peak - the maximum number of concurrent users of that feature
in the project)
Total:
the sum of the Project columns
Each cell under the project name headings represents the number of active users in that project
for that license.
The numbers under the “Value" heading are the same as they are in the Summary Report and
are calculated in the same way. Refer to the Summary Report section for details.
How to Generate a Project Splits Report
To create this report:
TASK
1.
Click Reports > Project Splits.
2.
Select one of the options:
ADDITIONAL INFORMATION: Summary
•
Time Splits
•
User Splits
•
Peak Splits
3.
Select the Projects you want to include in the report from the Group Selector dialog, and
click OK.
4.
Click Filter to open the Set the Filter Parameters dialog, review your values or set new
ones and activate the Use Filter button with a check mark. The Filter button should have
a check mark in it when you want to use the parameters from the Set the Filter
Parameters dialog, and should be empty when you do not want any data filtering. For
more information about setting parameters in this dialog, go to “Filter Parameters for
Version 3.2
65 of 117
User Manual
www.licensetracker.ca
© License Tracker Inc.
Reports and Charts” on page 32. Click OK to close the Set the Filter Parameters dialog
and return to the Project Selector dialog.
5.
Click OK to produce the report.
RESULT: A computation window appears on your screen. It displays the progress of the
calculations for the report. When the calculation is complete the computation window
disappears and the report is displayed.
EXAMPLE:
The four different types of Project Splits Reports are shown below:
NOTE:
The initial view of a report may be expanded by selecting parameters in the Project By
widget and clicking on the + sign in front of the selected project parameters.
NOTE:
The Peak Concurrent User Count cost splitting method is based on the average of the
twenty highest daily peaks during the period. This ensures that a single day aberration does not
result in an excessive share of the costs for a single group (or project).
User Manual
66 of 117
Version 3.2
www.licensetracker.ca
© License Tracker Inc.
Figure 29: Project Splits Report (Summary)
Figure 30: Project Splits Report (Time Method)
Version 3.2
67 of 117
User Manual
www.licensetracker.ca
© License Tracker Inc.
Figure 31: Project Splits Report (User Method)
Figure 32: Project Splits Report (Peak Method)
Summary Invoice Report
This section describes the Summary Invoice Report and how to generate it.
User Manual
68 of 117
Version 3.2
www.licensetracker.ca
© License Tracker Inc.
What is the Summary Invoice Report?
The Summary Invoice Report is a table that summarizes the number of rental license(s)
(annual, monthly and hourly) and indicates the total cost for each selected feature over a
specified time period (pay-per-use data).
How to Generate the Summary Invoice Report
TASK
1.
Click Reports > Summary Invoice... to open a report dialog.
2.
Click Filter to open the Set the Filter Parameters dialog, review your values or set new
ones and activate the Use Filter button with a check mark. The Use Filter button should
have a check mark in it when you want to use the parameters from the Set the Filter
Parameters dialog, and should be empty when you do not want any data filtering. For
more information about setting parameters in this dialog, go to “Filter Parameters for
Reports and Charts” on page 32.
3.
Define a time interval in the Start Date and End Date text fields using the procedures
described under the heading “Date Range for Reports and Charts” on page 35.
4.
Identify the license name(s) that you want to display, and use to calculate statistics, in the
report.
ADDITIONAL INFORMATION: You can select more than one name in the list. Use the SHIFT or
CONTROL keys to select individual license names or press the Select All button to use
all license names in your report.
5.
Click OK.
RESULT:
The Summary Invoice Report appears with information under the following headings:
Feature
Lists the selected rental feature name(s).
Annual Rentals
Identifies the number of annual license rentals for this feature in the period.
Monthly Rentals
Identifies the number of monthly license rentals for this feature in the period.
Daily Rentals
Identifies the number of daily license rentals for this feature in the period.
Version 3.2
69 of 117
User Manual
www.licensetracker.ca
© License Tracker Inc.
Hourly Rentals
Identifies the number of hourly license rentals for this feature in the period.
Cost
The amount of money due for license rentals for this feature. This is the sum of the
products of the number of rentals from the other columns multiplied by the rental rates
as specified in the License Model.
NOTE:
The initial view of the report may be expanded by selecting parameters in the Group By
widget and clicking on the + sign in front of the selected group parameters.
Figure 33: Summary Invoice Report
Detailed Invoice Report
This section describes the Detailed Invoice Report and how to generate it.
What is the Detailed Invoice Report?
The Detailed Invoice Report is a table that displays detailed information about rented license
usage over time. The report displays the periods when rental licenses were used. Note that this
tracking tracks concurrent use levels and not specific sessions so that a single user session may
start with a rented license (because all owned licenses were in use at the time of checkout) but
complete with an owned license (if other users’ sessions ended earlier dropping the concurrent
use level below the number of owned licenses.
It displays information under the following headings:
User Manual
70 of 117
Version 3.2
www.licensetracker.ca
© License Tracker Inc.
Feature
The feature name(s) that this rented level interval measures.
Start Date
The date and time at which this rented license interval started; this is the time that a new
user session of this feature began requiring a rented license.
End Date
The date and time at which a user logged out, causing the concurrent use level for the
feature to drop below the specified level for this interval.
Overlap (Hrs)
The number of hours between the Start Date and End Date.
Concurrent Count
The rented license number (for example, if four licenses for the feature were owned and
the session which started at Start Date raised the concurrent use count to six, then this
interval would be for rented license #2).
How to Generate the Detailed Invoice Report
To create this report:
TASK
1.
Click Reports > Detailed Invoice... to open the Invoice Detail Report dialog.
2.
Click Filter to open the Set the Filter Parameters dialog, review your values or set new
ones and activate the Use Filter button with a check mark. The Filter button should have
a check mark in it when you want to use the parameters from the Set the Filter
Parameters dialog, and should be empty when you do not want any data filtering. For
more information about setting parameters in this dialog, go to “Filter Parameters for
Reports and Charts” on page 32.
3.
Define a time interval in the Start Date and End Date text fields using the procedures
described under the heading “Date Range for Reports and Charts” on page 35.
4.
Identify the license name(s) that you want to display and use to calculate statistics in the
report. You can select more than one name in the list.
ADDITIONAL INFORMATION: Use the SHIFT or CONTROL keys to select individual license
names or press the Select All button to use all license names in your report.
5.
Click OK.
RESULT:
Version 3.2
71 of 117
User Manual
www.licensetracker.ca
© License Tracker Inc.
The Detailed Invoice Report appears.
NOTE:
The initial view of the report may be expanded by selecting parameters in the Group By
widget and clicking on the + sign in front of the selected group parameters.
Figure 34: Detailed Invoice Report
License Model Efficiency Report
This section describes the License Model Efficiency Report and how to generate it.
What is the License Model Efficiency Report?
The License Model Efficiency Report is a table that displays peak license usage and cost
consequences. The report shows features with unused licenses at the top and features where
demand exceeded owned licenses levels at the bottom. The report is sorted based on a
calculation of license use called Value, where items of the same value are ordered based on the
number of denials.
It displays information under the following headings:
Feature Name
The name of an individual feature (that is, the application name).
License Count
The number of purchased licenses.
NOTE:
User Manual
When zero is in this column, all licenses of this feature are rented (none are owned).
72 of 117
Version 3.2
www.licensetracker.ca
© License Tracker Inc.
Peak Usage
The maximum number of licenses used, for each feature, over the time span specified in
your Select the parameters for a filter dialog (under Filter > Set Filter...).
Peak Usage - License Count
The number of licenses where usage exceeded the purchased limits and the cost of the
license became a rental classification.
Denials
The number of requests that were denied to users because the existing licenses where
already checked out.
Value
License overage multiplied by average license cost from License Model.
A negative number indicates that a license is under used and that you own more licenses
than you are using in the specified date range.
A positive number indicates that a license is overused (requiring rentals) and that you
require more licenses to accommodate the usage demands in the specified date range.
Value is important for analyzing license usage cycles over time.
Monthly Rentals
Refers to the number of monthly rentals for this feature in the period.
Hourly Rentals
Refers to the number of hourly rentals for this feature in the period.
Total Cost
Sum of all rental costs for this feature in the period.
How to Generate the License Model Efficiency Report
TASK
1.
To create this report in License Tracker, click on Reports > License Model Efficiency.
2.
Click Filter to open the Set the Filter Parameters dialog, review your values or set new
ones and activate the Use Filter button with a check mark. The Filter button should have
a check mark in it when you want to use the parameters from the Set the Filter Parameters
dialog, and should be empty when you do not want any data filtering. For more
information about setting parameters in this dialog, go to “Filter Parameters for Reports
and Charts” on page 32. Click OK to return to the Feature Efficiency Report dialog.
Version 3.2
73 of 117
User Manual
www.licensetracker.ca
© License Tracker Inc.
3.
Define a time interval in the Start Date and End Date text fields using the procedures
described under the heading “Date Range for Reports and Charts” on page 35.
4.
Identify the license name(s) that you want to display and use to calculate statistics in the
report. You can select more than one name in the list.
ADDITIONAL INFORMATION: Use the SHIFT or CONTROL keys to select individual license
names or press the Select All button to use all license names in your report.
5.
Click OK.
RESULT:
A computation window opens to show the progress of the calculations. When the calculations
are complete the License Model Efficiency Report appears.
NOTE:
The initial view of the report may be expanded by selecting parameters in the Group By
widget and clicking on the + sign in front of the selected group parameters.
Figure 35: License Model Efficiency Report
User Manual
74 of 117
Version 3.2
www.licensetracker.ca
© License Tracker Inc.
Producing License Tracker Charts
This section guides you through the procedures that create and display pie and bar charts in
License Tracker.
PREREQUISITE:: This section assumes that you already understand the fundamental concepts of
License Tracker. If you are not familiar with License Tracker then go to “Fundamental
Concepts” on page 12.
About Charts
This section contains information that help you identify the various License Tracker charts and
procedures for setting general chart parameters.
The Charts Menu
License Tracker charts are listed under the Charts menu. They are:
User Chart
Displays user names and the hours of feature usage over a specified time span.
Features Chart
Displays feature names and one of three usage metrics (hours, number of distinct users,
maximum concurrent users) over a specified time span.
Feature Usage Level Chart
Displays the total number of hours of usage for each of the licenses of a selected feature
over a specified time span.
Feature Average Week Chart
Displays the average concurrent user levels for a specified feature over a specified time
span.
Concurrent Use Chart
Displays the usage over time for a single feature in terms of number of concurrent users.
Concurrent Use Analysis
Displays an analysis over time for a single feature
Change in Usage
Displays the change in usage over time for a single feature in terms of total time.
Version 3.2
75 of 117
User Manual
www.licensetracker.ca
© License Tracker Inc.
Session Chart
Displays each session (start and end times) for a single feature over a specified time span.
Session Length Chart
Displays a histogram depicting the lengths of all sessions for a single feature over a
specified time span.
Group Use Chart
Displays how many members of a specific group (sharing the same attribute for a user
category) make use of specified features over a specified time span.
Denial Density Chart
Displays the number of denials per specified time unit (1 hour, 3 hours, 1/2 day, etc.) that
occurred for a single feature over time.
Feature Unavailability Chart
Displays when all owned licenses for a single feature were in use. This shows times when
denials would have happened.
Pay-per-Use (PPU) Summary Chart
Displays an assessment of pay-per-use expenditures (rentals) comparing what was
budgeted versus what was actually spent over a specified time span. Both monthly and
cumulative views are provided.
User Manual
76 of 117
Version 3.2
www.licensetracker.ca
© License Tracker Inc.
Figure 36: Charts Menu
Setting Filter Parameters for Charts
What are Filter Parameters for Charts?
Chart filters allow you to specify the data that will appear in a chart.
How to set Filter Parameters for Charts
In License Tracker, there are two dialogs that allows you to refine the data that you display in a
chart.
Version 3.2
77 of 117
User Manual
www.licensetracker.ca
© License Tracker Inc.
TASK
1.
Set data filters in the Set the Filter Parameters dialog and then click the Use Filter button
to activate them with a check mark.
ADDITIONAL INFORMATION: To deactivate the filters, simply click on the button again, to
remove the check mark and License Tracker will use all of the data in your database. For
more information, go to “Filter Parameters for Reports and Charts” on page 32.
There are two ways to access this dialog:
a
Click Admin > Set Filter... ,or
b
Press the Filter button in any chart dialog.
Figure 37: Specifying Filters in the Set Filter Parameters Dialog
User Manual
78 of 117
Version 3.2
www.licensetracker.ca
© License Tracker Inc.
2.
You can indicate additional sorting parameters to further refine and organize your data
in each chart dialog. Different chart dialogs offer different parameters under the
following categories:
•
•
•
Data Parameters - user names, license names, or group names, depending on the
chart
Usage Parameters - high values, low values or all values
Time Parameters - time range. See See “Date Range for Reports and Charts” on
page 35..
Figure 38: Specifying Filters in the Chart Dialog
Setting the Date Range for Charts
What is the Date Range for Charts?
All chart dialogs allow you to specify a date range in the text fields labelled Start Date and End
Date.
How to set the Date Range for Charts
When you first open a chart dialog, there is a time interval already specified in Start Date and
End Date fields. These dates are set by:
Version 3.2
79 of 117
User Manual
www.licensetracker.ca
© License Tracker Inc.
•
The date range specified in the Set Filter Parameters dialog, accessed under Filter > Set
Filter..., that was activated with a check mark beside Use Filter, or
•
if that dialog was not activated (i.e., no check mark), then from the session statistics (that
is, the log files) in your License Tracker database.
To further limit the time interval displayed in your chart, fill in the fields for Start Date and
End Date using one of the following procedures:
TASK
1.
Double-click on the text field values in Start Date and End Date and type in new ones
using the format YYYY-MM-DD (year-month-day), or
2.
Open the calendar by clicking the square button beside the text field. Then
a
b
Select the year and month from small pull-down menus and then click on the actual
calendar day.
The calendar will close automatically after you click on the day.
ADDITIONAL INFORMATION: You can close the calendar by clicking the square button
with the X, in the upper right corner.
RESULT: The new date displays automatically in the field.
ADDITIONAL INFORMATION: If the calendar is shadowed and is not accessible, then you have
selected a date when no data exists in your License Tracker database. At this point, you
must
•
choose another date when data exists, or
•
import more data to cover the time you need for the chart.
RESULT:
The Start and End Dates set by you will be used to filter the data used for this particular chart
or report.
Setting the Chart Format to Pie or Bar
What is the Format for Charts?
License Tracker allows you to choose, where applicable, between bar charts and pie charts to
best represent your dataset.
User Manual
80 of 117
Version 3.2
www.licensetracker.ca
© License Tracker Inc.
How to set the Format for Charts to Pie or Bar
To open the Preferences dialog to specify the default chart display.
TASK
1.
Click File > Preferences to open the preferences dialog.
2.
Select the tab Export and Reports.
3.
Under the heading Report Parameters, go to the item labelled Format for the License
and User Charts.
4.
Click on the arrow beside this field to open a pull-down menu.
5.
Select the option Pie or Bar.
6.
Click Apply.
RESULT:
When the Bar option is specified, all charts will be bar charts, as specified. When the Pie option
is specified, pie charts will be generated if possible (i.e., when the parameters add up to 100%),
otherwise a bar chart will be generated.
Version 3.2
81 of 117
User Manual
www.licensetracker.ca
© License Tracker Inc.
Figure 39: Specifying Bar Chart or Pie Chart Parameters
User Manual
82 of 117
Version 3.2
www.licensetracker.ca
© License Tracker Inc.
Users Chart
What is the Users Chart?
The Users Chart displays user names and the hours of feature usage over a specified time range.
License Tracker allows you to sort the user names and rank your display from the highest or
lowest values.
How to Generate the Users Chart
TASK
1.
Click Charts > Users... to open a chart dialog.
2.
Click Filter to open the Set the Filter Parameters dialog, review your values or set new
ones, and activate the Use Filter button with a check mark. The Use Filter button in the
chart dialog should have a check mark in it when you want to use the parameters from
the Set the Filter Parameters dialog, and should be empty when you do not want any
data filtering. For more information about setting parameters in this dialog, go to
“Setting Filter Parameters for Charts” on page 77.
3.
Define a time interval in the Start Date and End Date text fields using the procedures
described under the heading “Setting the Date Range for Charts” on page 79.
4.
Click the button beside Sort to display a pull-down menu and select an option for
organizing data:
•
•
•
5.
No Sort - indicates that no organizing of the data occurs.
By Name - names are arranged in alpha-numerical order.
By Value - the arrangement of names in alphanumeric order based on usage hours.
Click the button beside Limit to and display a pull-down menu where you select an
option that identifies your chart data
•
All - includes all users selected in the dialog.
•
Highest - includes users with the highest usage hours.
•
Lowest - includes the users with the lowest usage hours.
ADDITIONAL INFORMATION: This option determines which subset of the selected users are
displayed on the chart
Version 3.2
83 of 117
User Manual
www.licensetracker.ca
© License Tracker Inc.
6.
In the Users window, click on the name(s) you want in your chart using the mouse with
the SHIFT or CONTROL keys.
7.
Click OK to close the dialog.
RESULT:
Depending on which option you selected (tabular or pie), you will get one of the following
charts:
Figure 40: Users Chart (tabular)
User Manual
84 of 117
Version 3.2
www.licensetracker.ca
© License Tracker Inc.
Figure 41: Users Chart (pie)
Features Chart
What is the Features Chart?
The Features Chart displays either total usage in hours, maximum concurrent users or number
of distinct users for multiple features over a specified time period. License Tracker allows you
to sort the license names and rank your display from the highest or lowest values.
How to Generate the Features Chart
To create this chart in License Tracker:
Version 3.2
85 of 117
User Manual
www.licensetracker.ca
© License Tracker Inc.
TASK
1.
Click Charts > Features... to open a chart dialog.
2.
Click Filter to open the Set the Filter Parameters dialog, review your values or set new
ones, and activate the Use Filter button with a check mark. The Filter button in the chart
dialog should have a check mark in it when you want to use the parameters from the Set
the Filter Parameters dialog, and should be empty when you do not want any data
filtering. For more information about setting parameters in this dialog, go to “Setting
Filter Parameters for Charts” on page 77.
3.
Make a selection in the Type of Chart pull-down menu. You can choose one of:
•
•
•
Total Hours
Peak Concurrent Licenses
Unique Users
4.
Define a time interval in the Start Date and End Date text fields using the procedures in
“Setting the Date Range for Charts” on page 79.
5.
Click the button beside Sort to display a pull-down menu and select an option for
organizing data:
•
•
•
6.
No Sort - indicates that no organizing of the data occurs.
By Name - names are arranged in alpha-numerical order.
By Value - the arrangement of names in alphanumeric order based on usage hours.
Click the button beside Limit to display a pull-down menu where you select an option
that identifies your chart data:
ADDITIONAL INFORMATION: This option determines which subset of the selected features are
displayed on the chart.
•
All - includes all features selected in the dialog.
•
Highest - includes users with the highest values.
•
Lowest - includes the users with the lowest usage hours.
7.
In the Features window, select the license name(s) that you want to chart using the mouse
with the SHIFT and CONTROL keys.
8.
Click OK to close the dialog and open a computation window that calculates the
parameters and then displays the chart.
User Manual
86 of 117
Version 3.2
www.licensetracker.ca
© License Tracker Inc.
RESULT:
Figure 42: Features Chart (tabular)
Version 3.2
87 of 117
User Manual
www.licensetracker.ca
© License Tracker Inc.
Figure 43: Features Chart (pie)
License Usage Level Chart
What is the License Usage Level Chart?
The License Usage Level Chart shows the total time (on the Y axis, in hours) that there were
“N” concurrent licenses in use (the numbers on the X axis) for a particular license.
This chart can be used to determine if concurrent licenses really are needed for a particular
license. The more the Nth license is used, the more confident you can be that at least N licenses
are needed.
User Manual
88 of 117
Version 3.2
www.licensetracker.ca
© License Tracker Inc.
How to Generate the License Usage Level Chart
TASK
1.
Click Charts > License Usage Level... to open a chart dialog.
2.
Click Filter to open the Set the Filter Parameters dialog, review your values or set new
ones, and activate the Use Filter button with a check mark. The Use Filter button in the
chart dialog should have a check mark in it when you want to use the parameters from
the Set the Filter Parameters dialog, and should be empty when you do not want any
data filtering. For more information about setting parameters in this dialog, go to
“Setting Filter Parameters for Charts” on page 77.
3.
Define a time interval in the Start Date and End Date text fields using the procedures
described under the heading “Setting the Date Range for Charts” on page 79.
4.
In the Features window, click on one license name that you want to chart.
5.
Click OK to close the dialog and create the chart.
RESULT:
In the resulting chart each column identifies for each license for a feature (X axis) how many
hours it was in use (Y axis).
Figure 44: License Usage Level Chart
Version 3.2
89 of 117
User Manual
www.licensetracker.ca
© License Tracker Inc.
Feature Average Week Chart
What is the Feature Average Week Chart?
The Feature Average Week Chart shows a graph of the average concurrent users as a function
of the hour of the day and day of the week.
This graph can be used to determine if there are patterns to when this feature is used.
How to Generate the Feature Average Week Chart
To create this chart in License Tracker:
TASK
1.
Click Charts > Feature Average Week... to open a chart dialog.
2.
Click Filter to open the Set the Filter Parameters dialog, review your values or set new
ones, and activate the Use Filter button with a check mark. The Use Filter button in the
chart dialog should have a check mark in it when you want to use the parameters from
the Set the Filter Parameters dialog, and should be empty when you do not want any
data filtering. For more information about setting parameters in this dialog, go to
“Setting Filter Parameters for Charts” on page 77.
3.
Define a time interval in the Start Date and End Date text fields using the procedures
described under the heading “Setting the Date Range for Charts” on page 79.
4.
In the Features window, click on one license name that you want to chart.
5.
Click OK to close the dialog and create the chart.
RESULT:
In the resulting chart the red line shows the average number of users using a feature
concurrently throughout an average day and day of the week.
User Manual
90 of 117
Version 3.2
www.licensetracker.ca
© License Tracker Inc.
Figure 45: Feature Average Week Chart
Concurrent Use Chart
What is the Concurrent Use Chart?
The Concurrent Use Chart displays concurrent user counts for a specified feature, over a
specified time range.
How to Generate the Concurrent Use Chart
To create this chart in License Tracker:
TASK
1.
Click Charts > Concurrent Use... to open a chart dialog.
2.
Click Filter to open the Set the Filter Parameters dialog, review your values or set new
ones, and activate the Use Filter button with a check mark. The Use Filter button in the
chart dialog should have a check mark in it when you want to use the parameters from
the Set the Filter Parameters dialog, and should be empty when you do not want any
data filtering. For more information about setting parameters in this dialog, go to
“Setting Filter Parameters for Charts” on page 77.
3.
Define a time interval in the Start Date and End Date text fields using the procedures
described under the heading “Setting the Date Range for Charts” on page 79.
Version 3.2
91 of 117
User Manual
www.licensetracker.ca
© License Tracker Inc.
4.
In the Features window, click on one license name that you want to chart.
5.
Click OK to close the dialog and create the chart.
RESULT:
In the resulting chart:
•
The red line indicates the time varying concurrent user count.
•
The blue line indicates the number of licenses owned as specified in the License Model.
•
The green dots indicates the occurrence of denials.
•
The green line indicates the effective peak, determined by rounding down a certain
percentage of the actual peaks.
Figure 46: Concurrent Use Chart
Concurrent Use Analysis Chart
What is the Concurrent Use Analysis Chart?
The Concurrent Use Analysis Chart consists of two related displays: the chart that appears
initially is identical to the Concurrent Use Chart that is described in “What is the Concurrent
Use Chart?” on page 91. When you click in this chart, the second chart displays below the first
one and shows you all individual users that were connected at that particular point in time; this
chart is in effect the Sessions Chart for that moment in time, as described in “What is the
Sessions Chart?” on page 96.
User Manual
92 of 117
Version 3.2
www.licensetracker.ca
© License Tracker Inc.
How to Generate the Concurrent Use Analysis Chart
To create this chart in License Tracker:
TASK
1.
Click Charts > Concurrent Use Analysis... to open a chart dialog.
2.
Click Filter to open the Set the Filter Parameters dialog, review your values or set new
ones, and activate the Use Filter button with a check mark. The Use Filter button in the
chart dialog should have a check mark in it when you want to use the parameters from
the Set the Filter Parameters dialog, and should be empty when you do not want any
data filtering. For more information about setting parameters in this dialog, go to
“Setting Filter Parameters for Charts” on page 77.
3.
Define a time interval in the Start Date and End Date text fields using the procedures
described under the heading “Setting the Date Range for Charts” on page 79.
4.
In the Features window, click on one license name that you want to chart.
5.
Click OK to close the dialog and create the initial chart.
6.
In the initial chart, click at your point of interest.
STEP RESULT: A vertical line appears at the point where you clicked, indicating the date and
time. A second chart appears, showing all users that were connected at that
time, each with a bar indicating the extent and origin of their connection.
NOTE:
7.
A red bar indicates a long session, while a green bar indicates a short session.
Drag the vertical line in the initial chart to your next point of interest.
STEP RESULT: The display of the second chart changes to reflect the new point in time (as
well as all points in between).
RESULT:
In the resulting initial chart:
•
The red line indicates the time varying concurrent user count.
•
The blue line indicates the number of licenses owned as specified in the License Model.
•
The green dots indicates the occurrence of denials.
•
The green line indicates the effective peak, determined by rounding down a certain
percentage of the actual peaks.
In the second chart:
•
Version 3.2
The time in the heading corresponds to the location of the vertical line in the first chart.
93 of 117
User Manual
www.licensetracker.ca
© License Tracker Inc.
•
The colored bars indicate users connected at that time; the length of a bar corresponds to
the length of the session, while a red color indicates a long session, and a green color a
short session.
The two charts can be resized to accommodate larger amounts of data.
Figure 47: Concurrent Use Analysis Chart
Change In Usage Chart
What is the Change In Usage Chart?
The Change In Usage Chart displays change in total amount of usage in hours for a specified
feature, over a specified time range.
NOTE:
User Manual
All changes shown are relative to the first period shown in the chart.
94 of 117
Version 3.2
www.licensetracker.ca
© License Tracker Inc.
How to Generate the Change In Usage Chart
To create this chart in License Tracker:
TASK
1.
Click Charts > Change In Usage... to open a chart dialog.
2.
Click Filter to open the Set the Filter Parameters dialog, review your values or set new
ones, and activate the Use Filter button with a check mark. The Use Filter button in the
chart dialog should have a check mark in it when you want to use the parameters from
the Set the Filter Parameters dialog, and should be empty when you do not want any
data filtering. For more information about setting parameters in this dialog, go to
“Setting Filter Parameters for Charts” on page 77.
3.
Define a time interval in the Start Date and End Date text fields using the procedures
described under the heading “Setting the Date Range for Charts” on page 79.
4.
Select a level of detail (period of time) in the Level of Detail text field.
5.
In the Features window, select one or more license names that you want to chart.
6.
Click OK to close the dialog and create the chart.
RESULT:
In the resulting chart:
•
The baseline for each feature is determined by the usage in the first period of time (day,
week or month), and is indicated by a colored line.
•
The bars for each feature and period represent increased and decreased usage relative to
the base line.
•
The vertical axis represents hours of use.
•
The horizontal axis represents time.
Version 3.2
95 of 117
User Manual
www.licensetracker.ca
© License Tracker Inc.
Figure 48: Change In Usage Chart
Sessions Chart
What is the Sessions Chart?
The Sessions Chart displays the monthly breakdown of sessions for a particular feature. In the
resulting display:
•
The blue lines represent actual sessions.
•
The red lines represent long sessions.
User Manual
96 of 117
Version 3.2
www.licensetracker.ca
© License Tracker Inc.
How to Generate the Sessions Chart
To create this chart in License Tracker:
TASK
1.
Click Charts > Sessions... to open a chart dialog.
2.
In the chart dialog select the period over which to display sessions activity. You can select:
•
•
•
3.
A date range.
A specific date.
All of the sessions in the database (At End of Data).
Select a specific feature to display.
ADDITIONAL INFORMATION: Selecting more than one feature is not allowed.
4.
Click OK to close the dialog.
RESULT:
A computation window opens to show progress in calculating values for the chart. When the
computation is complete the window closes automatically.
The Sessions Chart for the selected feature appears.
Figure 49: Sessions Chart
Version 3.2
97 of 117
User Manual
www.licensetracker.ca
© License Tracker Inc.
Sessions Length Chart
What is the Sessions Length Chart?
The Sessions Length Chart shows a count of how many sessions there were that lasted N hours
for a particular license. This histogram can be used to recognize patterns in how the users
consume a particular license.
How to Generate the Sessions Length Chart
To create this chart in License Tracker:
TASK
1.
Click Charts > Sessions Length... to open a chart dialog.
2.
Click Filter to open the Set the Filter Parameters dialog, review your values or set new
ones, and activate the Use Filter button with a check mark. The Use Filter button in the
chart dialog should have a check mark in it when you want to use the parameters from
the Set the Filter Parameters dialog, and should be empty when you do not want any data
filtering. For more information about setting parameters in this dialog, go to “Setting
Filter Parameters for Charts” on page 77.
3.
Define a time interval in the Start Date and End Date text fields using the procedures
described under the heading “Setting the Date Range for Charts” on page 79.
4.
In the Licenses window, click on one license name that you want to chart.
5.
Click OK to close the dialog.
RESULT:
A computation window opens to show progress in calculating values for the chart. When the
computation is complete the window closes automatically.
The Sessions Length Chart for the selected license appears.
User Manual
98 of 117
Version 3.2
www.licensetracker.ca
© License Tracker Inc.
Figure 50: Sessions Length Chart
Group Use Chart
What is the Group Use Chart?
The Group Use Chart displays the number of users for each license. In the resulting bar chart:
•
The height of the bar represents the number of users in the group
•
The red shading indicates the number of users in the group using a license.
Note that a pop-up appears indicating the actual number of users as your cursor moves over
the shaded part of a bar.
How to Generate the Group Use Chart
To create this chart in License Tracker:
TASK
1.
Click Charts > Group Use... to open a chart dialog.
2.
In the chart dialog select the group.
3.
Click OK to close the dialog.
Version 3.2
99 of 117
User Manual
www.licensetracker.ca
© License Tracker Inc.
RESULT:
The Group Use Chart for the selected group appears.
Figure 51: Group Use Chart
Denial Density Chart
What is the Denial Density Chart?
The denial density chart displays the number of denials found in the data for a particular license
per unit time.
How to Generate the Denial Density Chart
To create this chart in License Tracker:
TASK
1.
User Manual
Click Charts > Denial Density... to open a chart dialog.
100 of 117
Version 3.2
www.licensetracker.ca
© License Tracker Inc.
2.
In the chart dialog select the following:
a
b
c
d
3.
The date range.
ADDITIONAL INFORMATION: By default the dates selected are the start and end date for
all records in the database matching the content model selected. The date range can
be adjusted in these date range fields.
The level of detail.
ADDITIONAL INFORMATION: The level of detail is the unit of time in which denials will
be counted. Options are 1 hour, 2 hours, 6 hours, 12 hours, one day and one week.
A license of interest.
Optional step: Select Filter at the bottom left of the dialog to open and use the Select
the Parameters for a Filter dialog.
Click OK to close the dialog.
RESULT: The Denial Density Chart appears.
Figure 52: Denial Density Chart
Feature Unavailability Chart
What is the Feature Unavailability Chart?
The Feature Unavailability Chart displays the total number of minutes a selected license was
unavailable on each day over a selected time period.
Version 3.2
101 of 117
User Manual
www.licensetracker.ca
© License Tracker Inc.
How to Generate the Feature Unavailability Chart
To create this chart in License Tracker:
TASK
1.
Click Charts > Feature Unavailability... to open a chart dialog.
2.
In the chart dialog select the following:
a
b
c
3.
The date range.
ADDITIONAL INFORMATION: By default the dates selected are the start and end date for
all records in the database matching the content model selected. The date range can
be adjusted in these date range fields.
A license of interest.
Optional step: Select Filter at the bottom left of the dialog to open and use the Select
the Parameters for a Filter dialog.
Click OK to close the dialog.
RESULT: The Feature Unavailability Chart appears.
Figure 53: Feature Unavailability Chart
User Manual
102 of 117
Version 3.2
www.licensetracker.ca
© License Tracker Inc.
Pay-per-Use (PPU) Summary Chart
What is the PPU Chart?
The Pay-Per-Use Summary Chart (PPU) displays the monthly breakdown for the total year's
budget (not by license). In the resulting display:
•
The green items represent the budgeted amounts.
•
The red items represent the actual expenditures
•
The bar chart component displays the individual monthly amounts.
•
The line chart component displays the cumulative amounts.
How to Generate the PPU Chart
To create this chart in License Tracker:
TASK
1.
Click Charts > PPU Summary... to open a chart dialog.
2.
Click Filter to open the Set the Filter Parameters dialog, review your values or set new
ones, and activate the Use Filter button with a check mark.
ADDITIONAL INFORMATION: The Use Filter button in the chart dialog should have a check
mark in it when you want to use the parameters from the Set the Filter Parameters
dialog, and should be empty when you do not want any data filtering. For more
information on filtering see “Filter Parameters for Reports and Charts” on page 32.
3.
Define a time interval in the Start Date and End Date text fields using the procedures
described under the heading “Date Range for Reports and Charts” on page 35.
4.
In the Licenses window, click on the license name(s) that you want to chart. For multiple
selections, use the mouse with the SHIFT and CONTROL keys.
ADDITIONAL INFORMATION: License selections only impact the actual component, the
budget displayed is for all licenses, regardless of your selection.
5.
Version 3.2
Click OK to close the dialog and open a computation window that calculates the
parameters and displays the chart.
103 of 117
User Manual
www.licensetracker.ca
© License Tracker Inc.
RESULT:
Figure 54: PPU Summary Chart
User Manual
104 of 117
Version 3.2
www.licensetracker.ca
© License Tracker Inc.
The Web Tracker Module
This chapter describes the Web Tracker module, which complements the License Tracker
application and offers different ways to display License Tracker reports and monitor software
usage.
In Web Tracker a single request can generate several License Tracker reports and charts
packaged together in a comprehensive montage presentation for web viewing, browsing and
analysis. A Web Tracker display facilitates inter-report navigation and enhances your
understanding of the usage patterns.
NOTE:
This chapter requires that you already understand the fundamental concepts of License
Tracker and know how to work within a computer screen to fill in text fields, make selections from
a list in a window, and use buttons to display and select information. If you are not familiar with
the principles of operation behind License Tracker and are also not familiar with how to use
buttons, text fields and dialogs within the application, then go to “Fundamental Concepts” on
page 12.
Auto Tracker, a second module, is a stand-alone tool which enables automatic creation of Web
Tracker reports. It is documented in the License Tracker Administration Manual.
Auto TrackerAlerts, a third module, is a stand-alone tool which enables automatic creation of
e-mail alerts sent to designated recipients whenever a particular condition is matched in the log
files. It is documented in the License Tracker Administration Manual.
Accessing the Web Tracker module
This section tells you how to access Web Tracker and Web Tracker reports.
How to Access the Web Tracker module
To display Web Tracker follow this procedure.
TASK
1.
Version 3.2
Click on Reports > Web Tracker Reports....
105 of 117
User Manual
www.licensetracker.ca
© License Tracker Inc.
EXAMPLE:
Figure 55: Accessing the Web Tracker Module
Generating Web Tracker reports
This section tells you how to generate Web Tracker reports.
How to Generate License Tracker Reports with Web Tracker
PREREQUISITE
This procedure assumes that you can generate reports and charts using the Reports and Charts
menus in License Tracker.
To generate a set of License Tracker reports with Web Tracker follow this procedure.
User Manual
106 of 117
Version 3.2
www.licensetracker.ca
© License Tracker Inc.
TASK
1.
Open an existing License Tracker database (extension *.mdb) and click Reports > Web
Tracker Reports... to open the reports dialog.
•
If you do not have an existing License Tracker database, then go to Creating a New
Database (p.30)
•
If you have forgotten the procedure for opening an existing database, then go to
Opening an Existing Database (p.34).
2.
There are two ways to display the reports:
a
b
3.
Identify the reports you want to create in the Report Parameters dialog and click OK to
start generating the output. A processing dialog is displayed.
•
•
•
•
4.
Click on the View Existing Reports button to view previously generated Web
Tracker reports. The Web Tracker Reports are displayed in a web browser and this
procedure is complete.
Click on the Compute Reports button to display the view Report Parameters
dialog.
Selected reports have a check mark beside them. As a default, Web Tracker selects
all reports. To deselect a report, simply click on it again to remove the check mark.
When you have a large database and have also selected many or all the report types
in the Web Tracker dialog (especially, Long Sessions Reports), the computation
process can take several minutes, even hours, because of the volume of reports that
are generated. Assign your time accordingly and be prepared to wait.
For a description of the reports and charts that you can create, go to “Viewing Web
Tracker Reports” on page 108.
For a description of the reports that you can select as Preferences, go to Preferences
for Web Tracker (p.63).
When you see the Task Complete message in the process dialog, the report generation
process is finished.
RESULT:
When the report generation is complete, the following files and folders will have been
generated.
•
Web Tracker has created a folder to hold your reports that is identified with your database
name and the word reports, separated by a hyphen (for example WTtest-reports).
This folder resides inside the same folder as your database.
•
Within this database name-reports folder, Web Tracker created two sub-folders
(i.e., reports and common) and an HTML file, index.htm.
Version 3.2
107 of 117
User Manual
www.licensetracker.ca
© License Tracker Inc.
–
The reports folder contains the data files (HTML files) that define the database
name-reports you just created in Web Tracker.
–
The common folder contains image files that are included the Web Tracker web
pages.
–
The index.htm file opens the Web Tracker home page for your database. Web
Tracker overwrites the index.htm file every time you create reports using the same
database name.
Viewing Web Tracker Reports
To open Web Tracker and view License Tracker reports, double-click on the index.htm file in
the reports directory.
To display information in a Web Tracker page, click on a menu item:
•
“Home” on page 109,
•
“Features” on page 110,
•
“Users” on page 111,
•
“Groups” on page 112, and
•
“Analyses” on page 113.
NOTE:
Most Web Tracker reports are cross-referenced so you can quickly interconnect with
related information. Cross-references within these Web Tracker reports are in a highlighted
font. Click once on any of these items to immediately display the related data.
NOTE: Within these displays you can click on any of the charts to view an enlarged version
of the chart.
Figure 56: The Web Tracker Menu
User Manual
108 of 117
Version 3.2
www.licensetracker.ca
© License Tracker Inc.
Home
In the Web Tracker menu, the menu item Home displays information about your database. The
information in this window is read only.
Database Information
Contains database name and directory location and comments about the database.
Scope
Provides details of the Content Scope that was used in generating this set of Web Tracker
reports.
Data Sources
Contains information about the log files that contained the usage data that was used in
generating this set of Web Tracker reports.
Session Statistics
Contains session information:
•
Date Range of data in your database,
Version 3.2
•
Duration Range of session hours (minimum-maximum),
•
Number of Sessions,
•
Number of Licenses,
•
Number of Users, and
•
Number of Denials for license access.
109 of 117
User Manual
www.licensetracker.ca
© License Tracker Inc.
Figure 57: The Web Tracker Menu: Home
Features
The Web Tracker menu item Features displays the main Features page containing two tables,
the Feature Use Summary report and the License Model report.
Each item listed under the column heading Feature Name in both of the tables is
cross-referenced to a Web Tracker page that displays information about the specified license.
Click on a feature name to open the Web Tracker page associated with the specified feature and
display the following information:
•
License cost information and concurrent use chart,
•
User table and pie-chart,
User Manual
110 of 117
Version 3.2
www.licensetracker.ca
© License Tracker Inc.
•
Average daily use table and chart,
•
Average weekly use and chart,
•
Level of use table and chart,
•
Session length table and chart,
•
Groups table and groups pie-chart,
•
Individual group table and pie chart, and
•
Long-sessions and resulting denials report.
This Web Tracker page allows you to do the following:
•
Click on a user name in the user table to display a corresponding User Report. This
report contains a license table where you can select a license name that opens a License
Report.
•
Click on a group name in the group table to display a corresponding Group Report. This
report contains a license usage table and a user usage table, from which you can access
corresponding reports.
NOTE:
Within these displays you can click on any of the charts to view an enlarged version
of the chart.
Users
The Web Tracker menu item Users displays a table containing user information under the
following headings:
•
UserID (login name)
•
Name
•
Phone
•
E-mail
•
Hours
Each item listed under the column headings UserID is cross-referenced to a display of
information about the specified user or group:
•
Version 3.2
Click on UserID to open a User Report that contains information about the user, a table
of license usage for that user and a corresponding usage pie-chart, as well as a long session
report. You can access further information by clicking on an item in the column under
License to display the corresponding License Report.
111 of 117
User Manual
www.licensetracker.ca
© License Tracker Inc.
•
In the user report, click on a Group to open a display of two tables that identify the license
usage and user usage for that group. Click on an item in the license table under License
Name to display a License Report or click on an item in the user table under UserName
to display the corresponding User Report.
•
Click on E-mail to send e-mail to the user.
NOTE:
Within these displays you can click on any of the charts to view an enlarged version
of the chart.
Groups
The Web Tracker menu item Groups displays a table for each category in the user model. Each
table information under the following headings:
•
Group
•
Users
•
Licenses
•
Hours
Each item listed in the table under the heading Group is cross-referenced to a display relating
to group usage information. Click on a group name to display the tables that identify license
usage and user usage for that group:
•
Click on an item in the license table under the heading License to display a Web Tracker
License Report. Within this report you can access a User Report and a Groups Report
by selecting items in the respective tables.
•
Click on an item in the user table under the heading User to display a Web Tracker page
(User Report). Within this report you can access a License Report by selecting an item
in the table.
NOTE:
Within these displays you can click on any of the charts to view an enlarged version
of the chart.
User Manual
112 of 117
Version 3.2
www.licensetracker.ca
© License Tracker Inc.
Figure 58: The Web Tracker Menu: Groups
Analyses
In the Web Tracker menu, the item Analyses displays under four categories that address key
business issues.
Basic Analyses
Refers to license usage per month.
Pay-Per-Use Analyses
Refers to usage and cost for rental licenses.
Budget Planning Analyses
Refers to group usage information and compares budgeted versus actual license costs.
License Remix Analyses
Assesses rental licenses.
Version 3.2
113 of 117
User Manual
www.licensetracker.ca
© License Tracker Inc.
Figure 59: The Web Tracker Menu: Analyses
User Manual
114 of 117
Version 3.2
www.licensetracker.ca
© License Tracker Inc.
Figure 60: The Web Tracker Analysis Function
Version 3.2
115 of 117
User Manual
www.licensetracker.ca
© License Tracker Inc.
Support and Contact Information
Support is available directly from License Tracker Inc. We can be reached at:
On the Web
http://www.licensetracker.ca
General e-mail
[email protected]
Support e-mail
[email protected]
User Manual
116 of 117
Version 3.2
www.licensetracker.ca
© License Tracker Inc.
Page left blank on purpose
Version 3.2
117 of 117
User Manual
www.licensetracker.ca
© License Tracker Inc.
User Manual
118 of 117
Version 3.2