1
LIAM2 User Guide
Release 0.8.1
G. Bryon, G. Dekkers, G. de Menten
March 19, 2014
CONTENTS
1
Introduction
1.1 About LIAM2 . . . . . . . . . . . . . . . . . . . . . . . . . . . . . . . . . . . . . . . . . . . .
1.2 About microsimulation . . . . . . . . . . . . . . . . . . . . . . . . . . . . . . . . . . . . . . . .
1.3 About this guide . . . . . . . . . . . . . . . . . . . . . . . . . . . . . . . . . . . . . . . . . . .
1
1
2
2
2
Environment
2.1 LIAM2 bundle . . . . . . . . . . . . . . . . . . . . . . . . . . . . . . . . . . . . . . . . . . . .
2.2 Getting Started . . . . . . . . . . . . . . . . . . . . . . . . . . . . . . . . . . . . . . . . . . . .
2.3 Using your own data . . . . . . . . . . . . . . . . . . . . . . . . . . . . . . . . . . . . . . . . .
3
3
3
3
3
Model Definition
3.1 import . .
3.2 globals . .
3.3 entities . .
3.4 simulation
5
5
5
6
8
.
.
.
.
.
.
.
.
.
.
.
.
.
.
.
.
.
.
.
.
.
.
.
.
.
.
.
.
.
.
.
.
.
.
.
.
.
.
.
.
.
.
.
.
.
.
.
.
.
.
.
.
.
.
.
.
4
Running a model/simulation
5
Processes
5.1 Assignments . . . . . . . . . . . . .
5.2 Temporary variables . . . . . . . . .
5.3 Actions . . . . . . . . . . . . . . . .
5.4 Procedures . . . . . . . . . . . . . .
5.5 Expressions . . . . . . . . . . . . . .
5.6 Output . . . . . . . . . . . . . . . .
5.7 Debugging and the interactive console
.
.
.
.
.
.
.
.
.
.
.
.
.
.
.
.
.
.
.
.
.
.
.
.
.
.
.
.
.
.
.
.
.
.
.
.
.
.
.
.
.
.
.
.
.
.
.
.
.
.
.
.
.
.
.
.
.
.
.
.
.
.
.
.
.
.
.
.
.
.
.
.
.
.
.
.
.
.
.
.
.
.
.
.
.
.
.
.
.
.
.
.
.
.
.
.
.
.
.
.
.
.
.
.
.
.
.
.
.
.
.
.
.
.
.
.
.
.
.
.
.
.
.
.
.
.
.
.
11
.
.
.
.
.
.
.
13
13
13
14
14
15
29
48
6
Links
6.1 many2one . . . . . . . . . . . . . . . . . . . . . . . . . . . . . . . . . . . . . . . . . . . . . .
6.2 one2many . . . . . . . . . . . . . . . . . . . . . . . . . . . . . . . . . . . . . . . . . . . . . .
51
51
52
7
Importing other models
55
8
Importing data
8.1 data files . . . . . . . . . . . . . . . . . . . . . . . . . . . . . . . . . . . . . . . . . . . . . . .
8.2 description file . . . . . . . . . . . . . . . . . . . . . . . . . . . . . . . . . . . . . . . . . . . .
8.3 importing the data . . . . . . . . . . . . . . . . . . . . . . . . . . . . . . . . . . . . . . . . . .
57
57
57
61
9
Indices and tables
63
.
.
.
.
.
.
.
.
.
.
.
.
.
.
.
.
.
.
.
.
.
.
.
.
.
.
.
.
.
.
.
.
.
.
.
.
.
.
.
.
.
.
.
.
.
.
.
.
.
.
.
.
.
.
.
.
.
.
.
.
.
.
.
.
.
.
.
.
.
.
.
.
.
.
.
.
.
.
.
.
.
.
.
.
.
.
.
.
.
.
.
.
.
.
.
.
.
.
.
.
.
.
.
.
.
.
.
.
.
.
.
.
.
.
.
.
.
.
.
.
.
.
.
.
.
.
.
.
.
.
.
.
.
.
.
.
.
.
.
.
.
.
.
.
.
.
.
.
.
.
.
.
.
.
.
.
.
.
.
.
.
.
.
.
.
.
.
.
.
.
.
.
.
.
.
.
.
.
.
.
.
.
.
.
.
.
.
.
.
.
.
.
.
.
.
.
.
.
.
.
.
.
.
.
.
.
.
.
.
.
.
.
.
.
.
.
.
10 Appendix
10.1 Known issues . . . . . . . . . . . . . . . . . . . . . . . . . . . . . . . . . . . . . . . . . . . . .
10.2 Code architecture . . . . . . . . . . . . . . . . . . . . . . . . . . . . . . . . . . . . . . . . . . .
10.3 Technical choices . . . . . . . . . . . . . . . . . . . . . . . . . . . . . . . . . . . . . . . . . . .
65
65
66
69
i
10.4 Change log . . . . . . . . . . . . . . . . . . . . . . . . . . . . . . . . . . . . . . . . . . . . . .
10.5 Credits . . . . . . . . . . . . . . . . . . . . . . . . . . . . . . . . . . . . . . . . . . . . . . . .
Index
ii
70
84
85
CHAPTER
ONE
INTRODUCTION
1.1 About LIAM2
LIAM2 is a tool to develop (different kinds of) microsimulation models.
The goal of the project is to let modellers concentrate on what is strictly specific to their model without having to
worry about the technical details. This is achieved by providing a generic microsimulation toolbox which is not
tied to a particular model. By making it available for free, our hope is to greatly reduce the development costs (in
terms of both time and money) of microsimulation models.
The toolbox is made as generic as possible so that it can be used to develop almost any microsimulation model as
long as it use cross-sectional ageing, ie all individuals are simulated at the same time for one period, then for the
next period, etc.
1.1.1 License
LIAM2 is licensed under the GNU General Public License (GPL) version 3. This means you can freely use, copy,
modify and redistribute this software provided you follow a few conditions. See the license text for details.
1.1.2 Staying informed
You can get notified of new versions and other LIAM2-related announcements by either using our website RSS
feed or subscribing to the LIAM2-announce mailing list on Google Groups.
1.1.3 Credits
The software is primarily being developed at the Federal Planning Bureau (Belgium), with testing and funding by
CEPS/INSTEAD (Luxembourg) and IGSS (Luxembourg), and funding from the European Commission. See the
credits page for details.
1.1.4 Contact
For any question, suggestion or comment you might have, please send a message to the LIAM2-users mailing list.
Please note that, as a spam counter measure, new member posts are moderated. We are doing all we can to let
them through as quickly as possible, but since it is a manual process it can take a few hours, or exceptionally a
few days. Please be patient in case your post is delayed.
If you really do not want your message to be public, you can contact the authors at liam2 x plan y be (replace x
and y by @ and . respectively) but we would highly prefer if you used the mailing list instead if you can.
1
LIAM2 User Guide, Release 0.8.1
1.2 About microsimulation
Microsimulation is a modelling technique that operates at the level of individual units such as persons, households, vehicles or firms. Each unit has a set of associated attributes – e.g. a person has an associated age, sex, and
employment status. In the case of discrete-time dynamic models, a set of rules (intended to represent individual
preferences) are applied to these units at each time step, leading to simulated changes in state and possibly behaviour. These rules may be deterministic (probability = 1), such as ageing, or stochastic (probability < 1), such
as the chance of dying, marrying, giving birth or moving within a given time period.
The aim of such simulations is to give insight about both the overall aggregate change of some characteristics and,
most importantly, the way these changes are distributed in the population that is being modelled. The methodology
is often used to design and evaluate public policies that are affected by earlier events and choices as is the case for
pensions or education.
1.3 About this guide
This guide will help you develop dynamic microsimulation models using LIAM2. Please note that it describes
version 0.8 of LIAM2, but both the software package and this manual are work-in-progress, and are therefore
subject to change.
2
Chapter 1. Introduction
CHAPTER
TWO
ENVIRONMENT
2.1 LIAM2 bundle
The bundle includes:
• The executable for Windows.
• A text editor (Notepad++), pre-configured to work with LIAM2 models.
– Notepad++ is a free (and open
http://sourceforge.net/projects/notepad-plus/.
source)
text
editor
that
is
available
at
– We pre-configured it so that you can import csv files and run your models directly from within the
editor by simply pressing F5 or F6 respectively. See below for more information.
• The documentation in HTML Help format (.chm). You can find .pdf and .html versions on our website.
• A demonstration model with a synthetic data set of 20,200 persons grouped in 14,700 households.
2.2 Getting Started
• Copy the contents of the bundle in a directory on your disk (let us call it [BUNDLEPATH]).
• Run the “Notepad++Portable.exe” from the [BUNDLEPATH]\editor directory.
• Open a model (eg. [BUNDLEPATH]\examples\demo01.yml)
• Press F6 to run the model. A console window will open within the editor and display the status of the
simulation. After the simulation completes, the console window becomes interactive.
• Use this console to explore the results. If you already quit the interactive console and want to explore the
results with the interactive console again without (re)simulating the model, you can press F7.
• Alternatively, you can explore the results “graphically” by pressing F9. This will open both the input dataset
and the result file (if any) with an hdf5 viewer (ViTables).
2.3 Using your own data
• Prepare your data as CSV files. The first row should contain the name of the fields. You need at least two
integer columns: “id” and “period” (though they do not necessarily need to be named like that in the csv
file).
• Create an import file, as described in the Importing
[BUNDLEPATH]\examples\demo_import.yml as an example.
data
section.
You
can
use
• Press F5 to convert your CSV files to hdf5.
• Use the newly created data file with your model.
3
LIAM2 User Guide, Release 0.8.1
4
Chapter 2. Environment
CHAPTER
THREE
MODEL DEFINITION
To define the model, we have to describe the different entities, their fields, the way they interact (links) and how
they behave over time (processes). This is done in one file. We use the YAML-markup language. This format uses
the level of indentation to specify objects and sub objects.
In a LIAM2 model file, all text following a # is considered to be comments, and is therefore ignored.
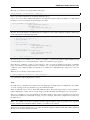
A LIAM2 model has the following structure:
# imports are optional (this section can be entirely omitted)
import:
...
# globals are optional (this section can be entirely omitted)
globals:
...
entities:
...
simulation:
...
3.1 import
A model file can (optionally) import (an)other model file(s). This can be used to simply split a large model file
into smaller files, or (more interestingly) to create simulation variants without having to duplicate the common
parts.
For details, see the Importing other models section.
3.2 globals
globals are variables (aka. parameters) that do not relate to any particular entity defined in the model. They can
be used in expressions in any entity.
LIAM2 currently supports two kinds of globals: tables and multi-dimensional arrays. Both kinds need their data
to be imported (as explained in the Importing data section) before they can be used. They also need to be declared
in the simulation file, as follow:
globals:
mytable:
fields:
- MYINTFIELD: int
- MYFLOATFIELD: float
5
LIAM2 User Guide, Release 0.8.1
MYARRAY:
type: float
Please see the globals usage section for how to use them in you expressions.
There are globals with a special status: periodic globals. Those globals have a different value for each period.
periodic is thus a reserved word and is always a table, so the “fields” keyword can be omitted for that table.
For example, the retirement age for women in Belgium has been gradually increasing from 61 in 1997 to 65 in
2009. A global variable WEMRA has therefore been included.
globals:
periodic:
# PERIOD is an implicit column of the periodic table
- WEMRA: float
3.3 entities
Each entity has a unique identifier and a set of attributes (fields). You can use different entities in one model. You
can define the interaction between members of the same entity (eg. between partners) or among different entities
(eg. a person and its household) using links.
The processes section describe how the entities behave. The order in which they are declared is not important.
In the simulation block you define if and when they have to be executed, this allows to simulate processes of
different entities in the order you want.
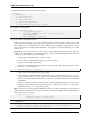
LIAM2 declares the entities as follows:
entities:
entity-name1:
fields:
fields definition
links:
links definition
macros:
macros definition
processes:
processes definition
entity-name2:
...
As we use YAML as the description language, indentation and the use of ”:” are important.
3.3.1 fields
The fields hold the information of each member in the entity. That information is global in a run of the model.
Every process defined in that entity can use and change the value.
LIAM2 handles three types of fields:
• bool: boolean (True or False)
• int: integer
• float: real number
There are two implicit fields that do not have to be defined:
• id: the unique identifier of the item
6
Chapter 3. Model Definition
LIAM2 User Guide, Release 0.8.1
• period: the current period in the run of the program
example
entities:
person:
fields:
# period and id are implicit
- age:
int
- dead:
bool
- gender:
bool
# 1: single, 2: married, 3: cohabitant, 4: divorced, 5: widowed
- civilstate: int
- partner_id: int
- earnings:
float
This example defines the entity person. Each person has an age, gender, is dead or not, has a civil state, possibly
a partner. We use the field civilstate to store the marital status as a switch of values.
By default, all declared fields are supposed to be present in the input file (because they are observed or computed
elsewhere and their value can be found in the supplied data set). The value for all declared fields will also be
stored for each period in the output file.
However, in practice, there are often some fields which are not present in the input file. They will need to be
calculated later by the model, and you need to tell LIAM2 that the field is missing, by using “initialdata: false” in
the definition for that field (see the agegroup variable in the example below).
example
entities:
person:
fields:
- age:
int
- agegroup: {type: int, initialdata: false}
Field names must be unique per entity (i.e. several entities may have a field with the same name).
Temporary variables are not considered as a fields and do not have to be declared.
3.3.2 links
Individuals can be linked with each other or with individuals of other entities, for example, mothers are linked to
their children, partners are linked to each other and persons belong to households.
For details, see the Links section.
3.3.3 macros
Macros are a way to make the code easier to read and maintain. They are defined on the entity level. Macros are
re-evaluated wherever they appear. Use capital letters to define macros.
example
entities:
person:
fields:
- age: int
macros:
ISCHILD: age < 18
processes:
test_macros:
3.3. entities
7
LIAM2 User Guide, Release 0.8.1
-
ischild: age < 18
before1: if(ischild, 1, 2)
before2: if(ISCHILD, 1, 2)
age: age + 1
after1: if(ischild, 1, 2)
after2: if(ISCHILD, 1, 2)
# before1 == before2
# after1 != after2
simulation:
processes:
- person: [test_macros]
The above example does
• ischild: creates a temporary variable ischild and sets it to True if the age of the person is under 18 and to
False if not
• before1: creates a temporary variable before1 and sets it to 1 if the value of the temporary variable ischild
is True and to 2 if not.
• before2: creates a temporary variable before2 and sets it to 1 if the value age < 18 is True and to 2 if not
• age: the age is changed
• after1: creates a temporary variable after1 and sets it to 1 if the value of the temporary variable ischild is
True and to 2 is not.
• after2: creates a temporary variable after2 and sets it to 1 if the value age < 18 is True and to 2 if not.
It is clear that after1 != after2 since the age has been changed and ischild has not been updated since.
3.3.4 processes
Here you define the processes you will need in the model.
For details, see the Processes section.
3.4 simulation
The simulation block includes the location of the datasets (input, output), the number of periods and the start
period. It sets what processes defined in the entities block are simulated (since some can be omitted), and the
order in which this is done.
Please note that even though in all our examples periods correspond to years, the interpretation of the period is up
to the modeller and can thus be an integer number representing anything (a day, a month, a quarter or anything
you can think of). This is an important choice as it will impact the whole model.
Suppose that we have a model that starts in 2002 and has to simulate for 10 periods. Furthermore, suppose that
we have two entities: individuals and households. The model starts by some initial processes (defined in the init
section) that precede the actual prospective simulation of the model, and that only apply to the observed dataset in
2001 (or before). These initial simulations can pertain to the level of the individual or the household. Use the init
block to calculate variables for the starting period.
The prospective part of the model starts by a number of sub-processes setting the household size and composition.
Next, two processes apply on the level of the individual, changing the age and agegroup. Finally, mortality and
fertility are simulated. Seeing that this changes the numbers of individuals in households, the process establishing
the household size and composition is again used.
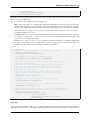
example
simulation:
init:
# optional
- household: [household_composition]
- person: [agegroup]
8
Chapter 3. Model Definition
LIAM2 User Guide, Release 0.8.1
processes:
- household: [household_composition]
- person: [
age, agegroup,
dead_procedure, birth
]
- household: [household_composition]
input:
path: liam2
file: base.h5
output:
path: liam2
file: simulation.h5
start_period: 2002
periods: 10
skip_shows: False
random_seed: 5235
assertions: warn
default_entity: person
autodump: False
autodiff: False
# optional
# optional
#
#
#
#
#
#
optional
optional
optional
optional
optional
optional
3.4.1 processes
This block defines which processes are executed and in what order. They will be executed for each period starting
from start_period for periods times. Since processes are defined on a specific entities (they change the values
of items of that entity), you have to specify the entity before each list of process. Note that you can execute the
same process more than once during a simulation and that you can alternate between entities in the simulation of
a period.
In the example you see that after dead_procedure and birth, the household_composition procedure is re-executed.
3.4.2 init
Every process specified here is only executed in the last period before start period (start_period - 1). You can use
it to calculate (initialise) variables derived from observed data. This section is optional (it can be entirely omitted).
3.4.3 input
The initial (observed) data is read from the file specified in the input entry.
Specifying the path is optional. If it is omitted, it defaults to the directory where the simulation file is located.
The hdf5-file format can be browsed with vitables (http://vitables.berlios.de/) or another hdf5-browser available
on the net.
3.4.4 output
The simulation result is stored in the file specified in the output entry. Only the variables defined at the entity level
are stored. Temporary (local) variables are not saved. The output file contains values for each period and each
field and each item.
Specifying the path is optional. If it is omitted, it defaults to the directory where the simulation file is located.
3.4. simulation
9
LIAM2 User Guide, Release 0.8.1
3.4.5 start_period
Defines the first period (integer) to be simulated. It should be consistent (use the same scale/time unit) with the
“period” column in the input data.
3.4.6 periods
Defines the number of periods (integer) to be simulated.
3.4.7 random_seed
Defines the starting point (integer) of the pseudo-random generator. This section is optional. This can be useful if
you want to have several runs of a simulation use the same random numbers.
3.4.8 skip_shows
If set to True, makes all show() functions do nothing. This can speed up simulations which include many shows
(usually for debugging). Defaults to False.
3.4.9 assertions
This option can take any of the following values:
raise interrupt the simulation if an assertion fails (this is the default).
warn display a warning message.
skip do not run the assertions at all.
3.4.10 default_entity
If set to the name of an entity, the interactive console will start in that entity.
3.4.11 timings
If set to False, hide all timings from the simulation log, so that two simulation log files are more easily comparable
(for example with “diff” tools like WinMerge). Defaults to True.
3.4.12 autodump
If this option is used, at the end of each procedure, all (non-scalar) variables changed during the procedure (including temporaries) will be dumped in an hdf5 file (named “autodump.h5” by default). This option can be used
alone for debugging, or in combination with autodiff (in a later run). This option can take either a filename or a
boolean (in which case “autodump.h5” is used as the filename). Defaults to False.
3.4.13 autodiff
If this option is used, at the end of each procedure, all (non-scalar) variables changed during the procedure (including temporaries) will be compared with the values stored previously by autodump in another run of the model
(or a variant of it). This can be used to precisely compare two versions/variants of a model and see exactly where
they start to differ. This option can take either a filename or a boolean (in which case “autodump.h5” is used as
the filename). Defaults to False.
10
Chapter 3. Model Definition
CHAPTER
FOUR
RUNNING A MODEL/SIMULATION
• If you are using the bundled editor, simply open the simulation file and press F6.
• If you are using the command line, use:
[BUNDLEPATH]\liam2\main run <path_to_simulation_file>
11
LIAM2 User Guide, Release 0.8.1
12
Chapter 4. Running a model/simulation
CHAPTER
FIVE
PROCESSES
The processes are the core of a model. LIAM2 supports two kinds of processes: assignments, which change the
value of a variable (predictor) using an expression, and actions which don’t (but have other effects).
For each entity (for example, “household” and “person”), the block of processes starts with the header “processes:”. Each process then starts at a new line with an indentation of four spaces.
5.1 Assignments
Assignments have the following general format:
processes:
variable1_name: expression1
variable2_name: expression2
...
The variable_name will usually be one of the variables defined in the fields block of the entity but, as we will see
later, it is not always necessary.
In this case, the name of the process equals the name of the endogenous variable. Process names have to be
unique for each entity. See the section about procedures if you need to have several processes which modify the
same variable.
To run the processes, they have to be specified in the “processes” section of the simulation block of the file. This
explains why the process names have to be unique for each entity.
example
entities:
person:
fields:
- age: int
processes:
age: age + 1
simulation:
processes:
- person: [age]
...
5.2 Temporary variables
All fields declared in the “fields” section of the entity are stored in the output file. Often you need a variable only
to store an intermediate result during the computation of another variable.
In LIAM2, you can create a temporary variable at any point in the simulation by simply having an assignment to
an undeclared variable. Their value will be discarded at the end of the period.
13
LIAM2 User Guide, Release 0.8.1
example
person:
fields:
# period and id are implicit
- age:
int
- agegroup: int
processes:
age: age + 1
agediv10: trunc(age / 10)
agegroup: agediv10 * 10
agegroup2: agediv10 * 5
In this example, agediv10 and agegroup2 are temporary variables. In this particular case, we could have bypassed
the temporary variable, but when a long expression occurs several times, it is often cleaner and more efficient to
express it (and compute it) only once by using a temporary variable.
5.3 Actions
Since actions don’t return any value, they do not need a variable to store that result, and they only ever need the
condensed form:
processes:
process_name: action_expression
...
example
processes:
remove_deads: remove(dead)
5.4 Procedures
A process can consist of sub-processes, in that case we call it a procedure. Processes within a procedure are
executed in the order they are declared.
Sub-processes each start on a new line, again with an indentation of four spaces and a -.
So the general setup is:
processes:
variable_name: expression
process_name2: action_expression
process_name3:
- subprocess_31: expression
- subprocess_32: expression
In this example, there are three processes, of which the first two do not have sub-processes. The third process
is a procedure which consists of two sub-processes. If it is executed, subprocess_31 will be executed and then
subprocess_32.
Contrary to normal processes, sub-processes (processes inside procedures) names do not need to be unique. In the
above example, it is possible for subprocess_31 and subprocess_32 to have the same name, and hence simulate
the same variable. Procedure names (process_name3) does not directly refer to a specific endogenous variable.
example
processes:
ageing:
- age: age * 2 # in our world, people age strangely
14
Chapter 5. Processes
LIAM2 User Guide, Release 0.8.1
- age: age + 1
- agegroup: trunc(age / 10) * 10
The processes on age and agegroup are grouped in ageing. In the simulation block you specify the ageing-process
if you want to update age and agegroup.
By using procedures, you can actually make building blocks or modules in the model.
5.4.1 Local (temporary) variables
Temporary variables defined/computed within a procedure are local to that procedure: they are only valid within
that procedure. If you want to pass variables between procedures you have to make them global by defining them
in the fields section.
(bad) example
person:
fields:
- age: int
processes:
ageing:
- age: age + 1
- isold: age >= 150
# isold is a local variable
rejuvenation:
- age: age - 1
- backfromoldage: isold and age < 150
# WRONG !
In this example, isold and backfromoldage are local variables. They can only be used in the procedure where they
are defined. Because we are trying to use the local variable isold in another procedure in this example, LIAM2
will refuse to run, complaining that isold is not defined.
5.4.2 Actions
Actions inside procedures don’t even need a process name.
example
processes:
death_procedure:
- dead: age > 150
- remove(dead)
5.5 Expressions
Expressions can either compute new values for existing individuals, or change the number of individuals by using
the so-called life-cycle functions.
5.5.1 simple expressions
Let us start with a simple increment; the following process increases the value of a variable by one each simulation
period.
age: age + 1
The name of the process is age and what it does is increasing the variable age of each individual by one, each
period.
5.5. Expressions
15
LIAM2 User Guide, Release 0.8.1
• Arithmetic operators: +, -, *, /, ** (exponent), % (modulo)
Note: An integer divided by an integer returns a float. For example “1 / 2” will evaluate to 0.5 instead of 0 as
in many programming languages. If you are only interested in the integer part of that result (for example, if you
know the result has no decimal part), you can use the trunc function:
agegroup5: 5 * trunc(age / 5)
• Comparison operators: <, <=, ==, !=, >=, >
• Boolean operators: and, or, not
Note: Starting with version 0.6, you do not need to use parentheses when you mix boolean operators with other
operators.
inwork: workstate > 0 and workstate < 5
to_give_birth: not gender and age >= 15 and age <= 50
is now equivalent to:
inwork: (workstate > 0) and (workstate < 5)
to_give_birth: not gender and (age >= 15) and (age <= 50)
• Conditional expressions: if(condition, expression_if_true, expression_if_false)
example
agegroup_civilstate: if(age < 50,
5 * trunc(age / 5),
10 * trunc(age / 10))
Note: The if function always requires three arguments. If you want to leave a variable unchanged if a condition
is not met, use the variable in the expression_if_false:
# retire people (set workstate = 9) when aged 65 or more
workstate: if(age >= 65, 9, workstate)
You can nest if-statements. The example below retires men (gender = True) over 64 and women over 61.
workstate: if(gender,
if(age >= 65, 9, workstate),
if(age >= 62, 9, workstate))
# could also be written like this:
workstate: if(age >= if(gender, 65, 62), 9, workstate)
5.5.2 globals
Globals can be used in expressions in any entity. LIAM2 currently supports two kinds of globals: tables and
multi-dimensional arrays. They both need to be imported (see the Importing data section) and declared (see the
globals section) before they can be used.
Globals tables come in two variety: those with a PERIOD column and those without.
The fields in a globals table with a PERIOD column can be used like normal (entity) fields except they need to
be prefixed by the name of their table:
myvariable: mytable.MYINTFIELD * 10
the value for INTFIELD is in fact the value INTFIELD has for the period currently being evaluated.
16
Chapter 5. Processes
LIAM2 User Guide, Release 0.8.1
There is a special case for the periodic table: its fields do not need to be prefixed by “periodic.” (but they can be,
if desired).
- retirement_age: if(gender, 65, WEMRA)
- workstate: if(age >= retirement_age, 9, workstate)
This changes the workstate of the individual to retired (9) if the age is higher than the required retirement age in
that year.
Another way to use globals from a table with a PERIOD column is to specify explicitly for which period you want
them to be evaluated. This is done by using tablename.FIELDNAME[period_expr], where period_expr can be any
expression yielding a valid period value. Here are a few artificial examples:
workstate: if(age >= WEMRA[2010], 9, workstate)
workstate: if(age >= WEMRA[period - 1], 9, workstate)
workstate: if(age >= WEMRA[year_of_birth + 60], 9, workstate)
Globals tables without a PERIOD column can only be used with the second syntax, and in that case LIAM2
will not automatically subtract the “base period” from the index, which means that to access a particular row, you
have to use its row index (0 based).
Globals arrays can simply be used like a normal field:
myvariable: MYARRAY * 2
5.5.3 mathematical functions
• log(expr): natural logarithm (ln)
• exp(expr): exponential
• abs(expr): absolute value
• round(expr[, n]): returns the rounded value of expr to specified n (number of digits after the decimal point).
If n is not specified, 0 is used.
• trunc(expr): returns the truncated value (by dropping the decimal part) of expr as an integer.
• clip(x, a, b): returns a if x < a, x if a < x < b, b if x > b.
• min(x, a), max(x, a): the minimum or maximum of x and a.
5.5.4 aggregate functions
• count([condition]): count individuals
It counts the individuals in the current entity. If a (boolean) condition is given, it only counts the ones satisfying
that condition. For example, count(male and age >= 18) will produce the number of men in the sample who are
eighteen years old or older.
Note: count() can be used without any argument: count() will return the total number of individuals in the sample
for the current entity.
• sum(expr[, filter=condition][, skip_na=True]): sum of an expression
It computes the sum of any expression over all individuals of the current entity. If a filter (boolean condition) is
given, it only takes into account the individuals satisfying the filter. For example sum(earnings) will produce the
sum of the earnings of all persons in the sample, while sum(earnings, age >= 30) will produce the sum of the
earnings of all persons in the sample who are 30 or older. skip_na determines whether missing values (nan) are
discarded before the computation or not. It defaults to True.
5.5. Expressions
17
LIAM2 User Guide, Release 0.8.1
Note: sum and count are exactly equivalent if their only argument is a boolean variable (eg. count(age >= 18) ==
sum(age >= 18)).
• avg(expr[, filter=condition][, skip_na=True]): average
• std(expr[, filter=condition][, skip_na=True]): standard deviation
• min(expr[, filter=condition][, skip_na=True]): min
• max(expr[, filter=condition][, skip_na=True]): max
• median(expr[, filter=condition][, skip_na=True]): median
• percentile(expr, percent[, filter=condition][, skip_na=True]): percentile
• gini(expr[, filter=condition][, skip_na=True]): gini
• all(condition1[, filter=condition2]): is condition True for all?
Returns True if all individuals who satisfy the optional condition2 also satisfy condition1, False otherwise. Note
that all(condition1, filter=condition2) is equivalent to all(condition1 and condition2).
• any(condition1[, filter=condition2]): is condition True for any?
Returns True if any individual who satisfy the optional condition2 also satisfy condition1, False otherwise. Note
that any(condition1, filter=condition2) is equivalent to any(condition1 and condition2).
5.5.5 link methods
(one2many links)
• link.count([filter]) - counts the number of related individuals
• link.sum(expr[, filter]) - compute the sum of an expression over the related individuals
• link.avg(expr[, filter]) - compute the average of an expression over the related individuals
• link.min(expr[, filter]) - compute the minimum of an expression over the related individuals
• link.max(expr[, filter]) - compute the maximum of an expression over the related individuals
example
entities:
household:
fields:
# period and id are implicit
- nb_persons: {type: int, initialdata: false}
links:
persons: {type: one2many, target: person, field: household_id}
processes:
household_composition:
- nb_persons: persons.count()
- nb_students: persons.count(workstate == 1)
- nb_children: persons.count(age <= 17)
- avg_age: persons.avg(age)
5.5.6 temporal functions
• lag(expr[, num_periods][, missing=value): value at previous period.
expr: any expression.
num_periods: optional argument specifying the number of periods to go back to. This can be either a
constant or a scalar expression. Defaults to 1.
18
Chapter 5. Processes
LIAM2 User Guide, Release 0.8.1
missing: the value to return for individuals which were not present in the past period. By default, it returns
the missing value corresponding to the type of the expression: -1 for an integer expression, nan for a float
or False for a boolean.
example
lag(age)
lag(age, missing=0)
avg(lag(age))
lag(avg(age))
lag(age, 2)
lag(lag(age))
#
#
#
#
#
#
#
the age each person had last year, -1 if newborn
the age each person had last year, 0 if newborn
average age that the current population had last year
average age of the population of last year
the age each person had two years ago (-1 for
newborns)
this is equivalent (but slightly less efficient)
• value_for_period(expr, period[, missing=value]): value at a specific period
expr: any expression.
period: the period used to evaluate the expression. This can be either a constant or a scalar expression.
missing: the value to return for individuals which were not present in the period. By default, it returns the
missing value corresponding to the type of the expression: -1 for an integer expression, nan for a float or
False for a boolean.
example
value_for_period(inwork and not male, 2002)
• duration(expr): number of consecutive period the expression was True
examples
duration(inwork and (earnings > 2000))
duration(educationlevel == 4)
• tavg(expr): average of an expression since the individual was created
example
tavg(income)
• tsum(expr): sum of an expression since the individual was created
5.5.7 random functions
• uniform: random numbers with a uniform distribution [0,1)
• normal: random numbers with a normal distribution
• gumbel: random numbers with a Gumbel distribution (also known as the Smallest Extreme
(SEV) distribution)
Value
• randint: random integers between bounds
example
# a random variable with the stdev derived from errsal
normal(loc=0.0, scale=std(errsal))
randint(0, 10)
choice
Monte Carlo or probabilistic simulation is a method for iteratively evaluating a deterministic model using sets
of random numbers as inputs. In microsimulation, the technique is used to simulate changes of state dependent
variables. Take the simplest example: suppose that we have an exogenous probability of an event happening,
5.5. Expressions
19
LIAM2 User Guide, Release 0.8.1
P(x=1), or not P(x=0). Then draw a random number u from an uniform [0,1) distribution. If, for individual i, ui <
P(x=1), then xi=1. If not, then xi=0. The expected occurrences of x after, say, 100 runs is then P(x=1) * 100 and
the expected value is 1xP(1)+0xP(0)=P(1). This type of simulation hinges on the confrontation between a random
variable and an exogenous probability.
In LIAM2, such a probabilistic simulation is called a choice process. Suppose i=1..n choice options, each with a
probability prob_option_i. A choice expression then has the following form:
choice([option_1, option_2, ..., option_n],
[prob_option_1, prob_option_2, ..., prob_option_n])
Note that both the list of options and their probabilities are between []’s. The options can be of any numeric type.
A simple example of a process using a choice expression is the simulation of the gender of newborns (51% males
and 49% females), as such:
gender: choice([True, False], [0.51, 0.49])
In the current version of LIAM2, it is not possible to combine a choice with alignment.
Here is a more complex example of a process using choice. Suppose we want to simulate the work status (blue
collar worker or white collar worker) for all working individuals. We want to assign 1 or 2 to their collar variable
based on their sex and level of education (education_level=2, 3, 4). We could write our process as follow:
collar_process:
- no_collar: WORKING and collar == -1
- collar: if(no_collar and (education_level == 2),
if(gender,
choice([1, 2], [0.836, 0.164]),
choice([1, 2], [0.687, 0.313]) ),
collar)
- collar: if(no_collar and (education_level == 3),
if(gender,
choice([1, 2], [0.643, 1 - 0.643]),
choice([1, 2], [0.313, 1 - 0.313]) ),
collar)
- collar: if(no_collar and (education_level == 4),
if(gender,
choice([1, 2], [0.082, 1 - 0.082]),
choice([1, 2], [0.039, 1 - 0.039]) ),
collar)
The procedure collar_process has collar as the key endogenous variable and has four sub-processes.
The first sub-process defines a local variable no_collar, which will be used to select those that the procedure should
apply to. These are all the workers that do not have a value for collar.
The next three sub-processes simulate the actual collar variable. If one meets the above no_collar filter and has
the lowest level of education (2), then one has a probability of about 83.6% (men) and 68.7% (women) of being a
blue collar worker. If one has “education_level” equal to 3, the probability of being a blue collar worker is lower
(64.3% for men and 31.3% for women), etc.
5.5.8 Regressions
logit_score
The logit of a number p between 0 and 1 is given by the formula:
logit(p) = log(p / (1 - p))
Its inverse, the logistic function has the interesting property that it can convert any real number into a probability.
logistic(a) = 1 / (1 + exp(-a))
20
Chapter 5. Processes
LIAM2 User Guide, Release 0.8.1
The logit_score function is a logistic with a random part:
logit_score(a) = logistic(a - logit(u))
where u is a random number from an uniform distribution [0, 1).
logit_score is very useful in behavioural equations. A behavioural equation starts by creating a score that reflects
the risk p*i of an event occuring. A typical usage is as follow:
- score_variable: if(condition_1,
logit_score(logit_expr_1),
if(condition_2,
logit_score(logit_expr_2),
-1))
However, the nested structure can make things less readable if you have many different conditions. In that case,
one would prefer the following longer form:
process_name:
# initialise the score to -1
- score_variable: -1
# first condition
- score_variable: if(condition_1,
logit_score(logit_expr_1),
score_variable)
# second condition
- score_variable: if(condition_2,
logit_score(logit_expr_2),
score_variable)
# ... other conditions ...
In a first sub-process, a variable score_variable is set equal to -1, because this makes it highly unlikely that the
event will happen to those not included in the conditions for which the logit is applied.
Next, subject to conditions condition_1 and condition_2, this score (risk) is simulated on the basis of estimated
logits. Note that by specifying the endogenous variable score_variable without any transformation in the “else”
conditions of the if functions makes sure that the score variable is not manipulated by a sub-process it does not
pertain to.
When the score is known, it can be either used as-is:
- event_happened: uniform() < score_variable
or in combination with an alignment (see below).
align
Now that we have computed a score (risk) for an event happening, we might want to use alignment so the number
of events occuring per category matches a proportion defined externaly.
There are different ways to choose which individuals are taken. The methodology used for now by LIAM2 is
called “alignment by sorting”, that is, for each category, the N individuals with the highest scores are selected.
The score computation is not done internally by the align() function, but is rather computed by an expression
given by the modeller. One will usually use logit_score() to compute it, but it can be computed in any other way a
modeller choose.
Note: It is usually a good idea to include a random component (like in logit_score) in the score expression
because otherwise the individuals with the smaller scores will never be selected.
To know more about the alignment process reading “Evaluating Alignment Methods in Dynamic Microsimulation
Models”, by Li and O’Donoghue is advised.
5.5. Expressions
21
LIAM2 User Guide, Release 0.8.1
An alignment expression takes the following general form:
align(score,
proportions
[, filter=conditions]
[, take=conditions]
[, leave=conditions]
[, expressions=expressions]
[, possible_values=pvalues]
[, frac_need="uniform"|"round"|"cutoff"])
For example, it could look like:
- unemp: align(unemp_score,
’al_p_unemployed_m.csv’,
filter=not ISINWORK and (age > 15) and (age < 65),
take=ISUNEMPLOYED,
leave=ISSTUDENT or ISRETIRED)
Now let us examine each argument in turn:
• score: it must be an expression (or a simple variable) returning a numerical value. It will be used to rank
individuals. One will usually use logit_score() to compute the score, but it can be computed in any other
way a modeller choose. Note that the score is not modified in any way within the align() function, so if one
wants a random factor, it should be added manually (or through the use of a function like logit_score which
includes one).
• proportions: the target proportions for each category. This argument can take many forms. The most
common one will probably be a string holding the name of a file containing the alignment data (like in the
example above) but it can be any of the following:
– a single scalar, for aligning with a constant proportion.
– a list of scalars, for aligning with constant proportions per category.
– an expression returning a single scalar.
– an expression returning an n-dimensional array. expressions and possible values will be retrieved from
that array, so you can simply use:
align(score_expr, array_expr)
– a list of expressions returning scalars [expr1, expr2].
– a string treated as a filename. That file should be in the “array” format described in the Importing data
section. In that case, the proportions, expressions (column names) and possible values are read from
that file. The “fname” argument which used to be the way to define this is still supported for backward
compatibility.
There is no technical restriction on names for files containing alignment data but, by convention, they
usually use the following pattern: start with the prefix al_ followed by the name of the endogenous
variable and a suffix _m or _f, depending on gender.
• filter: an expression specifying which individuals to take into account for the alignment. Note that if the
align() function is used inside an if() expression, its filter is adjusted accordingly (“anded” with the filter of
the if() expression). For example:
- aligned: if(condition,
align(score_expr1, ’filename1.csv’),
align(score_expr2, ’filename2.csv’))
is equivalent to:
- aligned1: align(score_expr1, ’filename1.csv’, filter=condition)
- aligned2: align(score_expr2, ’filename2.csv’, filter=not condition)
- aligned: if(condition, aligned1, aligned2)
22
Chapter 5. Processes
LIAM2 User Guide, Release 0.8.1
• take: an expression specifying individuals which should always be selected, regardless of their score. This
argument should be used with care as those individuals will be selected unconditionally, even if that means
overflowing the number of individuals desired to satisfy the alignment.
Suppose that the alignment specifies that 10 individuals should experience a certain event, and that there
are 3 individuals who meet the conditions specified in the take. Then these 3 individuals will be selected a
priori (irrespective of their score) and the alignment process will select the remaining 7 candidates from the
rest of the sample.
A “softer” alternative can be easily achieved by setting a very high score for individuals to be taken first.
• leave: an expression specifying individuals which should never be selected, regardless of their score. This
argument should be used with care as those individuals will never be selected, even if that cause the target
number of individuals for some categories to not be reached.
A “softer” alternative can be easily achieved by setting a very low score for individuals to be taken last.
Note: Note that even if the score for an individual is -1 (or any other negative number), it can still be
selected by the alignment expression. This happens when there are not enough candidates (selected by the
filter) to meet the alignment needs.
• expressions: specify the expressions used to partition the individuals into the different alignment categories.
If proportions is a file name, the column names declared in the file are used by default, but they can be
overridden using this argument. For example:
align(0.0, ’al_p_dead.csv’, expressions=[gender, age + 1])
• possible_values: specify the different values for each of the expressions in the expressions argument that
should be evaluated. The combination of the different lists of possible values will form all the alignment
categories. For example:
align(0.0,
proportions=[0.1, 0.2, 0.3, 0.4],
expressions=[gender, age < 50],
possible_values=[[False, True], [False, True]])
• frac_need: control how “fractional needs” are handled. This argument can take any of three values: “uniform” (default), “cutoff” or “round”.
– “uniform” draws a random number (u) from an uniform distribution and adds one individual if u <
fractional_need. “uniform” is the default behavior.
– “round” simply rounds needs to the nearest integer. In other words, one individual is added for a
category if the fractional need for that category is >= 0.5.
– “cutoff” tries to match the total need as closely as possible (at the expense of a slight loss of precision
for individual categories) by searching for the “cutoff point” that yields:
count(frac_need >= cutoff) == sum(frac_need)
In practice alignment data is often separate for men and women. In that case, one will usually use the following
form:
- variable: if(condition,
if(gender,
align(score_expr, ’filename_m.csv’),
align(score_expr, ’filename_f.csv’)),
False)
Since LIAM2 supports alignment with any number of dimensions, one could also merge both data files in a single
file with one more dimension and use a single align() expression:
- variable: if(condition,
align(score_expr, ’filename_m_and_f.csv’),
5.5. Expressions
23
LIAM2 User Guide, Release 0.8.1
False)
# or even
- variable: align(score_expr, ’filename_m_and_f.csv’, filter=condition)
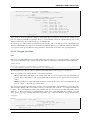
In the example below describes the process of getting (or keeping) a job:
inwork:
- work_score: -1
# men
- work_score: if(ISMALE and ACTIVEAGE and ISINWORK,
logit_score(-0.196599 * age + 0.0086552 * age **2 - 0.000988 *
+ 0.1892796 * ISMARRIED + 3.554612),
work_score)
- work_score: if(ISMALE and ACTIVEAGE and (ISUNEMPLOYED or ISOTHERINACTIVE),
logit_score(0.9780908 * age - 0.0261765 * age **2 + 0.000199 *
- 12.39108),
work_score)
# women
- work_score: if(ISFEMALE and ACTIVEAGE and ISINWORK,
logit_score(-0.2740483 * age + 0.0109883 * age **2 - 0.0001159
- 0.0906834 * ISMARRIED + 3.648706),
work_score)
- work_score: if(ISFEMALE and ACTIVEAGE and (ISUNEMPLOYED or ISOTHERINACTIVE),
logit_score(0.8217638 * age - 0.0219761 * age **2 + 0.000166 *
- 0.5590975 * ISMARRIED - 10.48043),
work_score)
- work: if(ACTIVEAGE,
if(ISMALE,
align(work_score, ’al_p_inwork_m.csv’,
leave=ISSTUDENT or ISRETIRED),
align(work_score, ’al_p_inwork_f.csv’,
leave=ISSTUDENT or ISRETIRED)),
False)
The first sub process illustrates a “soft leave” by setting the score variable work_score to -1. This makes sure that
the a priori selection probability is very low (but not zero, as in the case of leave conditions) for those who satisfy
the filter of the alignment but for which a score is not explicitly specified the subsequent processes.
Next come four if conditions, separating the various behavioural equations to the sub-sample they pertain to. The
first two conditions pertain to men and respectively describe the probability of keeping a job and getting a job.
The next two conditions describe the same transitions but for women.
The last sub-process describes the alignment process itself. Alignment is applied to individuals between the age
of 15 and 65. The input-files of the alignment process are ‘al_p_inwork_m.csv’ and ‘al_p_inwork_f.csv’. The
alignment process uses as input the scores simulated previously, and the information in the alignment files and
sets the boolean variable work. No “take” or “leave” conditions are used in this case.
align_abs
align_abs is equivalent to align(), except that it aligns to absolute numbers instead of proportions. It also supports
a few additional arguments to work on a linked entity.
The general form of align_abs is :
align_abs(score,
need,
[, filter=conditions]
[, take=conditions]
[, leave=conditions]
[, expressions=expressions]
[, possible_values=pvalues]
[, frac_need="uniform"|"round"|"cutoff"]
24
Chapter 5. Processes
age **3
age **3
* age **3
age **3
LIAM2 User Guide, Release 0.8.1
[, link=link_name]
[, secondary_axis=column_name]
[, errors="default"|"carry"])
In addition to all the arguments supported by align(), align_abs() also supports an optional “link” argument, which
makes it work on a linked entity.
Here is a description of the arguments specific to align_abs:
• link: must be the name of a one2many link. When the link argument is used, the groups (given by the
alignment file or in the expressions argument) are evaluated on the linked entity and the needs are expressed
in terms of that linked entity. When the link argument is in effect, align_abs uses the “Chenard” algorithm.
This can be used, for example, to take as many households as necessary trying to get as close as possible to
a particular distribution of persons.
• secondary_axis: name of an axis which will influence rel_need when the subtotal for that axis is exceeded.
See total_by_sex in Chenard. secondary_axis can only be used in combination with the link argument and
it must be one of the alignment columns.
• errors: if set to ‘carry’, the error for a period (difference between the number of individuals aligned and
the target for each category) is stored and added to the target for the next period. In the current version of
LIAM2, errors can only be used in combination with the link argument.
example
test_align_link:
# this is a procedure defined at the level of households
- num_persons: persons.count()
- total_population: sum(num_persons)
# MIG_PERCENT is a simple float periodic global
- num_migrants: total_population * MIG_PERCENT
#
#
#
#
#
#
#
#
#
-
MIG is a 3d array: age - gender - period but we want only the
2d array for this period.
currently, we need to manually compute the index (0-based)
for the current period in the array. We know the first
period in our array is 2000, so the index for the current
period is: "period - 2000"
period is the last dimension of the array and we do not
want to modify other dimensions, so we use ":" for those
dimensions.
mig_period: MIG[:,:,period - 2000]
# Distribute total desired migrants, by age and gender
- need: num_migrants * mig_period
# households have a 50% chance to be candidate for immigration
- is_candidate: uniform() < 0.5
#
#
#
-
apply alignment, using the number of persons in each household
as a score, so that households with more persons are tried first
as this gives better results.
aligned: align_abs(num_persons, need,
filter=is_candidate,
link=persons, secondary_axis=gender,
errors=’carry’)
logit_regr
logit_regr is a shortcut form to call logit_score and “evaluate whether the event happened” in a single function.
Thus, the function returns a boolean: True for individuals which are selected, False for all others. Its general form
5.5. Expressions
25
LIAM2 User Guide, Release 0.8.1
is:
- aligned: logit_regr(expression,
[, filter=conditions]
[, align=proportions])
The align argument supports all the same formats than the proportions argument of align(): filename, percentage,
list of values, ...
Evaluation whether the event happens is done differently whether the align argument is used or not. If alignment
is used, logit_regr is equivalent to:
- aligned: align(logit_score(expression), proportions, filter=conditions)
Without align argument, the condition for the event occurring is p*i > 0.5, which means that in this form, logit_regr
is equivalent to:
- aligned: if(conditions, logit_score(expression) > 0.5, False)
example
- to_give_birth: logit_regr(0.0,
filter=FEMALE and (age >= 15) and (age <= 50),
align=’al_p_birth.csv’)
other regressions
• Continuous (expr + normal(0, 1) * mult + error_var): cont_regr(expr[, filter=None, mult=0.0, error_var=None])
• Clipped continuous (always positive): clip_regr(expr[, filter=None, mult=0.0, error_var=None])
• Log continuous (exponential of continuous): log_regr(expr[, filter=None, mult=0.0, error_var=None])
5.5.9 Matching function
matching: (aka Marriage market) matches individuals from set 1 with individuals from set 2. For each individual
in set 1 following a particular order (given by the expression in the orderby argument), the function computes the
score of all (unmatched) individuals in set 2 and take the best scoring one.
One has to specify the boolean filters which provide the two sets to match (set1filter and set2filter), the criterion
to decide in which order the individuals of the first set are matched and the expression that will be used to assign
a score to each individual of the second set (given a particular individual in set 1).
In the score expression the fields of the set 1 individual can be used normally and the fields of its possible partners
can be used by prefixing them by “other.”.
The matching function returns the identification number of the matched individual for individuals which were
matched, -1 for others.
If the two sets are of different sizes, the excedent of the largest set is simply ignored.
generic setup
matching(set1filter=boolean_expr,
set2filter=boolean_expr,
orderby=difficult_match,
score=coef1 * field1 + coef2 * other.field2 + ...)
example
marriage:
- to_couple: not in_couple and age >= 18 and age <= 90
- avg_age_males_to_couple: avg(age, filter=to_couple and MALE)
26
Chapter 5. Processes
LIAM2 User Guide, Release 0.8.1
- difficult_match: if(to_couple and FEMALE,
abs(age - avg_age_males_to_couple),
nan)
- partner_id: if(to_couple,
matching(set1filter=FEMALE, set2filter=MALE,
orderby=difficult_match,
score=- 0.4893 * other.age
+ 0.0131 * other.age ** 2
- 0.0001 * other.age ** 3
+ 0.0467 * (other.age - age)
- 0.0189 * (other.age - age) ** 2
+ 0.0003 * (other.age - age) ** 3
- 0.9087 * (other.work and not work)
- 1.3286 * (not other.work and work)
- 0.6549 * (other.work and work)),
partner_id)
The code above shows an application. First, we decided that all persons between 18 and 90 years old who are not
part of a couple are candidate for marriage. Next, for each candidate women, the variable difficult_match is the
difference between her age and the average age of candidate men.
In a third step, for each candidate woman in turn (following the order set by difficult_match), all candidate men
which are still available are assigned a score and the man with the highest score is matched with that woman. This
score depends on his age, his difference in age with the woman and the work status of the potential partners.
5.5.10 Lifecycle functions
new
new creates new individuals. It can create individuals of the same entity (eg. a women gives birth) or another entity
(eg. a person‘s marriage creates a new houshold). The function returns the id of the newly created individuals.
generic format
new(’entity_name’[, filter=expr][, number=value]
*set initial values of a selection of variables*)
The first argument specifies the entity in which the individuals will be created (eg person, household, ...).
Then, one should use one of either the filter or the number argument.
• filter specifies which individuals of the current entity will serve as the origin for the new individuals (for
persons, that would translate to who is giving birth, but the function can of course be used for any kind of
entity).
• number specifies how many individuals need to be created. In this version, those new individuals do not
have an “origin”, so they can copy value from it.
Any subsequent argument specifies values for fields of the new individuals. Any field which is not specified there
will receive the missing value corresponding to the type of the field (‘nan’ for floats, -1 for integers and False for
booleans). Those extra arguments can be given constants, but also any expression (possibly using links, random
functions, ...). Those expressions are evaluated in the context of the origin individuals. For example, you could
write “mother_age = age”, which would set the field “mother_age” on the new children to the age of their mother.
example 1
birth:
- to_give_birth: logit_regr(0.0,
filter=not gender and
(age >= 15) and (age <= 50),
align=’al_p_birth.csv’)
- new(’person’, filter=to_give_birth,
mother_id = id,
5.5. Expressions
27
LIAM2 User Guide, Release 0.8.1
father_id = partner.id,
household_id = household_id,
partner_id = -1,
age = 0,
civilstate = SINGLE,
gender=choice([True, False], [0.51, 0.49]) )
The first sub-process (to_give_birth) is a logit regression over women (not gender) between 15 and 50 which
returns a boolean value whether that person should give birth or not. The logit itself does not have a deterministic
part (0.0), which means that all women that meet the above condition are equally likely to give birth (they are
selected randomly). This process is also aligned on the data in ‘al_p_birth.csv’.
In the above case, a new person is created for each time a woman is selected to give birth. Secondly, a number
of links are established: the value for the mother_id field of the child is set to the id-number of his/her mother,
the child’s father is set to the partner of the mother, the child receives the household number of his/her mother,
... Finally some variables of the child are set to specific initial values: the most important of these is its gender,
which is the result of a simple choice process.
new can create individuals of different entities; the below procedure get_a_life makes sure that all those who are
single when they are 24 year old, leave their parents’ household for their own household. The region of this new
household is created randomly through a choice-process.
example 2
get_a_life:
- household_id: if(ISSINGLE and age == 24,
new(’household’,
region_id=choice([0, 1, 2, 3],
[0.1, 0.2, 0.3, 0.4])),
household_id)
clone
clone is very similar to new but is intended for cases where most or all variables describing the new individual
should be copied from his/its parent/origin instead of being set to “missing”. With clone, you cannot specify what
kind of entity you want to create, as it is always the same as the origin item. However, similarly to new, clone
also allows fields to be specified manually by any expression evaluated on the parent/origin.
Put differently, a new with no fields mentioned will result in a new item of which the initial values of the fields are
all set to missing and have to be filled through simulation; on the contrary, a clone with no fields mentioned will
result in a new item that is an exact copy of the origin except for its id number which is always set automatically.
example
make_twins:
- clone(filter=new_born and is_twin,
gender=choice([True, False], [0.51, 0.49]))
remove
remove removes items from an entity dataset. With this command you can remove obsolete items (eg. dead
persons, empty households) thereby ensuring they are not simulated anymore. This will also save some memory
and, in some cases, improve simulation speed.
The procedure below simulates whether an individual survives or not, and what happens in the latter case.
dead_procedure:
# decide who dies
- dead: if(gender,
logit_regr(0.0, align=’al_p_dead_m.csv’),
logit_regr(0.0, align=’al_p_dead_f.csv’))
28
Chapter 5. Processes
LIAM2 User Guide, Release 0.8.1
#
#
#
-
change the civilstate of the suriving partner
civilstate: if(partner.dead, 5, civilstate)
break the link to the dead partner
partner_id: if(partner.dead, -1, partner_id)
remove the dead
remove(dead)
The first sub-procedure dead simulates whether an individual is ‘scheduled for death’, using again only a logistic
stochastic variable and the age-gender-specific alignment process. Next some links are updated for the surviving
partner. The sub-procedure civilstate puts the variable of that name equal to 5 (which means that one is a widow(er)
for those individuals whose partner has been scheduled for death. Also, in that case, the partner identification
code is erased. All other procedures describing the heritage process should be included here. Finally, the remove
command is called to removes the dead from the simulation dataset.
5.6 Output
LIAM2 produces simulation output in three ways. First of all, by default, the simulated datasets are stored in hdf5
format. These can be accessed at the end of the run. You can use several tools to inspect the data.
You can display information during the simulation (in the console log) using the show function. You can write that
same information to csv files using the csv function. You can produce tabular data by using the dump or groupby
functions.
In the interactive console, you can use any of those output functions to inspect the data interactively.
5.6.1 show
show evaluates expressions and prints the result to the console log. Note that, in the interactive console, show is
implicit on all commands, so you do not need to use it. show has the following signature:
show(expr1[, expr2, expr3, ...])
example 1
show(count(age >= 18))
show(count(not dead), avg(age, filter=not dead))
The first process will print out the number of persons of age 18 and older in the dataset. The second one displays
the number of living people and their average age.
example 2
show("Count:", count(),
"Average age:", avg(age),
"Age std dev:", std(age))
gives
Count: 19944 Average age: 42.7496991576 Age std dev: 21.9815913417
Note that you can use the special character “\n” to display the rest of the result on the next line.
example 3
show("Count:", count(),
"\nAverage age:", avg(age),
"\nAge std dev:", std(age))
gives
5.6. Output
29
LIAM2 User Guide, Release 0.8.1
Count: 19944
Average age: 42.7496991576
Age std dev: 21.9815913417
5.6.2 qshow
qshow evaluates expressions and prints their results to the console log alongside the “textual form” of the expressions. If several expressions are given, they are each printed on a separate line. qshow usage is exactly the same
than show.
example
qshow(count(), avg(age), std(age))
will give:
count(): 19944
avg(age): 42.7496991576
std(a=age): 21.9815913417
5.6.3 csv
The csv function writes values to csv files.
csv(expr1[, expr2, expr3, ...,
[suffix=’file_suffix’][, fname=’filename’][, mode=’w’])
‘suffix’, ‘fname’ and ‘mode’ are optional arguments. By default (if neither ‘fname’ nor ‘suffix’ is used), the name
of the csv file is generated using the following pattern: “{entity}_{period}.csv”.
example
csv(avg(income))
will create one file for each simulated period. Assuming, start_period is 2002 and periods is 2, it will create two
files: “person_2002.csv” and “person_2003.csv” with the average income of the population for period 2002 and
2003 respectively.
Arguments:
• ‘suffix’ allows to customize the name of the files easily. When it is used, the files are named using the
following pattern: “{entity}_{period}_{suffix}.csv”.
example
csv(avg(income), suffix=’income’)
would create “person_2002_income.csv” and “person_2003_income.csv”.
• ‘fname’ allows defining the exact file name or pattern to use. You can optionally use the ‘{entity}’ and
‘{period}’ key words to customize the name.
example
csv(avg(income), fname=’income{period}.csv’)
would create “income2002.csv” and “income2003.csv”.
• ‘mode’ allows appending (mode=’a’) to a csv file instead of overwriting it (mode=’w’ by default). This
allows you, for example, to store the value of some expression for all periods in the same file (instead of
one file per period by default).
example
30
Chapter 5. Processes
LIAM2 User Guide, Release 0.8.1
csv(period, avg(income), fname=’avg_income.csv’, mode=’a’)
Note: Unless you erase/overwrite the file one way or another between two runs of a simulation, you will
append the data of the current simulation to that of the previous one. One way to do overwrite the file
automatically at the start of a simulation is to have a procedure in the init section without mode=’a’.
If you want that file to start empty, you can do so this way:
csv(fname=’avg_income.csv’)
If you want some headers in your file, you could write them at that point:
csv(’period’, ’average income’, fname=’avg_income.csv’)
When you use the csv() function in combination with (at least one) table expressions (see dump and groupby
functions below), the results are appended below each other.
csv(table_expr1, ’and here goes another table’, table_expr2,
fname=’tables.csv’)
Will produce a file with a layout like this:
| table 1 value at row 1, col 1
|
...
|
row N, col 1
| and here goes another table
| table 2 value at row 1, col 1
|
...
|
row N, col 1
| col 2 |
...
|
... |
...
| col 2 |
...
|
|
|
... | col N
|
... |
...
|
... | col N
| col N |
|
... |
| col N |
|
|
|
|
|
|
|
|
You can also output several rows with a single command by enclosing values between brackets:
csv([row1value1, ..., row1valueN],
...
[rowNvalue1, ..., rowNvalueN],
fname=’several_rows.csv’)
example
csv([’this is’, ’a header’],
[’with’, ’several lines’],
fname=’person_age_aggregates.csv’)
Will produce a file with a layout like this:
| this is | a header
|
| with
| several lines |
5.6.4 dump
dump produces a table with the expressions given as argument evaluated over many (possibly all) individuals of
the dataset.
general format
dump([expr1, expr2, ...,
filter=filterexpression, missing=value, header=True])
If no expression is given, all fields of the current entity will be dumped (including temporary variables available
at that point), otherwise, each expression will be evaluated on the objects which satisfy the filter and produce a
table.
5.6. Output
31
LIAM2 User Guide, Release 0.8.1
The ‘filter’ argument allows to evaluate the expressions only on the individuals which satisfy the filter. Defaults
to None (evaluate on all individuals).
The ‘missing’ argument can be used to transform ‘nan’ values to another value. Defaults to None (no transformation).
The ‘header’ argument determine whether column names should be in the dump or not. Defaults to True.
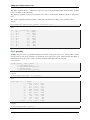
example
show(dump(age, partner.age, gender, filter=id < 10))
gives
id
0
1
2
3
4
5
6
7
8
9
| age | partner.age | gender
| 27 |
-1 | False
| 86 |
71 | False
| 16 |
-1 |
True
| 19 |
-1 | False
| 27 |
21 | False
| 89 |
92 |
True
| 59 |
61 |
True
| 65 |
29 | False
| 38 |
35 |
True
| 48 |
52 |
True
5.6.5 groupby
groupby (aka pivot table): group all individuals by their value for the given expressions, and optionally compute
an expression for each group (using the expr argument). If no expression is given, it will compute the number of
individuals in that group. A filter can be specified to limit the individuals taken into account.
general format
groupby(expr1[, expr2, expr3, ...]
[, expr=expression]
[, filter=filterexpression]
[, percent=True],
[, pvalues=possible_values])
example
show(groupby(trunc(age / 10), gender))
gives
trunc((age / 10)) | gender |
|
| False | True | total
0 |
818 | 803 | 1621
1 |
800 | 800 | 1600
2 |
1199 | 1197 | 2396
3 |
1598 | 1598 | 3196
4 |
1697 | 1696 | 3393
5 |
1496 | 1491 | 2987
6 |
1191 | 1182 | 2373
7 |
684 | 671 | 1355
8 |
369 | 357 |
726
9 |
150 | 147 |
297
total | 10002 | 9942 | 19944
example
show(groupby(inwork, gender))
32
Chapter 5. Processes
LIAM2 User Guide, Release 0.8.1
gives
inwork | gender |
|
| False | True | total
False |
6170 | 5587 | 11757
True |
3832 | 4355 | 8187
total | 10002 | 9942 | 19944
example
show(groupby(inwork, gender, percent=True))
gives
inwork |
|
False |
True |
total |
gender |
False | True
30.94 | 28.01
19.21 | 21.84
50.15 | 49.85
|
| total
| 58.95
| 41.05
| 100.00
example
groupby(workstate, gender, expr=avg(age))
gives the average age by workstate and gender
workstate | gender |
|
| False | True | total
1 | 41.29 | 40.53 | 40.88
2 | 40.28 | 44.51 | 41.88
3 |
8.32 | 7.70 | 8.02
4 | 72.48 | 72.27 | 72.38
5 | 42.35 | 46.56 | 43.48
total | 42.67 | 42.38 | 42.53
As of version 0.6, groupby can also be used in larger expressions. This can be used for example to compute
alignment targets on the fly:
#
-
see note below about expr=count(condition) vs filter=condition
men_by_age: groupby(age, expr=count(gender))
men_prop_by_age: men_by_age / groupby(age)
aligned: align(proportions=men_prop_by_age)
Note that there is a subtle difference between using “filter=condition” and “expr=count(condition))”. The former
will not take the filtered individuals into account at all, while the later will take them into account but not count
them. This can make a difference on the output if there are some empty categories, and this can be important
when using the result of a groupby inside a larger expression (as above) because it can only work with arrays of
the same size. Compare :
groupby(civilstate, filter=age > 80)
civilstate |
|
|
1 |
3 | 4 | total
542 | 150 | 85 |
777
with
groupby(civilstate, expr=count(age > 80))
civilstate |
|
|
|
1 | 2 |
3 | 4 | total
542 | 0 | 150 | 85 |
777
The expr argument will usually be used with an aggregate function, but it also supports normal expressions, in
which case the values for each individual will be displayed in a list. This feature should only be used with care
5.6. Output
33
LIAM2 User Guide, Release 0.8.1
and usually in combination with a strong filter to avoid producing extremely large tables which would take forever
to display.
groupby(agegroup_civilstate, gender, expr=id, filter=id < 20)
agegroup_civilstate |
|
0 |
[0
5 |
[8
10 |
[14
total | [0 1 4
| 12 14
|
gender
False
1 4 6]
10 12]
16 18]
6 8 10
16 18]
|
|
True
|
[2 3 5 7]
|
[9 11 13]
| [15 17 19]
| [2 3 5 7 9
| 11 13 15 17
|
19]
|
|
|
|
|
|
|
|
total
[0 1 4 6 2 3 5 7]
[8 10 12 9 11 13]
[14 16 18 15 17 19]
[0 1 4 6 8 10 12 14
16 18 2 3 5 7 9 11
13 15 17 19]
or
groupby(civilstate, gender, expr=age, filter=id > 100 and id < 110)
civilstate |
gender
|
False
1 |
[46 47]
2 |
[47]
4 |
[46]
total | [46 47 47 46]
|
|
True
|
[46 47 47]
|
[45 46]
|
[]
| [46 47 47 45 46]
|
|
total
|
[46 47 46 47 47]
|
[47 45 46]
|
[46]
| [46 47 47 46 46 47 47 45 46]
5.6.6 charts
New in version 0.8. LIAM2 has some charting capabilities, courtesy of matplotlib. They are available both during
a simulation and in the interactive console. Each of the following functions is designed around the function of the
same name in matplotlib. Even though we have tried to stay as close as possible to their API, their implementation
in LIAM2 has a few differences, in particular we added a few arguments which are available in most functions.
• fname: name of the file to save the chart to. The file format is automatically deduced from the file extension.
You can optionally use the ‘{entity}’ and ‘{period}’ key words to customize the name. You can save
the same chart to several formats at once by using ‘&’ in the extension. For example: plot(expr,
fname=’plot03.png&pdf’) will write the chart to both plot03.png and plot03.pdf. If the
fname argument is not used, a window will open to view and interact with the figure using a navigation
toolbar. See matplotlib navigation toolbar documentation for more details.
Note: Keyboard shortcuts mentioned on that page currently do not work.
• suffix: a more concise alternative to set the name of the file the chart will be saved to. When it is used, the
files are named using the following pattern: {entity}_{period}_{suffix}.png. For example:
bar(expr, suffix=’income’)
would create “person_2002_income.png”, “person_2003_income.png”, etc.
• colors: a list of the colors to be used for the chart. See matplotlib colors documentation for the different
ways you can specify colors. For example:
bar(expr, colors=[’r’, ’g’, ’b’])
will make a bar chart with red, green and blue bars.
Note: boxplot() does not support the colors argument.
• grid (False|True): determine whether to display a grid (in addition to axes ticks). It defaults to True for bar()
and plot() and to False for boxplot() and stackplot().
34
Chapter 5. Processes
LIAM2 User Guide, Release 0.8.1
Note: pie() does not support the grid argument.
• maxticks: limit the number of axes ticks. It defaults to 20 for all charts except bar3d where it defaults to 10.
Note: pie() does not support the maxticks argument.
bar charts
New in version 0.8. bar can be used to draw bar charts. It uses matplotlib.pyplot.bar and inherits all of its keyword
arguments. There are 3 ways to use it:
bar(1d_expr, ...)
bar(1d_expr1, 1d_expr2, ...)
bar(2d_expr, ...)
In the first two 1d_expr is (an expression returning) a one-dimensional array (for example an entity field or a
groupby expression with only one dimension). For example:
bar(groupby(agegroup))
would produce:
1600
1400
1200
1000
800
600
400
200
0
0
5 10 15 20 25 30 35 40 45 50 60 70 80 90
agegroup
If one passes several arrays/expressions, they will be stacked on each other.
bar(groupby(agegroup, filter=not gender),
groupby(agegroup, filter=gender))
5.6. Output
35
LIAM2 User Guide, Release 0.8.1
1600
0
1
1400
1200
1000
800
600
400
200
0
0
5 10 15 20 25 30 35 40 45 50 60 70 80 90
agegroup
Alternatively, one can pass (an expression returning) a two-dimensional array, in which case, the first dimension
will be “stacked”: for each possible value of the first dimension, there will be a bar “part” with a different color.
- bar(groupby(eduach, agegroup))
36
Chapter 5. Processes
LIAM2 User Guide, Release 0.8.1
1600
eduach
2
3
4
1400
1200
1000
800
600
400
200
0
0
5 10 15 20 25 30 35 40 45 50 60 70 80 90
agegroup
plot
New in version 0.8. plot can be used to draw (line) plots. It uses matplotlib.pyplot.plot and inherits all of its
keyword arguments. There are 4 ways to use it:
plot(1d_expr, ...)
plot(1d_expr1, 1d_expr2, ...)
plot(2d_expr, ...)
plot(1d_expr1, style_str1, 1d_expr2, style_str2, ...)
In the first two 1d_expr is (an expression returning) a one-dimensional array (for example an entity field or a
groupby expression with only one dimension). For example:
plot(groupby(age))
5.6. Output
37
LIAM2 User Guide, Release 0.8.1
200
150
100
50
0
0 5 10 15 20 25 30 35 40 45 50 55 60 65 70 75 80 85 90
age
If one passes several expressions, each will be plotted as a different line.
plot(groupby(age),
groupby(age, filter=not gender),
groupby(age, filter=gender))
38
Chapter 5. Processes
LIAM2 User Guide, Release 0.8.1
200
0
1
2
150
100
50
0
0 5 10 15 20 25 30 35 40 45 50 55 60 65 70 75 80 85 90
age
The third option is to pass (an expression returning) a two-dimensional array (plot(2d_expr, ...)) in
which case, there will be one line for each possible value of the first dimension and the second dimension will be
plotted along the x axis. For example:
plot(groupby(gender, age))
5.6. Output
39
LIAM2 User Guide, Release 0.8.1
120
100
gender
False
True
80
60
40
20
0
0 5 10 15 20 25 30 35 40 45 50 55 60 65 70 75 80 85 90
age
and, using a few of the many possible options to customize the appearance:
plot(groupby(gender, agegroup),
grid=False, linestyle=’dashed’, marker=’o’, linewidth=5)
40
Chapter 5. Processes
LIAM2 User Guide, Release 0.8.1
800
gender
False
True
700
600
500
400
300
200
100
0
0
5
10 15 20 25 30 35 40 45 50 60 70 80 90
agegroup
And the fourth and last option is to alternate expressions returning one-dimensional arrays with styles strings
(plot(1d_expr1, style_str1, 1d_expr2, style_str2, ...)) which allows each line/array to
be plotted with a different style. See plot documentation for a description of possible styles strings.
Note: Styles including a color (as explained in the matplotlib documentation – eg ‘bo’) are not supported by
our implementation. Colors should rather be set using the colors argument (as explained above and shown in the
example below).
Example:
plot(groupby(agegroup, expr=count(not gender)), ’o--’,
groupby(agegroup, expr=count(gender)), ’s-.’,
groupby(agegroup), ’*-’
colors=[’r’, ’g’, ’b’])
5.6. Output
41
LIAM2 User Guide, Release 0.8.1
1600
0
1
2
1400
1200
1000
800
600
400
200
0
0
5
10 15 20 25 30 35 40 45 50 60 70 80 90
agegroup
stackplot
New in version 0.8. stackplot can be used to draw stacked (line) plots. It uses matplotlib.pyplot.stackplot and
inherits all of its keyword arguments. There are two ways to use it:
stackplot(1d_expr1, 1d_expr2, ...)
stackplot(2d_expr, ...)
Example:
stackplot(groupby(eduach, age))
42
Chapter 5. Processes
LIAM2 User Guide, Release 0.8.1
200
150
eduach
2
3
4
100
50
0
0 5 10 15 20 25 30 35 40 45 50 55 60 65 70 75 80 85 90
age
pie charts
New in version 0.8. pie can be used to draw pie charts. It uses matplotlib.pyplot.pie and inherits all of its keyword
arguments. It should be used like this:
pie(1d_expr1, ...)
Where 1d_expr is (an expression returning) a one-dimensional array (for example an entity field or a groupby
expression with only one dimension). Examples:
pie(groupby(eduach))
pie(groupby(eduach),
explode=[0.1, 0, 0],
labels=[’Lower secondary’, ’Upper secondary’, ’Tertiary’])
5.6. Output
43
LIAM2 User Guide, Release 0.8.1
eduach
4
24.4%
2
40.1%
35.5%
3
eduach
Tertiary
24.4%
Lower secondary
40.1%
35.5%
Upper secondary
44
Chapter 5. Processes
LIAM2 User Guide, Release 0.8.1
scatter plots
New in version 0.8. scatter can be used to draw scatter plots. It uses matplotlib.pyplot.scatter and inherits all of
its keyword arguments. It should be used like this:
scatter(x_expr, y_expr, ...)
Where both x_expr and y_expr are (expressions returning) one-dimensional arrays (for example an entity field or
a groupby expression with only one dimension).
Optional keyword arguments include (among others, see above link):
• c: to set the color of each circle. A color will be assigned for each different value of this argument.
• s: to set the surface of each circle (mutually exclusive with the r argument).
• r: to set the radius of each circle (r=expr is equivalent to s=pi * expr ** 2). It is mutually exclusive with
the s argument. The r argument is specific to liam2.
Examples:
-
salary: 10000 + uniform() * 50000
area: 3.1415 * (4 + 1.5 * children.count()) ** 2
scatter(age, salary, c=eduach, s=area, alpha=0.5s, grid=True)
scatter(normal(), normal(), c=age, r=2 ** eduach)
70000
2
3
4
60000
50000
40000
30000
20000
10000
0
20
5.6. Output
0
20
40
60
80
100
45
LIAM2 User Guide, Release 0.8.1
3
90
80
2
70
1
60
0
50
1
40
30
2
20
3
4
10
3
2
1
0
1
2
3
boxplot
New in version 0.8. boxplot can be used to draw box plots. It uses matplotlib.pyplot.boxplot and inherits all of its
keyword arguments. There are two ways to use it:
boxplot(1d_expr1, 1d_expr2, ...)
boxplot(2d_expr, ...)
Examples:
- boxplot(age[gender], age[not gender])
- boxplot(groupby(eduach, expr=age, filter=eduach != -1))
46
Chapter 5. Processes
LIAM2 User Guide, Release 0.8.1
100
80
60
40
20
0
0
1
100
80
60
40
20
0
5.6. Output
2
3
eduach
4
47
LIAM2 User Guide, Release 0.8.1
5.7 Debugging and the interactive console
LIAM2 features an interactive console which allows you to interactively explore the state of the memory either
during or after a simulation completed.
You can reach it in two ways. You can either pass “-i” as the last argument when running the executable, in which
case the interactive console will launch after the whole simulation is over. The alternative is to use breakpoints in
your simulation to interrupt the simulation at a specific point (see below).
Type “help” in the console for the list of available commands. In addition to those commands, you can type any
expression that is allowed in the simulation file and have the result directly. Show is implicit for all operations.
examples
>>> avg(age)
53.7131819615
>>> groupby(trunc(age / 20), gender, expr=count(inwork))
trunc(age / 20) | gender |
|
| False | True | total
0 |
14 |
18 |
32
1 |
317 | 496 |
813
2 |
318 | 258 |
576
3 |
40 | 102 |
142
4 |
0 |
0 |
0
5 |
0 |
0 |
0
total |
689 | 874 | 1563
5.7.1 breakpoint
breakpoint: temporarily stops execution of the simulation and launch the interactive console. There are two
additional commands available in the interactive console when you reach it through a breakpoint: “step” to execute
(only) the next process and “resume” to resume normal execution.
general format
breakpoint([period])
the “period” argument is optional and if given, will make the breakpoint interrupt the simulation only
for that period.
example
marriage:
- in_couple: MARRIED or COHAB
- breakpoint(2002)
- ...
5.7.2 assertions
Assertions can be used to check that your model really produce the results it should produce. The behavior when
an assertion fails is determined by the assertions simulation option.
• assertTrue(expr): evaluates the expression and check its result is True.
• assertFalse(expr): evaluates the expression and check its result is False.
• assertEqual(expr1, expr2): evaluates both expressions and check their results are equal.
• assertNanEqual(expr1, expr2): evaluates both expressions and check their results are equal, even in the
presence of nans (because normally nan != nan).
48
Chapter 5. Processes
LIAM2 User Guide, Release 0.8.1
• assertEquiv(expr1, expr2): evaluates both expressions and check their results are equal tolerating a difference in shape (though they must be compatible).
• assertIsClose(expr1, expr2): evaluates both expressions and check their results are almost equal.
5.7. Debugging and the interactive console
49
LIAM2 User Guide, Release 0.8.1
50
Chapter 5. Processes
CHAPTER
SIX
LINKS
Individuals can be linked with each other or with individuals of other entities, for example, mothers are linked to
their children, partners are linked to each other and persons belong to households.
A typical link declaration has the following form:
name: {type: <type>, target: <entity>, field: <name of link field>}
LIAM2 uses integer fields to establish the link between entities. Those integer fields contain the id-number of the
linked individual.
For link fields, -1 is a special value meaning the link points to nothing (eg. a person has no partner). Other negative
values should never be used (whatever the reason) for link fields.
LIAM2 allows two types of links: many2one and one2many.
6.1 many2one
A many2one link links an individual of the entity to one other individual in the same (eg. a person to his/her
mother) or another entity (eg. a person to its household).
This allows the modeller to use information stored in the linked entities.
entities:
person:
fields:
- age: int
- income: float
- mother_id: int
- father_id: int
- partner_id: int
links:
mother: {type: many2one, target: person, field: mother_id}
father: {type: many2one, target: person, field: father_id}
partner: {type: many2one, target: person, field: partner_id}
processes:
age: age + 1
mother_age: mother.age
parents_income: mother.income + father.income
To access a field of a linked individual (possibly of the same entity), you use:
link_name.field_name
For example, the mother_age process uses the ‘mother’ link to assign the age of the mother to the mother_age
field. If an individual’s link does not point to anything (eg. a person has no known mother), trying to use the link
would yield the missing value (eg. for orphans, mother.age is -1 and parents_income is nan).
51
LIAM2 User Guide, Release 0.8.1
As another example, the process below sets a variable to_separate to True if the variable separate is True for either
the individual or his/her partner.
- to_separate: separate or partner.separate
Note that it is perfectly valid to chain links as, for example, in:
grand_parents_income: mother.mother.income + mother.father.income +
father.mother.income + father.father.income
Another option to get values in the linked individual is to use the form:
link_name.get(expr)
this syntax is a bit more verbose in the simple case, but is much more powerful as it allows to evaluate (almost)
any expression on the linked individual.
For example, if you want to get the average age of both parents of the mother of each individual, you can do it so:
mother.get((mother.age + father.age) / 2)
6.2 one2many
A one2many link links an individual of the entity to at least one other individual in the same (eg. a person to
his/her children) or another entity (a household to its members).
entities:
household:
links:
persons: {type: one2many, target: person, field: household_id}
person:
fields:
- age: int
- income: float
- household_id : int
links:
household: {type: many2one, target: household, field: household_id}
• persons is the link from the household to its members.
• household is the link form a person to his/her household.
To access the information stored in the linked individuals through a one2many link, you have to use aggregate
methods on the link:
link_name.method_name([arguments])
For example:
persons.avg(age)
one2many links support the following methods: count(), sum(), avg(), min() and max(). See link methods for
details.
example
entities:
household:
fields:
- num_children: int
links:
52
Chapter 6. Links
LIAM2 User Guide, Release 0.8.1
# link from a household to its members
persons: {type: one2many, target: person, field: household_id}
processes:
num_children: persons.count(age <= 17)
person:
fields:
- age: int
- household_id: int
links:
# link form a person to his/her household
household: {type: many2one, target: household,
field: household_id}
processes:
num_kids_in_hh: household.num_children
The num_children process, once called will compute the number of persons aged 17 or less in each household and
store the result in the num_children field (of the household). Afterwards, that variable can be used like any other
variable, for example through a many2one link, like in the num_kids_in_hh process. This process computes for
each person, the number of children in the household of that person.
Note that the variable num_kids_in_hh could also have been simulated by just one process, on the “person” level,
by using:
- num_kids_in_hh: household.get(persons.count(age <= 17))
6.2. one2many
53
LIAM2 User Guide, Release 0.8.1
54
Chapter 6. Links
CHAPTER
SEVEN
IMPORTING OTHER MODELS
A model file can (optionally) import (an)other model file(s). An import directive can take two forms:
import: path\filename.yml
or
import:
- path1\filename1.yml
- path2\filename2.yml
Each file in the import section will be merged with the current file in the order it appears. Merging means that
fields, links, macros and processes from the imported file are added to the ones of the current file. If there is a
conflict (something with the same name is defined for the same entity in both files), the “current” file (the model
importing the other model) takes priority. This means one can override entity processes defined in imported files,
or add fields to an entity defined in the imported model.
Note that both the importing model and the imported model need not be complete/valid models (they do not need
to include all required (sub)sections), as long as the combined model is valid. See the examples below.
example (common.yml)
entities:
person:
fields:
- age:
int
- agegroup: {type: int, initialdata: false}
processes:
ageing:
- age: age + 1
- agegroup: trunc(age / 10)
simulation:
processes:
- person: [ageing]
# we do not specify output so this model is not valid in itself
input:
file: simple2001.h5
start_period: 2002
periods: 2
example (variant1.yml)
import: common.yml
entities:
person:
55
LIAM2 User Guide, Release 0.8.1
processes:
# override the ageing process
ageing:
- age: age + 1
- agegroup: if(age < 50,
5 * trunc(age / 5),
10 * trunc(age / 10))
simulation:
# provide the required "output" section which is missing in common.yml
output:
file: variant1.h5
example (variant2.yml)
import: common.yml
entities:
person:
fields:
# adding a new field
- dead: {type: bool, initialdata: false}
processes:
# adding a new process
death:
- dead: logit_regr(0.0, align=’al_p_dead.csv’)
- show(’Avg age of death’, avg(age, filter=dead))
- remove(dead)
simulation:
# since we have a new process, we have to override the *entire* process
# list, as LIAM2 would not know where to insert the new process otherwise.
processes:
- person: [ageing, death]
output:
file: variant2.h5
Imported models can themselves import other models, as for example in variant3.yml.
example (variant3.yml)
import: variant2.yml
entities:
person:
processes:
# use the "alternate" ageing procedure
ageing:
- age: age + 1
- agegroup: if(age < 50,
5 * trunc(age / 5),
10 * trunc(age / 10))
This last example could also be achieved by importing both variant1.yml and variant2.yml. Notice that the order
of imports is important, since it determines the result of conflicts between variants. For example in variant4.yml
below, the process list will be the one from variant2 and the output will go in variant2.h5.
example (variant4.yml)
import:
- variant1.yml
- variant2.yml
56
Chapter 7. Importing other models
CHAPTER
EIGHT
IMPORTING DATA
8.1 data files
As of now, you can only import CSV files. LIAM2 currently supports two kinds of data files: tables and multidimensional arrays.
table files are used for entities data and optionally for globals. They should have one column per field and their
first row should contain the name of the fields. These names should not contain any special character (accents,
etc.).
For entities data, you need at least two integer columns: “id” and “period” (though they do not necessarily need
to be named like that in the csv file).
array files are used for other external data (alignment data for example). They are arrays of any number of
dimensions of a single homogeneous type. The first row should contain the dimension names (one dimension by
cell). The second row should contain the possible values for the last dimension. Each subsequent row should start
by the values for the first dimensions then the actual data.
example
gender | work | civilstate |
|
|
|
|
1 |
2 |
3 |
4
False | False |
5313 | 1912 | 695 | 1222
False | True |
432 | 232 |
51 |
87
True | False |
4701 | 2185 | 1164 | 1079
True | True |
369 | 155 | 101 | 116
This is the same format that groupby() generates except for totals.
8.2 description file
To import CSV files, you need to create a description file. Those description files have the following general
format:
output: <path_of_hdf5_file>.csv
# compression is optional. compression type can be ’zlib’, ’bzip2’ or ’lzo’
# level is a digit from 1 to 9 and is optional (defaults to 5).
# Examples of valid compression strings are: zlib, lzo-1, bzip2-9.
# You should experiment to see which compression scheme (if any) offers the
# best trade-off for your dataset.
compression: <type>-<level>
# globals are entirely optional
globals:
periodic:
path: <path_of_file>.csv
57
LIAM2 User Guide, Release 0.8.1
# if the csv file is transposed (each field is on a row instead of
# a column and the field names are in the first column, instead of
# the first row), you can use "transpose: true". You do not need to
# specify anything if the file is not transposed.
transposed: true
# fields are optional (if not specified, all fields are imported)
fields:
# PERIOD is implicit
- <field1_name>: <field1_type>
- <field2_name>: <field2_type>
- ...
other_table:
# same options than for periodic: path, fields, transpose, ...
other_array:
path: <path_of_file>.csv
type: <field_type>
entities:
<entity1_name>:
path: <path_to_entity1_data>.csv
# defaults to false if not present
transposed: true
# if you want to manually select the fields to be used, and/or
# specify their types, you can do so in the following section.
# If you want to use all the fields present in the csv file, you
# can simply omit this section. The field types will be
# automatically detected.
fields:
# period and id are implicit
- <field1_name>: <field1_type>
- <field2_name>: <field2_type>
- ...
# if you want to keep your csv files intact but use different
# names in your simulation than in the csv files, you can specify
# name changes here.
oldnames:
<fieldX_newname>: <fieldX_oldname>
<fieldY_newname>: <fieldY_oldname>
...
# another option to specify name changes (takes precedence over
# oldnames in case of conflicts).
newnames:
<fieldX_oldname>: <fieldX_newname>
<fieldY_oldname>: <fieldY_newname>
...
# if you want to merge several files, use this format:
files:
- <path>\<to>\<file1>.<ext>:
# any option (renamings, ...) specified here will override
# the corresponding options defined at the level of the
# entity
transposed: true|false
newnames:
<fieldX_oldname>: <fieldX_newname>
<fieldY_oldname>: <fieldY_newname>
58
Chapter 8. Importing data
LIAM2 User Guide, Release 0.8.1
# if you don’t have any specific option for a file, use "{}"
- <path>\<to>\<file2>.<ext>: {}
- ...
# OR, if all the files use the global options (the options defined
# at the level of the entity):
files:
- <path>\<to>\<file1>.<ext>
- <path>\<to>\<file2>.<ext>
- ...
# if you want to fill missing values for some fields (this only
# works when "files" is used).
interpolate:
<fieldX_name>: previous_value
# if you want to invert the value of some boolean fields
# (True -> False and False -> True), add them to the "invert" list
# below.
invert: [list, of, boolean, fields, to, invert]
<entity2_name>:
...
Most elements of this description file are optional. The only required elements are “output” and “entities”. If an
element is not specified, it uses the following default value:
• if path is omitted, it defaults to a file named after the entity in the same directory than the description file (ie
local_path\name_of_the_entity.csv).
• if the fields section is omitted, all columns of the csv file will be imported and their type will be detected
automatically.
• if compression is omitted, the output will not be compressed.
Note that if an “entity section” is entirely empty, you need to use the special code: “{}”.
simplest example
output: simplest.h5
entities:
household: {}
person: {}
This will try to load all the fields of the household and person entities in “household.csv” and “person.csv” in the
same directory than the description file.
simple example
output: simple.h5
globals:
periodic:
path: input\globals.csv
entities:
household:
path: input\household.csv
person:
path: input\person.csv
This will try to load all the fields of the household and person entities in “household.csv” and “person.csv” in the
“input” sub-directory of the directory where the description file is.
8.2. description file
59
LIAM2 User Guide, Release 0.8.1
example 3
output: example3.h5
globals:
periodic:
path: input\globals_transposed.csv
transposed: true
entities:
household:
path: input\household.csv
person:
path: input\person.csv
fields:
- age:
int
- gender:
bool
- workstate: int
- civilstate: int
- partner_id: int
oldnames:
gender: male
This will load all the fields of the household entity in “household.csv” and load from “person.csv” only the fields
listed above. The data will be converted (if necessary) to the type declared. In this case, person.csv should
contain at least the following columns (not necessarily in this order): period, id, age, male, workstate, civilstate,
partner_id.
If the fields of an entity are scattered in several files, you can use the “files” key to list them, as in this fourth
example :
output: example4.h5
entities:
person:
fields:
- age:
- gender:
- workstate:
- civilstate:
int
bool
int
int
# renamings applying to all files of this entity
newnames:
time: period
files:
- param\p_age.csv:
# additional renamings for this file only
newnames:
value: age
- param\p_workstate.csv:
newnames:
value: workstate
# person.csv should have at least 4 columns:
# period, id, age and gender
- param\person.csv:
newnames:
# we override the "global" renaming
period: period
interpolate:
workstate: previous_value
60
Chapter 8. Importing data
LIAM2 User Guide, Release 0.8.1
civilstate: previous_value
But this can become tedious if you have a lot of files to import and they all have the same column names. If the
name of the field can be extracted from the name of the file, you can automate the process like this:
example 5
output: example5.h5
entities:
person:
fields:
- age: int
- work: bool
newnames:
time: period
# {basename} evaluates to the name of the file without
# extension. In the examples below, that would be
# ’p_age’ and ’p_work’. We then use the "replace" method
# on the string we got, to get rid of ’p_’.
value: eval(’{basename}’.replace(’p_’, ’’))
files:
- param\p_age.csv
- param\p_work.csv
interpolate:
work: previous_value
8.3 importing the data
Once you have your data as CSV files and created a description file, you can import your data.
• If you are using the bundled editor, simply open the description file and press F5.
• If you are using the command line, use:
[BUNDLEPATH]\liam2\main import <path_to_description_file>
8.3. importing the data
61
LIAM2 User Guide, Release 0.8.1
62
Chapter 8. Importing data
CHAPTER
NINE
INDICES AND TABLES
• genindex
• search
63
LIAM2 User Guide, Release 0.8.1
64
Chapter 9. Indices and tables
CHAPTER
TEN
APPENDIX
10.1 Known issues
10.1.1 Contextual filter is inconsistent
First, what is a contextual filter? It is the name we gave to the feature which propagates the filter of an if function
to the “True” side of the function, and the opposite filter to the “False” side. So, for example, in:
- aligned: if(gender, align(0.0, ’al_p_dead_m.csv’)
align(0.0, ’al_p_dead_f.csv’))
the “gender” filter is automatically propagated to the align functions. Which means, the above code is exactly
equivalent to:
- aligned_m: align(0.0, ’al_p_dead_m.csv’, filter=gender)
- aligned_f: align(0.0, ’al_p_dead_f.csv’, filter=not gender)
- aligned: if(gender, aligned_m, aligned_f)
One might wonder what happens if an explicit filter is used in addition to the contextual filter? Both filters are
combined (using “and”), as for example:
- aligned: if(gender, align(0.0, ’al_p_dead_m.csv’, filter=age > 10)
align(0.0, ’al_p_dead_f.csv’))
which is in fact evaluated as:
- aligned_m: align(0.0, ’al_p_dead_m.csv’, filter=gender and age > 10)
- aligned_f: align(0.0, ’al_p_dead_f.csv’, filter=not gender)
- aligned: if(gender, aligned_m, aligned_f)
What is the inconsistency anyway?
This contextual filter propagation is implemented for new(), align(), logit_regr(), matching() and some (but not all)
aggregate functions. Specifically, it is implemented for sum and gini, but not for other aggregate functions (count,
avg, min, max, std, median and percentile). This situation needs to be changed, but I am unsure in which way:
implementing it for all aggregate functions or not contextutal filter for any aggregate function (or any function at
all)?
While this features feels natural for new, align and logit_regr, it feels out of place for aggregate functions because
it means we work at both the individual level and at the “aggregate” levels in the same expression, or, in more
technical terms, we work with both vectors and scalars, and it might be confusing: do users realize they are
assigning a value for each individual, even if that is only one of two values?
In an expression like the following:
- age_sum: if(gender, sum(age), sum(age))
65
LIAM2 User Guide, Release 0.8.1
do users realize they are assigning a different value for both branches? When I see an expression like this, I think:
“it returns the same value whether the condition is True or not, let’s simplify it by removing the condition”:
- age_sum: sum(age)
which will not have the same result.
Another (smaller) point, is that implementing this contextual filter feature means one cannot “escape” the filter of
an if function, so for example:
- difficult_match: if(to_marry and not gender,
abs(age - avg(age, filter=to_marry and gender)),
nan)
would not work, and would need to be rewritten as:
- avg_age_men: avg(age, filter=to_marry and gender)
- difficult_match: if(to_marry and not gender,
abs(age - avg_age_men),
nan)
I would greatly appreciate more input on the subject, so please make your voice heard if you have an opinion
about this, [on the -dev mailing list].
10.1.2 31 different variables per expression
Within a single expression, one may only use 31 different variables. There is a simple workaround though: split
your expression in several pieces, each one using less than 31 variables. Example:
- result: a1 + a2 + ... + a31 + a32 + a33
could be rewritten as:
- tmp: a1 + a2 + ... + a31
- result: tmp + a32 + a33
10.2 Code architecture
This document is meant for people who want to know more about the internals of LIAM2, for example to add or
modify some functionality. One should already be familiar with how the program is used (on the user side).
10.2.1 Concepts
Here is a brief description of the most important concepts to understand the code of LIAM2, as well as where
those concepts are implemented.
Simulation
file: simulation.py
The Simulation class takes care of loading the simulation file (it delegates much of the work to entities), prepares
the data source and simulates each period in turn (runs each process in turn).
Entity
file: entities.py
66
Chapter 10. Appendix
LIAM2 User Guide, Release 0.8.1
The Entity class stores all there is to know about each entity: fields, links, processes and data. It serves as a glue
class between everything data, processes, ...
When entities are created, they are added to a global registry in registry.py
Process
file: process.py
The Process class stores users processes. The most common kind of process is the Assignment which computes
the value of an expression and stores the result in a variable.
The Compute class is used as alternative for Assignment when a user does not store the result of an expression
(with a side effect) which does have a return value (as opposed to Actions).
Another very common process is the ProcessGroup (a.k.a procedures) which runs a list of processes in order.
Action
file: actions.py
Actions are processes which do not have any result (that can be stored in variables), but have side-effects. Examples include: csv(), show(), remove(), breakpoint()
Expressions
file: expr.py (and many others)
Expressions are the meat of the code. The Expr class is the base class for all expressions in LIAM2. It defines all
the basic operators on expressions (arithmetic, logical, comparison), but it should not be inherited from directly.
file: exprbases.py
LIAM2 provides many different bases classes to inherit from when implementing a new function:
• NumexprFunction: base class for functions which are implemented as-is in numexpr. eg. abs, log, exp
• CompoundExpression: base class for expressions which can be expressed in terms of other “liam2” expressions. eg. min, max, zeroclip
• EvaluableExpression: base class for all other expressions (those that do not exist in numexpr and cannot be
expressed in terms of other liam2 expressions). These expressions need to be pre-evaluated and stored in a
(hidden) temporary variable before being fed to numexpr, and this is what EvaluableExpression does. One
should only inherit from this class directly if none of the below subclasses applies.
1. NumpyFunction: subclass for functions which are implemented as is in Numpy. Should not be used
directly.
– NumpyCreateArray: subclass for functions which create arrays out of nothing (usually random
functions).
– NumpyChangeArray: subclass for functions which take an array as input and give another array
as output (eg clip, round).
– NumpyAggregate: subclass for aggregate functions. eg. count, min, max, std, median.
2. FunctionExpression: subclass for functions (which take one expression as argument). eg. trunc, lag,
duration, ...
– FilteredExpression: subclass for functions which also take a filter argument. eg. align, sum, avg,
gini.
LIAM2 current expressions are implemented in the following files:
alignment.py handles align() and align_abs() functions
10.2. Code architecture
67
LIAM2 User Guide, Release 0.8.1
align_link.py the core algorithm (an implementation of Chenard’s) for align_abs(link=)
exprmisc.py all expressions which are not defined in another file.
groupby.py handles groupby()
links.py contains all link-related code:
• the Link class stores the definition of links
• the LinkValue class handles ManyToOne links
• link functions to handle OneToMany links: countlink, sumlink, avglink, minlink and maxlink
matching.py handles the matching() function
regressions.py handles all the regression functions: logit_score, logit_regr, cont_regr, clip_regr, log_regr
tfunc.py handles all time-related functions: value_for_period, lag, duration, tavg and tsum
Context
file: context.py
A context is a data structure used to keep track of “contextual” information: what is the “current” entity, what is the
“current” period, what is the “current” dataset. The context is passed around to the evaluation functions/methods.
A context must present a simple dictionary interface (key: value). There are a few keys with special meanings:
period should be the period currently being evaluated
__len__ if present, should be an int representing the number of rows in the context
__entity__ current entity
__globals__ if present, should be a dictionary of global tables (‘periodic’, ...)
The kind of context which is most used is the EntityContext which provides a context interface to an Entity.
10.2.2 Other files
Main code
config.py Stores some global configuration variables
console.py Handles the interactive console
cpartition.pyx Cython source to speed up our partitioning function (group_indices_nd) which is used in groupby
and alignment.
cpartition.c generated from cpartition.pyx using Cython
cpartition.pyd cpartition.c compiled
cutils.pyx Cython source to speed up some commonly used utility functions.
cutils.c generated from cutils.pyx using Cython
cutils.pyd cutils.c compiled
data.py handles loading, indexing, checking, merging, copying or modifying (adding or removing fields) tables
(or subsets of them). It tries to provide a uniform interface from different data sources but it is a work in
progress.
exprparser.py parsing code for expressions
importer.py code to import csv files in our own hdf5 “subformat” by reading an “import file” (in yaml).
khash.h Generic hash table from Klib, used in cpartition.pyx see https://github.com/attractivechaos/klib
68
Chapter 10. Appendix
LIAM2 User Guide, Release 0.8.1
main.py The main script. It reads command line arguments and calls the corresponding code (run, import, explore) in simulation.py (run/explore) or importer.py (import)
partition.py handles partitioning objects depending on the possible values of their columns.
registry.py global registry of entities
utils.py miscellaneous support functions
standalone scripts
diff_h5.py diff two liam2 files
dropfields_h5.py copy a subset of a liam2 file (excluding specified columns)
filter_h5.py copy a subset of a liam2 file (all rows matching specified condition)
merge_h5.py merge two liam2 files
build scripts
build_exe.py generic script to make executables (for standalones scripts)
setup.py compile cython extensions to pyd and make an .exe for the main liam2 executable (using cx_Freeze)
10.3 Technical choices
10.3.1 Python
We use the Python language (http://www.python.org/) for the development of LIAM2.
Python runs on Windows, Linux/Unix, Mac OS X, and has been ported to the Java and .NET virtual
machines.
Python is free to use, even for commercial products, because of its OSI-approved open source license.
10.3.2 HDF5
We store the used data in an hdf5-format (http://www.hdfgroup.org).
HDF5 is a data model, library, and file format for storing and managing data. It supports an unlimited
variety of data types, and is designed for flexible and efficient I/O and for high volume and complex
data. HDF5 is portable and is extensible, allowing applications to evolve in their use of HDF5. The
HDF5 Technology suite includes tools and applications for managing, manipulating, viewing, and
analyzing data in the HDF5 format.
HDF is open-source and the software is distributed at no cost. Potential users can evaluate HDF
without any financial investment. Projects that adopt HDF are assured that the technology they rely
on to manage their data is not dependent upon a proprietary format and binary-only software that a
company may dramatically increase the price of, or decide to stop supporting altogether.
This allows us to handle important data sets.
10.3.3 YAML
The definition of the data and the model is done in the YAML-language (http://www.yaml.org).
YAML: YAML Ain’t Markup Language
What It Is: YAML is a human friendly data serialization standard for all programming languages.
10.3. Technical choices
69
LIAM2 User Guide, Release 0.8.1
10.4 Change log
10.4.1 Version 0.8.1
Released on 2014-03-19.
New features
• added the gumbel() function to draw random numbers from the Gumbel distribution (also known as the
Smallest Extreme Value (SEV) distribution). Thanks to Gijs Dekkers for the patch.
Fixes
• fixed a performance regression in 0.8 when using very large negative numbers as indices for a global (eg
MINR[bad_index] where bad_indix contains several -2147483648 values). Closes issue #121.
• fixed the (debug) interactive console to not produce a useless warning if a global temporary was run before
entering the console (regression in 0.8). Closes issue #120.
• added missing documentation for assertFalse and assertNanEqual.
10.4.2 Version 0.8
Released on 2014-02-05.
New features
• added a few functions to create charts (courtesy of matplotlib): bar, plot, pie, stackplot, boxplot and scatter.
As with all other functions in liam2, they are available both during a simulation and in the interactive
console. The charts can either be visualized directly or saved to a file. See the charts section for details.
• added a “view” command line option to LIAM2 to open ViTables (an hdf5 viewer) as well as a corresponding menu entry and keyboard shortcut (F9) in Notepad++. It is meant to be used when editing a model file,
and it will open both the input dataset and the result file (if any).
• document boolean aggregate functions: all() and any() which were added in 0.7 but were not yet documented.
• added assertFalse assert function.
Miscellaneous improvements
• improved the first few demonstration models quite a bit. A recommended read for all users.
• added precisions in the documentation of align() based on Alexis Eidelman suggestions.
• made a few more error messages a bit more useful by displaying the line where the error occurred.
• sped up global[array_expr].
• give a hint to use assertNanEqual when it would make a failing assertEqual pass.
• implemented global[slice_expr] (eg. MINR[period: period+2]). When the slice bounds are arrays (different
for each individual) and the slice length is not constant (not the same for all individals), it returns a special
array with an extremely limited set of supported operations: only aggregates on axis=1 are implemented.
• include the documentation only in HTML Help format (.chm) in the bundle. .pdf and “normal” html are
still available as separate downloads on the website.
• removed the predictor keyword support (it now raises an exception instead of a warning).
70
Chapter 10. Appendix
LIAM2 User Guide, Release 0.8.1
• adapted the release script since our move to git and converted it to Python.
Fixes
• fixed the “syntax upgrade” script by removing a special case for grpmin and grpmax as it was in fact not
needed and caused problems when the expression being aggregated contained parentheses.
10.4.3 Version 0.7
Released on 2013-06-18.
New features
• implemented imports so that simulation files can be split and reused. This can be used to simply split a
large model file into smaller files, or (more interestingly) to create simulation variants without having to
duplicate the common parts. This feature was inspired by some code from Alexis Eidelman. For details see
the Importing other models section.
• added new logit and logistic functions. They were previously used internally but not available to modellers.
• added two new debugging features: autodump and autodiff. autodump will dump all (non-scalar) variables
(including temporaries) at the end of each procedure in a separate hdf5 file. It can be used stand-alone for
debugging, or in combination with autodiff. Autodiff will gather all variables at the end of each procedure
and compare them with the values stored previously by autodump in another run of the model (or a variant
of it). This can be used to precisely compare two versions/variants of a model and see exactly where they
start to differ.
• added new assert functions:
– assertIsClose to check that two results are “almost” equal tolerating small value differences (for example due to rounding differences).
– assertEquiv to check that two results are equal tolerating differences in shape (though they must be
compatible).
– assertNanEqual to check that two arrays are equal even in the presence of nans (because normally nan
!= nan).
• added a new “timings” option to hide timings from the simulation log, so that two simulation logs are more
easily comparable (for example with “diff” tools like WinMerge).
• added a menu entry in notepad++ to run a simulation in “debug mode”.
Miscellaneous improvements
• improved the performance and memory usage by changing the internal memory layout. Most operations
are now faster. new(), remove(), “merging data” (for retrospective simulations) and writing data at the end
of each period are now slower. In our model, this translates to a peak memory usage 20% smaller and a
35% overall speed increase. However, if your model has a low processes/variables ratio, it may very well
be slower overall with this version. If it is your case, please contact us.
• changed the syntax for all aggregate functions: grpxxx(...) should now be xxx(...). For example, grpsum(age) should now be: sum(age). The old syntax is still valid but it is deprecated (it will be removed
in a later version). A special note for grpmin() and grpmax() which becomes min() and max() respectively
even though those functions already existed. The meaning is deduced from the number of “non-keyword”
arguments:
min(expr1, expr2) minimum between expr1 and expr2 (for each individual)
min(expr) (aggregate) minimum value of “expr” over all individuals
10.4. Change log
71
LIAM2 User Guide, Release 0.8.1
min(expr1, filter=expr2) (aggregate) minimum value of “expr” over individuals satisfying the filter
A tool to automatically upgrade models to the new syntax is provided. In notepad++, you should use the
LIAM2: upgrade model command in the Macro menu.
You can also run it via the command line:
main upgrade model.yml [output.yml]
see main upgrade –help for details.
• changed the syntax for all one2many link functions: xxxlink(link_name, ...)
should now be
link_name.xxx(...). For example, countlink(persons) should now be: persons.count(). The old syntax is
still valid but it is deprecated (it will be removed in a later version). As for aggregate functions, one can
upgrade its models automatically with the “upgrade” command.
• the “period” argument of value_for_period can now be a scalar expression (it must have the same value for
all individuals).
• when the output directory does not exist, LIAM2 will now try to create it.
• when debug mode is on, print the position in the random sequence before and after operations which use
random numbers.
• entities are loaded/stored for each period in alphabetical order instead of randomly. This has no influence
on the results but produces nicer log files.
• deprecated the “predictor” keyword. If you need several processes to write to the same variable, you should
use procedures instead.
Fixes
• using invalid indexes in “global arrays” do not crash anymore if they are properly enclosed in an if() expression. For example if you have an array “by_age” with values for indices from 0 to 99, the following code
will now work as expected:
if(age < 50, by_age[age + 50], 0.5)
Periodic globals are unaffected (they always return “missing” when out of bounds).
• fixed link expressions which span 3 (or more) different entities.
• fixed using show() on a scalar created by summing a “global array”.
• fixed the progress bar of matching() when the number of individuals is different in the two sets.
10.4.4 Version 0.6.2
Released on 2013-05-21.
Fixes
• fixed storing a copy of a (declared) field (without any modification) in a temporary “backup” variable. The
temporary variable was not a copy but an alias to the same data, so if the field was modified afterwards, the
temporary variable was also modified implicitly.
As an example, the following code failed before the fix:
#
#
#
-
72
age is a field
backup: age
modify age (this also modified backup!)
age: age + 1
failed because "backup" was equal to "age"
assertEqual(age, backup + 1)
Chapter 10. Appendix
LIAM2 User Guide, Release 0.8.1
This only affected assignment of “pure” fields, not expressions nor temporary variables, for example, the
following code worked fine (because backup stores an expression, not a simple field):
- backup: age * 1
- age: age + 1
- assertEqual(age, backup + 1)
and this code worked too (because temp is a temporary variable, not a field):
-
temp: age + 1
backup: temp
temp: temp + 1
assertEqual(temp, backup + 1)
10.4.5 Version 0.6.1
Released on 2013-03-27.
Miscellaneous improvements
• when importing an nd-array skip cells with only spaces in addition to empty cells.
Fixes
• fixed using non-scalar values (eg fields) as indices of n-dimensional arrays, and generally made indexing
n-dimensional arrays more robust.
• fixed choice which did not refuse to run when the sum of probability is != 1 and the “error” is > 1e-6, as it
should. This was the case in past versions but the test was accidentally removed in version 0.5.
• fixed choice to warn when the sum of probabilities is > 1 (and the error is <= 1e-6). Previously, it only
warned if the sum was < 1.
10.4.6 Version 0.6
Released on 2013-03-15.
New features
• globals handling has been vastly improved:
– multiple tables: one can now define several tables in globals and not only the “periodic” table.
These should be imported in the import file and declared in the simulation file in the exact same way
that periodic globals are.
Their usage within a simulation is a bit different though: whereas periodic global variables can be used
without prefixing, others globals need to be prefixed with the name of their table. For example, if one
has declared a global table named “othertable”:
othertable:
fields:
- INTFIELD: int
- FLOATFIELD: float
its fields can be used like this:
my_variable: othertable.INTFIELD * 10
10.4. Change log
73
LIAM2 User Guide, Release 0.8.1
These other global tables need not contain a PERIOD column. When using such a table, LIAM2 will
not automatically subtract the “base period” from the index, which means that to access a particular
row, you have to use its row index (0 based).
– n-dimensional globals: in addition to tables, globals can now be n-dimensional arrays. The file format
for those should be the same than alignment files. They should be declared like this:
MYARRAY: {type: float}
– globals can now be used in all situations instead of only in simple expressions and only for the
“current” period. Namely, it makes globals available in: link functions, temporal functions (lag,
value_for_period, ...), matching(), new() and in (all the different flavours of) the interactive console.
• alignment has been vastly improved:
– align_abs is a new function with the same arguments than align which can be used to align to absolute
numbers per category, instead of proportions. Combined with other improvements in this release, this
allows maximum flexibility for computing alignment targets on the fly (see below).
– align on a linked entity (a.k.a immigration): additionally to the arguments of align, align_abs has also
an optional “link” argument, which makes it work on the linked entities. The link argument must a
one2many link. For example, it can be used to take as many household*s as necessary trying to get
as close as possible to a particular distribution of *persons. When the link argument is in effect, the
function uses the “Chenard” algorithm.
In this form, align_abs also supports two extra arguments:
* secondary_axis: name of an axis which will influence rel_need when the subtotal for that axis is
exceeded. See total_by_sex in Chenard. secondary_axis must be one of the alignment columns.
* errors: if set to ‘carry’, the error for a period (difference between the number of individuals
aligned and the target for each category) is stored and added to the target for the next period.
– renamed the “probabilities” argument of align to “proportions”
– the “proportions” argument of align() is now much more versatile, as all the following are now accepted:
* a single scalar, for aligning with a constant proportion.
* a list of scalars, for aligning with constant proportions per category. (this used to be the only
supported format for this argument)
* an expression returning a single scalar.
* an expression returning an n-dimensional array. expressions and possible_values will be retrieved
from that array, so you can simply use:
align(score, array_expr)
* a list of expressions returning scalars [expr1, expr2].
* a string (in which case, it is treated as a filename). The “fname” argument is still provided for
backward compatibility.
– added an optional “frac_need” argument to align() to control how “fractional needs” are handled. It
can take any of three values: “uniform” (default), “cutoff” or “round”.
* “uniform” draws a random number (u) from an uniform distribution and adds one individual if u
< fractional_need. “uniform” is the default behavior.
* “round” simply rounds needs to the nearest integer. In other words, one individual is added for a
category if the fractional need for that category is >= 0.5.
* “cutoff” tries to match the total need as closely as possible (at the expense of a slight loss of
precision for individual categories) by searching for the “cutoff point” that yields:
74
Chapter 10. Appendix
LIAM2 User Guide, Release 0.8.1
count(frac_need >= cutoff) == sum(frac_need)
– changed the order of align() arguments: proportions is now the second argument, instead of filter,
which means you can omit the “fname” or “proportions” keywords and write something like:
align(score, ’my_csv_file.csv’)
– made align() (and by extension logit_regr) always return False for individuals outside the filter, instead
of trying to modify the target variable only where the filter is True. That feature seemed like a good
idea on paper but had a very confusing side-effect: the result was different when it was stored in an
existing variable than in a new temporary variable.
– it is no longer possible to use expressions in alignment files. If you need to align on an expression
(instead of a simple variable), you should specify the expression in the alignment function. eg:
align(0.0, fname=’al_p_dead.csv’, expressions=[gender, age + 1])
• the result of a groupby can be used in expressions. This can be used, for example, to compute alignment
targets on the fly.
• implemented explore on data files (.h5), so that one can, for example, explore the input dataset.
• added skip_na (defaults to True) argument to all aggregate functions to specify whether or not missing
values (nan for float expressions, -1 for integer expressions) should be ignored.
• macros can now be used in the interactive console.
• added “globals” command in the interactive console to list the available globals.
• added qshow() command to show an expression “textual form” in addition to its value. Example:
qshow(grpavg(age))
will display:
grpavg(age): 38.5277057298
• added optional “pvalues” argument to groupby() to manually provide the “axis” values to compute the
expression on, instead of having groupby compute the combination of all the unique values present in the
dataset for each column.
Miscellaneous improvements for users
• improved the documentation, in part thanks to the corrections and suggestions from Alexis Eidelman.
• added a “known issues” section to the documentation.
• grpmin and grpmax ignore missing values (nan and -1) by default like other aggregate functions.
• grpavg ignore -1 values for integer expressions like other aggregate functions.
• made the operator precedence for “and”, “or” and “not” more sensible, which means that, for example:
age > 10 and age < 20
is now equivalent to:
(age > 10) and (age < 20)
instead of raising an error.
• many2one links are now ~30% faster for large datasets.
• during import, when a column is entirely empty and its type is not specified manually, assume a float column
instead of failing to import.
• allow “id” and “period” columns to be defined explicitly (even though they are still implicit by default).
10.4. Change log
75
LIAM2 User Guide, Release 0.8.1
• allow “period” in any dimension in alignment files, not only in the last one.
• disabled all warnings for x/0 and 0/0. This is not an ideal situation, but it is still an improvement because
they appeared in LIAM2 code and not in user code and as such confused users more than anything.
• the “num_periods” argument of lag: lag(age, num_periods) can now be a scalar expression (it must have
the same value for all individuals).
• changed output format of groupby to match input format for alignments.
• added Warning in grpgini when all values (for the filter) are zeros.
• when an unrecoverable error happens, save the technical error log to the output directory (for run and explore
commands) instead of the directory from where liam2 was run and display on the console where the file has
been saved.
• better error message when an input file has inconsistent row lengths.
• better error message when using a one2many function in a groupby expression.
Miscellaneous improvements for developers
• added a “code architecture” section to the documentation.
• python tracebacks can be re-activated by setting the DEBUG environment variable to True.
• added a script to automate much of the release process.
• added source files for creating liam2 bundle (ie add our custom version of notepad++ to the source distribution).
• updated INSTALL file, and include sections on how to build the documentation and the C extensions.
• added many tests, fixed a few existing ones and generally greatly improved our test suite.
Fixes
• fixed “transposed” option on import. The number of lines to copy was computed on the untransposed data
which meant too few data points were copied if the number columns was greater than the number of lines
and it crashed if it was smaller.
• fixed all aggregate functions (except grpcount and grpsum) with a filter argument equal to a simple variable
(eg filter=gender) in the presence of “missing” (nan) values in the expression being aggregated: the filter
variable was modified.
• fixed duration() on a simple variable (eg duration(work)): the variable was modified by the function.
• fixed a nasty bug which made that each variable that needed to be read on disk (lag of more than one period,
duration, value_for_period, ...) was read 2 or 3 times instead of just once, greatly slowing down the function.
• fixed accessing columns for the next-to-last period in the interactive console after a simulation: it was either
giving bad results or returning an error.
• fixed all aggregate functions (except grpcount, grpsum and grpavg which worked) on boolean expressions.
This is actually only (remotely) useful for grpgini and grpstd.
• fixed groupby with both filter and expr arguments.
• fixed groupby(expr=scalar).
• fixed sumlink(link, scalar).
• fixed new(number=...).
• fixed non-aligned regressions with a filter (it was ignored).
• fixed the editor shortcuts (to launch liam2) to work when the directory containing the model contains spaces.
• fixed handling of comments in the first cell of a row in alignments files (the entire row is ignored now).
76
Chapter 10. Appendix
LIAM2 User Guide, Release 0.8.1
• fixed “textual form” of choice expressions when bins or choices are dynamic.
• fixed using numpy 1.7
Experimental new features
• implemented optional periodicity for simulation processes.
10.4.7 Version 0.5.1
Released on 2012-11-28.
Miscellaneous improvements
• if there is only one entity defined in a model (like in demo01.yml) and the interactive console is launched,
start directly in that entity, instead of requiring the user to set it manually.
• improved introduction comments in demo models.
• display whether C extensions are used or not in –versions.
• use default_entity in demos (from demo03 onward).
• do not display python version in normal execution but only in –versions.
• use cx_freeze instead of py2exe to build executables for Windows so that we can use the same script to build
executables across platforms and tweaked further our build script to minimise the executable size.
• compressed as many files as possible in the 32 bit Windows bundle with UPX to make the archive yet
smaller (UPX does not support 64 bit executables yet).
• improved our build system to automate much of the release process.
Fixes
• fixed the “explore” command.
• fixed integer fields on 64 bit platforms other than Windows.
• fixed demo06: WEMRA is an int now.
• fixed demo01 introduction comment (bad file name).
10.4.8 Version 0.5
Released on 2012-10-25.
New features
• added a way to import several files for the same entity. A few comments are in order:
– Each file can have different data points. eg if you have historical data for some fields data going back
to 1950 for some individuals, and other fields going back to only 2000, the import mechanism will
merge those data sets.
– It can also optionally fill missing data points. Currently it only supports filling with the “previous
value” (the value the individual had (if any) for that field in a previous period). In the future, we will
add more ways to fill those by interpolating existing data. Note that currently only data points which
are entirely missing are filled, not those which are set to the special value corresponding to “missing”
10.4. Change log
77
LIAM2 User Guide, Release 0.8.1
for the field type (i.e. False for booleans, -1 for integers and “nan” for floats). This will probably
change in the future.
– As a consequence of this new feature, it is now possible to import liam1 files using the “normal”
import file syntax.
• added an optional “default_entity” key to the “simulation” block of simulation files, so that the interactive
console starts directly in that entity.
• added function to compute the Nth percentile: grppercentile(expr, percent[, filter]).
• implemented an optional filter argument for many functions. The behaviour is different depending on the
kind of function:
– for functions that change an existing variable (clip() and round()), the value for filtered individuals is
not modified.
– for functions which create a new variable (uniform(), normal() and randint()), the value for filtered
individuals is the missing value corresponding with the type of the column (-1 for randint(), nan for
uniform() and normal()).
– for aggregate functions (grpmin(), grpmax(), grpstd(), grpmedian() and grppercentile()), the aggregate
is computed over the individuals who satisfy the filter.
• added new functions for testing: assertTrue and assertEqual:
– assertTrue(expr) evaluates its expression argument and check that it is True.
– assertEqual(expr1, expr2) evaluates its two expressions and check that they are equal.
• The behaviour when an assertion fails is configurable through the “assertions” option in the “simulation”
block. This option can take three values:
– “raise”: interrupt the simulation (this is the default).
– “warn”: display a warning message.
– “skip”: do not run the assertion at all.
• added commands to the console:
– entities: prints the list of available entities.
– periods: prints the list of available periods for the current entity.
• added new command line arguments to override paths specified in the simulation file:
– –input-path: override the input path
– –input-file: override the input file
– –output-path: override the output path
– –output-file: override the output file
• added –versions command line argument to display versions of all the libraries used.
Miscellaneous improvements
• performance optimisations:
– fields which are used in lag expressions are cached (stored in memory) to avoid fetching them from
disk. This considerably speeds up lag expressions at the expense of a bit more memory used.
– implemented a few internal functions in Cython to get C-level performance. This considerably speeds
up alignment and groupby expressions, especially when the number of “alignment categories” (the
number of possible combinations of values for the variables used to partition) is high. The down
side is that if someone wants to recreate liam2 binaries from the source code and benefit from this
optimisation (there is a pure-python fallback), he needs to have cython and a C compiler installed.
78
Chapter 10. Appendix
LIAM2 User Guide, Release 0.8.1
– other minor optimisations to groupby and alignments with take or leave filters.
– slightly sped up initial data loading for very large datasets with a lot of historical data.
• choices() arguments (options and probabilities) now accept expressions (ie. they can be computed at run
time).
• improved the interactive console:
– made the interactive console start in the last simulated period by default.
– changed the behaviour of the “entity” command without argument to print the current entity.
– the “period” command can now be called without argument to print the current period.
• added more explicit checks for bad input:
– check for duplicate headers in alignment files.
– check all arguments to groupby() are valid instead of only the first one.
– check for invalid keyword arguments to dump().
– check for invalid keyword arguments to csv().
– check the type of arguments to choice().
– validate globals at load time to make sure the declared globals are actually present in the dataset.
• disallow strings for the score expression in the matching() function.
• improved the test coverage: There is still a long way for full test coverage, but the changes in this version is
already a first step in the right direction:
– automated many tests by using the new assertions functions.
– added more tests.
• only copy declared globals to the output file, and do not create a “globals” node at all if there is no declared
global.
• manually close input and output files when an error happens during initialisation, so that the user only sees
the real error message.
• globals can be entirely missing from the input file if they are not used in the simulation file.
• made the usual code clean-ups.
Fixes
• fixed typo in the code outputting durations (“hourss” instead of “hours”).
• fixed a bug which prevented to define constants without quoting them in some cases.
• fixed a crash when all groups were empty in a groupby(xxx, expr=grpcount(), percent=True).
• fixed aggregate functions (grpmin, grpmax, grpstd, grpmedian and grppercentile) to accept a scalar as argument (even though it is not very useful to do that).
• fixed a bug which prevented to use a simulation output file as input in some cases.
10.4.9 Version 0.4.1
Released on 2011-12-02.
10.4. Change log
79
LIAM2 User Guide, Release 0.8.1
Miscellaneous improvements
• validate both import and simulation files, i.e. detect bad structure and invalid and missing keywords.
• improved error messages (both during import and the simulation), by stripping any information that is not
useful to the user. For some messages, we only have a line number and column left, this is not ideal but
should be better than before. The technical details are written to a file (error.log) instead.
• improved “incoherent alignment data” error message when loading an alignment file by changing the wording and adding the path of the file with the error.
• reorganised bundle files so that there is no confusion between directories for Notepad++ and those of liam2.
• tweaked Notepad++ configuration:
– added explore command as F7
– removed more unnecessary features.
Fixes
• disallowed using one2many links like many2one (it was never intended this way and produced wrong results).
• fixed groupby with a scalar expression (it does not make much sense, but it is better to return the result than
to fail).
• re-enabled the code to show the expressions containing errors where possible (in addition to the error message). This was accidentally removed in a previous version.
• fixed usage to include the ‘explore’ command.
10.4.10 Version 0.4
Released on 2011-11-25.
New features
• added grpgini function.
• added grpmedian function.
• implemented filter argument in grpsum().
• implemented N-dimensional alignment (alignment can be done on more than two variables/dimensions in
the same file).
• added keyword arguments to csv():
– ‘fname’ to allow defining the exact name of the csv file.
– ‘mode’ to allow appending to a csv file instead of overwriting it.
• reworked csv() function to support several arguments, like show. It also supports non-table arguments.
• added ‘skip_shows’ simulation option, to make all show() functions do nothing.
• allowed expressions in addition to variable names in alignment files.
• added keyword arguments to dump():
– ‘missing’ to convert nans into the given value.
– ‘header’ to determine whether column names should be in the dump or not.
• improved import functionality:
80
Chapter 10. Appendix
LIAM2 User Guide, Release 0.8.1
– compression is now configurable.
– any csv file can be transposed, not just globals.
– globals fields can be selected, renamed and inverted like in normal entities.
• added “explore” command to the main executable, to launch the interactive console on a completed simulation without re-simulating it.
Miscellaneous improvements
• expressions do not need to be quoted anymore.
• reverted init to old semantic: it happens in “start_period - 1”, so that lag(variable_set_in_init) works even
for the first period.
• purge all local variables after each process to lower memory usage.
• allowed the result of new() to not be stored in a variable.
• allowed using temporary variables in matching() function.
• using a string for matching expressions is deprecated.
• added a tolerance of 1e-6 to the sum of choice’s probabilities to be equal 1.0
• added explicit message about alignment over and underflows.
• nicer display for small (< 5ms) and large (>= 1 hour) timings.
• improved error message on missing parenthesis around operands of boolean operators.
• improved error message on duplicate fields.
• improved error message when a variable which is not computed yet is used.
• added more information to the console log:
– number of individuals at the start and end of each period.
– more stats at the end of the simulation.
• excluded unused components in the executable to make it smaller.
Fixes
• fixed logit_regr(align=float).
• fixed grpavg(bool, filter=cond).
• fixed groupby(a, b, c, expr=grpsum(d), percent=True).
• fixed having several grpavg with a filter argument in the same expression.
• fixed calling the main executable without argument (simply display usage).
• fixed dump with (some kind of) aggregate values in combination with a filter.
• fixed void data source.
10.4.11 Version 0.3
Released on 2011-06-29.
New features
• added ability to import csv files directly with the main executable.
10.4. Change log
81
LIAM2 User Guide, Release 0.8.1
Miscellaneous improvements
• made periodic globals optional.
• improved a few sections of the documentation.
Fixes
• fixed non-assignment “actions” in interactive console (csv, remove, ...).
• fixed error_var argument to cont_regr, clip_regr and log_regr.
10.4.12 Version 0.2.1
Released on 2011-06-20.
Miscellaneous improvements
• simplified and cleaned up the demonstration models.
• improved the error message when a link points to an unknown entity.
• the evaluator creates fewer internal temporary variables in some cases.
Fixes
• added log and exp to the list of available functions (they were already implemented but not usable because
of that).
• fixed log_regr, cont_regr and clip_regr which were comparing their result with 0.5 (like logit_regr when
there is no alignment).
• fixed new() function, which created individuals correctly but in some cases returned values which did not
correspond to the ids of the newly created individuals, due to a bug in numpy.
10.4.13 Version 0.2
Released on 2011-06-07.
New features
• added support for retrospective simulation (ie simulating periods for which we already have some data): at
the start of each simulated period, if there is any data in the input file for that period, it is “merged” with the
result of the last simulated period. If there is any conflict, the data in the input file has priority.
• added “clone” function which creates new individuals by copying all fields from their “origin” individuals,
except for the fields which are given a value manually.
• added breakpoint function, which launches the interactive console during a simulation. Two more console
commands are available in that mode:
– “s(tep)” to execute the next process
– “r(esume)” to resume normal execution
The breakpoint function takes an optional period argument so that it triggers only for that specific period.
• added “tsum” function, which sums an expression over the whole lifetime of individuals. It returns an
integer when summing integer or boolean expressions, and a float for float expressions.
82
Chapter 10. Appendix
LIAM2 User Guide, Release 0.8.1
• implemented using the value of a periodic global at a specific period. That period can be either a constant
(eg “MINR[2005]”) or an expression (eg “MINR[period - 10]” or “MINR[year_of_birth + 20]”)
• added “trunc” function which takes a float expression and returns an int (dropping everything after the
decimal point)
Miscellaneous improvements
• made integer division (int / int) return floats. eg 1/2 = 0.5 instead of 0.
• processes which do not return any value (csv and show) do not need to be named anymore when they are
inside of a procedure.
• the array used to run the first period is constructed by merging the individuals present in all previous periods.
• print timing for sub-processes in procedures. This is quite verbose but makes debugging performance
problems/regressions easier.
• made error messages more understandable in some cases.
• manually flush the “console” output every time we write to it, not only within the interactive console, as
some environments (namely when using the notepad++ bundle) do not flush the buffer themselves.
• disable compression of the output/simulation file, as it hurts performance quite a bit (the simulation time
can be increased by more than 60%). Previously, it was using the same compression settings as the input
file.
• allowed align() to work on a constant. eg:
align(0.0, fname=’al_p_dead_m.csv’)
• made the “tavg” function work with boolean and float expressions in addition to integer expressions
• allowed links to be used in expression given in the “new” function to initialise the fields of the new individuals.
• using “__parent__” in the new() function is no longer necessary.
• made the “init” section optional (it was never intended to be mandatory).
• added progress bar for copying table.
• optimised some parts for speed, making the whole simulation roughly as fast as 0.1 even though more work
is done.
Fixes
• fixed “tavg” function:
– the result was wrong because the number of values (used in the division) was one less than it should.
– it yielded “random” values when some individuals were present in a past period, but not in the current
period.
• fixed “duration” function:
– it crashed when a past period contained no individuals.
– it yielded “random” values when some individuals were present in a past period, but not in the current
period.
• fixed “many2one” links returning seemingly random values instead of “missing” when they were pointing
to an individual which was not present anymore (usually because the individual was dead).
• fixed min/max functions.
• fields which are not given an explicit value in new() are initialised to missing, instead of 0.
10.4. Change log
83
LIAM2 User Guide, Release 0.8.1
• the result of the new() function (which returns the id of the newly created individuals) is now -1 (instead of
0) for parents which are not in the filter.
• fixed some expressions crashing when used within a lag.
• fixed the progress bar to display correctly even when there are only very few iterations.
10.4.14 Version 0.1
First semi-public release, released on 2011-02-24.
10.5 Credits
LIAM2 is the result of ongoing collaboration between individual researchers from the Federal Planning Bureau
(FPB) in Belgium, CEPS/INSTEAD and the General Inspectorate of Social Security (Inspection Générale de la
Sécurité Sociale, IGSS) in Luxembourg.
The software package is primarily being developed at the Federal Planning Bureau by Gaëtan de Menten and Geert
Bryon. Testing and model development is done by Raphaël Desmet and Gijs Dekkers (FPB), Philippe Liégeois
and Fréderic Berger (CEPS/INSTEAD) and Raymond Wagener (IGSS). Finally, Cathal O’Donoghue shared the
source code of the first version of LIAM, which the FPB used in the AIM project (Dekkers et al., 2010).
LIAM2 was initially the result of the MiDaL project (December 2009 - November 2011), “Towards the development of a dynamic Microsimulation toolbox « LIAM-II » and the complementary implementation of administrative Data needed for dynamic microsimulation of pensions in Luxembourg”. The general objective of the project
was to “develop an advanced analysis tool that allows Luxembourg and other countries at answering policyrelated questions about pensions and social transfers in the longer term trough microsimulation models. The
project received funding from both the European Community Programme for Employment and Social Solidarity - PROGRESS (2007-2013), under the Grant VS/2009/0569, and the General Inspectorate for Social Security
(IGSS) of Luxembourg.
The PROGRESS programme was created by the European Commission to financially support the implementation
of the objectives of the European Union in the employment, social affairs and equal opportunities areas. For more
information, see: http://ec.europa.eu/progress
84
Chapter 10. Appendix
INDEX
aggregate functions, 17
align, 21
align_abs, 24
alignment, 20
all, 18
any, 18
assertEqual, 48
assertions, 48
assertTrue, 48
avg, 18
bar, 35
bar charts, 35
boxplot, 46
breakpoint, 48
bundle, 2
charts, 34
choice, 19
clone, 28
count, 17
csv, 30
debugging, 47
dump, 31
duration, 18
entities, 6
expressions, 15
fields, 6
gini, 18
globals declaration, 5
globals usage, 16
groupby, 32
gumbel, 19
hdf5, 69
importing data, 56
importing models, 53
interactive console, 47
known issues, 65
lag, 18
leave, 21
lifecycle functions, 27
link methods, 18
link.avg, 18
link.count, 18
link.max, 18
link.min, 18
link.sum, 18
links, 49
logit, 20
logit_regr, 25
logit_score, 20
macros, 7
many2one, 51
matching, 26
mathematical functions, 17
max, 18
median, 18
min, 18
new, 27
normal, 19
notepad++, 2
one2many, 52
percentile, 18
pie, 43
pie charts, 43
plot, 37
processes, 11
python, 69
qshow, 30
randint, 19
random, 19
remove, 28
scatter, 44
scatter plots, 44
show, 29
simple expressions, 15
stackplot, 42
std, 18
sum, 17
take, 21
85
LIAM2 User Guide, Release 0.8.1
tavg, 18
temporal functions, 18
tsum, 18
uniform, 19
value_for_period, 18
yaml, 69
86
Index