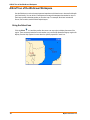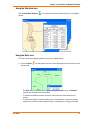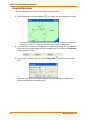
1
MapInfo ProViewer Version 10.0 USER GUIDE Information in this document is subject to change without notice and does not represent a commitment on the part of the vendor or its representatives. No part of this document may be reproduced or transmitted in any form or by any means, electronic or mechanical, including photocopying, without the written permission of Pitney Bowes Software Inc., One Global View, Troy, New York 12180-8399. © 2009 Pitney Bowes Software Inc. All rights reserved. Pitney Bowes Business Insight, MapInfo, Group 1 Software and MapInfo ProViewer are trademarks of Pitney Bowes Business Insight, a division of Pitney Bowes Software and/or its affiliates. Americas: Phone: (518) 285-6000 Fax: (518) 285-6070 Sales: (800) 327-8627 Government Sales: (800) 619-2333 Technical Support: (518) 285-7283 Technical Support Fax: (518) 285-6080 www.mapinfo.com UK and EMEA: Phone: +44(0) 1753 848200 Fax: +44(0) 1753 621140 Technical Support: +44(0) 1634 880141 www.mapinfo.co.uk Asia Pacific: Phone: 61. 2.9437.6255 Fax: 61.2.9439. 1773 Technical Support: 1800 648 899 www.mapinfo.com.au Contact information for all Pitney Bowes Business Insight offices is located at:: http://www.mapinfo.com/contactus Adobe Acrobat® is a registered trademark of Adobe Systems Incorporated in the United States. Products named herein may be trademarks of their respective manufacturers and are hereby recognized. Trademarked names are used editorially, to the benefit of the trademark owner, with no intent to infringe on the trademark. June 2009 Introduction to MapInfo ProViewer MapInfo ProViewer provides an easy way to see, print, and share electronic desktop maps. This convenient map viewer opens tables created using Pitney Bowes Business Insight products such as MapInfo Professional or MapXtreme and displays them in Map and Browser windows. It also opens workspaces and re-creates Map, Browser, Graph, and Layout windows exactly as they were created in MapInfo Professional. Using this product you can display and print maps and workspaces created in any version of the Pitney Bowes Business Insight product line. The purpose of this chapter is to familiarize you with the basics of MapInfo ProViewer and provide resources for you to become familiar with it. You can also get installation assistance from Technical Support, if necessary, using information in this document. System Requirements . . . . . . . . . . . . . . . . . . . . . . . . . . . . . . . . . . . .4 Installing MapInfo ProViewer . . . . . . . . . . . . . . . . . . . . . . . . . . . . . .5 What’s New in MapInfo ProViewer? . . . . . . . . . . . . . . . . . . . . . . . . .5 Displaying a Map in MapInfo ProViewer . . . . . . . . . . . . . . . . . . . . .8 Understanding the ProViewer Toolbar. . . . . . . . . . . . . . . . . . . . . . .9 A Brief Tour of the World.wor Workspace . . . . . . . . . . . . . . . . . . .10 Getting Online Help . . . . . . . . . . . . . . . . . . . . . . . . . . . . . . . . . . . . .13 Getting Technical Support . . . . . . . . . . . . . . . . . . . . . . . . . . . . . . .13 Want to do more?. . . . . . . . . . . . . . . . . . . . . . . . . . . . . . . . . . . . . . .14 1 System Requirements Minimum Requirements The following table gives the minimum system requirements for the MapInfo ProViewer: Operating Systems Windows Vista Ultimate Windows XP Professional SP 3 Windows XP (64-bit) Windows 2008 Server Windows 2003 Enterprise Server SP 1 with Terminal Services/Citrix 4.x Memory Disk Space Graphics Monitor 256 MB RAM with a 400 MHz Pentium processor (1 GHz Pentium processor recommended) 1.5 gigabytes (GB) 16- or 24bit Color 800x600 Display 512 MB of RAM with a 400 MHz Pentium processor (1 GHz Pentium processor recommended) 2.9 gigabytes (GB) 16- or 24bit Color 800x600 Display * The MapInfo ProViewer is not currently Windows Vista certified. Recommended Requirements The following table gives the recommended system requirements for MapInfo ProViewer: Operating Systems Windows Vista Ultimate Windows XP Professional SP 3 Windows XP (64-bit) Windows 2008 Server Windows 2003 Enterprise Server SP 1 with Terminal Services/Citrix 4.x Memory Disk Space 256 or 512 MB RAM with a 400 MHz Pentium processor (1 GHz Pentium processor recommended) Fast EIDE 2 or SCSI Interface with 2GB or better Same, PLUS memory sufficient to support each connected user Fast EIDE 2 or SCSI Interface with 2GB or better Graphics Monitor Mid to High 2D/3D card with 128 MB or better Greater than 1024x768 resolution or better Server: Same Greater than 1024x768 resolution or better Data 450 MB Data 450 MB Client: Choose based on resolution/speed requirements Note For Windows 2003 Server Users: Remember that some of the options you choose for the server can limit the options available to the client system. 4 MapInfo ProViewer 10.0 Chapter 1: Introduction to MapInfo ProViewer Installing MapInfo ProViewer To install MapInfo ProViewer: 1. Click the Start button. 2. Click Run and type or browse to the ProViewer setup.exe file. Click the OK button to begin the installation. The Welcome screen appears. 3. Click Next to continue to the License Agreement dialog box. 4. Click I accept the Terms and click Next to display the Customer Information dialog box. Complete these fields with appropriate entries to continue. 5. Click Next to display the Destination Folder dialog box. 6. In this dialog box, click Next to accept the default path or click Change to select a new path. The Ready to Install dialog box displays. 7. Click Install to begin the file transfer. The Installing dialog box appears. Note The .NET framework is installed as part of the MapInfo ProViewer installation. 8. When The InstallShield Wizard Completed dialog box appears, click Finish to complete the installation of MapInfo ProViewer. What’s New in MapInfo ProViewer? This section contains information about the new features of ProViewer. New in ProViewer 10.0 MapInfo ProViewer 10.0 menus and toolbar have a new look . Toolbar icons display in the ProViewer menus for those menu options that are also accessible from the toolbar. To view the new toolbar button icons, see Understanding the ProViewer Toolbar on page 9. MapInfo ProViewer 10.0 supports the following new features in tables and workspaces created using MapInfo Professional 10.0: • • • User Guide Enhanced Rendering. You can view maps in MapInfo ProViewer 10.0 that were created with new enhanced rendering features in MapInfo Professional 10.0. You can view translucent labels, themes, and layers, as well as anti-aliasing to smooth the jagged edges of text, labels, lines, curves, region borders and raster images. Support for Tables Containing UTF-8 Character Sets. MapInfo ProViewer now displays MapInfo tables that have data stored in UTF-8 encoding. Many Data vendors distribute data in Shapefile format which include DBF files. The attribute data may be in a UTF-8 character set. In previous releases, there was no easy way to access DBF files created with UTF-8 encoding. MapInfo Professional 10.0 is now able to open these files and save them to MapInfo tables, which are viewable in MapInfo ProViewer. Scale Bar Adornment. A workspace may now include a scale bar as an adornment on the map. The scale or geographic position of the map does not affect the position or size of the scale bar, so it remains stationary when zooming or panning the map. However, the properties and visual representation of a map scale may change as the map projection or scale changes. The scale 5 What’s New in MapInfo ProViewer? bar is drawn as the topmost elements on a map, on top of any labels and on top of the cosmetic layer. A scale bar may display with a border and a background. You can move a scale bar anywhere on the map by clicking and dragging it with the mouse cursor. Support for New Projection Systems MapInfo ProViewer 10.0 supports MapInfo tables in the following projection systems: • Popular Visualization CRS / Mercator (EPSG:3857). MapInfo ProViewer now supports the Popular Visualization CRS / Mercator coordinate reference system used in Microsoft Virtual Earth and Google Maps. Also known as "Spherical Mercator", this coordinate system uses the Mercator projection with a spherical parameter instead of an ellipsoid. This allows map data to properly align with map tiles in Virtual Earth and Google Maps and other web and visualization applications. The ellipsoid-based Mercator projection does not provide the proper alignment. The Spherical Mercator coordinate system has been accepted into the EPSG Geodetic Parameter Registry under the code EPSG:3857. Projections in GIS are commonly referred to by their EPSG code. The Popular Visualization CRS / Mercator is the official description for EPSG:3857. Support for EPSG:3857 includes a new WGS84 Sphere ellipsoid (ID 54) and a new datum (ID 157). • United States National Grid (USNG). MapInfo ProViewer now supports the United States National Grid for Spatial Addressing (USNG) coordinate reference system. This grid reference system that defines how to present Universal Transverse Mercator (UTM) coordinates at various levels of precision by specifying the use of those coordinates within the grid system defined by the Military Grid Reference System (MGRS). Additionally, it addresses specific presentation issues such as grid spacing. The UTM coordinate representation, the MGRS grid, and the specific grid presentation requirements together define the United States National Grid (USNG). Support for New Coordinate Systems MapInfo ProViewer 10.0 supports MapInfo tables in the following coordinate systems: Canadian Coordinate Systems. We have added Ministry of Transport of Quebec Coordinate Systems: • • • 6 "NAD27/MTQ Lambert\p3797", 3, 66, 7, -70, 44, 50, 46, 800000, 0 "NAD83/MTQ Lambert\p3798", 3, 74, 7, -70, 44, 50, 46, 800000, 0 "NAD83(CSRS)/MTQ Lambert\p3799", 3, 74, 7, -70, 44, 50, 46, 800000, 0 MapInfo ProViewer 10.0 Chapter 1: Introduction to MapInfo ProViewer Vietnamese Coordinate Systems. We have added new Vietnamese Coordinate Systems: • • • • • • • • • • • • • • • • • • • • • • • • • • • • • • • • • • • • User Guide "Hanoi 1972 / GK 106 NE (Meekong delta)", 8, 1001, 7, 106, 0, 1, 500000, 0 "Hanoi 1972 / GK zone 18 (6 Degree)", 8, 1001, 7, 105, 0, 1, 500000, 0 "Hanoi 1972 / GK zone 19 (6 Degree)", 8, 1001, 7, 111, 0, 1, 500000, 0 "Hanoi 1972 / GK zone 20 (6 Degree)", 8, 1001, 7, 117, 0, 1, 500000, 0 "Hanoi 1972 / GK zone 181 (3 Degree)", 8, 1001, 7, 102, 0, 1, 500000, 0 "Hanoi 1972 / GK zone 182 (3 Degree)", 8, 1001, 7, 105, 0, 1, 500000, 0 "Hanoi 1972 / GK zone 191 (3 Degree)", 8, 1001, 7, 108, 0, 1, 500000, 0 "Hanoi 1972 / GK zone 192 (3 Degree)", 8, 1001, 7, 111, 0, 1, 500000, 0 "Hanoi 1972 / GK zone 201 (3 Degree)", 8, 1001, 7, 114, 0, 1, 500000, 0 "Hanoi 1972 / GK zone 202 (3 Degree)", 8, 1001, 7, 117, 0, 1, 500000, 0 "Hanoi 1972 / GK zone 1811 (1.5 Degree)", 8, 1001, 7, 105, 0, 1, 500000, 0 "Hanoi 1972 / GK zone 1812 (1.5 Degree)", 8, 1001, 7, 105.75, 0, 1, 500000, 0 "Hanoi 1972 / GK zone 1813 (1.5 Degree)", 8, 1001, 7, 106.5, 0, 1, 500000, 0 "Hanoi 1972 / GK zone 1814 (1.5 Degree)", 8, 1001, 7, 107.25, 0, 1, 500000, 0 "Hanoi 1972 / GK zone 1815 (1.5 Degree)", 8, 1001, 7, 108, 0, 1, 500000, 0 "WGS 72BE / TM 106 NE (offshore Nam Con Son basin)", 8, 103, 7, 106, 0, 0.9996, 500000, 0 "Indian 1960 / TM 106 NE (offshore-Everest 1830)", 8, 131, 7, 106, 0, 0.9996, 500000, 0 "Indian 1960 Vietnam / UTM zone 48N (6 Degree)", 8, 131, 7, 105, 0, 0.9996, 500000, 0 "Indian 1960 Vietnam / UTM zone 49N (6 Degree)", 8, 131, 7, 111, 0, 0.9996, 500000, 0 "Indian 1960 Vietnam / UTM zone 50N (6 Degree)", 8, 131, 7, 117, 0, 0.9996, 500000, 0 "Indian 1960 Vietnam / UTM zone 481N (3 Degree)", 8, 131, 7, 102, 0, 0.9999, 500000, 0 "Indian 1960 Vietnam / UTM zone 482N (3 Degree)", 8, 131, 7, 105, 0, 0.9999, 500000, 0 "Indian 1960 Vietnam / UTM zone 491N (3 Degree)", 8, 131, 7, 108, 0, 0.9999, 500000, 0 "Indian 1960 Vietnam / UTM zone 492N (3 Degree)", 8, 131, 7, 111, 0, 0.9999, 500000, 0 "Indian 1960 Vietnam / UTM zone 501N (3 Degree)", 8, 131, 7, 114, 0, 0.9999, 500000, 0 "Indian 1960 Vietnam / UTM zone 502N (3 Degree)", 8, 131, 7, 117, 0, 0.9999, 500000, 0 "VN 2000 / WGS 84 zone 48 (6 Degree)", 8, 104, 7, 105, 0, 0.9996, 500000, 0 "VN 2000 / WGS 84 zone 49 (6 Degree)", 8, 104, 7, 111, 0, 0.9996, 500000, 0 "VN 2000 / WGS 84 zone 50 (6 Degree)", 8, 104, 7, 117, 0, 0.9996, 500000, 0 "VN 2000 / WGS 84 zone 481 (3 Degree)", 8, 104, 7, 102, 0, 0.9999, 500000, 0 "VN 2000 / WGS 84 zone 482 (3 Degree)", 8, 104, 7, 105, 0, 0.9999, 500000, 0 "VN 2000 / WGS 84 zone 491 (3 Degree)", 8, 104, 7, 108, 0, 0.9999, 500000, 0 "VN 2000 / WGS 84 zone 492 (3 Degree)", 8, 104, 7, 111, 0, 0.9999, 500000, 0 "VN 2000 / WGS 84 zone 501 (3 Degree)", 8, 104, 7, 114, 0, 0.9999, 500000, 0 "VN 2000 / WGS 84 zone 502 (3 Degree)", 8, 104, 7, 117, 0, 0.9999, 500000, 0 "Dong Nai VN 2000 (3 Degree)", 8, 104, 7, 107.75, 0, 0.9999, 500000, 0 7 Displaying a Map in MapInfo ProViewer We have added Vietnamese Coordinate Systems Gauss-Kruger (Pulkovo 1942): • • • • • • • • • • "GK Zone 106 (Pulkovo 1942) (6 Degree)", 8, 1001, 7, 106, 0, 1, 500000, 0 "GK Zone 18 (Pulkovo 1942) (6 Degree)", 8, 1001, 7, 105, 0, 1, 500000, 0 "GK Zone 19 (Pulkovo 1942) (6 Degree)", 8, 1001, 7, 111, 0, 1, 500000, 0 "GK Zone 20 (Pulkovo 1942) (6 Degree)", 8, 1001, 7, 117, 0, 1, 500000, 0 "GK zone 181 (Pulkovo 1942) (3 Degree)", 8, 1001, 7, 102, 0, 1, 500000, 0 "GK zone 182 (Pulkovo 1942) (3 Degree)", 8, 1001, 7, 105, 0, 1, 500000, 0 "GK zone 191 (Pulkovo 1942) (3 Degree)", 8, 1001, 7, 108, 0, 1, 500000, 0 "GK zone 192 (Pulkovo 1942) (3 Degree)", 8, 1001, 7, 111, 0, 1, 500000, 0 "GK zone 201 (Pulkovo 1942) (3 Degree)", 8, 1001, 7, 114, 0, 1, 500000, 0 "GK zone 202 (Pulkovo 1942) (3 Degree)", 8, 1001, 7, 117, 0, 1, 500000, 0 Displaying a Map in MapInfo ProViewer To explore the basics of desktop mapping concepts, let’s explore the World.wor workspace, which is installed with ProViewer. To display a map in the ProViewer product: 1. Click the Start button, select the All Programs, MapInfo and MapInfo ProViewer to display the ProViewer window. 2. Click the Open Tables or Workspaces tool or from the File menu, select Open to display the Open MapInfo Tables or Workspaces dialog box. Note You cannot open .MWS files created with MapInfo Professional in ProViewer. 3. Click the Data directory and click Open. 4. Click the World directory and click Open. 5. Select the World.wor entry and click Open to display the World workspace. 8 MapInfo ProViewer 10.0 Chapter 1: Introduction to MapInfo ProViewer Understanding the ProViewer Toolbar The toolbar icons at the top of the MapInfo ProViewer window can help you perform mapping work easily and efficiently. The Help System contains a detailed explanation of each icon. Open Tables or Workspace Print Window Help Select Zoom In Zoom Out Change View Grabber Info Tool Drag Map Window Ruler Show/Hide Legend Label HotLink Show/Hide Statistics Boundary Select Marquee Select Radius Select Polygon Select Graph Select Unselect All Invert Selection User Guide 9 A Brief Tour of the World.wor Workspace A Brief Tour of the World.wor Workspace Use the World.wor to review the map layers and experiment with these icons to become familiar with their functionality. You can think of a workspace as a map with transparencies stacked on top of it. Each layer contains data that pertains to the entire map. For example, World.wor includes the Ocean, the Countries, and the World Capitals layers. Using the Select Icon Click the Select tool and then position the cursor over any region to display the name of the region. There are several selection icons that allow you to select map features and group regions for display. See the Help System for more about the specific properties of each icon. 10 MapInfo ProViewer 10.0 Chapter 1: Introduction to MapInfo ProViewer Using the Statistics Icon Click the Show/Hide Statistics window. tool to display more about a selected country in the Statistics Using the Ruler Icon The Ruler tool can show distance between two points on a Map window. 1. Choose the Ruler map and click. • • User Guide tool and position the cursor, which displays as a cross, anywhere on the The Ruler window displays Distance and Total. As you move the cursor, the Distance measurement changes in the Ruler window. To measure the distance between two points, click the first point and double-click the second. To measure the length of a path containing two or more segments, continue the process, clicking once at the end of each segment to keep a running total of the length of the path. 11 A Brief Tour of the World.wor Workspace Using the Zoom Icons The Zoom options give you control over the display of the Map window. 1. Open a Map window and click the Zoom-in tool. Position the cursor anywhere on the map. Full featured Pitney Bowes Business Insight products allow you to determine the range (for example 0 to 3 miles, 2 to 5 miles) at which each layer is visible in a Map window. 2. To see the effect of zooming click the Zoom in icon anywhere on the map. The map redraws at the new zoom level. Notice that the information changes in the Zoom section of the Status Bar to reflect a new zoom level. 3. To specify the zoom level of the map, click the Change View level. tool and enter a new zoom At different zoom levels, new information displays on the map reflecting the visibility of the different map layers that comprise World.wor. 12 MapInfo ProViewer 10.0 Chapter 1: Introduction to MapInfo ProViewer Displaying the Map Legend The map’s legend explains the meaning of the different shapes, colors, and fill patterns. 1. Open a Map window and click the Show/Hide Legend the Show/Hide Legend command. tool or select the Options menu and Note Not all maps have legends. 2. Choose the Map menu option and the Previous View command to return the map from the beginning. We have provided the icon descriptions, the Glossary, and the online help to support you as you navigate through more mapping adventures! Getting Online Help Use ProViewer‘s comprehensive online Help, including sections on menu commands and dialog box descriptions, to answer your ProViewer questions. Getting Technical Support If you encounter problems installing MapInfo ProViewer, our technical support specialists can help. Technical Support for MapInfo ProViewer is limited to installation issues. For workspace-related issues, see the MapInfo Professional user who created the workspace. User Guide 13 Want to do more? For questions concerning the installation of ProViewer, contact Technical Support or visit the Pitney Bowes Business Insight website (www.mapinfo.com). For a listing of contact locations, see the Help System under Copyright Information. Want to do more? Consider... MapInfo Professional, the premier desktop mapping product for business and government. MapInfo Professional allows users to access their own data to see relationships between data and geography, answering questions such as... • • • Where are my best customers located? Where should I place my next sales office? How can I increase my sales? MapInfo Professional answers these questions in a straightforward manner, reducing the time it takes to make smarter decisions. 14 MapInfo ProViewer 10.0 Glossary This section contains a list of terms we use to describe ProViewer features and capabilities. A Term Definition Browser A window for viewing a table (or database, spreadsheet or text file) in tabular form. Coordinate An x,y location in a Cartesian coordinate system, or a Latitude, Longitude location in an earth coordinate system. Coordinates represent locations on a map relative to other locations. Earth coordinate systems may use the equator and the Greenwich prime meridian as fixed reference points. Plane coordinate systems describe a two-dimensional x,y location in terms of distance from a fixed reference and are usually in the first quadrant so that all coordinates are positive numbers. Degrees Longitude, Degrees Latitude, Decimal Degrees Degrees (longitude and latitude) are coordinates used to represent locations on the surface of the earth. Longitude, or X-coordinate, represents a location’s east-west position, where any location west of the prime meridian has a negative X value. Latitude, or Y-coordinate, represents a location’s north-south position, where any location south of the equator has a negative Y value. Field A field in a table corresponds to a column in a Browser. A field contains a specific type of information about an object, such as, name, abbreviation, land area, price, population, and so forth. The record for each object consists of that object’s values for each of the fields in the database. Graticule A grid of horizontal (latitude) and vertical (longitude) lines displayed on an earth map, spaced at a regular distance (for example, every five degrees, every fifteen degrees). Used to establish a frame of reference. Latitude The horizontal lines on a map that increase from 0 degrees at the Equator to 90 degrees at both the North (+90.0 degrees) and South (-90.0 degrees) poles. Used to describe the North-South position of a point as measured usually in degrees or decimal degrees above or below the equator. Legend The part of a map, which explains the meaning of different colors, shapes, or fill patterns used on the map. Longitude The vertical lines on a map, running from the North to South poles, used to describe the east-west position of a point. The position is reported as the number of degrees east (to -180.0 degrees) or west (to +180.0 degrees) of the prime meridian (0 degrees). Lines of longitude are farthest apart at the Equator and intersect at both poles, and therefore, are not parallel. Map Scale A statement of a measure of the map and the equivalent measure on the earth. Often expressed as a representative ratio of distance, such as 1:10,000. This means that one unit of distance on the map (for example, one inch) represents 10,000 of the same units of distance on the earth. The term scale must be used carefully. Technically, a map of a single city block is large–scale (for example, 1:12,000), while a map of an entire country is small– scale (for example, 1:1,000,000). A 1:1,000,000 map is considered small-scale because of the small numeric value obtained when you divide 1 by 1,000,000. 16 MapInfo ProViewer 10.0 Chapter A: Glossary Term Definition Map window A window that allows you to view a table as a map. Node An end-point of a line object, or an end-point of a line segment which is part of a polyline or region object. Raster Image A type of computerized picture consisting of row after row of tiny dots (pixels). Raster images are sometimes known as bitmaps. Aerial photographs and satellite imagery are common types of raster data found in GIS. A computer image can be represented in raster format or in vector format. See Vector Image on page 17. Record All the information about one object in a database or table. A record in a table corresponds to a row in a Browser. Selection A data item or set of data items chosen for inspection and/or analysis. Regardless of the kinds of windows on the screen, selections can be made using the Select and SQL Select Query commands in MapInfo Professional’s Query menu. In Browsers and Map windows, items can be placed in the selection set by clicking on them individually. Map windows also have special tools for selecting multiple items on a spatial basis. Status Bar A bar at the bottom of the screen that displays messages that help in using MapInfo Professional. The StatusBar also displays messages that pertain to the active window. In a Map window, the StatusBar indicates what layer is editable, the zoom display of the map, and the status of Snap and Digitizing modes. In a Browser window, the StatusBar indicates the number of records currently displaying and the total number of records. In a Layout window, the StatusBar indicates the zoom display as a percentage of the actual size of the map. Table A table is made up of data in rows and columns. Each row contains information about a particular geographic feature, event, etc. Each column contains a particular kind of information about the items in the table. You can display tables with graphic information stored in them as maps. Vector Image A coordinate-based data structure commonly used to represent map features. Each object is represented as a list of sequential x,y coordinates. Attributes may be associated with the objects. A computer image can be represented in vector format or in raster format. See Raster Image on page 17. Workspace A saved configuration of open MapInfo tables and windows. Zoom Layering A setting that determines the range (for example, 0–3 miles, 2–5 miles, etc.) at which a layer is visible in a Map window. User Guide 17 18 MapInfo ProViewer 10.0 Index B N Browser windows defined 16 nodes defined 17 C P coordinates defined 16 ProViewer displaying a map in 8 features added in 9.5 5 installing 5 understanding the toolbar 9 D degrees latitude definition 16 degrees longitude definition 16 Displaying a Map 8 R features added in 10.0 5 fields definition 16 raster images defined 17 record definition 17 Ruler icon 11 G S graticule definition 16 Select icon 10 Statistics icon 11 status bar defined 17 F H Help getting online 13 L latitude definition 16 Legend, displaying a map’s 13 longitude, defined 16 M map scale defined 16 Map windows defined 17 Map, displaying in ProViewer 8 MapInfo Professional, getting more out of maps with 14 User Guide T tables defined 17 Technical Support, getting 13 Toolbar using the Ruler icon 11 using the Select icon 10 using the Statistics icon 11 using the Zoom icons 12 Toolbar, icons in 9 V vector image definition 17 19 Index W workspaces defined 17 Z Zoom icons 12 zoom layering defined 17 20 MapInfo ProViewer 10.0