1
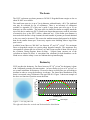
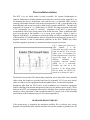
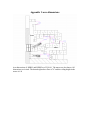
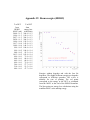
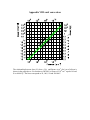
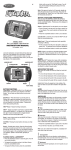
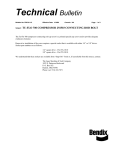
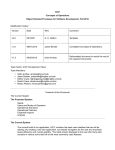
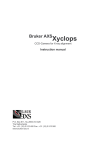
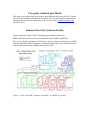
User guide, technical part,May06
This guide is provided to help users plan for their radiation effects tests at IUCF. General
features of the radiation test station are described. Users are encouraged to communicate
open questions and special requirements to B. von Przewoski ([email protected]
(812) 855 2913)
Indiana University Cyclotron Facility
Figure 1 shows the layout of IUCF including projects under construction.
RERP (dark blue) consists of two new irradiation rooms, RERS1 and RERS2.
The neutron facility consisting of LENS (Low Energy Neutron Scattering) and NREP
(Neutron Radiation Effects Program) is indicated in light blue. First neutron beams for
radiation testing have been available since October 2005.
Figure 1: IUCF with RERP, dark blue, and NREP syn. RERPIII, light blue.
The beam
The IUCF cyclotrons accelerate protons to 205 MeV. Degraded beam energies as low as
about 50 MeV are available.
The usual beam spot size is up to 7cm in diameter with uniformity <40%. The irradiated
area may be restricted by use of collimators. There is an inventory of collimators
available in Appendix VI of this user’s guide. Larger beam spot sizes (up to 30 cm
diameter) are also available. The beam spot size should be chosen to roughly match the
size of the device under test (DUT). Beam spots larger than necessary result in activation
of materials close to the DUT (cables, connectors etc.). If the beam spot diameter is
increased while the flux is kept constant, the total number of protons per second admitted
to the cave must be increased. This causes the ambient neutron background to be higher
than for the smaller beam spot. Testers may require extra shielding when a large beam
spot is used.
Available beam fluxes at 200 MeV are between 102 and 1011 p/s/cm2. For maximum
fluxes at degraded energies see section about degraded energies. The maximum flux
corresponds to a beam spot size of about 3 cm2 and a beam current of about 300 nA out of
the cyclotron. During daytime hours (8:00am – 5:00pm) beam currents out of the
cyclotron are limited to 50nA. A convenient flux calculator for both beamlines can be
found on our website at http://www.iucf.indiana.edu/rerp/maxflux.php.
Dosimetry
IUCF provides the dosimetry. For fluxes between 106-1011 p/s/cm2 the dosimetry is done
with a calibrated secondary electron monitor. At lower fluxes (as low as 102 p/s/cm2) we
use a small scintillator for dosimetry. We need to know at which flux you are looking to
irradiate in order to set up the dosimetry in advance. The lateral dose distribution of the
beam is measured using Gafchromic film type HD-810. Figure 2 shows an example of
the dose as a function of position across the beam.
Dose (kRad(Si))
30
25
20
15
10
5
0
-45 -40-35 -30 -25-20 -15 -10 -5 0 5 10 15 20 25 30 35 40 45
Position (mm)
Top to Bottom
Left to Right
Figure 2: The left panel shows Gafchromic film type HD-810 irradiated to 30kRad (Si).
The right side shows the vertical and horizontal dose distribution.
The irradiation stations
The DUT is in air, which makes it easily accessible. No vacuum feedthroughs are
required. Dimensions of both irradiation areas and mazes can be found in Appendix I. As
for mounting the devices in the beam: each room has an x,y,z adjustable table, which is
remotely positionable from the DAQ in the two dimensions, x and y, perpendicular to the
beam direction, and several vise grips to hold boards, systems and the like. The table will
support DUTs as large as 3′ x 3′ and as heavy as 200 lbs. The range of motion of the table
is 18" horizontally (x) and 12" vertically. Alignment of the DUT is conveniently
accomplished with a laser which points in the beam direction. There is additional table
space near the end of the beamline, e.g. to set up power supplies. Figure 3 shows a
diagram of RERS1(2). A collimator to restrict the beam size may be mounted to the end
of the beamline (#5). Both beamlines allow to degrade the beam energy by means of a Cu
degrader between #5 and #6 immediately upstream of the DUT. RERS2 also offers
beryllium degraders upstream of a momentum analysis magnet (see below).
Fig.3: Beam goes from left to
right. Number 1 is the
removable stop which turns the
beam on and off. #2 is a target
ladder with a scintillator for
beam alignment and a Cu foil to
spread the beam. #3 is the
defining
collimator
and
secondary emission monitor
(SEM). #4 is a removable
Faraday cup and #6 is the
entrance to the beam dump.
Devices under test (DUTs) are
placed in air between 5 and 6.
The distance between the DUT and the data acquisition area is about 80 ft. Some standard
cables along this length are provided and listed in Appendix VII. If you need special
cables to connect to your equipment inside the radiation area, you need to bring them.
Equipment other than the DUT can be in the irradiation area. Sometimes equipment
requires shielding from neutron background, which can for instance upset a tester. Cables
between the DUT and equipment that requires shielding from neutrons should be long
enough to allow placement of that equipment behind a concrete wall of the shielding
maze leading to the irradiation area (see area layout Appendix I).
DEGRADED BEAM ENERGIES
If the beam energy is degraded, the maximum available flux is reduced. Any energy
degrader will spread the beam laterally and thus decrease the number of protons/s/cm2. In
RERS1 the flux reduction due to the presence of the degrader is negligible while in
RERS2 the maximum available flux is about two orders of magnitude lower at 50 MeV
than at 200 MeV (See Appendix V).
If the beam spot size is large, the flux will be further reduced. The maximum flux
calculator at http://www.iucf.indiana.edu/rerp/maxflux.php may be used to predict the
flux in either beamline, for a particular energy and spot size.
RERS1 AND RERS2
Lower energies may be obtained by placing a Cu degrader immediately upstream of the
DUT. In RERS1 degraders are mounted on a remotely operated degrader positioner
which has room for up to four degraders. If this positioner is used it only takes a minute
or less to change the energy. If more than 4 energies are required, the three degraders
may be changed in about 10 minutes. Straggling increases the energy spread of degraded
beams. Without momentum selection between the degrader and the DUT the beam
energy spread increases with degrader thickness (see Appendix II).
RERS2
In RERS2 beam energies below 200 MeV may be obtained by degrading the beam far
upstream of the DUT. The energy is momentum analyzed by a dipole and slit system
downstream of a beryllium degrader. This results in a narrow beam energy spread also
for lower beam energies. Neither the degrader nor the dipole and slit system are located
in the irradiation room.
Appendix III illustrates the difference in beam energy spread for the lowest available
energy (~50 MeV) in both beamlines. The data in Appendix III were obtained using a
multi-leaf Faraday Cup (MLFC). The MLFC consists of 30 layers of 0.5 mm thick Al
leaves alternating with 80μm thick kapton sheets. The protons stop in the Al layers and
the current from each Al sheet is read out. The highest current is measured where the
beam ranges out. The larger width of the curve labeled RERS1 (Appendix III) is due to
the presence of the degrader upstream of the DUT. The width of the curve labeled
RERS2 does not represent the beam energy spread, which is much smaller. Instead, the
width is due to straggling in the front plate and the Al of the MLFC itself.
The energy of the beam at the DUT (device under test) can be determined from energy
loss calculations in two ways. 1.) The starting energy for an energy loss calculation is
optimized such that the beam stops in the Al layer as determined from the MLFC
spectrum . 2.) The energy as determined by the trunkline MLFC is used and the energy
loss in the Be degrader is taken into account to calculate the energy at the DUT. The two
calculations give the same result within error. Table 1, Appendix IV lists the energies
obtained both ways. The error estimate is based on the uncertainty introduced by different
iteration methods in the energy loss calculations.
The flux depends strongly on energy, because the momentum selection system only
transmits that portion of the beam which has the desired energy downstream of the
beryllium degrader. Obviously, there is a trade-off of narrow beam energy spread vs
intensity. Appendix V lists maximum flux as a function of energy. The method of choice
to degrade the beam energy depends on the application and whether high flux or small
energy spread is the prime concern.
TAGGED PROTONS (RERS1)
Tagged protons are obtained by scattering the beam protons off the hydrogen contained
in a CH2 (polyethylene) target. Elastic proton-proton scattering events are easily
identified by the characteristic opening angle (~90º) between the protons. If a scattered
proton is detected at ~90º relative to the DUT, the accompanying recoil at the location of
the DUT is called a tagged proton. Since tagged protons are obtained via a nuclear
reaction, their flux is very low. Tagged protons require a dedicated setup. Please contact
B. von Przewoski ([email protected] (812) 855 2913) for details.
Our website: http://www.iucf.indiana.edu/rerp
Appendix I: area dimensions
maze
maze
Area dimensions of RERS1 and RERS2 as of 2/19/04. The mazes are also shown. All
dimensions are in inch. The beam height above floor is 76″ and the ceiling height in the
mazes is 8 ft
Appendix II: degraded beam energy spread
Beam energy spread as a
function of degraded
beam energy. The points
are results from SRIM
calculations
for
Cu
degraders of 0.50, 1.90,
3.18 and 3.98 cm. The
line is an exponential fit
to guide the eye.
Appendix III: Beam energy spread
Multi Leaf Faraday Cup
spectra (see section about
degraded
beams)
for
degraded beams in RERS1
and RERS2. The difference
in width between the two
curves is due to the presence
of the degrader immediately
upstream of the DUT in
RERS1. The lines are SRIM
calculations
Appendix IV: Beam energies (RERS2)
T at DUT
from
RERS2
MLFC (red)
204.8 +/-1.3
199.6 +/-1.3
205.7 +/-1.3
205.8 +/-1.3
149.6 +/-0.4
141.7 +/-0.4
148.4 +/-0.4
99.4 +/-0.2
99.4 +/-0.2
90.8 +/-0.2
101.3 +/-0.2
69.6 +/-0.1
66.8 +/-0.1
66.9 +/-0.1
69.4 +/-0.1
54.6 +/-0.1
51.0 +/-0.1
48.4 +/-0.1
T at DUT
from
energy loss
in Be (blue)
204.8 +/-1.3
199.9 +/-1.3
206.2 +/-1.3
206.2 +/-1.3
150.2 +/-1.3
142.4 +/-1.3
148.5 +/-1.3
100.4 +/-1.4
100.4 +/-1.4
92.2 +/-1.4
102.4 +/-1.4
71.8 +/-1.5
68.8 +/-1.5
68.8 +/-1.5
71.8 +/-1.5
57.7 +/-1.5
51.5 +/-1.6
47.7 +/-1.6
Energies without degrader and with the four Be
degraders. The slightly different energies per degrader
correspond to different spreaders. The x-axis is
arbitrary for ease of plotting. The red points
correspond to the energy at the DUT as calculated
from the MLFC at the end of the RERS2 beamline.
The blue points are energy loss calculations using the
trunkline MLFC as the starting energy.
Appendix V: available flux
Table 1: Fluxes for a 2.5 cm diameter
beamspot as a function of energy for
both beamlines and for a daytime beam
current of 50 nA out of the cyclotron
Energy (MeV)
200
149
102
72
52
Flux (p/s/cm2)
RERS1
1.5e10
1.4e10
1.3e10
1.1e10
1.1e10
Flux (p/s/cm2)
RERS2
1.5e10
3.0e9
7.4e8
3.0e8
1.6e8
Appendix VI: available collimator sizes
1.18" dia. (round)
1"x1.5", 1"x2.5", 2"x2.25" (rectangular)
1"x1", 1.25"x1.25", 1.875"x1.875 " (square)
Appendix VII: cables between irradiation area and DAQ (80′)
BNC, RS232, AC power controlled from DAQ, GPIB, keyboard cable, monitor cable, 8
BNC cables, 8 SHV cables
Note: not all PCs drive a 80′ keyboard or monitor cable
Appendix VIII: unit conversion
The relationship between dose (Si), dose (Gy) and fluence (cm-2) for 1cm of silicon is
shown in the graph above. For instance at 200 MeV a fluence of 1010 cm-2 equals 0.6 krad
Si or 0.006 Gy. The lines correspond to 50, 100, 150 and 200 MeV.