1
TIBCO Spotfire S+ 8.2
Workbench User’s Guide
®
November 2010
TIBCO Software Inc.
IMPORTANT INFORMATION
SOME TIBCO SOFTWARE EMBEDS OR BUNDLES OTHER
TIBCO SOFTWARE. USE OF SUCH EMBEDDED OR
BUNDLED TIBCO SOFTWARE IS SOLELY TO ENABLE THE
FUNCTIONALITY (OR PROVIDE LIMITED ADD-ON
FUNCTIONALITY) OF THE LICENSED TIBCO SOFTWARE.
THE EMBEDDED OR BUNDLED SOFTWARE IS NOT
LICENSED TO BE USED OR ACCESSED BY ANY OTHER
TIBCO SOFTWARE OR FOR ANY OTHER PURPOSE.
USE OF TIBCO SOFTWARE AND THIS DOCUMENT IS
SUBJECT TO THE TERMS AND CONDITIONS OF A
LICENSE AGREEMENT FOUND IN EITHER A SEPARATELY
EXECUTED SOFTWARE LICENSE AGREEMENT, OR, IF
THERE IS NO SUCH SEPARATE AGREEMENT, THE
CLICKWRAP END USER LICENSE AGREEMENT WHICH IS
DISPLAYED DURING DOWNLOAD OR INSTALLATION OF
THE SOFTWARE (AND WHICH IS DUPLICATED IN TIBCO
SPOTFIRE S+® LICENSES). USE OF THIS DOCUMENT IS
SUBJECT TO THOSE TERMS AND CONDITIONS, AND
YOUR USE HEREOF SHALL CONSTITUTE ACCEPTANCE
OF AND AN AGREEMENT TO BE BOUND BY THE SAME.
This document contains confidential information that is subject to
U.S. and international copyright laws and treaties. No part of this
document may be reproduced in any form without the written
authorization of TIBCO Software Inc.
TIBCO Software Inc., TIBCO, Spotfire, TIBCO Spotfire S+,
Insightful, the Insightful logo, the tagline "the Knowledge to Act,"
Insightful Miner, S+, S-PLUS, TIBCO Spotfire Axum,
S+ArrayAnalyzer, S+EnvironmentalStats, S+FinMetrics, S+NuOpt,
S+SeqTrial, S+SpatialStats, S+Wavelets, S-PLUS Graphlets,
Graphlet, Spotfire S+ FlexBayes, Spotfire S+ Resample, TIBCO
Spotfire Miner, TIBCO Spotfire S+ Server, TIBCO Spotfire Statistics
Services, and TIBCO Spotfire Clinical Graphics are either registered
trademarks or trademarks of TIBCO Software Inc. and/or
subsidiaries of TIBCO Software Inc. in the United States and/or
other countries. All other product and company names and marks
mentioned in this document are the property of their respective
owners and are mentioned for identification purposes only. This
ii
software may be available on multiple operating systems. However,
not all operating system platforms for a specific software version are
released at the same time. Please see the readme.txt file for the
availability of this software version on a specific operating system
platform.
THIS DOCUMENT IS PROVIDED “AS IS” WITHOUT
WARRANTY OF ANY KIND, EITHER EXPRESS OR IMPLIED,
INCLUDING, BUT NOT LIMITED TO, THE IMPLIED
WARRANTIES OF MERCHANTABILITY, FITNESS FOR A
PARTICULAR PURPOSE, OR NON-INFRINGEMENT. THIS
DOCUMENT COULD INCLUDE TECHNICAL
INACCURACIES OR TYPOGRAPHICAL ERRORS.
CHANGES ARE PERIODICALLY ADDED TO THE
INFORMATION HEREIN; THESE CHANGES WILL BE
INCORPORATED IN NEW EDITIONS OF THIS DOCUMENT.
TIBCO SOFTWARE INC. MAY MAKE IMPROVEMENTS
AND/OR CHANGES IN THE PRODUCT(S) AND/OR THE
PROGRAM(S) DESCRIBED IN THIS DOCUMENT AT ANY
TIME.
Copyright © 1996-2010 TIBCO Software Inc. ALL RIGHTS
RESERVED. THE CONTENTS OF THIS DOCUMENT MAY
BE MODIFIED AND/OR QUALIFIED, DIRECTLY OR
INDIRECTLY, BY OTHER DOCUMENTATION WHICH
ACCOMPANIES THIS SOFTWARE, INCLUDING BUT NOT
LIMITED TO ANY RELEASE NOTES AND "READ ME" FILES.
TIBCO Software Inc. Confidential Information
Reference
The correct bibliographic reference for this document is as follows:
TIBCO Spotfire S+® 8.2 Workbench User’s Guide TIBCO Software Inc.
iii
TIBCO SPOTFIRE S+ BOOKS
Note about Naming
Throughout the documentation, we have attempted to distinguish between the language
(S-PLUS) and the product (Spotfire S+).
•
“S-PLUS” refers to the engine, the language, and its constituents (that is objects,
functions, expressions, and so forth).
•
“Spotfire S+” refers to all and any parts of the product beyond the language, including
the product user interfaces, libraries, and documentation, as well as general product and
language behavior.
®
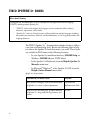
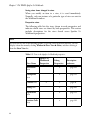
The TIBCO Spotfire S+ documentation includes books to address
your focus and knowledge level. Review the following table to help
you choose the Spotfire S+ book that meets your needs. These books
are available in PDF format in the following locations:
•
In your Spotfire S+ installation directory (SHOME\help on
Windows, SHOME/doc on UNIX/Linux).
•
In the Spotfire S+ Workbench, from the Help Spotfire S+
Manuals menu item.
•
In Microsoft Windows , in the Spotfire S+ GUI, from the
Help Online Manuals menu item.
®
®
Spotfire S+ documentation.
iv
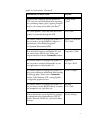
Information you need if you...
See the...
Must install or configure your current installation
of Spotfire S+; review system requirements.
Installtion and
Administration Guide
Want to review the third-party products included
in Spotfire S+, along with their legal notices and
licenses.
Licenses
Spotfire S+ documentation. (Continued)
Information you need if you...
See the...
Are new to the S language and the Spotfire S+
GUI, and you want an introduction to importing
data, producing simple graphs, applying statistical
Getting Started
Guide
®
models, and viewing data in Microsoft Excel .
Are a new Spotfire S+ user and need how to use
Spotfire S+, primarily through the GUI.
User’s Guide
Are familiar with the S language and Spotfire S+,
and you want to use the Spotfire S+ plug-in, or
customization, of the Eclipse Integrated
Development Environment (IDE).
Spotfire S+ Workbench
User’s Guide
Have used the S language and Spotfire S+, and
you want to know how to write, debug, and
program functions from the Commands window.
Programmer’s Guide
Are familiar with the S language and Spotfire S+,
and you want to extend its functionality in your
own application or within Spotfire S+.
Application
Developer’s Guide
Are familiar with the S language and Spotfire S+,
and you are looking for information about creating
or editing graphics, either from a Commands
window or the Windows GUI, or using Spotfire
S+ supported graphics devices.
Guide to Graphics
Are familiar with the S language and Spotfire S+,
and you want to use the Big Data library to import
and manipulate very large data sets.
Big Data
User’s Guide
Want to download or create Spotfire S+ packages
for submission to the Comprehensive S-PLUS
Archive Network (CSAN) site, and need to know
the steps.
Guide to Packages
v
Spotfire S+ documentation. (Continued)
vi
Information you need if you...
See the...
Are looking for categorized information about
individual S-PLUS functions.
Function Guide
If you are familiar with the S language and
Spotfire S+, and you need a reference for the
range of statistical modelling and analysis
techniques in Spotfire S+. Volume 1 includes
information on specifying models in Spotfire S+,
on probability, on estimation and inference, on
regression and smoothing, and on analysis of
variance.
Guide to Statistics,
Vol. 1
If you are familiar with the S language and
Spotfire S+, and you need a reference for the
range of statistical modelling and analysis
techniques in Spotfire S+. Volume 2 includes
information on multivariate techniques, time series
analysis, survival analysis, resampling techniques,
and mathematical computing in Spotfire S+.
Guide to Statistics,
Vol. 2
CONTENTS
Chapter 1
The TIBCO Spotfire S+ Workbench
1
Introduction
3
Terms and Concepts
4
Finding Help for the Workbench
7
Starting the Spotfire S+ Workbench
10
Examining Spotfire S+ Preferences
14
Examining the Spotfire S+ Workbench GUI
31
Commonly-Used Features in Eclipse
62
Chapter 2
The TIBCO Spotfire S+ Perspective
65
Introduction
66
Spotfire S+ Perspective Views
68
Chapter 3 TIBCO Spotfire S+ Workbench
Debug Perspective
89
Introduction
90
Debug Perspective Options and Preferences
92
Debug Perspective Views
98
Chapter 4 TIBCO Spotfire S+ Workbench Tasks
123
Introduction
125
Spotfire S+ Workbench Projects
126
Customized Perspective Views
148
vii
Contents
Working Projects and Databases
151
Spotfire S+ Project Files and Views
156
Packages in the Workbench
168
Spotfire Statistics Services Remote Submissions
178
Spotfire S+ Workbench Debugger Tasks
188
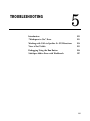
Chapter 5
201
Introduction
202
“Workspace in Use” Error
203
Working with Calls to Spotfire S+ GUI Functions
204
View is Not Visible
205
Debugging Using the Run Button
206
Subclipse Add-in Error with Workbench
207
Index
viii
Troubleshooting
209
THE TIBCO SPOTFIRE S+
WORKBENCH
1
Introduction
3
Terms and Concepts
4
Finding Help for the Workbench
Getting Started Tutorial
Help for Spotfire S+ Functions
The Spotfire S+ Workbench PDF
7
7
8
9
Starting the Spotfire S+ Workbench
From Microsoft Windows
From Unix
The Spotfire S+ Workspace
10
10
11
12
Examining Spotfire S+ Preferences
File Associations
Spotfire S+ Workbench options
Send Output from Run Action to Console View
Spotfire S+ Package Repository
Console Options
Editor
Outline Options
Output Options
Task Options
Statistics Services Options
14
14
16
17
18
18
20
23
24
25
25
Examining the Spotfire S+ Workbench GUI
Spotfire S+ New Project Wizard
Customized Menus, Toolbars, and Dialogs
Spotfire S+ Workbench Status Bar
Spotfire S+ Workbench Perspectives and Views
Default Shared Views
31
31
31
40
42
49
1
Chapter 1 The TIBCO Spotfire S+ Workbench
Commonly-Used Features in Eclipse
Using the Workbench as an Eclipse Plug-In
2
62
63
Introduction
INTRODUCTION
TIBCO Spotfire S+ provides a plug-in, or customization, of the
Eclipse Integrated Development Environment (IDE) called the
Spotfire S+ Workbench. You can use the Spotfire S+ Workbench, the
basic Eclipse IDE features, and other third-party plug-ins for many
tasks, including:
•
Manage your project files and tasks.
•
Edit your code.
•
Run Spotfire S+ commands.
•
Examine Spotfire S+ objects.
•
Debug your code.
•
Track resource use, functions, variables, and expressions.
•
Troubleshoot problems with Spotfire S+ code.
•
Provide source control for shared project files.
The Spotfire S+ Workbench is a stand-alone application that runs the
S-PLUS engine. When you run the Spotfire S+ Workbench, you do
not need to run any other version of Spotfire S+ (for example, the
console or traditional Windows or Java GUI).
Caution
If you run two or more simultaneous sessions of Spotfire S+ (including one or more in the
Spotfire S+ Workbench), take care to use different working directories. To use the same working
directory for multiple sessions can cause conflicts, and possibly even data corruption.
This chapter introduces the Spotfire S+ Workbench and provides
important conceptual information and definitions of terms you need
to know to use the Spotfire S+ Workbench most effectively.
•
Chapter 2 provides reference for the Spotfire S+ perspective.
•
Chapter 3 provides reference for the Debug perspective.
•
Chapter 4 provides tasks for learning to use the Spotfire S+
Workbench.
3
Chapter 1 The TIBCO Spotfire S+ Workbench
TERMS AND CONCEPTS
Before you start using the Spotfire S+ Workbench, you should
understand key terms and concepts that vary from the traditional
Spotfire S+ for Windows GUI and Spotfire S+ for UNIX Java GUI.
Note
If you are using the Eclipse IDE on a UNIX platform from a Windows machine using a
Windows X-server software package, you might notice that Eclipse runs slowly, similar to the
Spotfire S+ Java GUI. See the Release Notes for more information and recommendations for
improving UI performance.
Note
Eclipse version 3.2 or later does not support SPARC/Motif for Solaris. If you are using a version
of Solaris prior to version 10, you must install the GTK (version 2.2.4 or greater) library. For
more information about finding this library, see http://www.sun.com/software/solaris/. (This
library is included in Solaris 10.)
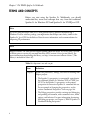
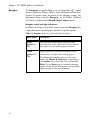
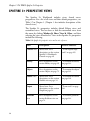
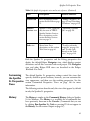
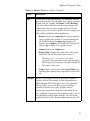
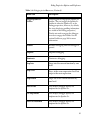
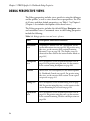
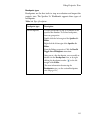
Table 1.1: Important terms and concepts.
Term
Definition
Perspective
Defines the preferences, settings, and views for working with
Eclipse projects.
• The Spotfire S+ perspective is conceptually equivalent to
the traditional Spotfire S+ Windows GUI or UNIX Java
GUI. Use the Spotfire S+ perspective as the primary
perspective for interactive Spotfire S+ command line use.
For an example of changing the perspective, see the
section Customized Perspective Views on page 148.
• The Debug perspective provides an integrated debugging
and profiling environment, with customized views, menu
options, and behavior. For more information about using
the Debug perspective, see Chapter 3, TIBCO Spotfire S+
Workbench Debug Perspective.
4
Terms and Concepts
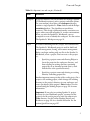
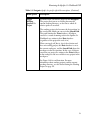
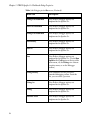
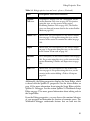
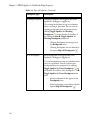
Table 1.1: Important terms and concepts. (Continued)
Term
Definition
Workspace
A physical directory on your machine that manages Spotfire
S+ Workbench resources such as projects and other options.
On your machine's hard drive, the workspace directory
contains a single Spotfire S+ .Data database and the Eclipse
.metadata database. (You should never touch these
resources.) This design is different from the association you
notice when you work in Spotfire S+ in other environments.
When you start the Spotfire S+ Workbench, you are
prompted to create or identify the workspace. See the section
The Spotfire S+ Workspace on page 12.
Project
A resource containing text files, scripts, and associated files.
The Spotfire S+ Workbench project is used for build and
version management, sharing, and resource management.
Before you begin working with any files in the Spotfire S+
Workbench, create a project. You can create a new project
by:
•
Specifying a project name and allowing Eclipse to
locate the project in the workspace directory, and
then selecting an existing directory containing
project files at an alternate location (that is, work
with the files at the specified location).
•
Specifying a project name and selecting an existing
directory containing project files.
Another important concept is that of the working project. Set a
project as the working project, which changes the working
directory to the project’s directory in your workspace and
stores data objects in the project’s .Data database. See the
section Setting the Working Project on page 151 for more
information.
Important: If you select an existing Spotfire S+ project
directory for your Workbench project, you must set that
project to be the working project to write data objects to its
.Data directory. See the section Working Projects and
Databases on page 151 for a detailed discussion. See the
section Quick Start on page 127.
5
Chapter 1 The TIBCO Spotfire S+ Workbench
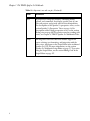
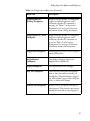
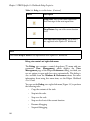
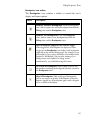
Table 1.1: Important terms and concepts. (Continued)
6
Term
Definition
View
A perspective’s integrated window, containing menus,
options, and commands, that display specific parts of your
data and projects and provide tools for data manipulation.
For descriptions of the Spotfire S+ perspective views, see the
section Spotfire S+ Perspective Views on page 68. For
descriptions of the Debug perspective views, see the section
Debug view on page 100. For practice exercises working with
views, see Chapter 4, TIBCO Spotfire S+ Workbench Tasks.
Editor
An integrated code/text editor that includes support for
syntax coloring, text formatting, and integration with the
other views. Analogous to the Script Editor in the traditional
Spotfire S+ GUI. For more information, see the section
Spotfire S+ Workbench Script Editor on page 57. To practice
using the Script Editor, see the section Editing Code in the
Script Editor on page 157.
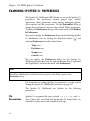
Finding Help for the Workbench
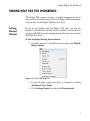
FINDING HELP FOR THE WORKBENCH
The Eclipse IDE contains extensive, in-depth documentation for its
user interface. For information about basic Eclipse IDE functionality,
on the menu, see the Eclipse Workbench User Guide.
Getting
Started
Tutorial
If you are not familiar with the Eclipse IDE, after you start the
Spotfire S+ Workbench, take the first few minutes to learn the basic
concepts and IDE layout by working through the basic tutorial in the
Workbench User Guide.
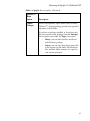
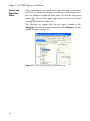
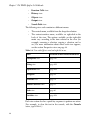
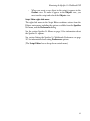
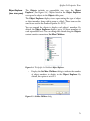
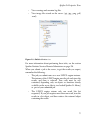
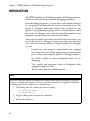
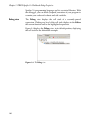
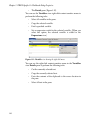
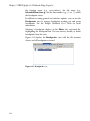
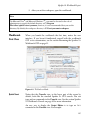
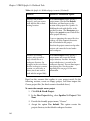
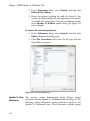
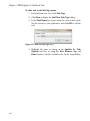
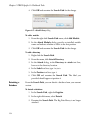
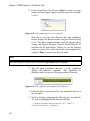
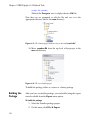
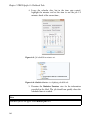
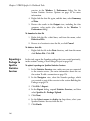
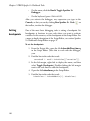
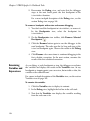
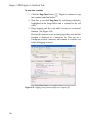
To view the Eclipse Getting Started tutorial
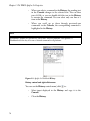
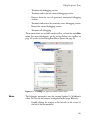
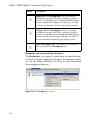
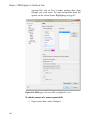
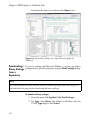
1. From the Spotfire S+ Workbench main menu, click Help Help Contents.
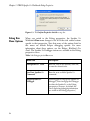
Figure 1.1: Eclipse IDE Help menu.
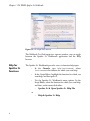
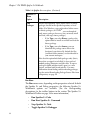
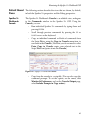
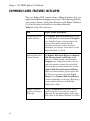
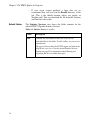
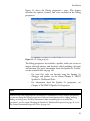
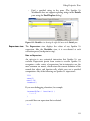
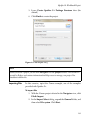
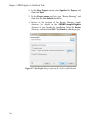
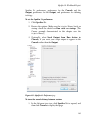
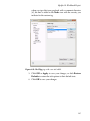
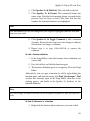
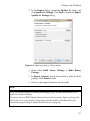
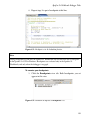
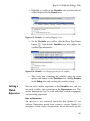
2. In the left pane, expand the table of contents by clicking
Workbench User Guide.
3. Click Getting Started, and then click Basic tutorial.
7
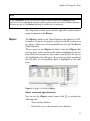
Chapter 1 The TIBCO Spotfire S+ Workbench
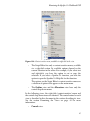
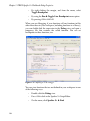
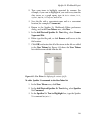
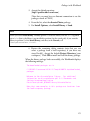
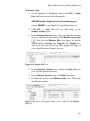
Figure 1.2: The Eclipse basic tutorial.
The Workbench User Guide opens in a separate window; you can toggle
between the Spotfire S+ Workbench application and the Help
browser.
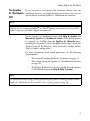
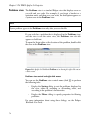
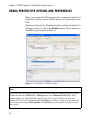
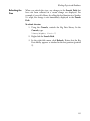
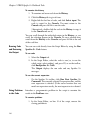
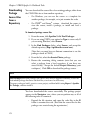
Help for
Spotfire S+
Functions
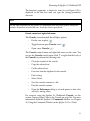
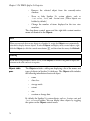
The Spotfire S+ Workbench provides access to function help topics.
•
In
the
Console, type help(functionname) where
functionname is the function for which you want help.
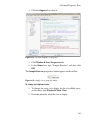
•
In the Script Editor, highlight the function for which you
want help, and then press F1.
•
Use the Spotfire S+ Workbench menu options. In the
Script Editor, select the function for which you want help,
and then, on the menu click either:
•
Spotfire S+ Open Spotfire S+ Help File
•
Help Spotfire S+ Help
or
8
Finding Help for the Workbench
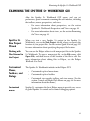
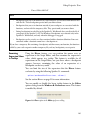
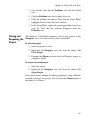
The Spotfire
S+ Workbench
PDF
If you browsed to and opened this document directly from the
installation directory, you might be interested to know how you can
open it directly from the Spotfire S+ Workbench user interface.
Note
®
®
Whether you are working in Windows or a UNIX platform, You must have access to a PDF
reader to open any of the PDFs shipped with Spotfire S+.
On the Spotfire S+ Workbench menu, click Help Spotfire S+
Manuals Spotfire S+ Workbench Guide. (Note that all Spotfire
S+ manuals are available from the Spotfire S+ Manuals menu,
including the Programmer’s Guide, the Application Developer’s Guide, the
Function Guide, the Big Data User’s Guide, the Guide to Packages and the
Guide to Graphics, among others.)
For more information about setting preferences, see the following
documentation:
•
The section Examining Spotfire S+ Preferences on page 14.
•
The section Setting the Spotfire S+ Workbench Preferences
on page 137.
•
The Eclipse Workbench User Guide, available from the Spotfire
S+ Workbench menu item Help Help Contents.
Note
For information about creating a package project using the Spotfire S+ Packages feature with the
Spotfire S+ Workbench, see the section To create a package project on page 168.
9
Chapter 1 The TIBCO Spotfire S+ Workbench
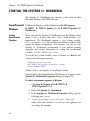
STARTING THE SPOTFIRE S+ WORKBENCH
The Spotfire S+ Workbench user interface is the same in both
Microsoft Windows and UNIX platforms.
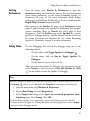
From Microsoft
Windows
In Microsoft Windows, click the Start menu All Programs
TIBCO TIBCO Spotfire S+ 8.2 TIBCO Spotfire S+
Workbench.
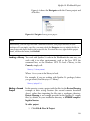
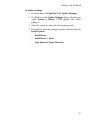
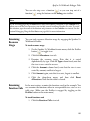
Setting
Environment
Variables
When you start the Spotfire S+ Workbench from the Windows Start
menu, it uses a shortcut that starts a Java virtual machine (-vm)
immediately. The Workbench supports a Java system variable,
splus.environment.vars, that can pass environment variables to the
engine for startup consumption. For example, you can set your
Spotfire S+ Workbench environment to start without printing
copyright and version infromation by setting the environment
variable S_SILENT_STARTUP=<any value>.
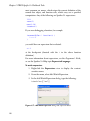
To use the Java system variable, create a shortcut or a .bat file that
contains the following instructions:
"SHOME\eclipse\eclipse.exe"
-vm "SHOME\java\jre\bin\javaw.exe" -vmargs
-Dsplus.shome="SHOME"
(Where SHOME is your Spotfire S+ installation location.
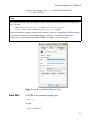
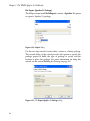
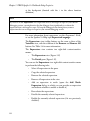
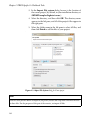
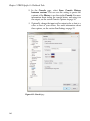
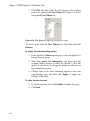
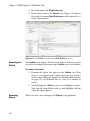
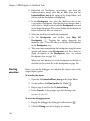
Note that this is the default Windows XP shortcut, as it appears in the
Spotfire S+ Workbench Properties dialog (see Figure 1.3).
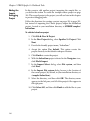
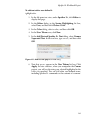
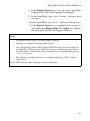
To add an environment argument in Windows
1. Click Start Program Files TIBCO TIBCO Spotfire S+ 8.2.
2. Right-click Spotfire S+ Workbench.
3. In the Spotfire S+ Workbench Properties dialog, type the
following after -vmargs:
4. -Dsplus.environment.vars=”VAR1=arg1, VAR2=arg2”
where VAR is the variable to set and arg is the argument you
are setting. For example:
10
Starting the Spotfire S+ Workbench
-Dsplus.environment.vars=”S_LICMGRSN=WTP10987654321,
S_SILENT_STARTUP=X”
Note
The Windows startup shortcut is defined to run a command with the option to set memory heap
size: -Xmx400m.
"SHOME\eclipse\eclipse.exe" -vm "SHOME\java\jre\bin\javaw.exe"
-vmargs -Dsplus.shome="SHOME\eclipse\eclipse.exe -Xmx400m”
You can override this setting and increase the memory heap size by appending a different setting
at the end of the shortcut. (For example, change -Xmx400m to -Xmx600m at the end of the
command to set the memory heap size to 600mb.) See Figure 1.3 for an example.
Figure 1.3: Spotfire S+ Workbench Properties dialog.
From Unix
In UNIX, at the command prompt, type
Splus -w
or type
Splus -workbench
11
Chapter 1 The TIBCO Spotfire S+ Workbench
Setting
Environment
Variables
Certain required environment variables are set to work with UNIX
and Linux as part of the Spotfire S+ Workbench startup script. To add
other environment variables, set them using env. For example, you
can start the Spotfire S+ Workbench with a particular license and to
start displaying no copyright and version information by using the
following:
env S_LICMGRSN=WTP10987654321 S_SILENT_STARTUP=X
Splus -w
(To set multiple environment variables, separate them with spaces. )
To extend the Java maximum memory heap size to 600MB, set the
environment variable JAVA_OPTIONS to -Xmx600m. For example:
env JAVA_OPTIONS="-Xmx600m" Splus -w
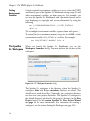
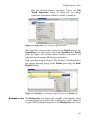
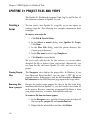
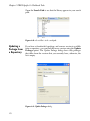
The Spotfire
S+ Workspace
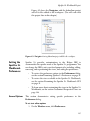
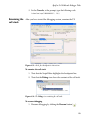
When you launch the Spotfire S+ Workbench, you see the
Workspace Launcher dialog. You must indicate the location of the
workspace.
Figure 1.4: The Workspace Launcher dialog.
The Spotfire S+ workspace is the directory where the Spotfire S+
workspace .Data and Eclipse .metadata databases are stored. (You
should never touch these files.) Optionally, the workspace directory
can also store your project directories. The Spotfire S+ workspace is
the default directory specified for the project's directory in the New
Project wizard. See the section Spotfire S+ New Project Wizard
on page 31 for more information. (For instruction on creating a
workspace, see the section Setting the Workspace on page 126.)
12
Starting the Spotfire S+ Workbench
Important
In the Spotfire S+ Workbench, you have two options for storing data
objects:
•
Using the Spotfire S+ Workbench model, where the Spotfire
S+ workspace contains a .Data directory, not individual
projects. The .Data directory can store objects for projects to
share in the workspace.
•
Using the familiar Spotfire S+ model, the working Spotfire S+
project stores its data objects to its .Data directory and replaces
the first entry in the Search Path with the project's location.
It is also the location to which relative paths are resolved.
Working projects are marked by an arrow icon, and by the
cue (working) in the navigator:
Figure 1.5: The working project.
For more information about setting the Spotfire S+ working project,
see the section Setting the Working Project on page 151.
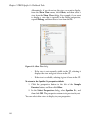
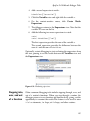
Figure 1.6: Workspace directory (in Windows) showing .Data directory,
.metadata directory, and project directories.
Notes
When you work with Spotfire S+ Workbench projects, avoid nesting projects (that is, create one
project in a subdirectory of another project).
To avoid conflicts, never work on Spotfire S+ files in the Spotfire S+ Workbench and another
Spotfire S+ interface at the same time.
13
Chapter 1 The TIBCO Spotfire S+ Workbench
EXAMINING SPOTFIRE S+ PREFERENCES
The Spotfire S+ Workbench IDE defaults are set to the Spotfire S+
perspective. The preferences include project type, window
appearance, editor preferences, menu options, debugging options,
server options, and file associations. Use the Preferences dialog to
change these preferences and any other default Eclipse preferences.
To display the Preferences dialog, on the main menu, click Window
Preferences.
You can also display the Preferences dialog for the following Spotfire
S+ Workbench views by clicking the drop-down button (
selecting Preferences from the control menu:
•
Tasks view.
•
Problems view.
•
Output view.
•
Console view.
) and
You can display the Preferences dialog for the Spotfire S+
Workbench Script editor from the right-click menu (that is, right-click
the Script Editor, and from the menu, click Preferences).
Hint
The Eclipse Workbench User Guide includes descriptions of the Eclipse options in the
Preferences dialog.
For instruction on setting Spotfire S+ preferences, see the section
Setting the Spotfire S+ Workbench Preferences on page 137.
The Spotfire S+ Workbench sets defaults for the following
preferences.
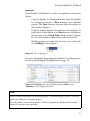
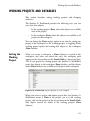
File
Associations
14
Spotfire S+ recognized file types include *.q, *.r, *.ssc, and *.t.
Any of these files, associated with the Spotfire S+ Script editor, are
checked for syntax errors and scanned for task tags.
Examining Spotfire S+ Preferences
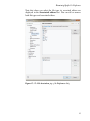
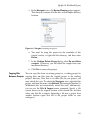
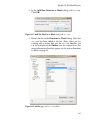
Note that when you select the file type, its associated editors are
displayed in the Associated editors box. You can add or remove
both file types and associated editors.
Figure 1.7: The File Associations page of the Preferences dialog.
15
Chapter 1 The TIBCO Spotfire S+ Workbench
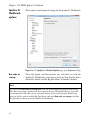
Spotfire S+
Workbench
options
These options control general settings for the Spotfire S+ Workbench.
Figure 1.8: The Spotfire S+ Workbench Options page of the Preferences dialog.
Run code on
startup
Select this option, and then provide any code that you want the
Spotfire S+ Workbench to run when it starts up. Note that this box is
selected by default, and the Big Data library is loaded by default.
Note
If you clear the Run code on startup box, or if you do not supply the option to load the Big
Data library on startup, and then later open a project that uses the Big Data library, you could
see unexpected results when you try to perform actions. If your typical projects include large
data sets, add the code to load the Big Data library and select Run code on startup to load the
Big Data library when you start the Spotfire S+ Workbench.
16
Examining Spotfire S+ Preferences
Integrate Java
Graphs into the
Spotfire S+
Workbench
This option is selected by default. Clear this option if you do not want
Java graphs embedded in the Spotfire S+ Workbench.
With this option selected, any Java graphs created as part of your
script appear embedded in a view to the right of the folder containing
the console view by default.
Note
java.graph is the default device for the Spotfire S+ Workbench.
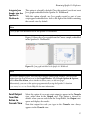
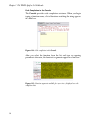
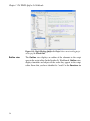
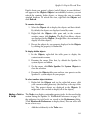
Figure 1.9 shows the a Java graph from the Census sample, embedded
in the Spotfire S+ Workbench.
Figure 1.9: Java graph embedded in the Spotfire S+ Workbench.
Note
If you have multiple graphs, and you want to display tabbed graph windows, you can set the
option from the drop-down arrow in the Graph Window. Select Graph Options Options,
and in New Plot Action, select whether to delete, reuse, or add new pages.
Alternatively, you can set this option programmatically using the Spotfire S+ function
See its Help file for more information.
java.new.plot.action.
Send Output
from Run
Action to
Console View
Select this option if you want script output to appear in the Console
view, rather than in the Output view. This option is cleared by
default: when you run code from the Script Editor, the Output view
opens and displays the results.
Note that output for code you type in the Console view always
appears in the Console view.
17
Chapter 1 The TIBCO Spotfire S+ Workbench
Spotfire S+
Package
Repository
Change this option to specify another location for Spotfire S+
packages. By default, this location is set to the CSAN Web site
(http://spotfire.tibco.com/csan). The preference specified in this
box populates the Repository contols in the Update Packages and
Find Packages dialogs. (Selections in these dialog boxes also appear
in the Spotfire S+ Package Repository drop-down list.)
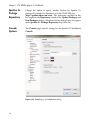
Console
Options
The Console page controls settings for the Spotfire S+ Workbench
Console.
Figure 1.10: Console page of the Preferences dialog.
18
Examining Spotfire S+ Preferences
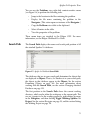
Store Console
History Between
Sessions
By default, this option is selected. It persists the commands you issue
in the Console (which then appear in the History), between sessions.
When you re-start the Spotfire S+ Workbench, click History to
display the stored entries. Entries you select in the History then
appear in the Console. Also, you can scroll up and down in the
History to display items in the Console. For more information about
using the History, see the section Examining the History on page
165. For information about setting options for the Output view, see
section Output Options on page 24.
Font Settings
By default, the Console displays input and output text using the
default system font as blue and red, respectively. You can change both
the font and the color.
•
To set the font, click Change, and then, in the Font dialog,
select from Font, Font style, Size, and any additional font
properties to use. Note that the font changes for both input
and the output displayed in the Console.
•
To set a custom font color, click the Input Color or Output
Color button, and then, in the Color picker, select a color for
the input or output.
Background
Settings
By default, the Spotfire S+ Console uses the system default. Select
Custom Color, and then click the color button to display the Color
picker and choose a different background color.
Include Prompts
in Copy action
Select if you want to include prompts (> and +) when you copy code
from either the Console.
19
Chapter 1 The TIBCO Spotfire S+ Workbench
Editor
These options control settings for the Spotfire S+ Workbench Script
Editor.
Figure 1.11: The Editor page of the Preferences dialog.
20
Examining Spotfire S+ Preferences
Syntax
Highlighting
Specifies the colors for text and defined syntax appearing in the Script
Editor. To change the default color for any of the items listed, click
Choose Color and, from the color picker dialog, select a color.
Note
To set background color, in the Preferences dialog, select General Editors Text Editors,
and, in the Appearance color options box, select Background color. See the Workbench User
Guide for more information about setting general options.
User Tokens
Lists items specified for user-defined syntax highlighting.
By default, no user-defined highlighted terms are defined. Any term
you define using this option appears in the Spotfire S+ Script Editor
in the color you define in Syntax Highlighting for the option User.
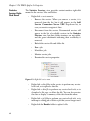
To add a user-defined token, click New, and then, in the Add
Desired S-PLUS Text dialog, provide the term or source.
Figure 1.12: Add Desired S-PLUS Text dialog.
In the Add Desired S-PLUS Text dialog, you can provide:
•
Individual terms, separated by commas.
•
The contents of a comma-separated file.
•
The results of a S-PLUS command. (Note that Figure 1.11
shows the results of the S-PLUS command objects(), which
adds all objects in the current working project to the User
Token list.
For more information about adding user tokens, see the section
Spotfire S+ View Preferences on page 138.
Hover
Displays a tooltip when the mouse hovers over an expression. The
tooltip displays the value of the expression, if the engine is available.
21
Chapter 1 The TIBCO Spotfire S+ Workbench
Spotfire S+
Format Options
Provides control over the Spotfire S+ Workbench’s automatic code
layout and formatting style.
Note
Changes you make to the Spotfire S+ Format Options do not affect your code until you select
from the menu Spotfire S+ Format.
Table 1.2: Spotfire S+ Format Options.
Format Option
Description
Code Line Width
Sets the width of the text area, counting from
the left-most character. By default, set to 60,
making the editing space 59 characters wide.
Use Spaces for
Indentation
By default, cleared. If selected, the default
value is 4. If you leave this cleared, the autoformatting feature uses tab indents, rather
than character spaces.
Encapsulate all scope
blocks with {}
Select to enclose all of your scope blocks
with curly brackets ({}). Selected by default.
Start each scope block
on a new line
Inserts a line break before the first line of a
scope block.
The read-only text box appearing at the bottom of the Spotfire S+
Format Options area provides an preview of your choices.
22
Examining Spotfire S+ Preferences
Outline
Options
Lists the options to display anonymous functions and functions to
watch.
Figure 1.13: The Outline page of the Preferences dialog.
Show Anonymous By default, the Spotfire S+ Script Editor shows anonymous functions
in the outline.
Functions in
Outline
Functions to
Watch
Contains a predefined list of Spotfire S+ functions to identify in the
Outline view. You can add your own functions to this list using the
New button. You can also remove functions from the list or reorder
the list.
23
Chapter 1 The TIBCO Spotfire S+ Workbench
Output
Options
The Output page controls settings for the Spotfire S+ Workbench
Output view.
Figure 1.14: Output page of the Preferences dialog.
Font Settings
Background
Settings
24
By default, the Output view displays output text using the default
system font as red. You can change both the font and the color.
•
To set the font, click Change, and then, in the Font dialog,
select from Font, Font style, Size, and any additional font
properties.
•
To set a custom font color, click the Output Color button,
and then, in the Color picker, select a color for the output.
By default, the Output view uses the system default. Select Custom
Color, and then click the color button to display the Color picker
and choose a different background color.
Examining Spotfire S+ Preferences
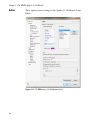
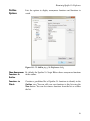
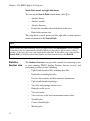
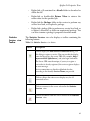
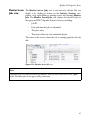
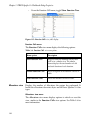
Task Options
Lists the three pre-defined default task tags. See the section Tasks view
on page 86 for more information.
Figure 1.15: The Task Tags page of the Preferences dialog.
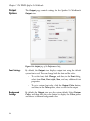
Statistics
Services
Options
If you use TIBCO Spotfire Statistics Services, you can set preferences
for interaction between Spotfire S+ Workbench and Spotfire Statistics
Services. See the section Statistics Services view on page 76 for more
25
Chapter 1 The TIBCO Spotfire S+ Workbench
information about its view. See the section Spotfire Statistics Services
Remote Submissions on page 178 for information about using the
Spotfire S+ Workbench with Spotfire Statistics Services.
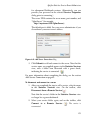
Figure 1.16: the Statistics Services page of the Preferences dialog.
Number of jobs
to load upon
connection
26
Set the specified list of jobs to appear in the Statistics Services view,
in the tree view Jobs folder. If the Spotfire Statistics Services server
you connect to has jobs stored, the specified job list appears, starting
with the most recent job. The default is 10. You can set this value to
any number greater than 0, up to 1,000.
Examining Spotfire S+ Preferences
Number of rows
to retrieve to
preview a data
file
•
If you set it to 0, the default of 10 is used.
•
If you specify a number larger than 1,000 or a non-numeric
character, the dialog displays an “Invalid field value” error
and the text box turns yellow. If the error text contains an
ellipsis (...), the message is truncated. Widen the dialog box to
display the entire message.
•
If you change this number while you are connected to the
Spotfire Statistics Services computer, the display does not
change until you disconnect and reconnect.
•
If you run jobs in excess of this number, all jobs are displayed
until you disconnect and reconnect.
•
If you delete jobs from the list, any earlier existing jobs are
appended to the list, up to the maximum number of available
jobs or the specified number.
If you have data stored on the Spotfire Statistics Services computer,
set the number of rows to display in the Output view. Note that this
number includes the row containing column names as one of the
rows. You can set this value to any number greater than 0, up to
10,000.
•
If you set it to 0, the default of 10 is used.
•
If you specify a number larger than 10,000, the dialog displays
an “Invalid field value” error and the text box turns yellow.
•
If you reset this number while you are connected to the
Spotfire Statistics Services computer, the number of rows to
preview is displayed the next time you select Preview File.
(Reconnecting is not required.
Note
The preview and summary options are run on the server, not on the client; therefore, data size
limit restrictions of 256k apply. Depending on the data type and/or the number of columns, you
might encounter size error limits, even if you specify a number of rows well below the maximum
allowed by the Workbench.
27
Chapter 1 The TIBCO Spotfire S+ Workbench
Job return value
prefix
Set a string of text to prepend to the return value information
displayed in the first line of the Output view. The string must include
only letters from the standard English character set, numbers, and
dots (.). The string cannot include spaces. The string can begin with a
letter or dot (.), but not a number. In the return value output, this
value is separated from the server name and job number by a dot. For
example, if you change this option to Sample.Return.Value:
Figure 1.17: Job return value prefix, server name, and job number.
Data preview
object prefix
•
If you specify an illegal character, the dialog displays an
“Invalid character” error and the text box turns yellow. If the
error text contains an ellipsiss (...), the message is truncated.
Widen the dialog box to display the entire message.
•
If you leave this text box blank, it uses the default of retVal.
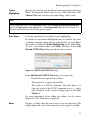
Set a string of text to prepend to the data preview information
displayed in the first line of the Output view. The string must include
only letters from the standard English character set, numbers, and
dots (.). The string cannot include spaces. The string can begin with a
letter or dot (.), but not a number. In the return value output, this
value is separated from the file name by a dot. For example, if you
change this option to Sample.Data.Preview:
Figure 1.18: Data preview prefix and file name.
Data summary
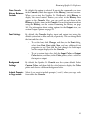
value prefix
28
•
If you specify an illegal character, the dialog displays an
“Invalid character” error and the text box turns yellow.
•
If you leave this text box blank, it uses the default of preview.
Set a string of text to prepend to the data summary information
displayed in the first line of the Output view. The string must include
only letters from the standard English character set, numbers, and
dots (.). The string cannot include spaces. The string can begin with a
Examining Spotfire S+ Preferences
letter or dot (.), but not a number. In the return value output, this
value is separated from the file name by a dot. For example, if you
change this option to Sample.Summary:
Figure 1.19: Summary prefix and file name.
Data file
extensions
•
If you specify an illegal character, the dialog displays an
“Invalid character” error and the text box turns yellow. If the
error text contains an ellipsiss (...), the message is truncated.
Widen the dialog box to display the entire message.
•
If you leave this text box blank, it uses the default of summary.
Lists the file extensions of the data types that are displayed in the
Statistics Services view data repository folders. By default, this list
shows common data file types in alphabetical order. You can edit this
list to reflect the data types you work with most commonly, in the
order that you use them. The Statistics Services view filters to
display only the listed extensions in the data repository folder.
Note
The Data file extensions list does not include all file types supported by the importData
function in S-PLUS. For a complete list, see its Help file. (Hint: Type ?importData in the
Console view to display the help for the function, or access it using the Help > Spotfire S+
Help menu item.)
29
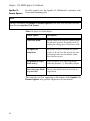
Chapter 1 The TIBCO Spotfire S+ Workbench
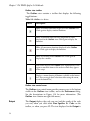
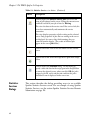
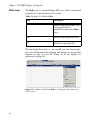
Table 1.3: Data File Extension actions.
Button
Description
New
Adds a data file extension for the type of data you
have in your Spotfire Statistics Services data
repository. When you add a data type extension, it
appears at the top of the list in this dialog.
If you add an extension that is currently
unsupported by S-PLUS, S-PLUS will attempt to
read the file as ASCII text.
30
Remove
Removes a data file extension that you do not use,
or you do not need to see displayed. You can add
them back to the list as needed.
Up/Down
Moves the selected data file extension either up or
down the list. For example, you can use this option
to display your most-commonly used data types
first.
Restore Defaults
Restores all Statistics Services options to their
original state.
Examining the Spotfire S+ Workbench GUI
EXAMINING THE SPOTFIRE S+ WORKBENCH GUI
After the Spotfire S+ Workbench GUI opens, and you set
preferences, spend a moment examining the user interface, including
the toolbars, menus, perspectives, and views.
•
For more information about perspectives, see the section
Spotfire S+ Workbench Perspectives and Views on page 42.
•
For more information about views, see the section Examining
the Views on page 43.
Spotfire S+
New Project
Wizard
When you start a new Spotfire S+ project in the Spotfire S+
Workbench, you see the New Project wizard, where you specify the
location of your project files. See the section Quick Start on page 127
for more information about specifying the project file location.
Working with
Files External to
the Project
You can use the Eclipse editor to edit non-project files in the Spotfire
S+ Workbench. To open a non-project file, on the File menu, click
Open File, and then browse to the location of the file to edit. For
more information about editing files in Eclipse, see the Eclipse
Workbench User Guide.
Customized
Menus,
Toolbars, and
Dialogs
The Spotfire S+ Workbench includes in the Eclipse GUI:
Customized
menus
Spotfire S+ customizes the basic Eclipse menu to provide easy access
to global Spotfire S+ control and to control debugging options.
•
Customized top-level menu items.
•
Customized top-level toolbar.
•
Customized view-specific toolbars and view menus. (See the
section Control and Right-Click Menus on page 46 for more
information about the menus.)
31
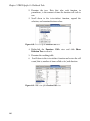
Chapter 1 The TIBCO Spotfire S+ Workbench
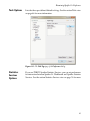
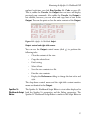
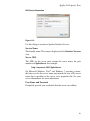
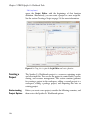
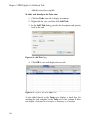
File Export (Spotfire S+ Package)
The Eclipse menu item File Export contains a Spotfire S+ option
to export a Spotfire S+ package.
Figure 1.20: Export dialog.
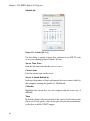
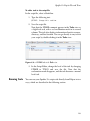
Use this two-step wizard to create either a source or a binary package.
The second dialog of the wizard provides the options to specify the
package project to build, the type of package to create, and the
location to place the package. For more information on using this
wizard, see the section Building the Package on page 170.
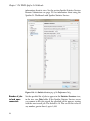
Figure 1.21: The Export Spotfire S+ Package dialog.
32
Examining the Spotfire S+ Workbench GUI
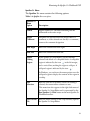
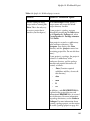
Spotfire S+ Menu
The Spotfire S+ menu contains the following options:
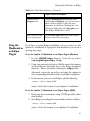
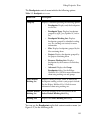
Table 1.4: Spotfire S+ menu options.
Spotfire S+
Menu
Option
Description
Format
Applies Spotfire S+ consistent formatting and line
indentation to the entire script.
Toggle
Comment
Designates the selected text in the Script editor as a
comment, or, if the selected text already is a comment,
removes the comment designation
Shift Right
Moves the selected text to the right.
Shift Left
Moves the selected text to the left.
Define
Folding
Region
In the Spotfire S+ Script Editor, sets the currentlyselected code block as a collapsible block. A collapsible
region is indicated by the icon
in the left margin,
and a vertical line, marking the region to collapse. A
collapsed region is indicated by the icon
.
In Windows, you can hover the mouse pointer over the
collapsed region to display the contents of the region in
a tooltip.
Run
Selection
Runs the code that is currently selected. If nothing is
selected, the current editor contents are run.
This menu item also appears in the right-click menu of
the Spotfire S+ Script Editor and is represented by the
Run Spotfire S+ Code button on the main Spotfire S+
Workbench toolbar.
Run Current
File
Runs the entire contents of the script currently open in
the Spotfire S+ Script Editor.
33
Chapter 1 The TIBCO Spotfire S+ Workbench
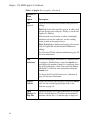
Table 1.4: Spotfire S+ menu options. (Continued)
Spotfire S+
Menu
Option
Description
Find
“function”
Finds the selected function definition and opens it for
editing.
Find looks first in files currently open in an editor, then
it looks through your workspace. Finally, it searches the
Spotfire S+ database.
If the function is not found in an editor and multiple
definitions exist in the workspace, use the resulting
dialog to indicate the proper source.
Note: Highlighting a function and typing CTRL+mouse
click also opens the selected function definition for
editing.
See the section To edit a function definition on page 159
for more information
Find
References
Locates and highlights all instances of a function call in
a workspace. Find References opens the Search view
and displays the number of times in a workspace where
the selected function is called. You can See the Eclipse
Workbench User Guide for more information about the
Search view.
See the section To find all references to a function on
page 159 for more information.
34
Copy to
Console
Copies the selected code and pastes it into the Console
view. See the section Copying Script Code to the
Console on page 164
Open
Spotfire S+
Help File
Opens the Spotfire S+ Language Reference to the topic
for the selected function. If you have no documented
function selected, the help function topic is displayed.
Examining the Spotfire S+ Workbench GUI
Table 1.4: Spotfire S+ menu options. (Continued)
Spotfire S+
Menu
Option
Update
Packages
Description
Locates and optionally copies either source or binary
®
(Windows ) updated packages posted to the specified
repository or local folder.
If you have no packages installed, or if you have only
the latest versions of the packages, then the Packages
list box displays no results. For Type, if you select:
•
Binary: you can either install or install and
load the binary package.
•
Source: you can copy the package source files
to the location of your choice. By default, the
files (and their folder structure) are copied to
your current workspace.
35
Chapter 1 The TIBCO Spotfire S+ Workbench
Table 1.4: Spotfire S+ menu options. (Continued)
Spotfire S+
Menu
Option
Find
Packages
Description
Locates and optionally copies either source or binary
packages located in the specified repository or local
folder. (For Windows, you can download either source
®
or binary packages; for UNIX , you can download
only source packages; however, you can install, install
and load, and copy source packages.)
•
If, for Type, you select Binary, you have the
option either to install or to install and load the
binary package.
•
If, for Type, you select Source, you can
download the package source files to the
location of your choice. By default, the files
(and their folder structure) are downloaded to
your current workspace.
Note that this option finds built packages only (that is,
those that are zipped or tarballed); it does not load
unbuilt package directories and their files. To open a
package to build and then install, open it as a new
project, and then build it and install it. For more
information about finding and downloading packages,
see the section Downloading Package Source Files from
a Repository on page 172
Run Menu
The Run menu varies, depending on the perspective selected. In both
the Spotfire S+ and Debug perspective, the following Spotfire S+
Workbench options are available. (See the corresponding
descriptions for the toolbar buttons in the section The Spotfire S+
Workbench Toolbar on page 38 for more information.)
36
•
Run Spotfire S+ Code
•
Run Next Spotfire S+ Command
•
Stop Spotfire S+ Code
•
Toggle Spotfire S+ Debugger
Examining the Spotfire S+ Workbench GUI
•
Toggle Spotfire S+ Profiler
•
Toggle Spotfire S+ Warning Breakpoint
•
Toggle Spotfire S+ Error Breakpoint
For more information about the Run menu options available only in
the Debug perspective, see the section Debug Run Menu Options on
page 94.
Window Menu
The Spotfire S+ Workbench preferences are available from the
Window Preferences menu option. See the section Examining
Spotfire S+ Preferences on page 14 for more information.
Help Menu
Reference help, conceptual help, books, and user-interface guidance
are available from the Help menu.
Customized
Toolbars
•
Click Spotfire S+ Help from the Help menu to display the
Spotfire S+ Language Reference topic for the help function.
•
Click Spotfire S+ Manuals for a list of the PDFs that are
installed by default with your Spotfire S+ installation.
Both Spotfire S+ perspectives in the Workbench provide
customizations to the Eclipse toolbar and to view-specific toolbars.
37
Chapter 1 The TIBCO Spotfire S+ Workbench
The Spotfire S+ Workbench Toolbar
Regardless of the displayed perspective, the Spotfire S+ Workbench
toolbar appears in the IDE.
Figure 1.22: The Spotfire S+ Workbench toolbar.
Note
Eclipse implements a Run menu item that is different from that of Spotfire S+ Workbench
implementation. Use the Spotfire S+ Workbench Run menu item.
Use the Spotfire S+ Workbench toolbar to control running,
debugging, breaking, and profiling your code.
Table 1.5: Spotfire S+ Workbench toolbar.
Button
Description
Run Spotfire S+ Code. Click in either the Debug or the
Spotfire S+ perspective to run code that appears in the editor.
(To view the output, select the Output.)
38
Examining the Spotfire S+ Workbench GUI
Table 1.5: Spotfire S+ Workbench toolbar. (Continued)
Button
Description
Run Next Spotfire S+ Command. Looks for the current
selection and runs the top-level S expression found at that
location.
If the cursor location does not match an expression exactly,
the next expression is evaluated (rather than the first one).
The output is routed to the Output, and the next expression is
selected automatically (or the first expression in the script is
selected automatically, if the expression that was just run was
the last one).
Stop Spotfire S+ Code. Click in either the Debug or the
Spotfire S+ perspective to stop running code.
Toggle Spotfire S+ Debugger. Engages the Spotfire S+
debugger. (You can engage the Spotfire S+ debugger in
either the Spotfire S+ or the Debug perspectives; however, by
default, the views displaying debugging information are
visible in the Debug perspective.)
After you engage the Spotfire S+ debugger, any expression
you type in the Console, or that you run by clicking Run
Spotfire S+ Code on the toolbar, invokes the Spotfire S+
debugger.
Toggle Spotfire S+ Profiler. Engages the Spotfire S+
Profiler. (You can engage the Spotfire S+ Profiler in either the
Spotfire S+ or the Debug perspectives; however, by default,
the views displaying profiling information are visible in the
Debug perspective.)
You do not need to engage the Spotfire S+ debugger in
order to engage the Profiler. See the section Profiler on page
120 for more information.
39
Chapter 1 The TIBCO Spotfire S+ Workbench
Table 1.5: Spotfire S+ Workbench toolbar. (Continued)
Button
Description
Toggle Spotfire S+ Warning Breakpoint. Requires that
the Spotfire S+ debugger be toggled on. Stops execution if
Spotfire S+ encounters a warning. See Table 3.7 in the section
Breakpoints view on page 113 for more information about
warning breakpoints.
Toggle Spotfire S+ Error Breakpoint. Requires that the
Spotfire S+ debugger be toggled on. Stops execution if
Spotfire S+ encounters an error. See Table 3.7 in the section
Breakpoints view on page 113 for more information about
error breakpoints.
View toolbars
For more information about individual views’ toolbars, see the
individual views’ descriptions. See the section Examining the Views
on page 43 for more information.
Spotfire S+
Workbench
Status Bar
The Workbench features a status bar that provides important
information about the working project and the current view.
Figure 1.23: Status bar.
40
Examining the Spotfire S+ Workbench GUI
Table 1.6: Spotfire S+ Workbench status bar.
Status Item
Description
Show View as Fast View. An Eclipse feature.
•
Click to display a list of available views,
and then select a view to maximize it and
add its icon to the status bar.
•
Click the view’s icon in the status bar to
minimize the view. (Alternatively, click the
view’s minimize icon, in its upper right
corner, to minimize it.)
For more information, see the Eclipse Workbench
User Guide.
Current working directory and file. When the
Script Editor has focus, this section of the status bar
displays the current file.
Working project. Displays the name of the project
that is currently set as the working project. For more
information about the working project, see the
section Working Projects and Databases on page
151.
Status indicator. When the box is labeled Busy,
and the status indicator is filling, then code is
currently running. When the box is clear and reads
Ready, no code is running.
File attribute. Indicates whether the file is readonly or writable.
Smart Insert. Toggles the insert mode. To toggle
this view, type CTRL+SHIFT+INSERT. When Smart
Insert mode is toggled off, typing aids like
automatic indentation, closing of brackets, and so
on, are not available. Smart Insert is an Eclipse
feature.
41
Chapter 1 The TIBCO Spotfire S+ Workbench
Table 1.6: Spotfire S+ Workbench status bar. (Continued)
Status Item
Description
Cursor position. Indicates the line and column
position of the cursor.
Spotfire S+
Workbench
Perspectives
and Views
The Spotfire S+ Workbench plug-in for Eclipse includes two
customized perspectives:
•
The Spotfire S+ perspective
•
The Debug perspective.
(See Table 1.1 for a short description of the perspectives.) By default,
each perspective includes Eclipse views and customized Spotfire S+
Workbench views.
Changing the
Spotfire S+
Workbench
Perspective
42
You can change the perspective to suit your development style by
moving, hiding, or closing views. For more information about
customizing the views within the perspective, see the section
Customizing the Spotfire S+ Perspective Views on page 69. For
practice exercises customizing the perspective, see the section
Customized Perspective Views on page 148.
•
To customize the default Spotfire S+ perspective, on the
menu, click Window Customize Perspective. The
Customize Perspective dialog has two pages: Shortcuts and
Commands. Each of these pages describes global changes
you can make to the perspective.
•
To save a changed perspective, click Window Save
Perspective As.
•
To restore an unsaved perspective’s default settings, click
Window Reset Perspective.
•
To open another perspective, click Window Open
Perspective, and then select a perspective from the Select
Perspective dialog.
Examining the Spotfire S+ Workbench GUI
Figure 1.24 shows the Spotfire S+ perspective with the views set at
their default positions.
Figure 1.24: Spotfire S+ Workbench window, Spotfire S+ perspective.
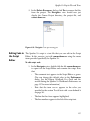
Examining the
Views
A view is a visual component in the workbench. Views support the
script editor by providing alternate means of navigating through,
working with, and examining the elements of the project.
Using the standard Eclipse IDE features, you can:
•
Close a view by clicking the X icon on the view tab.
•
Reposition a view by clicking its tab and dragging it to
another part of the UI.
•
Set a selected view to “Fast View.” This option hides the view
to free space in the Workbench window and places a
minimized icon, which you can click to open the view, on the
status bar.
•
Change the views you see in the perspective. See the section
To change the displayed views on page 149.
Most views have their own control menus. (See the section Control
and Right-Click Menus on page 46 for more information.)
43
Chapter 1 The TIBCO Spotfire S+ Workbench
Saving views items changed in views
When you modify an item in a view, it is saved immediately.
Normally, only one instance of a particular type of view can exist in
the Workbench window.
Perspective views
The following table lists the views shown in each perspective and
indicates which views are shared by both perspectives. This section
includes descriptions for the views shared across Spotfire S+
Workbench perspectives.
Note
If you do not see one of the following Spotfire S+ specific views in the user interface, you can
display it from the menu by clicking Window Show View Other, and then selecting it
from the Show View list.
Table 1.7: Views in the Spotfire S+ Workbench perspectives.
View Name
Debug
Perspective
Description
reference
Allocations
view
x
page 122
Breakpoints
view
x
page 113
x
page 49
Debug view
x
page 100
Expressions
view
x
page 111
Function Calls
view
x
page 121
Console view
44
Spotfire S+
Workbench
Perspective
x
Examining the Spotfire S+ Workbench GUI
Table 1.7: Views in the Spotfire S+ Workbench perspectives. (Continued)
View Name
Spotfire S+
Workbench
Perspective
Debug
Perspective
Description
reference
History view
x
Navigator
x
Objects view
x
Outline view
x
x
page 54
Output view
x
x
page 56
Problems view
x
Script Editor
x
Search Path
view
x
page 75
Statistics
Services view
x
page 76
Tasks view
x
Variables view
page 69
x
Eclipse Workbench
User Guide
page 71
page 74
x
page 57
x
page 86
x
page 106
Hint
Change the view layout by moving views around the IDE, or control the views displayed using
the Show View dialog. For more information, see the section To change the displayed views on
page 149.
45
Chapter 1 The TIBCO Spotfire S+ Workbench
Control and
Right-Click
Menus
Views contain their own control and/or right-click menus, with menu
items that act on the view display or on the type of data displayed in
the view. Menus are displayed either when you click the drop-down
button ( ), located in the upper right corner of each view, or when
you right click the body of the view.
The following two images show the two types of menus in the
Navigator view. For more information about the Navigator, see the
section Navigator on page 52.
Figure 1.25: Control menu, available via drop-down button.
46
Examining the Spotfire S+ Workbench GUI
Figure 1.26: Context-sensitive menu, available via right-click in the view.
•
The Script Editor has only a context-sensitive menu, available
via a right-click action. Its available options depend on the
current selection in the editor. For example, if you select text
and right-click, you have the option to cut or copy the
selection. If you select a Spotfire S+ function, you have the
option to open the Spotfire S+ Help file for that function.
The options on the Script Editor’s context-sensitive menu are
a selection of options that appear on the main menu.
•
The Outline view and the Allocations view have only the
control drop-down menu.
In the following views, the right-click (context-sensitive) menu and
the control drop-down menu are identical. The control menu for each
view is described in this document in the section describing its view.
See the section Examining the Views on page 43 for more
information:
•
Console view.
47
Chapter 1 The TIBCO Spotfire S+ Workbench
•
Function Calls view.
•
History view.
•
Objects view.
•
Output view.
•
Search Path view.
The following views each contain two different menus:
•
The control menu, available from the drop-down button.
•
The context-sensitive menu, available via right-click in the
body of the view. The options available on the right-click
menu vary according to the item selected in the view (for
example, removing a selection, copying a selection, and so
on.) For more information about where each view appears,
see the section Perspective views on page 44.
Table 1.8: Views with different control and right-click menus.
View
Location of more menu information
Breakpoints view
page 113
Debug view
page 102
Expressions view
page 108
Navigator
page 52
Problems view
page 74
Statistics Services view
page 76
Tasks view
page 86
Variables view
page 108
Each view action also has a quick-key sequence to perform an action.
(For example, to clear the text in the console, with the Console
active, type CTRL+L.)
48
Examining the Spotfire S+ Workbench GUI
Default Shared
Views
The following sections describe the views that are shown, by default,
in both the Spotfire S+ perspective and the Debug perspective.
Spotfire S+
Workbench
Console
The Spotfire S+ Workbench Console is an editable view, analogous
to the Commands window in the Spotfire S+ GUI. Using the
Console, you can:
•
Run individual Spotfire S+ commands by typing them and
pressing ENTER.
•
Scroll through previous commands by pressing the
DOWN arrow on the keyboard.
•
Copy an individual command or blocks of commands from
the Script Editor, using the Copy to Console menu item, to
run them in the Console. (Note that you do not need to select
Paste; Copy to Console copies your selected text in the
Script Editor and pastes it into the Console.)
UP
or
Figure 1.27: Spotfire S+ Workbench Console.
•
Copy from the console to a script file. (You can also copy the
command prompts. To set this option, on the menu, click
Window Preferences, and on the Console/Output page,
select Include Prompts in Copy action.)
49
Chapter 1 The TIBCO Spotfire S+ Workbench
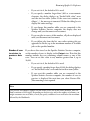
Code Completion in the Console
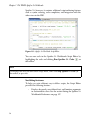
The Console provides code completion assistance. When you begin
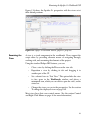
typing a function name, a list of functions matching the string appears
in a hint box.
Figure 1.28: Code completion in the Console.
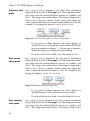
After you select the function from the list and type an opening
parenthesis character, the function’s arguments appear in a hint box:
Figure 1.29: Function arguments available for importData, displayed as a code
completion hint.
50
Examining the Spotfire S+ Workbench GUI
The function’s arguments, as shown for importData in Figure 1.29, is
displayed in the hint box until you type the closing parenthesis
character.
Note
For the code completion list, the Spotfire S+ Workbench reads the Search path on startup and
includes all functions in loaded libraries. It refreshes that list periodically.
Console control and right-click menus
The Console controls include these Eclipse options:
•
Pin the view in place (
).
•
Toggle between open Console views (
•
Open a new Console (
).
).
The Console control menu and right-click menu are the same. You
can use the Console control menu (click
or right-click the body of
the Console) to perform the following tasks:
•
Clear the contents of the console.
•
Copy the selected text.
•
Cut the selected text.
•
Paste text from the clipboard to the console.
•
Find a string.
•
Select all text.
•
Save the console contents to a file.
•
Print the console contents.
•
Open the Preferences dialog to set such options as font color
and style, among others.
For exercises using the Spotfire S+ Workbench Console, see the
section Copying Script Code to the Console on page 164. For more
information about the Spotfire S+ Commands window, see Chapter
10, Using the Commands Window in the Spotfire S+ User’s Guide.
51
Chapter 1 The TIBCO Spotfire S+ Workbench
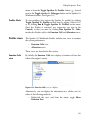
Navigator
The Navigator is a standard Eclipse view. Its drop-down ( ) control
menu is standard to Eclipse, while its right-click menu contains three
Spotfire S+-specific items, described in the following section. For
information about using the Navigator, see the Eclipse Workbench
User Guide, available from the Help Help Contents menu.
Navigator control and right-click menus
In addition to having a drop-down control menu, the Navigator has
a right-click menu containing three Spotfire S+-specific options:
Table 1.9: Navigator Spotfire S+-specific right-click menu options.
52
Menu option
Description
Source
Spotfire S+
Files
Parses and then evaluates each expression in the
selected project or file. (Note that if you have selected
the project, every file in that project is sourced.)
Format
Spotfire S+
Files
Applies Spotfire S+ consistent formatting and line
indentation to all scripts in the working project.
To customize the formatting options, on the main
menu, click Window Preferences, in the left pane,
click Spotfire S+ to expand the view, and then click
Editor. Use the Editor page to customize formatting
options. See the section To change the code formatting
options on page 144 for more instruction.
Examining the Spotfire S+ Workbench GUI
Table 1.9: Navigator Spotfire S+-specific right-click menu options. (Continued)
Menu option
Description
Toggle
Working
Spotfire S+
Project
Available when you select a project in the Navigator.
The project that you set as working becomes the
current working directory, or the root to which all
relative paths are resolved.
The working project also becomes the first position (in
the search path, which you can see in the Search Path.
This path contains the .Data database. All objects
created as a result of running code in the Spotfire S+
Workbench are written to that .Data database
(regardless of the project the code is in).
When you toggle off (that is, clear) the selection and
have no working project, the .Data database is set to
the current workspace, and the Search Path shows the
workspace in the first position. In this case, all objects
created in any project are written to the .Data database
in the workspace and are available to any project in the
workspace.
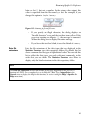
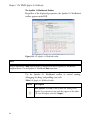
See Figure 1.30 for an illustration. For more
information about working projects and the current
working directory, see the section Setting the Working
Project on page 151.
53
Chapter 1 The TIBCO Spotfire S+ Workbench
Figure 1.30: Toggle Working Spotfire S+ Project shows current working project
at the top of the Search Path.
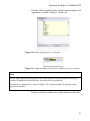
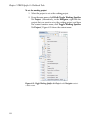
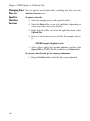
Outline view
54
The Outline view displays an outline of the elements in the script
open in the script editor. In the Spotfire S+ Workbench, Outline view
displays functions and objects in the order they appear in the script
editor. Items that you have identified to “watch” in the Functions to
Examining the Spotfire S+ Workbench GUI
Watch text box of the Preferences dialog appear in the Outline
view with an arrow. You can jump to the definition of a function or
object (or other structure element) by clicking it in Outline view.
Figure 1.31: Spotfire S+ Workbench Outline view.
Note
The Outline view updates only after you save changes to its associated file, displayed in the
Script Editor.
55
Chapter 1 The TIBCO Spotfire S+ Workbench
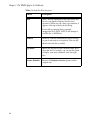
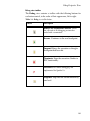
Outline view toolbar
The Outline view contains a toolbar that displays the following
toggle buttons:
Table 1.10: Outline view buttons.
Button
Description
Hides all standard functions displayed in the Outline view.
Click again to display standard functions.
Hides all functions that you have designated to watch
displayed in the Outline view. Click again to display the
functions.
Hides all anonymous functions displayed in the Outline
view. Click again to display the functions.
Hides all variables in the Outline view. Click again to
display the variables.
Sorts items displayed the Outline view alphabetically. Click
again to return the items to the order in which they appear
in the script.
Displays a menu showing all buttons available on the button
bar. (You can toggle these selections either using the menu,
or on the button bar.)
Outline view control menu
The Outline view control menu provides menu access to the buttons
visible on the Outline view toolbar, and to the Preferences dialog.
See the descriptions in Figure 1.10 for more information. (The
Outline view contains no right-click menu.)
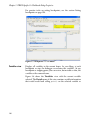
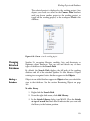
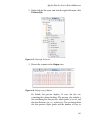
Output
56
The Output displays the code you run (and the results of the code
you run) when you click either Run Spotfire S+ Code on the
toolbar, or when you press F9. The text displayed in the Output is
Examining the Spotfire S+ Workbench GUI
replaced each time you click Run Spotfire S+ Code or press F9.
That is, unlike the Console, the Output does not store and display
previously-run commands. Also unlike the Console, the Output is
not editable; however, you can select and copy lines of text in the
Output. You can also print or clear the entire contents of the Output.
Figure 1.32: Spotfire S+ Workbench Output.
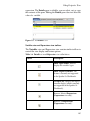
Output control and right-click menus
You can use the Output control menu (click
following tasks:
) to perform the
•
Clear the contents of the view.
•
Copy the selected text.
•
Find a string.
•
Select all text.
•
Save the view contents to a file.
•
Print the view contents.
•
Display the Preferences dialog to change the font color and
style.
The drop-down control menu and the right-click context-sensitive
menu are identical in the Output.
Spotfire S+
The Spotfire S+ Workbench Script Editor is a text editor displayed in
Workbench Script both the Spotfire S+ perspective and the Debug perspective. The
Spotfire S+ Workbench Script Editor is similar to the Script Editor in
Editor
57
Chapter 1 The TIBCO Spotfire S+ Workbench
Spotfire S+; however, it contains additional script-authoring features
such as syntax coloring, code completion, and integration with the
other views in the IDE.
Figure 1.33: Spotfire S+ Workbench Script Editor.
You can run code in the Spotfire S+ Workbench Script Editor by
highlighting the code and clicking Run Spotfire S+ Code (
the toolbar.
) on
Note
To interrupt code that you run from the Script Editor, either click Stop Spotfire S+ Code (on
the toolbar) or press ESC.
Text Editing Assistance
To help you write efficient, easy-to-follow scripts, the Script Editor
provides the following features:
•
58
Displays keywords, user-defined text, and function arguments
in customizable colors. See the section Setting the Spotfire S+
Workbench Preferences on page 137.
Examining the Spotfire S+ Workbench GUI
•
Provides code completion hints, both for function names and
arguments, as shown in Figure 1.34 and 1.35.
Figure 1.34: Code completion for the plot function.
Figure 1.35: Arguments displayed as part of code completion for the plot function.
Note
For the code completion list, the Spotfire S+ Workbench reads the Search path on startup and
includes all functions in loaded libraries. It refreshes that list periodically.
The function’s argument list, as shown in Figure 1.35, is displayed until you type the closing
parenthesis character ).
•
Displays code line numbers in a column adjacent to the code.
59
Chapter 1 The TIBCO Spotfire S+ Workbench
•
Provides automatic code indentation and parenthesis
matching. (See the Eclipse documentation for more
information on the editor’s standard features.)
Note
To indent selected text, first highlight the text to be indented, and then press TAB or CTRL+TAB
to shift the selected text right or left, respectively.
•
Activates the Script Outline view when you edit a script.
•
Displays task and breakpoint markers in the left margin, and a
task marker “thumb” in the right margin.
•
Displays the help topic for documented functions when you
select the function name, and then type F1.
Note
You can use the Eclipse editor to edit non-project files in the Spotfire S+ Workbench. To open a
non-project file, on the File menu, click Open File, and then browse to the location of the file to
edit. For more information about editing files in Eclipse, see the Eclipse Workbench User Guide.
View integration
The Script Editor is closely integrated with the views in both the
Spotfire S+ perspective and Debug perspective. This integration
includes the following:
60
•
When you type a task keyword in the editor, it is
automatically added to the Tasks view after you save the file.
See the section Tasks view on page 86 for more information.
•
When you set a breakpoint, the breakpoint appears in the
margin of the Script Editor both in the Debug perspective and
the Spotfire S+ perspective. (You can also set a breakpoint in
the margin of the Script Editor in both perspectives. See the
section Setting breakpoints on page 190.)
•
When you make an error and save your script file, the error
shows in the Problems view. See the section To examine
problems on page 166 for more information.
Examining the Spotfire S+ Workbench GUI
•
When you create a new object in the script, it appears in the
Outline view. To make it appear in the Objects view, you
must run the script and refresh the Objects view.
Script Editor right-click menu
The right-click menu in the Script Editor combines actions from the
Eclipse main menu, including the options available from the Spotfire
S+ menu, and the Preferences dialog.
See the section Spotfire S+ Menu on page 33 for information about
the Spotfire S+ options.
See section Setting the Spotfire S+ Workbench Preferences on page
137 for information about setting Preferences options.
(The Script Editor has no drop-down control menu.)
61
Chapter 1 The TIBCO Spotfire S+ Workbench
COMMONLY-USED FEATURES IN ECLIPSE
The core Eclipse IDE contains many additional features that you
might find helpful in managing your projects. The following table lists
a few of these features, along with references to the Eclipse Workbench
User Guide to help you learn how to use them effectively.
Table 1.11: Eclipse Tasks and Features.
Task
Eclipse Feature Description
Comparing files with
previous versions.
The Compare With Local History menu item
is available from the control menu in Navigator
view. Using this feature, you can compare the
current version of the selected file with
previously-stored local versions. For more
information, see the topic “Local history” in the
Eclipse Workbench User Guide.
Replacing files with a
previous version.
The Replace With Local History and Replace
With Previous from Local History menu
items are available from the control menu in
Navigator view. Using these features, you can
replace the current version of the selected file
with one of the previously-stored local versions.
Replace With Previous from Local History
displays no selection dialog; it just replaces the
file. To choose a previous state in the Local
History list, use Replace With Local History.
For more information, see the topic “Replacing a
resource with local history” in the Eclipse
Workbench User Guide.
Finding a word in a
project or a term in a
Help topic.
62
Using the Search File menu item, you can
find all occurrences of a word in a project or
Help topic. For more information, see the topic
“File search” in the Eclipse Workbench User Guide.
Commonly-Used Features in Eclipse
Table 1.11: Eclipse Tasks and Features. (Continued)
Using the
Workbench as
an Eclipse
Plug-In
Task
Eclipse Feature Description
Filter files in the
Navigator view.
Using the Working Sets menu option on the
control menu in Navigator view, you can create
subsets of files to display or hide. For more
information, see the topics “Working Sets” and
“Showing or hiding files in the Navigator view”
in the Eclipse Workbench User Guide.
View a file that is not
part of your project.
Use the File Open File menu item to open a
file that is not part of your project.
If you have a current Eclipse installation, and you want to use the
Spotfire S+ Workbench as a plug-in for that installation, you can set it
up using these steps.
To set the Spotfire S+ Workbench as an Eclipse Plug-in (Windows)
1. In your SHOME/eclipse directory, locate the zip archive
com.insightful.splus.eclipse_3.4.zip.
2. Using a zip extractor tool such as WinZip, extract the contents
of the zip file into the folder above your Eclipse installation
directory. (That is, the folder containing the /eclipse folder.)
Alternately, extract the zip archive and copy the contents to
the corresponding directories under your Eclipse installation.
3. In the shortcut you use to start Eclipse, add the following:
-vmargs -Dsplus.shome=SHOME
where SHOME is the location of your Spotfire S+ installation.
To set the Spotfire S+ Workbench as an Eclipse Plug-in (UNIX)
1. Follow the above instructions, using a UNIX zip utility (rather
than WinZip).
2. Start Eclipse, providing the command-line switches as follows:
-vmargs -Dsplus.shome=SHOME
where SHOME is the location of your Spotfire S+ installation.
63
Chapter 1 The TIBCO Spotfire S+ Workbench
64
THE TIBCO SPOTFIRE S+
PERSPECTIVE
2
Introduction
66
Spotfire S+ Perspective Views
Customizing the Spotfire S+ Perspective Views
History
Objects
Problems view
Search Path
Statistics Services view
Statistics Services Dialogs
Monitor Server Jobs view
Tasks view
68
69
69
71
74
75
76
82
85
86
65
Chapter 2 The TIBCO Spotfire S+ Perspective
INTRODUCTION
TIBCO Spotfire S+ Workbench perspectives define the appearance
and behavior of the Spotfire S+ Workbench Eclipse plug-in,
including the Spotfire S+ Script Editor, views, menus, and toolbars.
The Spotfire S+ perspective combines Spotfire S+ Workbench views
and options so you can accomplish specific types of tasks and work
with specific types of resources.
•
For more information about the Spotfire S+ Debugger
perspective options and views, see Chapter 3.
•
For practice instruction using the features in the Spotfire S+
perspective, as well as the Spotfire S+ Workbench and Debug
perspective, see Chapter 4, TIBCO Spotfire S+ Workbench
Tasks.
Note
You can change a perspective to suit your development style by moving, hiding, or closing
views. For more information about customizing the views within the perspective, see the section
Changing the Spotfire S+ Workbench Perspective on page 42, or see the section Customized
Perspective Views on page 148.
66
Introduction
Figure 2.1: The Spotfire S+ perspective.
67
Chapter 2 The TIBCO Spotfire S+ Perspective
SPOTFIRE S+ PERSPECTIVE VIEWS
The Spotfire S+ Workbench includes views shared across
perspectives. For a list of all views and their default perspectives, see
Table 1.7 in Chapter 1. (Chapter 1 also includes descriptions of the
shared views.)
The Spotfire S+ perspective includes default Eclipse views and
customized views. You can show or hide the customized views from
the menu by clicking Window Show View Other, and then
selecting the views from the list. Views in the Spotfire S+ perspective
include the following:
Table 2.1: Spotfire S+ perspective views and exercise references.
68
View
Descriptions
Practice exercises
Console view
Shared view. For a
description, see the section
Spotfire S+ Workbench
Console on page 49.
"To run copied script
code" on page 165.
History
For a description, see the
section History on page 69.
"To examine the history"
on page 166.
Objects
For a description, see the
section Objects on page 71.
"To examine the objects"
on page 161.
Outline view
Shared view. For a
description, see the section
Outline view on page 54.
"To examine the outline"
on page 160.
Output
Shared view. For a
description, see the section
Output on page 56.
"To run code" on page
166.
Problems
view
For a description, see the
section Problems view on
page 74.
"To examine problems"
on page 166.
Spotfire S+ Perspective Views
Table 2.1: Spotfire S+ perspective views and exercise references. (Continued)
View
Descriptions
Practice exercises
Search Path
For a description, see the
section Search Path on page
75.
"Adding a Database" on
page 153 and "Detaching
a Database" on page 154.
Statistics
Services view
Spotfire S+ view, applicable
only for users of TIBCO
Spotfire Statistics Services.
For a description, see the
section Statistics Services
view on page 76
"Submitting a Remote
Job" on page 178.
Tasks view
Shared view. For a
description, see the section
Tasks view on page 86.
"To add a task in the
script file" on page 163
and "To add a task
directly to the Tasks
view." on page 162.
Both the Spotfire S+ perspective and the Debug perspective also
display the default Eclipse Navigator view, which displays project
directories and all files associated with each project. The Navigator
view and other Eclipse IDE views are described in the Eclipse
Workbench User Guide.
Customizing
the Spotfire
S+ Perspective
Views
The default Spotfire S+ perspective settings control the views that
open by default in preset locations; however, you can customize the
view appearance, and then save the resulting perspective. See the
section Customized Perspective Views on page 148 for more
information.
The following sections describe only the views that appear by default
in only the Spotfire S+ perspective.
History
The History is similar to the Commands History dialog in Spotfire
S+ for Windows. The History is a scrollable list of commands that
have previously been run in the Console. (Commands that you run
by clicking Run Spotfire S+ Code or pressing F9 do not appear in
the History. See the section Output on page 56.)
69
Chapter 2 The TIBCO Spotfire S+ Perspective
•
When you select a command in the History, the pending text
in the Console changes to the selected text. You can then
press ENTER, or you can double-click the text in the History
to execute the command. You can select only one line at a
time in the History.
•
When you scroll up or down through previously-run
commands in the Console, the corresponding command is
highlighted in the History.
Note
In Windows, Spotfire S+ uses the key F10 to run a selected command. The Spotfire S+
Workbench uses the key F9 to run a selected command in all platforms.
Figure 2.2: Spotfire S+ Workbench History
History control and right-click menus
You can use the History control menu (click
70
) to:
•
Select input displayed in the History and copy it to the
Console.
•
Clear the History.
Spotfire S+ Perspective Views
Note
In the Preferences dialog, you can set the option to persist entries in the History between
sessions. For more information about this option, see the section Store Console History Between
Sessions on page 19. The History holds up to 150,000 lines of commands.
The drop-down control menu and the right-click context-sensitive
menu are identical in the History.
Objects
The Objects is similar to the Object Explorer in the Spotfire S+ GUI.
It displays all objects for projects associated with the workspace in
two panes: a table view and an expandable tree view (the Workbench
Object Explorer).
The two panes of the Objects are linked: when the Objects table
pane has focus, items you select in the table are highlighted in the tree
pane. When the tree pane has focus, objects you select in the tree are
also highlighted in the table pane. (If you select an object member in
the tree pane, its corresponding object is highlighted in the table
pane.)
Figure 2.3: Spotfire S+ Workbench Objects.
Objects control and right-click menus
You can use the Objects control menu (click
following tasks:
) to perform the
•
Select another database.
•
Refresh the view on the currently-active database.
71
Chapter 2 The TIBCO Spotfire S+ Perspective
•
Remove the selected object from the currently-active
database.
•
Show or hide Spotfire S+ system objects, such as
.Last.value, .Data, and .Random.seed. (These objects are
hidden by default.)
•
Change the number of items displayed in the tree view
members.
The drop-down control menu and the right-click context-sensitive
menu are identical in the Objects.
Note
When you run code that creates objects in a Spotfire S+ script, the Objects is not automatically
refreshed to display the new objects. To refresh Objects and display newly-created objects, rightclick the Objects (or click the control menu button
), and then from the menu, click Refresh.
Warning
If you select a large database, such as splus, in the Objects, it can take a long time to display the
contents in the table and tree view panes.
Objects table
pane
The Objects includes a table pane displaying a list of the names and
types of objects in Spotfire S+ databases. The Objects table includes
the following information about each object:
•
name
•
data class
•
storage mode
•
extent
•
size
•
creation or change date.
By default, the Spotfire S+ system objects, such as .Random.seed and
.Last.value are hidden. You can display these objects by toggling
the option on the Objects control menu.
72
Spotfire S+ Perspective Views
Object Explorer
(tree view pane)
The Objects includes an expandable tree view, the Object
Explorer. (See Figure 2.4.) Objects listed in the Object Explorer
correspond to objects in the Objects table pane.
The Object Explorer displays icons representing the type of object
or object member, along with its name as a label. (These icons are the
same icons used in the standard Spotfire S+ GUI.)
You can expand the objects to display each objects’ members. By
default, the Object Explorer displays up to 25 object members at
each expandable level. You can change this default using the Objects
context-sensitive menu item, Set Max Children.
Figure 2.4: The Spotfire S+ Workbench Object Explorer.
•
Display the Set Max Children dialog to indicate the number
of object members to display in the Object Explorer. By
default, this option is set to 25.
Figure 2.5: Set Max Children dialog.
73
Chapter 2 The TIBCO Spotfire S+ Perspective
Problems view
The Problems view is a standard Eclipse view that displays errors as
you edit and save code. For example, if you forget a bracket or a
quotation mark, and then save your work, the description appears as
a syntax error in the Problems view.
Note
Syntax problems appear in the Problems view only after you save the file.
If your code has a problem that is displayed in the Problems view,
and the view is not the active view, the Problems view tab title
appears as bold text.
To open the Script editor at the location of the problem, double-click
the error in the Problems view.
Figure 2.6: Spotfire S+ Workbench Problems view showing the right-click contextsensitive menu.
Problems view control and right-click menus
You can use the Problems view control menu (click
the following tasks:
) to perform
•
Display the Sorting dialog to sort the problems displayed in
the view, either in ascending or descending order, and
according to the problems’ characteristics.
•
Display the Filters dialog to specify properties for filtering
problems.
For more information about using these dialogs, see the Eclipse
Workbench User Guide.
74
Spotfire S+ Perspective Views
You can use the Problems view right-click context-sensitive menu
(see Figure 2.6) to perform the following tasks:
•
Jump to the location in the file containing the problem.
•
Display the file name containing the problem in the
Navigator. (This action opens an instance of the Navigator.)
•
Copy the Problems view table to the clipboard.
•
Select all entries in the table.
•
View the properties of the problem.
These menu items are standard to the Eclipse GUI. For more
information, see the Eclipse Workbench User Guide.
Search Path
The Search Path displays the names and search path position of all
the attached Spotfire S+ databases.
Figure 2.7: Spotfire S+ Workbench Search Path.
The databases that are in your search path determine the objects that
are displayed in Objects. That is, if a database is in your search path,
the objects in that database appear in the Objects. See the section
Examining Objects on page 160. For more information about
working with the Search Path, see the section Changing Attached
Databases on page 153.
The first position in the Search Path shows the current working
directory, which can be either the workspace or the current path. You
can set a project to be the working project by right-clicking its name
in the Navigator, and then clicking Toggle Working Spotfire S+
Project. See the section Navigator on page 52, and the section Setting
the Working Project on page 151.
75
Chapter 2 The TIBCO Spotfire S+ Perspective
Search Path control and right-click menus
You can use the Search Path control menu (click
) to:
•
Attach a library.
•
Attach a module.
•
Attach a directory.
•
Detach the currently-selected database in the view.
•
Refresh the current view.
The drop-down control menu and the right-click context-sensitive
menu are identical in the Search Path.
Note
When you use the control menu to add to (or remove from) the Search Path a library, module,
or directory, the view automatically refreshes. When you run code to add or remove a library,
module, or directory, the view is not automatically refreshed. To refresh the view, right-click the
Search Path (or click the control menu button, and then from the menu, click Refresh.
Statistics
Services view
76
The Statistics Services view provides controls for connecting to one
or more running TIBCO Spotfire Statistics Services server(s) and
performing a variety of tasks, including:
•
Upload and download files, including data files.
•
Delete files, including data files.
•
Preview data contents and data summary information.
•
Upload and download packages.
•
View files and packages on the server.
•
Run jobs on the server.
•
View job results.
•
View and save to the local environment return values.
•
Schedule jobs.
•
Cancel scheduled jobs.
•
Monitor jobs.
Spotfire S+ Perspective Views
•
View warnings and examine log files.
•
View image files stored on the server (.spj, .jpg, .png, .pdf,
.wmf).
Figure 2.8: Statistics Services view.
For more information about performing these tasks, see the section
Spotfire Statistics Services Remote Submissions on page 178.
When you submit a job to the server, to get the results you expect,
remember the following:
•
The job you submit runs on a new S-PLUS engine instance.
The instance of the S-PLUS engine runs the job and stores the
results, and then is released. Your code must be selfcontained, depending only on objects or functions already
available on the server (that is, in a loaded Spotfire S+ library)
or part of your submitted job.
•
The S-PLUS engine returns only one result (the last
requested). If your job requires more than one result, store the
results in a list object, and then retrieve the returned object
containing the results.
77
Chapter 2 The TIBCO Spotfire S+ Perspective
•
Default Folders
If your server request produces a large data set, we
recommend that you save it in the Results directory of the
job. (This is the default location, unless you specify an
absolute path.) You can download the file from this location,
and then view the results.
The Statistics Services view shows the folder structure for the
selected TIBCO Spotfire Statistics Services.
Table 2.2: Statistics Services view folders.
Folder
Description
Data
Contains files and folders for data files. You can add
individual files to this folder. To add a folder, see your server
administrator.
The types of data read by the S-PLUS engine are listed in the
help file for importData. See the section Statistics Services
Options on page 25 for information about filtering and
expanding the list of available data types.
78
Spotfire S+ Perspective Views
Table 2.2: Statistics Services view folders. (Continued)
Folder
Description
Jobs
Lists the jobs, in the order that they are submitted, with the
most recent jobs first. The job folder name consists of the job
ID and status (for example, 205 (Done) or 205 (Waiting)).
Job names whose folders have not been opened appear in
boldface font. You can delete completed jobs that you no
longer need, or you can interrupt jobs that are waiting to run.
All job folders include the following elements:
•
Results: Contains the engine.log file and any other files
(such as graphic files) created as a result of running the
job. Double-click the file engine.log to displays its
contents in the Output view. Double-click an image file
(such as .spj) to display it in a graphics viewer.
•
Output: Displays the Output view.
•
Return Value: Displays the return value in the output
window for this job. The return value consists of:
•
Packages
•
The string retVal.servername.job#, where
servername is the name of the server containing the SPLUS engine that ran the job, and job# is the job ID.
•
The script’s return value.
Script: Opens a new instance of the Script Editor view
containing the contents of the script that was run for this
job.
Includes any packages installed or uploaded to Spotfire
Statistics Services. For example, if your organization uses
TIBCO Spotfire Clinical Graphics, when you expand the
Packages folder, you see the three protected packages
required to run this server: gom, graphlet, and tscg.
Any package you upload is displayed in this folder. If you
have completed and uploaded the Soundex example, you see
the unprotected package folder Soundex. (See the section
Spotfire Statistics Services Remote Submissions on page 178.)
79
Chapter 2 The TIBCO Spotfire S+ Perspective
Statistics
Services RightClick Menus
The Statistics Services view provides context-sensitive right-click
menus for the services’ files and folders.
•
Right-click a service name to:
•
Remove the service. When you remove a service, it is
removed from the list, but it still appears in the Add
Service Connection Server URL drop-down list, in
case you want to reregister it later.
•
Disconnect from the service. Disconnected services still
appear in the list of available services in the Statistics
Services view, but their folder structures are not visible,
and the green checkmark indicating their availability is
removed.
•
Refresh the service file and folder list.
•
Run a job.
•
Schedule a job.
•
Monitor service jobs.
•
Examine the service properties.
Figure 2.9: Right-click service menu.
80
•
Right-click a data folder in the service to perform any servicelevel task, or to upload a data file.
•
Right-click a data file to perform any service-level task, or to
download a file copy or delete the file. You can also preview
the data or display a summary of the data from this menu.
•
Right-click a job folder to perform any service-level task, or to
interrupt a waiting job or delete a job that you no longer need.
•
Right-click the Results folder to upload a file.
Spotfire S+ Perspective Views
Statistics
Services view
Toolbar
•
Right-click a file contained in a Results folder to download or
delete the file.
•
Right-click or double-click Return Value to retrieve the
return value for the specified job.
•
Right-click the Packages folder in the service to perform any
service-level task, or to upload a package.
•
Right-click a package folder to perform any service-level task, or
to upload, download, or delete an unprotected package. You
can also examine a package’s properties from this menu.
The Statistics Services view also displays a toolbar containing the
following buttons:
Table 2.3: Statistics Services view buttons.
Button
Description
Click to display the Add Service Connection dialog. Use
this dialog to register a service. You can provide the display
name for the service, the server URL (for example: http://
myserver:8080/SplusServer), and your login credentials.
The Server URL must be unique; if you try to register a
service that is already registered, the service registrar displays
an error message.
Service connections are listed in alphabetical order,
according to the friendly Service Name you provide.
Click to collapse the entire server display tree, for all
connected servers.
Click to reconnect to the server selected in the Statistics
Services view.
Click to disconnect from the server selected in the Statistics
Services view.
81
Chapter 2 The TIBCO Spotfire S+ Perspective
Table 2.3: Statistics Services view buttons. (Continued)
Button
Description
Click to display the Monitor Server Jobs view to see the
status of jobs queued on the server. Seeing the current server
workload is useful if your job is listed as Waiting.
This view also detects the service state. If the service fails, this
view closes automatically and terminates the service
connection.
This view displays properties of jobs waiting on the selected
server. Only properties of jobs that are waiting in the server
are displayed. As soon as they finish running, they are
removed from the display. (The results of finished jobs
appear in the server Jobs folder.)
Click to refresh the view of files and folders for the selected
server.
Click to run on the server the script that is open in the Script
Editor.
Click to display the Schedule dialog. Use this dialog to
specify a time and date for the script open in the Script Editor
to run on the selected server. when you click OK, the job is
assigned a job ID, and it and the time and date the job is
scheduled to run is displayed in the server tree.
Statistics
Services
Dialogs
82
This section describes the dialogs providing access to an available
Spotfire Statistics Services server. For an example of using Spotfire
Statistics Services, see the section Spotfire Statistics Services Remote
Submissions on page 178.
Spotfire S+ Perspective Views
Add Service Connection
Figure 2.10:
Use this dialog to connect to Spotfire Statistics Services.
Service Name
The friendly name. This name is displayed in the Statistics Services
view.
Server URL
The URL for the server must contain the server name, the port
number and SplusServer. For example:
http://myserver:8080/SplusServer
®
On Microsoft Windows Vista and Windows 7 operating systems,
the letter case for the server name must match the case of the server
name that is specified on the server, in its properties file. See your
server administrator for more information.
User Name and Password
If required, provide your credentials that the server can validate.
83
Chapter 2 The TIBCO Spotfire S+ Perspective
Schedule Job
Figure 2.11: Schedule Job dialog.
Use this dialog to specify a future date and time to run S-PLUS code
on a server running Spotfire Statistics Services.
Server Time Zone
Indicates the time zone that the server is set to.
Current time
Lists the current time on the server.
Server is ahead/behind by
Indicates the number of hours and minutes the server time is offset by
the computer running the Spotfire S+ Workbench.
Calendar
Highlights the current day on your computer and the server day, if
different.
Time
By default, displays the current time on the server. Set the time for the
job to run. If you specify a time in the past, the job runs immediately,
on the first available S-PLUS engine.
84
Spotfire S+ Perspective Views
Monitor Server
Jobs view
The Monitor Server Jobs view is not shown by default. You can
display it by clicking its button on the Statistics Services view
toolbar, or by right-clicking a running service and selecting Monitor
Jobs. The Monitor Server Jobs view displays the details of jobs in
the queue on TIBCO Spotfire Statistics Services, including:
•
Job ID
•
Date and time the job was submitted.
•
The job’s status.
•
The name of the user who submitted the job.
The name of the service where the job is running populates the tab
title.
Figure 2.12: Monitor Server Jobs view.
Note
Completed jobs are removed from the Job Monitor. Look for their results in the server’s Jobs
folder. Scheduled jobs do not appear in the job monitor..
85
Chapter 2 The TIBCO Spotfire S+ Perspective
Tasks view
The Tasks view is a standard Eclipse IDE view, which is customized
in Spotfire S+ to provide three levels of tasks:
Table 2.4: Spotfire S+ Workbench Tasks.
Task
Description
FIXME
Defines high-priority tasks. The
task appears with an
exclamation mark in the Tasks
view.
TODO
Defines medium-priority tasks.
XXX
Defines low-priority tasks.
You can change these tasks, or you can add your own custom tasks.
For more information about changing task settings, see section Task
Options on page 25, and the section To set the Spotfire S+
preferences on page 139.
Figure 2.13: Spotfire S+ Workbench Tasks view showing the right-click contextsensitive menu.
86
Spotfire S+ Perspective Views
Tasks view toolbar
The Tasks view also contains a toolbar that displays the following
buttons:
Table 2.5: Tasks view buttons.
Button
Description
Click to display the Add Task dialog to add a custom task.
Click to delete the selected custom task. (Note that you
cannot use this button to delete tasks identified in the script.)
Click to display the Filters dialog to specify properties for
filtering the tasks.
Tasks view control and right-click menus
You can use the Tasks view control menu (click
following tasks:
) to perform the
•
Display the Sorting dialog to sort the tasks displayed in the
view, either in ascending or descending order, and according
to the tasks’ characteristics.
•
Display the Filters dialog to specify properties for filtering
tasks.
You can use the standard Eclipse Tasks view right click contextsensitive menu to:
•
Add a task to the list that is not linked to a file (Displays the
Eclipse Add Task dialog).
•
Open a file and display the location of a linked task in the
Script Editor.
•
Display the location of a linked task in the Navigator (opens
an instance of the Navigator).
•
Copy the Tasks view table to the clipboard.
87
Chapter 2 The TIBCO Spotfire S+ Perspective
•
Select all entries in the table.
•
Delete all tasks marked as completed (that is, containing a
check mark in the first column).
•
View the properties of the task.
For more information about the basic Eclipse Tasks view, see the
Eclipse Workbench User Guide.
88
TIBCO SPOTFIRE S+
WORKBENCH DEBUG
PERSPECTIVE
3
Introduction
90
Debug Perspective Options and Preferences
Setting Preferences
Debug Mode
Debug Run Menu Options
92
93
93
94
Debug Perspective Views
Profiler
Profiler views
98
120
121
89
Chapter 3 TIBCO Spotfire S+ Workbench Debug Perspective
INTRODUCTION
The TIBCO Spotfire S+ Workbench includes the Debug perspective,
which is based on the Eclipse standard debugging perspective.
From the Debug perspective, you can observe the run-time behavior
of your program and determine the location of semantic errors. The
Spotfire S+ debugger understands features that are built into the
Spotfire S+ programming language and its associated libraries. With
the Spotfire S+ debugger, you can break (suspend) execution of your
program to examine your code and evaluate variables.
After you have written your code and resolved any syntax errors, you
can use the Spotfire S+ debugger to correct any logic errors that keep
your code from running correctly. Using the Spotfire S+ debugger,
you can:
•
Control your code testing by setting break points, stepping
into, though, and out of code, and pausing or terminating the
process at any point using the Spotfire S+ debugger features.
•
Set, disable, enable, or remove breakpoints while you are
debugging.
•
View variable and expression values at breakpoints while
stepping through your code.
•
Track resource allocation and function use.
Note
Because a significant amount of computation is required when you run a debugger, you should
expect to see Spotfire S+ running at a slower speed than usual when you toggle the Workbench
to Debug mode. Try this simple test for a demonstration:
1.
With Debug mode off, examine the results of running:
sys.time(lm(fuel.frame))
sys.time(validate()).
90
2.
Toggle on Debug mode and rerun the commands.
3.
Examine the difference.
Introduction
Figure 3.1 shows the Debug perspective’s views. This chapter
describes the options, features, and views included in the Debug
perspective.
Figure 3.1: The Debug perspective.
The Debug perspective also includes a profiler, which you can use to
inspect allocated memory and functions called, including call count
and duration. For more information about the Spotfire S+ Profiler,
see the section Profiler on page 120.
•
For tasks that walk you through using the Spotfire S+
debugger and profiler, see the section Chapter 4, TIBCO
Spotfire S+ Workbench Tasks.
•
For information about the Spotfire S+ perspective, see
Chapter 2, The TIBCO Spotfire S+ Perspective.
Note
You can create your own perspective that displays a combination of views from the perspectives,
or you can change the Debug perspective to suit your development style by adding, moving,
hiding, or closing views. For more information about customizing the views within the
perspective, see the section Changing the Spotfire S+ Workbench Perspective on page 42, or see
the section Customized Perspective Views on page 148.
91
Chapter 3 TIBCO Spotfire S+ Workbench Debug Perspective
DEBUG PERSPECTIVE OPTIONS AND PREFERENCES
When you examine the Debug perspective, examine the Spotfire S+
Workbench toolbars, menus, default options, and preferences in the
IDE.
Note that the Spotfire S+ Workbench toolbar includes the Spotfire S+
debugger buttons (as well as the Profiler button). These buttons are
described in greater detail in Table 1.5.
Figure 3.2: The Spotfire S+ Workbench toolbar.
Note
When you are in the Debug perspective, notice that the Eclipse environment displays a generic
toolbar that includes a Run button, a Debug button, and an External Tools button. These
buttons might work with other Eclipse plug-ins, but they are not intended to be used with
Spotfire S+. You can set breakpoints from the Debug view toolbar, or from several menus, and
you can run code using the Run Spotfire S+ Code button on the Spotfire S+ toolbar or from
the console.
92
Debug Perspective Options and Preferences
Setting
Preferences
From the menu, click Window Preferences to open the
Preferences dialog and examine the options. (For more information
about setting preferences, see the section Examining Spotfire S+
Preferences on page 14. For more information about Eclipse
preferences, see the Eclipse Workbench User’s Guide, available from the
Help Help Contents menu in the IDE.)
Most options in the Spotfire S+ pages of the Preferences dialog
apply to global settings in the Spotfire S+ Workbench. For example,
options controlling editor or Console text colors apply to both
perspectives. Only the Profiler page under Spotfire S+ controls
Spotfire S+ debugger behavior, and that controls only the refresh rate
for system allocations and function calls. See section Examining
Spotfire S+ Preferences on page 14 for more information.
Debug Mode
To start debugging, first activate the debugger using one of the
following methods:
•
On the toolbar, click Toggle Spotfire S+ Debugger
.
•
On the menu, click the Run Toggle Spotfire S+
Debugger.
•
On the keyboard, press CTRL+ALT+D.
After you activate the Spotfire S+ debugger, any expression you type
in the Console, or that you run by clicking Run Spotfire S+ Code
( ) on the toolbar, invokes the Spotfire S+ debugger.
Note
You can set Eclipse an option to be notified that a debug session is about to begin (that is, if you
click Debug ( ) and try to run a function in the Console that encounters any breakpoints).
1. From the main menu, click Windows Preferences.
2. Expand Run/Debug and select Perspectives.
3. In the Perspectives dialog, in the Open the associated perspective when
launching group, select Prompt. Click OK.
Using this Eclipse option, you are prompted to change to the Debug perspective with the
message box shown in Figure 3.3. Clicking Yes displays the Debug perspective with the Debug
view open and the debugging started.
93
Chapter 3 TIBCO Spotfire S+ Workbench Debug Perspective
Figure 3.3: The Confirm Perspective Switch message box.
Debug Run
Menu Options
When you switch to the Debug perspective, the Spotfire S+
Workbench Run menu changes to list all of the code control actions
specific to that perspective. Note that many of the options listed in
this menu are default Eclipse debugging options. For more
information about those options, see the Eclipse Workbench User
Guide. The Spotfire S+ Debugger actions are available in the Debug
perspective views.
Table 3.1: Debug perspective Run menu.
94
Menu item
Description
Run Spotfire S+ Code
Runs the code in the currently-active file,
or runs the selected code.
Run Next Spotfire S+
Command
Runs the next available Spotfire S+
command.
Toggle Spotfire S+
Debugger
When toggled on, engages the Spotfire S+
debugger. (You can engage the Debugger
in either the Spotfire S+ or the Debug
perspectives; however, by default, the
views displaying debugging information
are visible in the Debug perspective.)
Debug Perspective Options and Preferences
Table 3.1: Debug perspective Run menu. (Continued)
Menu item
Description
Toggle Spotfire S+
Profiler
When toggled on, engages the Spotfire S+
Profiler. (You can engage the Spotfire S+
Profiler in either the Spotfire S+ or the
Debug perspectives; however, by default,
the views displaying profiling information
are visible in the Debug perspective.)
You do not need to engage the debugger
in order to engage the Profiler. See the
section Profiler on page 120 for more
information.
Resume
Resumes debugging when the debugger is
paused.
Suspend
Suspends debugging.
Terminate
Terminates debugging.
Step Into
Steps into the current function by one
level
Step Over
Stays at the same expression level but
steps to the next expression.
Step Return
Steps out of the current function by
one level.
Run to Line
Core Eclipse debugger option; not
implemented in Spotfire S+.
Use Step Filters
Core Eclipse debugger option; not
implemented in Spotfire S+.
Run Last Launched
Core Eclipse debugger option; not
implemented in Spotfire S+.
95
Chapter 3 TIBCO Spotfire S+ Workbench Debug Perspective
Table 3.1: Debug perspective Run menu. (Continued)
96
Menu item
Description
Debug Last Launched
Core Eclipse debugger option; not
implemented in Spotfire S+.
Run Last Launched
Core Eclipse debugger option; not
implemented in Spotfire S+.
Debug Last Launched
Core Eclipse debugger option; not
implemented in Spotfire S+.
Run History
Core Eclipse debugger option; not
implemented in Spotfire S+.
Run As
Core Eclipse debugger option; not
implemented in Spotfire S+.
Run
Core Eclipse debugger option; not
implemented in Spotfire S+. (Use the Run
Spotfire S+ Code option at the top of the
main menu, F9, the Debug view contextsensitive menu, or on the Debugger
toolbar.)
Debug History
In its submenu, lists the previouslylaunched debugging actions. From this
list, you can select a previous
Debug As
Core Eclipse debugger option; not
implemented in Spotfire S+.
Debug
Core Eclipse debugger option; not
implemented in Spotfire S+.
External Tools
Core Eclipse debugger option; not
implemented in Spotfire S+.
Debug Perspective Options and Preferences
Table 3.1: Debug perspective Run menu. (Continued)
Menu item
Description
Toggle Spotfire S+
Warning Breakpoint
Requires that the Spotfire S+ debugger be
toggled on. When toggled on, stops
execution if Spotfire S+ encounters a
warning. See Table 3.7 in the section
Breakpoints view on page 113 for more
information about warning breakpoints.
Toggle Spotfire S+ Error
Breakpoint
Requires that the Spotfire S+ debugger be
toggled on. When toggled on, stops
execution if Spotfire S+ encounters an
error. See Table 3.7 in the section
Breakpoints view on page 113 for more
information about error breakpoints.
Toggle Line Breakpoint
When toggled on, removes the breakpoint
on the selected line.
Toggle Method
Breakpoint
Core Eclipse debugger option; not
implemented in Spotfire S+.
Toggle Watchpoint
Not implemented in the debugger.
Skip All Breakpoints
When selected, disregards but maintain
(that is, does not remove or disable) all
breakpoints. When this button is toggled
on, all breakpoints appear with a diagonal
slash, as shown in the button.
Remove All Breakpoints
Removes every breakpoint from files in
open projects. (This item does not remove
breakpoints from files in closed projects.)
97
Chapter 3 TIBCO Spotfire S+ Workbench Debug Perspective
DEBUG PERSPECTIVE VIEWS
The Debug perspective includes views specific to using the debugger
and the profiler, as well as views shared across perspectives. For a list
of all views and their default perspectives, see Table 1.7 in Chapter 1.
(Chapter 1 also includes descriptions of the shared views.)
The Debug perspective includes the default Eclipse Navigator view
and customized views. Customized views in the Debug perspective
include the following:
Table 3.2: Debug perspective views and exercise references.
98
View
Descriptions and Practice exercises
Allocations
view
A Spotfire S+ Profiler view. For a description, see the
section Allocations view on page 122. For practice using
this view, see the exercise in the section Examining
Resource Usage on page 199. (The Profiler views are
discussed in more detail in the section Profiler Mode on
page 121.)
Breakpoints
view
For a description, see the section Breakpoints view on
page 113. For practice using this view, see the exercise
in the section Setting breakpoints on page 190.
Console
Shared view. For a description, see the section Spotfire
S+ Workbench Console on page 49. For practice using
this view, see the exercise in the section To run copied
script code on page 165.
Debug view
For a description, see the section Debug view on page
100. For practice using this view, see the exercise in the
section Examining the call stack on page 193.
Expressions
view
For a description, see the section Expressions view on
page 111. For practice using this view, see the exercise
in the section Examining Variables and Expressions on
page 194
Debug Perspective Views
Table 3.2: Debug perspective views and exercise references. (Continued)
View
Descriptions and Practice exercises
Function
Calls view
A Spotfire S+ Profiler view. For a description, see the
section Function Calls view on page 121. For practice
using this view, see the exercise in the section
Examining Function Calls on page 199. (The Profiler
views are discussed in more detail in the section Profiler
Mode on page 121.)
Outline view
Shared view. For a description, see the section Outline
view on page 54. For practice using this view, see the
exercise in the section To examine the outline on page
160.
Output
Shared view. For a description, see the section Output
on page 56. For practice using this view, see the exercise
in the section To run code on page 166.
Variables
view
For a description, see the section Variables view on page
106. For practice using this view, see the exercise in the
section Examining Variables and Expressions on page
194.
Tasks view
Shared view. For a description, see the section Tasks
view on page 86. For practice using this view, see the
exercise in the section Adding a Task to A Script on
page 161.
Additionally, the Debug perspective displays the Script Editor, which
is shared with the Spotfire S+ perspective. See the section Editor on
page 103 for more information about using the Script Editor with the
Spotfire S+ Debugger. See the section Spotfire S+ Workbench Script
Editor on page 57 for more general information about editing code in
the Script Editor.
From the Debug perspective, you can observe the run-time behavior
of your program and determine the location of semantic errors. The
Workbench debugger understands features that are built into the
99
Chapter 3 TIBCO Spotfire S+ Workbench Debug Perspective
Spotfire S+ programming language and its associated libraries. With
the debugger, you can break (suspend) execution of your program to
examine your code and evaluate and edit variables.
Debug view
The Debug view displays the call stack of a currently-paused
expression. Clicking any level of the call stack displays in the Editor
the current function and/or the highlighted expression.
Figure 3.4 displays the Debug view, in its default position, displaying
the call stack for the kahanSum example.
Figure 3.4: The Debug view.
100
Debug Perspective Views
Debug view toolbar
The Debug view contains a toolbar with the following buttons for
evaluation control, in the order of their appearance, left to right:
Table 3.3: Debug view toolbar buttons.
Button
Description
Remove All Terminated Launches. Clears
the call stack of all debugging sessions that
ended with a termination.
Resume. Continues to the next breakpoint.
Suspend. Pauses the execution as though a
breakpoint had been hit.
Terminate. Stops the execution. Similar to
ESC functionality.
Disconnect. For remote debugging. Not
implemented for Spotfire S+.
Step Into. Steps into the current function by
one level.
101
Chapter 3 TIBCO Spotfire S+ Workbench Debug Perspective
Table 3.3: Debug view toolbar buttons. (Continued)
Button
Description
Step Over. Stays at the same expression
level but steps to the next expression.
Step Return. Step out of the current function
level.
Use Step Filters/Step Debug. This feature is
not supported in the Spotfire S+ Workbench.
Note
The feature Drop to Frame is not implemented in the Spotfire S+ Workbench.
Debug view control and right-click menus
The Debug view contains a control drop-down ( ) menu with one
command: View Management, which displays the View
Management page of the Eclipse Preferences dialog, in which you
can set options to open and close views automatically. This dialog is
also available from the Windows Preferences menu. For more
information about using this menu item, see the Eclipse Workbench
User’s Guide.
You can use the Debug view right-click menu (Figure 3.5) to perform
the following tasks:
102
•
Copy the contents of the stack.
•
Step into the code.
•
Step over the code.
•
Step one level out of the current function.
•
Resume debugging.
•
Suspend debugging.
Debug Perspective Views
•
Terminate the debugging session.
•
Terminate and restart the current debugging session.
•
Remove from the view all previously terminated debugging
sessions.
•
Terminate and remove the currently-active debugging session.
•
Restart the current debugging session.
•
Terminate all debugging.
These menu items are available on the toolbar, or from the main Run
menu. For more information, see the section Debug view toolbar on
page 101 or the section Debug Run Menu Options on page 94.
Figure 3.5: The Debug view right-click context-sensitive menu.
Editor
The Debugger perspective uses the existing Spotfire S+ Workbench
editor. You can set and remove breakpoints in the Script Editor by:
•
Double-clicking the margin on the left side of the screen (to
the left of the line numbers).
103
Chapter 3 TIBCO Spotfire S+ Workbench Debug Perspective
•
By right clicking the margin, and from the menu, select
Toggle Breakpoint.
•
By using the Run Toggle Line Breakpoint menu option.
•
By pressing CTRL+SHIFT+B.
When you are debugging, if your functions call any functions in files
other than those in your workspace (including functions in a library),
you can double-click the expression in the Debug view and open a
temporary file that contains the called function. You can set
breakpoints in these functions, too.
Figure 1: A temporary file in the debugger.
You can view functions that are not defined in your workspace in one
of the following ways:
104
•
Double-click the Debug view.
•
Press CTRL+click in the Spotfire S+ Script Editor.
•
On the menu, click Spotfire S+ Find
Debug Perspective Views
•
Press CTRL+SHIFT+F
Note
•
Breakpoints that you set in functions in your workspace are associated with function and
with the file. These breakpoints persist until you remove them.
•
Breakpoints that you set in functions outside of your workspace are associated with the
functions, and not with the temporary files. They persist until you remove them.
•
Setting breakpoints in code files in the Spotfire S+ Workbench does not affect the file if
you open it in the Spotfire S+ GUI in Windows. Breakpoints are evaluated only in the
Spotfire S+ Workbench, and only when the debugger is engaged.
•
Breakpoints can be set only on a line contained within a function definition. Lines not
contained within a function cannot have a breakpoint set.
If you close a temporary file containing a breakpoint, and then rerun your function, the functions
called by your code reopen in another temporary file, and any breakpoints you set persist.
Examining
Using the Hover feature, you can position the mouse over an
Expression Values expression in the Script Editor, and then examine the expression’s
value, which appears in a tooltip. This feature is available for all
in Tooltips
expressions in the Script Editor, not just those where a breakpoint
appears; however, examining the value of an expression at a
breakpoint can be very useful.
You can limit the size of the expression that the Hover feature
evaluates by using the following Spotfire S+ command:
options(workbenchMaxDims=c(rows, columns))
See the section Hover on page 21 for more information.
You can enable or disable the hover tooltip feature in the Editor
options dialog from the Windows Preferences menu. This feature
is enabled by default.
Figure 3.6: Hover option in the Editor preferences dialog.
105
Chapter 3 TIBCO Spotfire S+ Workbench Debug Perspective
For practice tasks on setting breakpoints, see the section Setting
breakpoints on page 190.
Figure 3.7: Breakpoints view and Editor.
Variables view
Displays all variables in the current frame. As you debug, at each
breakpoint or step, the debugger re-evaluates the variables. At any
breakpoint or stopping point, you can review, but not edit or alter, the
variables at the current frame.
Figure 3.8 shows the Variables view with the current variable
selected. The Details pane of this view contains variable information
that would result from calling print() on the selected variable or
106
Debug Perspective Views
expression. The Details pane is editable; you can select, cut, or copy
the contents of this pane. Editing the Details pane does not affect the
value of a variable.
Figure 3.8: The Variables view.
Variables view and Expressions view toolbars
The Variables view and Expressions view contain similar toolbars to
control the view display and feature options.
Table 3.4: Variables view and Expressions view toolbar buttons.
Button
Description
Show Type Names. Select to
display the variables’ types.
Show Logical Structure. This
feature is currently not supported
in the Spotfire S+ Workbench.
Collapse All. Collapses the logical
structure display (which is currently
not supported in the Spotfire S+
Workbench).
Remove Selected Expressions
(Expressions view only).
Remove All Expressions
(Expressions view only).
107
Chapter 3 TIBCO Spotfire S+ Workbench Debug Perspective
Variables view control and right-click menus
The Variables view and Expressions view drop-down control
menus provide additional options to control the view’s display. The
respective menus are available from the down arrow button on the
Variables or Expressions view toolbar.
Figure 3.9: The Variables view control menu.
The Variables view and Expressions view control menus include
the following options:
Table 3.5: Variables view and Expressions view control menu options.
108
Menu item
Description
Vertical View Orientation
Tiles the Details pane of the view
vertically. That is, the Details pane
appears below the Variables or
Expressions pane.
Horizontal View Orientation
Tiles the Details pane of the view
horizontally. That is, the Details
pane appears beside the Variables
or Expressions pane.
Debug Perspective Views
Table 3.5: Variables view and Expressions view control menu options.
Menu item
Description
Variables View Only
Hides the Details pane of the
Variables or Expressions view.
Expressions View Only
Detail Pane
Displays the Configure Details
Area dialog, which controls the
maximum number of characters to
display in the Details pane. See
Figure 3.10.
Wrap Text in Details pane
Wraps the text that appears in the
Details pane.
Figure 3.10: Configure Details Area dialog.
Note
Figure 3.10 shows the Configure Details Area dialog, with which you can set the number of
characters to display. This option just controls the number displayed; it does not limit the number
of characters returned. To limit the number of text variables and expressions to return, use the
Spotfire S+ command options(workbenchMaxDims=c(rows, columns)). This option is useful if
you are working with a large number of text variables or expressions.
Setting this option also limits the size of the expression that the hover feature evaluates. For
example, if you are evaluating a large data object, and you hover the mouse over the expression,
if you do not set this option, Spotfire S+ tries to evaluate the expression on the spot.
The Variables view contains two right-click context-sensitive menus:
•
The Variables view (Figure 3.9).
109
Chapter 3 TIBCO Spotfire S+ Workbench Debug Perspective
•
The Details pane (Figure 3.12).
You can use the Variables view right-click context-sensitive menu to
perform the following tasks:
•
Select all variables in the pane.
•
Copy the selected variable.
•
Find a specified variable.
•
Set an expression watch for the selected variable. (When you
select this option, the selected variable is added to the
Expressions view.)
Figure 3.11: Variables view showing the right-click menu.
You can use the right-click context-sensitive menu in the Variables
view Details pane to perform the following tasks:
110
•
Cut the currently-selected text.
•
Copy the currently-selected text.
•
Paste the contents of the clipboard to the cursor location in
the pane.
•
Select all text in the pane.
Debug Perspective Views
•
Find a specified string in the pane. (The Spotfire S+
Workbench does not support replacing strings in the Details
pane using the Find/Replace dialog.)
Figure 3.12: Variables view showing the right-click menu in the Details pane.
Expressions view The Expressions view displays the values of any Spotfire S+
expression. Like the Variables view, it is re-evaluated at each
evaluation pause (breakpoint or step).
Note on Expressions
An expression is any syntactical interaction that Spotfire S+ can
evaluate. Expressions persist from session to session. Spotfire S+
recognizes a wide variety of expressions, but in interactive use, the
most common are names, which return the current definition of the
named data object, and function calls, which carry out a specified
computation. Any of the following are Spotfire S+ expressions:
1:10
rnorm(5)
mean(1:10)
traceback()
If you were debugging a function, for example:
incrementByTwo <- function(x) {
* x + 2
}
you could have an expression that evaluated:
x + 2
111
Chapter 3 TIBCO Spotfire S+ Workbench Debug Perspective
at the breakpoint (denoted with the * in the above function
definition).
Note
If you leave in the Expressions view expressions that are no longer in scope for your current
debugging session, you might notice that the debugger slows significantly to evaluate the
expression that is no longer in scope. To keep the debugger from slowing down, remove
expressions that are no longer in scope for your current debugging session.
For more information about expressions, see the Programmer’s Guide,
or see the Spotfire S+ Help topic ExpressionLanguage.
The Expressions view toolbar buttons are the same as those of the
Variables view, with the addition of the Remove and Remove All
buttons. See Table 3.4 for more information.
The Expressions view contains two right-click context-sensitive
menus:
•
The Expressions view (Figure 3.13)
•
The Details pane (Figure 3.12).
You can use the Expressions view right-click context-sensitive menu
to perform the following tasks:
112
•
Select all expressions in the pane.
•
Copy the selected expression.
•
Remove the selected expression.
•
Remove all expressions in the view.
•
Add an expression to watch (opens the Add Watch
Expression dialog, in which you can provide an expression
and indicate whether to enable or disable it).
•
Re-evaluate the expressions.
•
Disable the currently-selected expression.
•
Enable the currently-selected expression (if it was previously
disabled).
Debug Perspective Views
•
Edit the currently-selected expression. (Opens the Edit
Watch Expression dialog, in which you can change
expression and indicate whether to enable or disable it.)
Figure 3.13: Expressions view showing the right-click menu.
The right-click context-sensitive menu for the Details pane in the
Expressions view is the same as that of the Variables view Details
pane. See Figure 3.12 and the section Variables view control and
right-click menus on page 108 for more information.
Find a specified string in the pane. (The Spotfire S+ Workbench does
not support replacing strings in the Details pane using the Find/
Replace dialog.)
Figure 3.14: Variables view showing the right-click menu in the Details pane.
Breakpoints view The Breakpoints view displays the currently set breakpoints, which
you can organize by resources, files, working sets, or just a simple list
or type. Each breakpoint displayed in the Breakpoints view shows
113
Chapter 3 TIBCO Spotfire S+ Workbench Debug Perspective
the function name (e.g., kahanAddNext), the file name (e.g.,
kahanAddNext_func.q), and the line number (e.g., [line 7]) where
the breakpoint occurs.
In addition to setting general user interface options, you can use the
Breakpoints view to manage breakpoint working sets and group
breakpoints. See the Eclipse Workbench User’s Guide for more
information.
Selecting a breakpoint displays in the Editor the associated file,
highlighting the breakpoint line. You can activate, disable, or delete
breakpoints from this view.
Figure 3.15 displays the Breakpoints view with the file structure
shown, and all breakpoints activated.
Figure 3.15: Breakpoints view.
114
Debug Perspective Views
Breakpoint types
Breakpoints are the best tools to stop an evaluation and inspect the
engine's state. The Spotfire S+ Workbench supports three types of
breakpoints.
Table 3.6: Types of breakpoints.
Breakpoint type
Description
Line breakpoints
Use line breakpoints to stop an evaluation at the
specified line number. To set line breakpoints,
from any perspective:
Double-click the left margin of the Spotfire S+
Editor.
Right-click the left margin of the Spotfire S+
Editor.
From the Debug perspective, Click the Run Toggle Line Breakpoint menu item.
After you set a line breakpoint, you can enable or
disable it in the Breakpoints view, or by rightclicking the breakpoint marker ( ) in the left
margin of the Editor.
(For more information about using the
Breakpoints view, see the section Breakpoints
view on page 113.)
115
Chapter 3 TIBCO Spotfire S+ Workbench Debug Perspective
Table 3.6: Types of breakpoints. (Continued)
Breakpoint type
Description
Warning breakpoints
Warning breakpoints are triggered only if the
Spotfire S+ Debugger is toggled on.
Use warning breakpoints to stop an evaluation
when a warning is generated. You can activate
warning breakpoints from any perspective by
clicking Toggle Spotfire S+ Warning
Breakpoint ( ) on the Spotfire S+ toolbar, or
by clicking the Run Toggle Spotfire S+
Warning Breakpoint menu item.
Error breakpoints
•
Warning breakpoints do not appear in
the Breakpoints view.
•
Warning breakpoints are not affected by
the option Skip All Breakpoints ( ).
Error breakpoints are triggered only if the
Spotfire S+ Debugger is toggled on.
Use error breakpoints to stop an evaluation when
an error is generated. You can activate error
breakpoints from any perspective by clicking
Toggle Spotfire S+ Error Breakpoint ( ) on
the Spotfire S+ toolbar, or by clicking the Run Toggle Spotfire S+ Error Breakpoint menu
item.
116
•
Error breakpoints do not appear in the
Breakpoints view.
•
Error breakpoints are not affected by the
option Skip All Breakpoints ( ).
Debug Perspective Views
Breakpoints view toolbar
The Breakpoints view contains a toolbar to control the view’s
display and feature options.
Button
Description
Remove Selected Breakpoints. From the Breakpoints
view, click to remove the selected breakpoint from both the
Debug view and the Breakpoints view.
Remove All Breakpoints. From the Breakpoints
view, click to remove every breakpoint from both the
Debug view and the Breakpoints view.
Show Breakpoints Supported by Selected Target.
When toggled off, all breakpoints are displayed. When
toggled on, the Breakpoints view displays only breakpoints
applicable to the selected debug target. For example, if you
had installed a Java package for Eclipse (not included in the
Spotfire S+ Workbench), and you were running a Java
debug session and a Spotfire S+ debug session
simultaneously, you could filter using this feature.
Go to File for Breakpoint. Click to jump to the file and
line number containing the breakpoint currently selected in
the Breakpoints view.
Skip All Breakpoints. Click to disregard but maintain
(that is, not remove or disable) all breakpoints. When this
button is toggled on, all breakpoints appear with a diagonal
slash, as shown in the button.
117
Chapter 3 TIBCO Spotfire S+ Workbench Debug Perspective
Button
Description
Expand All. If the Breakpoints view is set to display
breakpoints in groups such as files, working sets, projects,
resources, or breakpoint types, clicking this button expands
the tree to display the breakpoints in all groups. (See Table
3.7 for more information about the group display options.)
Collapse All. If the Breakpoints view is set to display
breakpoints in groups such as files, working sets, projects,
resources, or breakpoint types, clicking this button collapses
the tree to display only the top-level groups. (See Table 3.7
for more information about the group display options.)
Link With Debug View. As breakpoints are encountered,
they are selected in the Breakpoints view.
Breakpoints view control and right-click menus
The Breakpoints view contains a control menu to control the types
and levels of resources displayed, and options for managing working
sets. See the Eclipse Workbench User’s Guide for more information
about managing working sets.
Figure 3.16: The Breakpoints view menu.
118
Debug Perspective Views
The Breakpoints control menu includes the following options:
Table 3.7: Breakpoints view menu.
Menu Item
Description
Group By
Displays a submenu providing the following options:
•
Breakpoints. Displays only the breakpoints
in a flat list.
•
Breakpoint Types. Displays breakpoints
grouped by type ( Java, Spotfire S+, and so
on).
•
Breakpoint Working Sets. Displays
breakpoints grouped by identified working
sets. See (working sets section) for more
information.
•
Files. Displays breakpoints grouped by the
files containing them.
•
Projects. Displays breakpoints grouped by
the projects containing them.
•
Resource Working Sets. Displays
breakpoints by the resources to which they
belong.
•
Advanced. Displays the Group
Breakpoints dialog. See the Eclipse
Workbench User’s Guide for more information
about using working sets and groups.
Select Default
Working Set
Displays a dialog to create, select, or remove the
breakpoint working set that is your project’s default.
See the Eclipse Workbench User’s Guide for more
information about using working sets.
Deselect Default
Working Set
Clears the working set that you specified in the
Select Default Working Set dialog.
Working Sets
Displays the Select Working Set dialog.
You can use the Breakpoints right-click context-sensitive menu (see
Figure 3.17) for the following tasks:
119
Chapter 3 TIBCO Spotfire S+ Workbench Debug Perspective
•
Open the file and location for the selected breakpoint.
•
Enable the selected disabled breakpoint.
•
Disable selected breakpoint.
•
Remove the selected breakpoint.
•
Remove all breakpoints in the view.
•
Select all breakpoints in the view.
•
Copy the breakpoints to the clipboard.
Figure 3.17: The Breakpoints view displaying the right-click menu.
Working with
Working Sets
The Spotfire S+ Workbench provides tools to group and manage
project files and resources using working sets. Working set menus are
available in several Eclipse views, including the Breakpoints view.
For general information about using working sets, see the Eclipse
Workbench User’s Guide.
Console, Output, The Debugger perspective shares the Spotfire S+ Workbench
Console, Output, and Outline view. For more information about
and Outline
using these views, see:
views
The section Spotfire S+ Workbench Console on page 49
The section Spotfire S+ Perspective Views on page 68.
Profiler
120
The Workbench Profiler is composed of two views: the Function
Calls view and the Allocations view, which are available in the
Debug perspective. You can run the Profiler from either the Run
Debug Perspective Views
menu or from the Toggle Spotfire S+ Profiler button ( ), located
next to the Toggle Spotfire S+ Debugger button on the Spotfire S+
Workbench toolbar. (See Figure 3.2.)
Profiler Mode
To start profiling, first activate the Spotfire S+ profiler by clicking
Toggle Spotfire S+ Profiler toolbar item, by typing CTRL+ALT+P,
or by clicking Run Toggle Spotfire S+ Profiler on the menu.
Once the Profiler is activated, any expression you type in the
Console, or that you enter by clicking Run Spotfire S+ Code,
invokes the Profiler adds to the Function Call and Allocation views.
Profiler views
The Spotfire S+ Workbench Profiler includes two views to monitor
the system performance:
•
Function Calls view
•
Allocations view
These views are described in this section.
Function Calls
view
By default, the Function Calls view displays a function call tree that
reflects the engine's activity.
Figure 3.18: Function Calls view, tree display.
Alternatively, you can display the information in a tabular view by
either of the following methods:
•
Right-click the view, and from the menu, toggle Show
Function Tree
121
Chapter 3 TIBCO Spotfire S+ Workbench Debug Perspective
•
From the Function Call menu, toggle Show Function Tree.
Figure 3.19: Function Calls view, table display.
Function Calls menu
The Function Calls view menu displays the following options:
Table 3.8: Function Calls view menu options.
Allocations view
Menu option
Description
Show Function Tree
Toggle to show the function calls in a tree
view or in a tabular view. The tabular
format displays the total number of calls
and total duration of each function.
Refresh Function Calls
Forces an update of the function call tree or
table.
Reset Function Calls
Clears the function call tree or table.
Displays the number of allocations the engine has performed. It
breaks the allocations down into bytes and the basic Spotfire S+ data
types.
Allocations view menu
The Allocations view menu displays options to refresh or reset the
view, similar to the Function Calls view options. See Table 3.8 for
more information.
122
TIBCO SPOTFIRE S+
WORKBENCH TASKS
4
Introduction
125
Spotfire S+ Workbench Projects
Setting the Workspace
Workbench First View
Creating a Project
Setting the Spotfire S+ Workbench Preferences
126
126
127
128
137
Customized Perspective Views
148
Working Projects and Databases
Setting the Working Project
Changing Attached Databases
151
151
153
Spotfire S+ Project Files and Views
Creating a Script
Editing Code in the Script Editor
Running Code
Closing and Reopening the Project
156
156
157
163
167
Packages in the Workbench
Creating a New Package Project
Building the Package
Downloading Package Source Files from a Repository
Downloading a Binary Package from a Repository
Updating a Package from a Repository
168
168
170
172
174
176
Spotfire Statistics Services Remote Submissions
Submitting a Remote Job
Managing Data Files on Spotfire Statistics Services
Exporting a Package to Spotfire Statistics Services
178
178
184
186
Spotfire S+ Workbench Debugger Tasks
Kahan Example
188
188
123
Chapter 4 TIBCO Spotfire S+ Workbench Tasks
Opening the Debug Perspective
Launching the debugger
Setting breakpoints
Starting execution
Examining the call stack
Examining Variables and Expressions
Setting a Watch Expression
Stepping into, over, and out of a function
Examining Resource Usage
Examining Function Calls
124
188
189
190
192
193
194
195
197
199
199
Introduction
INTRODUCTION
This chapter provides the basic tasks that demonstrate using the
TIBCO Spotfire S+ Workbench. For information about basic Eclipse
IDE tasks, see the Eclipse Workbench User Guide.
This chapter includes:
General Spotfire S+ Workbench tasks, including:
•
Setting the Workspace, page 126
•
Quick Start, page 127
•
Setting the Spotfire S+ Workbench Preferences, page 137
•
Customized Perspective Views, page 148
•
Specifying Working Projects and Databases, page 151
•
Working with Spotfire S+ Project Files and Views, page 156
This chapter also includes tasks that introduce you to using the views
and features in the Spotfire S+ perspective. For more information, see
the section Spotfire S+ Workbench Projects on page 126.
Finally, this chapter includes tasks that introduce you to using the
views and features in the Debug perspective. For more information,
see the section Spotfire S+ Workbench Debugger Tasks on page 188.
125
Chapter 4 TIBCO Spotfire S+ Workbench Tasks
SPOTFIRE S+ WORKBENCH PROJECTS
Before you begin working with files in the Spotfire S+ Workbench,
you must set your workspace and then create a project.
Setting the
Workspace
When you first launch the Spotfire S+ Workbench, you are prompted
to supply the path to your Spotfire S+ workspace.
To set the workspace
1. In the Workspace Launcher dialog (Figure 4.1), specify the
directory location where the workspace .Data and .metadata
databases will be stored.
2. Indicate whether you want to be prompted in future sessions
to identify a workspace using this dialog.
Figure 4.1: The Workspace Launcher dialog.
Changing the
Workspace
You can switch to another workspace from within the Spotfire S+
Workbench user interface.
To open a different workspace in Spotfire S+ Workbench
1. Save your work, and then click File Switch Workspace.
2. In the Workspace Launcher dialog, provide the new
workspace location.
Note
When you switch workspaces during a Spotfire S+ Workbench session, the current session
closes, and a new session of Spotfire S+ Workbench starts, using the new workspace location.
126
Spotfire S+ Workbench Projects
3. After you set the workspace, open the workbench.
Note
®
®
On Microsoft Vista and Microsoft Windows 7 , you must be elevated to the role of
administrator to specify the default directory as C:\Program
Files\tibco\splus82\users\yourname; however, it is not recommended that you use this
directory. By default, the workspace directory is C:\Users\yourname\workspace.
Workbench
First View
When you launch the workbench the first time, notice the user
interface. If you haven’t familiarized yourself with the workbench
GUI or its customization, see the section Examining the Spotfire S+
Workbench GUI on page 31.
Figure 4.2: The blank workbench.
Quick Start
Notice that the Console view, in the lower part of the screen by
default, looks like the standard Spotfire S+ GUI console. You can
type and run commands in the Console view. See the section Spotfire
S+ Workbench Console on page 49 for more information.
An easy way to display the Script Editor is to type an Edit
command in the Console view. For example:
127
Chapter 4 TIBCO Spotfire S+ Workbench Tasks
Edit(myfunc)
opens the Script Editor with the beginnings of that function
definition. Alternatively, you can create a project or a new script file.
See the section Creating a Script on page 156 for more information.
Figure 4.3: Using Edit to open the Script Editor and create a function.
Creating a
Project
The Spotfire S+ Workbench project is a resource containing scripts
and associated files. You can use the project to control build, version,
sharing, and resource management. This section contains guidance
for creating a project in the workspace, adding a second project to a
workspace, adding a package project, and importing files into an
existing project.
Understanding
Project Options
Before you create a new project, consider the following scenarios, and
then review the Spotfire S+ Workbench options.
128
Spotfire S+ Workbench Projects
Table 4.1: Spotfire S+ Workbench project scenarios.
Scenario
Spotfire S+ Workbench Option
You are starting an empty
project with no existing files.
In the New Project wizard, specify a
project name and accept the default
project directory location.
(Note: This is the only way
to create a project that is
stored in your workspace.)
If your project is a package, navigate
through the wizard using the Next button.
In the Spotfire S+ Package tab, select
Create Spotfire S+ Package structure.
Click Finish.
Your project is created as a subdirectory
in the workspace directory. (The
Navigator view displays the .Data
directory and the .project resource but
no existing project files. Do not edit these
items.)
If your project is a package, the project is
created as a subdirectory in the
workspace directory, and the package
structure and required directories are
created, as follows:
•
.Data (Contains required
subfolders and files; do not edit
this directory.)
•
data
•
man
•
R
•
src
In addition, a stub DESCRIPTION file
is placed in the project directory and
informational README files are created
in each directory. For more information
on package directories, see the Guide to
Packages. For more information about
creating a package project, see the section
To create a package project on page 168.
129
Chapter 4 TIBCO Spotfire S+ Workbench Tasks
Table 4.1: Spotfire S+ Workbench project scenarios. (Continued)
Scenario
Spotfire S+ Workbench Option
You have one or more
project(s), and you want to
work with the files at their
existing location.
In the New Project wizard, specify a
project name, clear the Use default
check box, and then browse to the
location of the project files. Spotfire S+
Workbench works with the files at the
specified location. (The Navigator view
displays the .project resource and all files
in the project directory.)
If you are importing the source files for a
package, all of the required directories
and are included in the project.
Note that the project cannot overlap other
projects and cannot be located under
your workspace.
You have an existing
project, and you want to
copy selected files to a
workspace directory (for
example, in the cases where
the files are kept at a remote
location, are read-only, or
where you do not want to
work with the original files).
In the New Project wizard, specify a
project name and accept the default
project directory location. An empty
project subdirectory is created in the
workspace directory. You can then import
your project files. See the section
Importing Files on page 131 for more
information.
Based on the scenario that applies to your project needs, In the
following sections, create an empty project, and then import the
Census project files (the third scenario described above).
To create the example census project
1. Click File New Project.
2. In the New Project dialog, select Spotfire S+ Project. Click
Next.
3. Provide the friendly project name, “Census.”
4. Accept the option Use default. This option creates the
project directory in the default workspace location.
130
Spotfire S+ Workbench Projects
5. Leave Create Spotfire S+ Package Structure clear (the
default).
6. Click Finish to create the project.
Figure 4.4: New Project dialog.
Note
When you create a project, you see in the Navigator view the .project resource. This resource is
created by Eclipse and contains information that Eclipse uses to manage your project. You
should not edit this file.
Importing Files
In this exercise, import the Census example, one of the examples
provided with Spotfire S+.
To import files
1. With the Census project selected in the Navigator view, click
File Import.
2. In the Import Select dialog, expand the General folder, and
then select File system. Click Next.
131
Chapter 4 TIBCO Spotfire S+ Workbench Tasks
3. In the Import File system dialog, browse to the location of
the census project (by default, in your installation directory at
SHOME/samples/bigdata/census.)
4. Select the directory, and then click OK. The directory name
appears in the left pane, and all of the project’s files appear in
the right pane.
5. Select the folder name in the left pane to select all files, and
then click Finish to add the files to your project.
f
Figure 4.5: Import File System dialog for Census project.
Hint
You can select just the .ssc file to import if you prefer, because the script itself references the data
in these files. For the purposes of this part of the exercise, we import all files.
132
Spotfire S+ Workbench Projects
Figure 4.6 shows the Navigator with the Census project and
all its files.
Figure 4.6: Navigator showing Census project.
Note
Alternatively, you can copy files from a different location to your project directory in your
workspace. If you simply copy files, you must refresh the Navigator view to include the files in
your project and display them in the project file list. To refresh the view, right-click the project
name, and from the menu, click Refresh.
Loading a Library You work with Spotfire S+ code in the Workbench the same way you
work with it in other environments, such as the Java GUI, the
command line, or the Windows GUI. To load a library, in the
Console, simply call:
library(libraryname)
Where libraryname is the library to load.
For example, if you are working with Spotfire S+ packages, before
you get started, load the pkgutils library:
library(pkgutils)
Adding a Second
Project
In this exercise, create a project with the files for the Boston Housing
example at their existing location (the second scenario described
above), rather than importing the files into a workspace directory.
Boston Housing is an example provided in the Spotfire S+ sample
files, by default, in your installation directory at SHOME/samples/
bigdata/boston.
To add a project
1. Click File New Project.
133
Chapter 4 TIBCO Spotfire S+ Workbench Tasks
2. In the New Project wizard, select Spotfire S+ Project, and
then click Next.
3. In the Project name text box, type “Boston Housing,” and
then clear the Use default check box.
4. Browse to the location of the Boston Housing sample
directory, by default in the SHOME/samples/bigdata
directory of your Spotfire S+ installation. Select the boston
directory, and then click OK. Click Finish to add the project.
Figure 4.7: New Project dialog, using boston files at their installed location.
134
Spotfire S+ Workbench Projects
5. In the Navigator view, the Boston Housing project appears.
This directory contains all of the files in that sample directory
location.
Figure 4.8: Navigator containing two projects.
6. You won't be using this project for the remainder of this
tutorial section, so right-click the directory, and then select
Delete.
7.
In the Confirm Delete Project dialog, select Do not delete
contents. (Otherwise, you will delete the sample from your
installation directory.)
8. Click Yes to remove the project.
Copying Files
You can copy files from an existing project to a working project by
Between Projects copying their .ssc files from the original project to the working
project’s directory. Note that to see these files in your project, you
must refresh the view. To refresh the Navigator view, right-click the
project, and from the menu, click Refresh. (Restarting the Spotfire S+
Workbench does not automatically refresh the view.) Alternatively,
you can use the File Import menu command: Specify a file
system, browse to the original location of the desired file, and then
select only that file to import. (Importing a file into a project from
another location copies that file to the project folder in your
workspace.)
135
Chapter 4 TIBCO Spotfire S+ Workbench Tasks
Adding the
Sample
Debugging
Project
In this exercise, add another project, importing the sample files, as
you did in the section To create the example census project on page
130. This second project is the project you will use later in this chapter
to practice debugging tasks.
Follow the directions for creating a project on pages 130 to page 133,
but instead of importing the Census project, import the kahanSum
project, located in your installation directory at SHOME/samples/
kahanSum.
To add the kahanSum project
1. Click File New Project.
2. In the New Project dialog, select Spotfire S+ Project. Click
Next.
3. Provide the friendly project name, “kahanSum.”
4. Accept the option Use default. This option creates the
project directory in the default workspace location.
5. Click Finish to create the project.
6. With the kahanSum project selected in the Navigator view,
click File Import.
7.
In the Import Select dialog, select File system, and then
click Next.
8. In the Import File system dialog, browse to the location of
the census project (by default, in your installation directory at
/samples/kahanSum.)
9. Select the directory, and then click OK. The directory name
appears in the left pane, and all of the project’s files appear in
the right pane.
10. Click Select All, and then click Finish to add the files to your
project.
136
Spotfire S+ Workbench Projects
Figure 4.9 shows the Navigator with the kahanSum project
and all its files added to the workspace. (You will work with
this project later in this chapter.)
Figure 4.9: Navigator showing kahanSum project added to the workspace.
Setting the
Spotfire S+
Workbench
Preferences
General Options
Spotfire S+ provides customizations to the Eclipse IDE to
accommodate the specific needs of the Spotfire S+ programmer. You
can change the IDE to suit your development style, including adding,
removing, and repositioning the views, and setting the preferences.
•
To review the preference options in the Preferences dialog,
see the section Examining Spotfire S+ Preferences on page 14.
•
To review the views available in the Spotfire S+ Workbench,
see the section Examining the Spotfire S+ Workbench GUI
on page 31.
•
To learn more about customizing the views in the Spotfire S+
Workbench, see the section Customized Perspective Views on
page 148.
This section demonstrates setting specific preferences in the
Preferences dialog.
To set text editor options
1. On the Window menu, click Preferences.
137
Chapter 4 TIBCO Spotfire S+ Workbench Tasks
2. In the Preferences dialog, select General, and then click
Editors Text Editors.
3. Review the options, including tab width (by default 4), line
numbers (by default displayed), and appearance color options
(by default, the system colors). You can set additional options
in the Spotfire S+ Editor options dialog. See Figure 4.14
for an example.
To examine file association preferences
4. In the Preferences dialog, select General, and then click
Editors. Examine the dialog pages.
5. Click File Associations and review the file types that the
Script Editor recognizes.
Figure 4.10: File Associations page.
Spotfire S+ View
Preferences
138
The previous section demonstrated setting Eclipse general
preferences that the Spotfire S+ Workbench takes advantage of. The
following sections demonstrate setting preferences specific to the
Spotfire S+ Workbench views. These preferences include general
Spotfire S+ Workbench Projects
Spotfire S+ preferences, preferences for the Console and the
Output, preferences for the Output, and preferences for defining
task tags.
To set the Spotfire S+ preferences
1. Click Spotfire S+.
2. Review the options. Make sure the bigdata library loads on
startup: check the check box Run code on startup. (The
Census example demonstrated in this chapter uses the
bigdata library.)
3. Optionally, select Send Output from Run Action to
Console, if you want your script output to appear in the
Console rather than the Output.
Figure 4.11: Spotfire S+ Preferences page.
To store the console history between sessions
1. In the left pane tree view, click Spotfire S+ to expand, and
then click Console to display that page.
139
Chapter 4 TIBCO Spotfire S+ Workbench Tasks
2. In the Console page, select Store Console History
between sessions. You can use this setting to persist the
contents of the History to use later in the Console. For more
information about storing the console history and using it in
the output, see the section Console Options on page 18.
3. Optionally, change the input and/or output color or font to a
color or font of your choice. For more information about
these options, see the section Font Settings on page 19.
Figure 4.12: Console page.
140
Spotfire S+ Workbench Projects
To add text with a user-defined h
ighlight color
1. In the left pane tree view, under Spotfire S+, click Editor to
display that page.
2. In the Editor dialog, in the Syntax Highlighting list box,
select User, and then click Choose Color.
3. In the Color dialog, select a color, and then click OK.
4. In the User Tokens area, click New.
5. In the Add Desired Spotfire S+ Text dialog, select Comma
Separated Text. In the text box, type census, and then click
OK.
Figure 4.13: Add Desired Spotfire S+ Text dialog.
6. Note that census appears in the User Tokens list box. Click
Apply. In later exercises, when you manipulate the Census
project, you will see the string you selected highlighted in the
color you specified. You can add other user-defined terms,
including Spotfire S+ commands or the contents of a comma-
141
Chapter 4 TIBCO Spotfire S+ Workbench Tasks
separated file and see how it makes tracking these items
through your code easier. For more information about this
option, see the section Syntax Highlighting on page 21.
Figure 4.14: Editor page with census added as highlighted user text.
To add the contents of a comma-separated file
1. Open a text editor, such as Notepad.
142
Spotfire S+ Workbench Projects
2. Type some terms to highlight, separated by commas. For
example, if you want to highlight in your code every time the
data viewer or a graph opens, type bd.data.viewer, hist,
xyplot, bwplot, histogram, and so on.
3. Save the file with a convenient name and to a convenient
location (for example, C:\terms.txt).
4. Return to the Spotfire S+ Workbench Editor preferences
dialog, and, in the User Tokens area, click New.
5. In the Add Desired Spotfire S+ Text dialog, select Comma
Separated File.
6. Either type the file path, or click Browse and browse to the
file location.
7.
Click OK, and notice that all of the terms in the file are added
to the User Tokens list. Figure 4.15 shows the User Tokens
list with the terms added from the file.
Figure 4.15: User Tokens list displaying the contents of a file.
To add a Spotfire S+ command to the User Token list
1. In the User Tokens area, click New.
2. In the Add Desired Spotfire S+ Text dialog, select Spotfire
S+ Command.
3. In the Spotfire S+ Text to Highlight box, type the Spotfire
S+ command objects().
143
Chapter 4 TIBCO Spotfire S+ Workbench Tasks
4. Click OK, and notice that all of the objects in the working
project are added to the User Tokens list. Figure 4.16 shows
the updated User Tokens list.
Figure 4.16: User Tokens list displaying working project objects.
To remove items from the User Tokens list, select them and click
Remove.
To change the code formatting options
1. In the Spotfire S+ Editor options page, review the Spotfire S+
Format Options group.
2. Select Use spaces for indentation, and notice how the
example display changes to reflect the default 4. Clear this
option, if you choose, or change the default to add more or
fewer indentation spaces.
3. Change some of the other formatting options to suit your
programming style, and then click Apply to apply any
changes to the editor.
To add a function to watch
1. In the left pane tree view, click Outline to display that page.
2. Click New.
144
Spotfire S+ Workbench Projects
3. In the Add New Function to Watch dialog, add set.seed.
Click OK.
Figure 4.17: Add New Function to Watch dialog with set.seed .
4. Review the list in the Functions to Watch dialog. Note that
set.seed has been added to the list. (Later, when you are
working with a project that uses the set.seed function, you
can see its display in the Outline view has a special icon.) For
more information about this option, see the section Functions
to Watch on page 23.
Figure 4.18: Outline page with set.seed added.
145
Chapter 4 TIBCO Spotfire S+ Workbench Tasks
To add a task to the Task Tags options
1. In the left-pane tree view, click Task Tags.
2. Click New to display the Add New Task Type dialog.
3. In the Task Name box, type a name for a new task to watch.
Set the severity to your preference, and click OK to add the
task.
Figure 4.19: Add New Task Type dialog.
4. Highlight the items to change in the Spotfire S+ Task
Options text box, or, using the New, Remove, Up, and
Down buttons, edit the available tasks. In the Script Editor,
146
Spotfire S+ Workbench Projects
when you type this term, prefaced with a comment character
(#), the line is added to the Tasks view with the severity you
indicate for the custom tag.
Figure 4.20: Task Tags page with a new task added.
5. Click OK or Apply to save your changes, or click Restore
Defaults to return the task options to their default state.
6. Click OK to save your changes.
147
Chapter 4 TIBCO Spotfire S+ Workbench Tasks
CUSTOMIZED PERSPECTIVE VIEWS
The layout of the Spotfire S+ perspective presents the Navigator
view, Outline view, Statistics Services view, and History on the left
side of the window. The Console, Objects, Search Path, Output,
Tasks view, and Problems view are tiled across the bottom of the
window. The Script Editor pane is empty.
Note
If you do not see one of the following Spotfire S+ specific views in the user interface, you can
display it from the menu by clicking Window Show View Other, and then selecting it
from the Show View list.
To customize the Spotfire S+ perspective
1. Click the Outline view tab and drag the view beside the
Navigator view. The Outline view now tiles with the
Navigator view.
2. Click the History tab and drag the view to the right; it now
tiles with the other views.
3. Right-click the Tasks view tab and select Fast View. The
Tasks view minimizes and appears as an icon in the window’s
status bar.
148
Customized Perspective Views
4. Click the Output tab to select it.
Figure 4.21: Customized Spotfire S+ perspective.
5. Click Window Save Perspective As.
6. In the Name box, type “Sample Exercise,” and then click
OK.
The Sample Exercise perspective button appears on the toolbar:
Figure 4.22: Sample exercise perspective button.
To change the displayed views
1. To change the views, or to display the list of available views,
on the menu, click Window Show View.
2. From the submenu, select the view to display.
149
Chapter 4 TIBCO Spotfire S+ Workbench Tasks
Alternatively, if you do not see the view you want to display,
from the Show View menu, click Other, and then select a
view from the Show View dialog. For example, if you want
to display a view that is typically in the Debug perspective,
expand Debug, and then select a view from the list.
Figure 4.23: Show View dialog.
•
If the view is not currently visible in the UI, selecting it
displays the view and gives it focus in the UI.
•
If the view is available, selecting it gives it focus in the UI.
To return to the Spotfire S+ perspective default
1. Click the perspective button to the left of the Sample
Exercise button, and then click Other.
2. In the Select Perspective dialog, select Spotfire S+, and
then click OK. The perspective returns to its previous layout.
You can select other views to display in your perspective.
150
Working Projects and Databases
WORKING PROJECTS AND DATABASES
This section describes setting working projects and changing
databases.
The Spotfire S+ Workbench provides the following ways you can
store your data objects:
•
In the working project .Data, where the objects are available
only to the project.
•
In the workspace .Data, where the objects are available to all
projects in the workspace.
You can change the .Data storage option at any time by setting any
project in the workspace as the working project, or toggling off the
working project option and writing data objects to the workspace
.Data database.
Setting the
Working
Project
When you create a workspace, a .Data database is created in the
workspace, and (after you refresh the view) the workspace path
appears in the first position in the Search Path, as shown in Figure
4.24. If you specify no working project, the Spotfire S+ Workbench
writes data objects to the workspace .Data database, and the objects
in that .Data database are available to all projects in the workspace.
Figure 4.24: Search Path with first position set to the workspace.
When you create a project and import project files, the Spotfire S+
Workbench creates a .Data in the project, sets it as the working
project, and sets the project in the first position in the Search Path.
Any objects created are added to the working project’s .Data
database.
151
Chapter 4 TIBCO Spotfire S+ Workbench Tasks
To set the working project
1. Select the project to set as the working project.
2. From the main menu, click File Toggle Working Spotfire
S+ Project. (Alternatively, in the Navigator, right-click the
project that you want to set as the working project, and from
the context sensitive menu, click Toggle Working Spotfire
S+ Project.) Figure 4.25 shows the context menu.
Figure 4.25: Toggle Working Spotfire S+ Project on the Navigator contextsensitive menu.
152
Working Projects and Databases
The selected project is displayed as the working project. Any
objects you create are stored in the Census .Data database
until you choose another project as the working project, or
toggle off the working project, so the workspace .Data is the
database.
Figure 4.26: Census set as the working project.
Changing
Attached
Databases
Adding a
Database
Spotfire S+ recognizes libraries, modules, lists, and directories as
legitimate object databases. You can add and detach any of these
types of databases to the Search Path.
By default, the Search Path displays the full path of the working
database and all of the attached Spotfire S+ data libraries. Objects
existing in a recognized active database appear in the Objects.
Objects in an added database appear in Objects when you refresh the
view to that database. See the section Examining Objects on page
160.
To add a library
1. Right-click the Search Path.
2. From the right-click menu, click Add Library.
3. In the Attach Library dialog, type MASS. Clear the Attach
at top of search list check box to indicate that you want add
the library to the bottom position.
153
Chapter 4 TIBCO Spotfire S+ Workbench Tasks
4. Click OK and examine the Search Path for the change.
Figure 4.27: Attach Library dialog.
To add a module
1. From the right-click Search Path menu, click Add Module.
2. In the Attach Module dialog, provide an installed module
name and indicate whether to add it to the first position.
3. Click OK and examine the Search Path for the change.
To add a directory
1. Right-click the Search Path.
2. From the menu, click Attach Directory.
3. In the Attach dialog, in the Directory to attach text box,
browse to the directory location.
4. In the Label text box, type Projects
5. In the Position text box, type 4.
6. Click OK and examine the Search Path. The label you
provided should appear at position 4.
Detaching a
Database
From the Search Path, you can detach a database from your current
session.
To detach a database
1. In the Search Path, right-click bigdata.
2. In the right-click menu, select Detach.
3. Examine the Search Path. The Big Data library is no longer
attached.
154
Working Projects and Databases
Refreshing the
View
When you refresh the view, any changes to the Search Path that
have not been reflected in a recent change are displayed. For
example, if you add a library by calling the load function in a Spotfire
S+ script, the change is not immediately displayed in the Search
Path.
To refresh the view
1. Using the Console, reattach the Big Data library. In the
Console, type
library(bigdata, first = T)
2. Right-click the Search Path.
3. In the right-click menu, click Refresh. Notice that the Big
Data library appears as attached in the first position (position
2).
155
Chapter 4 TIBCO Spotfire S+ Workbench Tasks
SPOTFIRE S+ PROJECT FILES AND VIEWS
The Spotfire S+ Workbench recognizes *.ssc, *.q, *.r, and *.t files, all
file extensions common in Spotfire S+ code.
Creating a
Script
You can create a new Spotfire S+ script file, or you can import an
existing script file. The following two examples demonstrate both
techniques.
To create a new script file
1. Click File New Other.
2. In the Select a wizard dialog, select Spotfire S+ Script.
Click Next.
3. In the New File dialog, select the parent directory (the
Census project directory)
4. In the File name text box, type Sample.ssc.
5. Click Finish to create the file.
We won’t work with this file for this exercise, so you can either
disregard the file, or delete it from your project. Alternatively, you
can open the file, add some Spotfire S+ code, and save it in the
project.
Viewing Project
Files
The Navigator view displays the project files. In Windows, if you
have Microsoft Excel installed, you can open a CSV file in an
external window. In this project, only the files identified in Windows
Preferences in the File Extensions page open in the Script editor.
Removing files
from a project
Because the project script imports the data in the files from their
installation directory in Spotfire S+, you don’t need to have them all
in the project. However, removing an imported file deletes it from
your project directory, so remove individual files with care.
To remove a file from the Census project
1. In the Navigator view, open the Census project and select all
files except the .project file and census.demo.ssc.
2. Right-click the selected files, and then click Delete.
156
Spotfire S+ Project Files and Views
3. In the Delete Resources dialog, click Yes to remove the files
from the project. The Navigator view should now just
display the Census Project directory, the project file, and
census.demo.ssc:
Figure 4.28: Navigator view after deleting files
Editing Code in
the Script
Editor
The Spotfire S+ script is a text file that you can edit in the Script
Editor. In this exercise, just edit census.demo.ssc using the menu
items provided specifically for Spotfire S+.
To edit script code
1. In the Navigator view, double-click the file census.demo.ssc
to open it in the Script Editor and examine the script. Note
that:
•
The comment text appears in the Script Editor as green.
(You can change this default color in the Preferences
dialog. See the Eclipse Workbench User Guide and the
section Setting the Spotfire S+ Workbench Preferences on
page 137 for more information.)
•
Note that the term census appears in the color you
specified in the section To add text with a user-defined h
on page 141.
•
The line that has focus appears highlighted.
•
The line numbers appear to the left of the script text.
157
Chapter 4 TIBCO Spotfire S+ Workbench Tasks
2. In the second line of the file, press Enter to insert a carriage
return, and then begin typing a function name (for example,
library).
Figure 4.29: Code completion for the library function.
Note that as you type each character, the code completion
feature displays the function names using the character string
so far. (The code completion feature reads the Search path on
startup and displays functions from all loaded libraries. It
refreshes the list periodically.) When you see the function
name you want to use, select it from the code-completion list
and press Enter to insert it into the text editor.
Note
The code completion feature works in both the Script Editor and the Console.
3. Type the open parenthesis character, (. Code completion
displays the function’s arguments. (The arguments are
displayed until you type the closing parenthesis character.)
Figure 4.30: Code completion shows arguments for the function.
4. Delete the line you just inserted (it is not needed for the rest of
this example).
5. Scroll to the line containing the following text (around line
16), and and highlight the line and the next line:
"/samples/bigdata/census/census.csv", sep=""),
stringsAsFactors=F, bigdata=T)
158
Spotfire S+ Project Files and Views
6. Click Spotfire S+ Shift Left. The code shifts to the left.
7.
Click Spotfire S+ Format. This command formats the
entire script. Note that the formatting change you made in the
previous step has been reverted. Also note that the line
numbers for formatted functions are highlighted.
Hint
The line numbers for any line changed in your script are highlighted until the next time
you save your work.
8. Click Spotfire S+ Toggle Comment to add a comment
character. Notice that the script text color changes to indicate
that the line is no longer a comment.
9. Repeat step 6, or type
comment.
CTRL+SHIFT+#
to remove the
To edit a function definition
1. In the Script Editor, select the function whose definition you
want to edit.
2. Press the ctrl key and click the function again.
3. The function definition opens in a temporary file in the Script
Editor.
Alternatively, you can open a function for edit by right-clicking the
function name, and from the menu, click Find “functonname”. Find
searches files currently open in the Script Editor, then files in the
working project, and finally in the Spotfire S+ database for the
function definition.
Note
Any code changes you make in an editor are not recognized by Spotfire S+ until you source the
code.
To find all references to a function
1. Right-click the function whose references you want to find.
159
Chapter 4 TIBCO Spotfire S+ Workbench Tasks
2. From the menu, click Find References.
3. Review the results in the Search view. Figure 4.31 displays
the results of running Find References on the function hist
in the Census project.
Figure 4.31: The Search view after running Find References on hist.
Examining the
Outline
The Outline view displays all of the items (objects, functions, and so
on) that are contained in the open script. Outline view is not editable.
To examine the outline
1. Examine the objects that appear in the Outline view. Note
that set.seed appears with a yellow arrow next to it, because
in the section Setting the Spotfire S+ Workbench Preferences
on page 137, you indicated that set.seed was a function to
watch.
2. Scroll through the Outline view list and highlight an object.
Note that the Script Editor scrolls to, and highlights, the line
where the object appears.
Examining
Objects
160
When you start a new workspace, the Objects is not populated.
Spotfire S+ Project Files and Views
Details about your project’s objects (and all objects in your database)
will appear in the Objects. Objects is not editable; however, you can
refresh the contents, delete objects, or change the view to another
attached database. To refresh the view, right-click the Objects and
click Refresh.
To examine the objects
1. Select the Objects tab to display the objects and their details.
By default, the objects are displayed sorted by name.
2. Right-click the Objects table pane and, in the contextsensitive menu, click bigdata. The Big Data library objects
are displayed in the Objects. (It might take a few moments to
display all of the objects.)
3. Re-sort the objects by any property displayed in the Objects
by clicking the property’s column title.
To display hidden objects
1. In the Objects, right-click the table pane to display the
context-sensitive menu.
2. Examine the menu. Note that, by default the Spotfire S+
system objects are hidden.
3. On the menu, click Hide Spotfire S+ System Objects to
clear the selection.
4. Examine the Objects table pane and tree view pane to see the
Spotfire S+ system objects in your project.
To select another object database
1. Right-click the Objects and, in the right-click menu, click
your current working directory (the directory at the top of the
list). The project objects are displayed in the Objects. (It
might take a few seconds to display all of the objects.)
Adding a Task to The Tasks view displays outstanding project tasks. As discussed in the
section Setting the Spotfire S+ Workbench Preferences on page 137,
A Script
the indicators for task levels are stored in the Preferences dialog.
(Click Windows Preferences to display them.) You can add a task
in one of two ways:
•
Add the task directly to the Tasks view.
161
Chapter 4 TIBCO Spotfire S+ Workbench Tasks
•
Add the task to the script file.
To add a task directly to the Tasks view.
1. Click the Tasks view tab to display its contents.
2. Right-click the view, and then click Add Task.
3. In the Add Task dialog, provide the description and priority
level of the task.
Figure 4.32: Add Task dialog.
4. Click OK to save and display the new task.
Figure 4.33: A generic task in the Tasks view.
A task added directly to the Tasks view displays a check box (for
marking the task complete) in the Tasks view’s first column. It does
not display a reference to a resource, a directory, or a location.
162
Spotfire S+ Project Files and Views
To add a task in the script file
In the script file, select a blank line.
1. Type the following text:
#FIXME: Change this section.
2. Save the script file.
Note that the FIXME comment appears in the Tasks view as
a high-level task, with a red exclamation mark in its second
column. The task also displays information about its resource,
directory, and line location. You can go directly to any task in
your script by double-clicking it in the Tasks view.
Figure 4.34: A FIXME task in the Tasks view.
3. In the Script Editor, change the level of the task by changing
FIXME to TODO and save the file. Note that the
exclamation mark disappears, and the task becomes a normal
level task.
Running Code
You can run your Spotfire S+ script code directly from Eclipse in two
ways, which are described in the following section.
163
Chapter 4 TIBCO Spotfire S+ Workbench Tasks
Script Running
Options
The Spotfire S+ Workbench provides the following customized
solutions for running your scripts from either the Spotfire S+
perspective or the Debug perspective.
Table 4.2: Script Editor options for running code.
Copying Script
Code to the
Console
Option
Description
Copy to Console
Available from the right-click menu in the Script
Editor and from the Spotfire S+ menu, this
option copies the selected code and pastes it into
the Console. See the section Copying Script Code
to the Console on page 164.
Run Spotfire S+
Code
Available from the Run menu, by pressing F9, on
the toolbar, and from the right-click menu in the
Script Editor. This option runs the selected code
(or all code, if none is selected), and then displays
output in the Output. See the section Running
Code and Reviewing the Output on page 166 for
more information.
Run Current File
Available from the Spotfire S+ menu. This
option runs the file that is open.
Run Next Spotfire
S+ Command
Available from the Run menu and from the
Spotfire S+ Workbench toolbar. This option runs
the currently selected S expression or, if the cursor
is not exactly on an expression, the next
expression.
The Console is an editable view (in other words, you can type
commands and run them by pressing ENTER); therefore, when you
copy script contents to the Console using Copy and Paste actions,
you must include the line return, or the script will not run. This
behavior is consistent with the Spotfire S+ Commands window, in
the Spotfire S+ GUI, which also requires a line return to run code.
Also like the Spotfire S+ Commands window, the Console
concatenates the code that runs throughout your Spotfire S+
Workbench session, so you can review and save it.
164
Spotfire S+ Project Files and Views
To run copied script code
1. From within the Census project’s script, select lines 1 - 13 in
the script. Be sure to select the line return at the end of line 13.
2. Right-click the code and click Copy to Console. The selected
code is copied immediately to the Console and runs. You do
not need to paste it in the Console.
3. Repeat steps 1 and 2 for lines 15-18.
4. Finally, repeat steps 1 and 2 for a few more lines.
(You can select all of the code, but if you do so, it appears in
the History as one line. By following the steps above, the
History reflects the three different calls to run the code. See
the section Examining the History on page 165 for more
information.)
Copying Script
Code from the
Console view
Examining the
History
You can select and copy code from the Console.
•
To copy just code, select the code in the console that you want
to copy, right-click the Console, and from the menu, click
Copy.
•
To copy code and the prompts (> and +) in the Console, set
the Window Preferences option Include Prompts in
Copy action on the Console/Output page. After you set this
option, any lines you select and copy using the right-click
Copy action includes both code and prompts.
•
To copy the entire contents of the Console, right-click the
view, and on the menu, click Select All, and then right-click
again and select Copy.
This exercise uses the script code run in the section Copying Script
Code to the Console on page 164.
The History reflects the code run in the Console. Note that the
History displays each selection you make, even if it is more than one
command, on one line, and if the line extends beyond about 50
characters, the History displays an ellipse (...) to indicate more code.
To display each line of code in the History, you must run the lines
individually.
165
Chapter 4 TIBCO Spotfire S+ Workbench Tasks
To examine the history
1. To examine and rerun code from the History.
2. Click the History tab to give it focus.
3. Right-click the first line of code, and click Select input. The
code is copied to the Console. You must return to the
Console and press ENTER to run the code.
(Alternatively, double-click the code in the History to copy it
to the Console and run it.)
You can scroll through the individual entries in the History; as you
scroll, the selection appears in the Console. To run a selected item,
switch from the History to the Console and press ENTER at the end
of the code line.
Running Code
and Reviewing
the Output
You can run code directly from the Script Editor by using the Run
Spotfire S+ Code feature.
To run code
1. Select the Output tab.
2. In the Script Editor, select the code to run (or, to run the
whole script, select nothing), and press F9, or on the toolbar,
click RunSpotfire S+ Code.
The Output displays the run code and any Spotfire S+
messages.
To run the current expression
•
Fixing Problems
in the Code
On the Spotfire S+ toolbar, click Run Next Spotfire S+
Command. The currently-selected S expression runs, and the
next expression is selected. (If the cursor location does not
match an expression exactly, the next expression is evaluated.
Introduce a programmatic problem in the script to examine the
results in the Problems view.
To examine problems
1. In the Script Editor, on line 13 of the script, remove the
closing parenthesis.
166
Spotfire S+ Project Files and Views
2. Save the file. Note that the Problems view tab shows bold
text.
3. Click the Problems view tab to display the view.
4. Click the problem description. Note that the Script Editor
highlights the line where the code is broken.
5. In the Script Editor, replace the missing parenthesis and save
your file. Note that the problem disappears from the
Problems view.
Closing and
Reopening the
Project
The Spotfire S+ Workbench maintains a list of your projects in the
Navigator view, even after you close all associated files.
To close the project
1. Select the project to close.
2. Right-click the Navigator view and, from the menu, click
Close Project.
3. Examine the Objects and note that it still displays project or
workspace objects.
To reopen the closed project
1. Select the project.
2. Right-click the Navigator view and, from the menu, click
Open Project.
In the next section, examine the Debug perspective using a different
example, creating a new project. You can close the Census project at
this point, if you choose.
167
Chapter 4 TIBCO Spotfire S+ Workbench Tasks
PACKAGES IN THE WORKBENCH
The Spotfire S+ Workbench supports creating or using Spotfire S+
packages by providing a simple mechanism to:
Creating a New
Package
Project
•
Create a package project structure that includes all required
files and folders.
•
Find and install either package source files or binary files from
either the CSAN Web site (http://spotfire.tibco.com/csan)
or other repository.
•
Update either the source files or binary packages from either
the CSAN Web site or other repository.
•
Export a package to a specified repository, either as a source
or a binary package.
In this exercise, create a project for the soundex example, which is
described in the Guide to Packages.
To create a package project
1. If you have not already done so, install the package utilites.
install.pkgutils()
2. Click File New Project.
3. In the New Project dialog, select Spotfire S+ Project. Click
Next.
4. Provide the friendly project name, “Soundex.” Accept the
option Use default location. This option creates the project
directory in the default workspace location.
5. Select Create Spotfire S+ Package Structure.
6. Click Finish to create the project.
To create the package project structure, the wizard loads the
pkgutils library (if it is not loaded already), and then it calls
package.skeleton .
7.
168
Click File New Other, and in the New dialog, select
Spotfire S+ Script. Click Next.
Packages in the Workbench
8. In the New File dialog, select Soundex/R as the parent
folder, and in the File name box, type soundex.ssc.
9. Click Finish.
10. In the Script Editor, define the soundex function:
"soundex"<function(x) {
base <- gsub("[^A-Z]", "", toupper(gsub
("^.*[ \t]",
"", gsub("[ \t]*$", "", x))))
basecode <- gsub("[AEIOUY]", "", gsub("[R]+", "6",
gsub("[MN]+", "5", gsub("[L]+", "4",
gsub("[DT]+", "3", gsub("[CGJKQSXZ]+", "2",
gsub("[BFPV]+", "1", gsub("[HW]", "", base))))))))
sprintf("%4.4s", paste(substring(base, 1, 1),
ifelse(regexpr("^[HWAEIOUY]", base) == 1,
basecode, substring(basecode, 2)),
"000", sep = ""))
}
11. Save the file.
12. Run the function by selecting the code in the Script Editor
and clicking Run.
13. Repeat Step 7, this time creating a script file named
sample.surnames.ssc
14. In the Script Editor, create the following object:
sample.surnames <- c("Ashcroft", "Asicroft",
"de la Rosa", "Del Mar", "Eberhard",
"Engebrethson", "O’Brien", "Opnian", "van Lind",
"Zita", "Zitzmeinn")
15. Save the file, and then instantiate the object by selecting the
code in the Script Editor and clicking Run.
16. In the Console, call the soundex function, passing in the
sample.surnames object:
soundex(sample.surnames)
17. Create the soundex .Rd file:
169
Chapter 4 TIBCO Spotfire S+ Workbench Tasks
prompt.Rd(soundex)
(Refresh the Navigator view to display the new .Rd file.)
Note that you are prompted to edit the file and save it to the
appropriate directory (that is, the man directory).
Figure 4.35: The Soundex project with the newly-created stub soundex.Rd.
18. Move soundex.Rd from the top level of the project to the
man subdirectory.
Figure 4.36: The new Soundex project.
To build this package, either as a source or a binary package.
Building the
Package
After you have created the package, you can build it using the export
wizard available from the Export menu option.
To build the package
1. Select the Soundex package project.
2. On the menu, click File Export.
170
Packages in the Workbench
3. In the Export dialog, expand the Spotfire S+ folder and
click Spotfire S+ Package. Click Next to display the Export
Spotfire S+ Package dialog.
Figure 4.37: Exporting Soundex as a binary package.
4. Select either Build Source Package or Build Binary
Package.
5. In Export Location, specify the location to place the built
package. Click Finish to build.
6. Browse to the export location to see the results.
Notes
There are additional options for building and testing packages. For more information, see the
Spotfire S+ Guide to Packages.
If you have access to TIBCO Spotfire Statistics Services and you want to deploy a package to be
used on the server, you can upload your package from the Spotfire S+ Workbench. See the
section Exporting a Package to Spotfire Statistics Services on page 186.
171
Chapter 4 TIBCO Spotfire S+ Workbench Tasks
Downloading
Package
Source Files
from a
Repository
You can download the source files of an existing package, either from
the CSAN Web site or from another repository.
•
On Windows, you can use the source as a template for
another package, for example, or to just examine the code.
•
On UNIX and Linux systems, download the source to
view the source, install a package, or install and load a
package.
®
®
To download package source files
1. From the menu, click Spotfire S+ Find Packages.
2. If you are using UNIX, your option for Type is source only. If
you are using Windows, select Source.
3. In the Find Packages dialog, select Source, and accept the
default repository (http://spotfire.tibco.com/csan).
(Note that you must have an Internet connection to see the
packages stored at CSAN.)
4. From the list, select the discreteChoice package.
5. Review the remaining dialog contents (note that you can
select a package from a local repository, if you have any
stored locally). Accept the default Project Directory (your
workspace). Click OK to download the package source.
Note
Find Packages finds built packages only (that is, those that are zipped or tarballed); it does not
load unbuilt package directories and their files, even from a local directory.
To open a package to build, open it as a new project, and then build it using Export > Spotfire
S+ Package, and then install it.
You have downloaded the source successfully. The package project
appears in the Navigator view, where you can perform any or all of
the following tasks to examine it.
•
172
Expand the file structure and open the code files in the R
folder to examine the code. (Note that the source files for this
package were created using the .q extension.)
Packages in the Workbench
•
Expand the man folder and examine the .Rd files (the source
Help files).
•
Expand the data, inst, src, and test folders to see the
additional files that are included to support this package (the
package’s data sources, reference PDF, C++ code, and test
files, respectively. For more information about these folders,
see the Spotfire S+ Guide to Packages.).
•
Toggle to the package as the working project to add the
library to your Search Path. (Click File Toggle Working
Spotfire S+ Project.)
Figure 4.38: The Search Path after setting discreteChoice as the working project.
173
Chapter 4 TIBCO Spotfire S+ Workbench Tasks
•
Instantiate the objects to see them in the Objects view.
Figure 4.39: discreteChoice package source, imported into the Spotfire S+
Workbench.
Downloading a
Binary Package
from a
Repository
If you are working with Microsoft Windows, you can copy binary
packages from a specified repository using the Find Packages dialog.
Note
If you have installed the source from the section To download package source files on page 172,
you must delete the project before downloading the binary package.
To download binary packages
1. From the menu, click Spotfire S+ Find Packages.
2. For Type, select Binary (the default; for Windows only. For
UNIX, Type displays only Source).
174
Packages in the Workbench
3. Accept the default repository
(http://spotfire.tibco.com/csan).
(Note that you must have an Internet connection to see the
packages stored at CSAN.)
4. From the list, select the discreteChoice package.
5. For Install Options, select Install Binary + Load.
Note
When you select Install Binary + Load, Spotfire S+ loads the library with the first argument
set to False (that is, the library is not installed in position 2 in the search path). if you want the
library in position 2, select Install Binary, and then, in the Console, call
library(discreteChoice, first=T).
6. Review the remaining dialog contents (note that you can
select a package from a local repository, if you have any
stored locally). Accept the default Project Directory (your
workspace). Click OK to install and load the binary package.
When the binary package loads successfully, the Workbench displays
the following message:
The downloaded packages are in
C:\DOCUME~1\username\LOCALS~1\Temp\di000B70.tmp\downloaded_
packages
Welcome to the discreteChoice library. For additional
information see discreteChoice.pdf in C:\Documents and
Settings\username\Application
Data\tibco\splus82_WIN386\library/discreteChoice
Note that some examples in this package use functions from
the lowDiscrepancy package
175
Chapter 4 TIBCO Spotfire S+ Workbench Tasks
Open the Search Path to see that the library appears in your search
path:
Figure 4.40: discreteChoice in the search path.
Updating a
Package from
a Repository
If you have a downloaded a package, and a newer version is available
from a repository, you can find the newer version using the Update
Package option. The Update Package dialog shows only packages
that differ from the versions that you currently have; otherwise, the
list is empty.
Figure 4.41: Update Packages dialog.
176
Packages in the Workbench
To update a package
1. From the menu, click Spotfire S+ Update Packages.
2. On Windows, in the Update Packages dialog, select the type
(either Source or Binary). UNIX updates only source
packages.
3. Select the repository where the newer package exists.
4. From the list, select the package to update, and then select the
Install Options:
•
Install Binary
•
Install Binary + Load
•
Copy Source to Project Directory
177
Chapter 4 TIBCO Spotfire S+ Workbench Tasks
SPOTFIRE STATISTICS SERVICES REMOTE SUBMISSIONS
By default, the Spotfire S+ Workbench displays the Statistics
Services view. To use this feature, you must have access to Spotfire
Statistics Services, a TIBCO service that you can use to run jobs on a
remote S-PLUS engine. See your server adminsitrator for more
information.
This section walks through
•
Adding a new connection to Spotfire Statistics Services.
•
Connecting to an existing Spotfire Statistics Services server.
•
Submitting a job.
•
Examining the contents of the resulting job’s folder.
•
Scheduling a job.
•
Monitoring jobs.
•
Uploading a package.
•
Deleting a package.
For a description of the menu items and dialogs for this feature, see
the section Statistics Services view on page 76.
Submitting a
Remote Job
In the following example, send a job to Spotfire Statistics Services.
First, add a connection to the server. Then practice disconnecting
and reconnecting. Create a simple project with a script and send it to
Spotfire Statistics Services. Examine the results.
To add a connection
1. On the Spotfire Statistics Services view toolbar, click Add
Connection ( ).
2. In the dialog Add Service Connection, provide a friendly
name, a server URL, and your user credentials (name and
password). You are required to provide a password only if
authentication is enabled on the server. Note that your
password is persisted only for the duration of the current
Workbench session, and you must provide your credentials
178
Spotfire Statistics Services Remote Submissions
for subsequent Workbench sessions. (Alternatively, you can
provide your password in the selected Service Properties
dialog prior to connecting.)
The server URL contains the server name, port number, and
“SplusServer” (for example,
http://myserver:8080/SplusServer).
The default port is 8080. See your server administrator if you
do not know your exact server address.
Figure 4.42: Add Server Connection dialog.
3. Click Submit to add and connect to the server. Note that the
service name you supplied appears in the Statistics Services
view, with a folder icon decorated with a green check,
indicating the service is connected. ( )
For more information about completing the dialog, see the section
Add Service Connection on page 83.
To disconnect and connect to a server
1. After you completed the step to add a service, select its name
in the Statistics Services view. On the toolbar, click
Disconnect from a Remote Service ( ).
Note that the service’s folder in the Statistics Services view
no longer has a green checkmark.
2. Select your service folder again, and on the toolbar, click
Connect to a Remote Service (
). The service is
reconnected.
179
Chapter 4 TIBCO Spotfire S+ Workbench Tasks
To submit a job
1. Create a new project called sample_scripts and make it your
working project. Create a new file, a Spotfire S+ script, in the
project and call it samplescript1.ssc.
2. Copy and paste the following example code into the Script
Editor:
java.graph("mygraph.spj", format="SPJ")
show.settings()
dev.off()
•
Remember that you can run jobs on Spotfire Statistics
Services only from the Script Editor, not from the
Console.
•
You can run either the entire script, or you can run only
the selected code.
3. In the Spotfire Statistics Services view, select the service
where you want to run the example.
4. In the Spotfire Statistics Services view, on the toolbar, click
Run (
).
Note
Make sure you click the Run button on the Statistics Services view toolbar to run your script in
the Spotfire Statistics Services S-PLUS engine. The Run button on the Workbench toolbar runs
your job in your local S-PLUS engine.
5. Note that the service folder expands the Jobs folder to display
the folder for the running job. When the run is done, if it has
run successfully, a green checkmark appears on the folder,
and the folder name changes from JobID (Waiting) to JobID
(Done). (This job is short, so it should run immediately.)
To examine a job
1. Expand the job folder containing the job run in the previous
steps. Note that when you expand the folder, the label
changes from boldface to regular typeface to indicate you
have examined it.
180
Spotfire Statistics Services Remote Submissions
2. Expand the Results folder and examine the contents:
engine.log and mygraph.spj.
•
Double-click engine.log to display its contents in the
Output view.
•
Double-click mygraph.spj to display the graph resulting
from the code in a Graph Window.
3. Double-click Return Value. Its contents are displayed in the
Output view and includes the following:
> retVal.ComputerName.JobID
null device
1
(dev.off returns the number of the current device after the
device was shut down. By default, it is 1.)
4. Double-click Script. Its contents are displayed in a new Script
Editor. The script’s label bears an identifier, as follows:
scriptjob_ComputerName_JobID_scriptGUID.
The contents of the Script Editor should match the code that
you ran. You can close this script.
To schedule a job.
1. Leave the script window open, and in the Spotfire Statistics
Services view, select your service.
2. In the Statistics Services view, click schedule (
).
3. Examine the dialog for current time and date, and check the
server time zone, and if your server is running at a time
different from your computer. (If so, adjust the example
accordingly.)
181
Chapter 4 TIBCO Spotfire S+ Workbench Tasks
4. Leave the calendar date, but in the time spin control,
highlight the minutes and set the time to run the job 1-2
minutes ahead of the current time. ,
Figure 4.43: Job scheduled two minutes out.
Figure 4.44: Statistics Services view displaying scheduled task.
5. Examine the Statistics Services view for the information
provided in the label. The job should run quickly when the
scheduled time is reached.
Note
Scheduled jobs do not appear in the Monitor Jobs view.
182
Spotfire Statistics Services Remote Submissions
To monitor a job.
1. On the Spotfire S+ Workbench menu, click File > Open
File, and then browse to the following file:
SHOME/samples/bigdata/boston/bostonhousing.ssc.
(where SHOME is your Spotfire S+ installation directory.)
2. Click File > Save As and save this script to the
sample_scripts project.
3. In the Statistics Services view, select your Spotfire Statistics
Services, and then on the toolbar, click Monitor server jobs
(
). Note that the Monitor Jobs view opens, by default,
tabbed with the Console view, Objects view, Output view,
and so on. Also note that its tab label displays the name of
your selected Spotfire Statistics Services.
Figure 4.45: Monitor Jobs view.
4. In the Statistics Services view, expand the Jobs folder for
your Spotfire Statistics Services.
5. In the Statistics Services view, click Run three times.
6. Examine the results in the Monitor Jobs view. These jobs
should finish quickly.
Figure 4.46: Jobs queued in Spotfire Statistics Services, displayed in the Monitor
Jobs view.
183
Chapter 4 TIBCO Spotfire S+ Workbench Tasks
Managing Data
Files on
Spotfire
Statistics
Services
You can upload and download files, including data files, from the
Statistics Services view.
To upload a data file
1. Select the running service, and expand its folder.
2. Select the Data folder, or one of its subfolders (depending on
where you want to store your data file).
3. Right click the folder, and from the right-click menu, select
Upload File.
4. Browse to the location of your data file. For example, browse
to:
SHOME/samples/bigdata/stocks
5. Select a file to upload (for example, cbe.csv), and then click
Open (OK on UNIX). The file is added to your Data folder.
To preview a data file and get the summary information
1. Expand the Data folder to find the file you just uploaded.
184
Spotfire Statistics Services Remote Submissions
2. Right click the file name, and from the right-click menu, click
Preview File.
Figure 4.47: Data right-click menu.
3. Review the contents in the Output view.
Figure 4.48: Data preview for cbe.csv.
By default, the preview displays 10 rows, the first row
containing the column headings. The preview also includes a
line containing the data preview object prefix (preview) and
the data file name (cbe.csv, in this case). You can change both
the data preview object prefix and the number of rows to
185
Chapter 4 TIBCO Spotfire S+ Workbench Tasks
preview in the Window > Preferences dialog. See the
section Statistics Services Options on page 25 for more
information.
4. Right click the data file again, and this time, select Summary
of Data.
5. Review the results in the Output view, including the data
summary value prefix (also editable in the Window >
Preferences dialog).
To download a data file
1. Right click the file a third time, and from the menu, select
Download File.
2. Browse to a location to store the file, or click Cancel.
To delete a data file
•
Exporting a
Package to
Spotfire
Statistics
Services
Right click the file in the Data directory, and from the menu
click Delete File. Click OK.
In this task, export the Soundex package that you created previously,
in the section Creating a New Package Project on page 168.
To upload a package to Spotfire Statistics Services
1. In the Statistics Services view, make sure you are connected
to the remote service. (For more information about this see
the section To add a connection on page 178.
2. In the Navigator view, select the Soundex package, which
you created as part of the exercise in the section Building the
Package on page 170.
3. Click File > Export.
4. In the Export dialog, expand Statistics Services, and then
select Spotfire S+ Package Upload.
5. Click Next.
6. In the Select server to deploy to drop-down, select your
Spotfire Statistics Services from the list.
7.
186
Click Finish.
Spotfire Statistics Services Remote Submissions
8. In the Statistics Services view, for your service, expand the
Packages folder. The Soundex package should appear.
9. In the Script Editor, type library(Soundex), and run it from
the server.
10. In the Script Editor, type search(), and run it from the server.
11. In the Statistics Services view, expand the job you just ran,
and double-click Return Value. The Output view displays
the search path. Soundex should appear on the list.
Notes
•
You must have Perl version 5.8 or later to export a package.
•
Exporting as a package for Windows builds a binary.
•
The package must be in the S-PLUS engine’s INIT file on the server to be loaded and
used when the S-PLUS engine is loaded. See your server administrator if you want to
have this option set. Alternatively, before using functions in an uploaded package, type
library(packagename).
•
The package is uploaded to the server as an unprotected package. (That is, you can
delete it later.)
See the TIBCO Spotfire Guide to Packages for more information.
187
Chapter 4 TIBCO Spotfire S+ Workbench Tasks
SPOTFIRE S+ WORKBENCH DEBUGGER TASKS
This section describes basic tasks you will want to know how to
perform on a simple file set.
Note
If you open a file using the File Open File menu command, and that file is not in a Spotfire
S+ Workbench project, you cannot set a breakpoint in that file.
The following instruction works with the kahanSum example, located in your SHOME/
samples/directory. To create a kahanSum project, follow the steps to create a project (see the
section Quick Start on page 127).
Kahan
Example
In numerical analysis, the Kahan summation algorithm minimizes the
error when adding a sequence of finite precision floating point
numbers. (It is also called compensated summation. This algorithm is
attributed to William Kahan.)
The Spotfire S+ Debugger example uses a simple Kahan summation
algorithm captured in two files. If you have not already done so,
create this project and import the example files. See the section
Adding the Sample Debugging Project on page 136.
The project’s two files are as follows:
Opening the
Debug
Perspective
•
kahanSum.q contains the function kahanSum.
•
kahanAddNext_func.q contains the function, kahanAddNext,
which is called by the function kahanSum.
Before using the Workbench Debugger and Profiler, you must open
the Debug perspective. If you have closed your project in the
previous exercise and want to continue practicing using the Spotfire
S+ Debugger, first re-open your project, and open the two files in the
Script Editor. Next, change to the Debug perspective.
For a more in-depth description of the Debug perspective, see the
section Debug Perspective Options and Preferences on page 92.
To open the Debug perspective
1.
188
On the perspective toolbar, click Open Perspective.
Spotfire S+ Workbench Debugger Tasks
2.
From the menu, select Debug.
Figure 4.49: The Open Perspective menu options.
The Debug perspective button appears to the left of the
Spotfire S+ perspective button, and the perspective changes
to the Debug perspective as shown in Figure 4.50.
Figure 4.50: Selecting the Debug perspective.
Now, you can toggle between the Spotfire S+ perspective and the
Debug perspective by clicking their respective buttons. The Debug
perspective button stays visible in this and future Spotfire S+
Workbench sessions, unless you close it by right-clicking its button
and clicking Close.
Launching the
debugger
To start debugging, first activate the Spotfire S+ debugger using one
of the following methods:
•
On the toolbar, click Toggle Spotfire S+ Debugger (
).
189
Chapter 4 TIBCO Spotfire S+ Workbench Tasks
•
On the menu, click the Run Toggle Spotfire S+
Debugger.
•
On the keyboard, press CTRL+ALT+D.
After you activate the debugger, any expression you type in the
Console, or that you run by clicking Run Spotfire S+ Code ( ) on
the toolbar, invokes the debugger.
Setting
breakpoints
One of the most basic debugging tasks is setting a breakpoint. Set
breakpoints at locations in your code where you want to evaluate
variables. In this exercise, set the breakpoints in the Script Editor. For
a more in-depth description of the Script Editor, see section Spotfire
S+ Workbench Script Editor on page 57.
To set the breakpoints
1. From the Project files, open the file kahanAddNext_func.q
in the Script Editor. (Note that to work with the debugger,
your
2. Find the line in the code that reads:
correctedX <- nextX + kahanValues[["correction"]].
3. In the left margin, right-click to display the menu, and then
select Toggle Breakpoint. (Double-clicking the left margin
next to the code line also adds the breakpoint.)
4. Open the file kahanSum.q in the Script Editor.
5. Find the line in the code that reads:
kahanValues <- kahanAddNext(x[i], kahanValues).
190
Spotfire S+ Workbench Debugger Tasks
6. Repeat step 3 to put a breakpoint at this line.
Figure 4.51: Breakpoint set in the kahanSum function.
Note
Setting breakpoints in code files the Spotfire S+ Workbench does not affect the file if you open it
in the Spotfire S+ GUI in Windows. Breakpoints are evaluated only in the Spotfire S+
Workbench, and only when the debugger is engaged.
To examine your breakpoints
1. Click the Breakpoints view tab. Both breakpoints you set
appear in this view.
Figure 4.52: kahanSum breakpoints in Breakpoints view.
191
Chapter 4 TIBCO Spotfire S+ Workbench Tasks
2. Right-click the breakpoint kahanAddNext, and from the
context-sensitive menu, click Go to File. Note that the
kahanAddNext_func.q file opens in the Script Editor, and
the line with the breakpoint is highlighted.
3. In the Breakpoints view, clear the check box next to the
kahanAddNext breakpoint. Note that the icon changes from a
solid circle to a blank circle in both the Breakpoints view and
in the Script file margin. This action disables the breakpoint in
future sessions but does not remove it.
4. Select the check box to enable the breakpoint.
5. On the Breakpoints view toolbar, click Skip All
Breakpoints ( ). Toggling this option disregards but
maintains (that is, does not remove or disable) all breakpoints
in the Breakpoints view.
6. Take some time manipulating the breakpoints using the menu
options and buttons in the Breakpoints view. For a more indepth description of the Breakpoints view, see section
Breakpoints view on page 113.
When you have finished, re-set the breakpoints in the files as
described in the section To set the breakpoints on page 190.
Starting
execution
Before you run the debugger, first initialize the objects and set the
output display option.
To initialize the objects
1. Open the file kahanAddNext_func.q in the Script Editor.
2. On the toolbar, click Run Spotfire S+ Code (
).
3. Repeat steps 2 and 3 for the file kahanSum.q.
4. In the Console, at the prompt, type the following code:
options(digits=17)
To start the debugging session
1. Engage the debugger by clicking its toolbar button (
2. Click the Debug view tab to display its contents.
192
).
Spotfire S+ Workbench Debugger Tasks
3. In the Console, at the prompt, type the following code:
kahanSum(rep(1000000000.1, 10))
Examining the
call stack
After you have started the debugging session, examine the UI:
Figure 4.53: At the first breakpoint in kahanSum.
To examine the call stack
1. Note that the Script Editor highlights the breakpoint line.
2. Note that the Debug view shows the contents of the call stack.
Figure 4.54: The Debug view containing the call stack.
To resume debugging
1. Resume debugging by clicking the Resume button (
).
193
Chapter 4 TIBCO Spotfire S+ Workbench Tasks
2. Re-examine the Debug view, and note that the debugger
stops at the next break point: the first breakpoint in the
kahanAddNext function.
For a more in-depth description of the Debug view, see the
section Debug view on page 100.
To remove a breakpoint mid-session and resume debugging
1. You don’t need the breakpoint in kahanAddNext, so remove it.
In the Breakpoints view, select the breakpoint for
kahanAddNext.
2. On the Breakpoints view toolbar, click Remove Selected
Breakpoints ( ).
3. Click the Resume button again to run the debugger to the
next breakpoint. The code runs the for loop and stops at the
kahanSum breakpoint again. Observe the results in the Debug
view.
4. Click Resume a few more times to continue debugging to the
first calculate correction. In the next section, examine the
results of the first calculated correction.
Examining
Variables and
Expressions
As you debug, at each breakpoint or step, the debugger re-evaluates
the variables and displays the results in the Variables view. At any
breakpoint or stopping point, you can review, but not edit or alter, the
variables at the current frame.
For a more in-depth description of the Variables view, see the section
Variables view on page 106.
To examine the variables
1. Click the Variables view to display its contents.
2. In the Debug view, highlight the last line in the call stack.
3. Note that the Variables view displays the variables resulting
from the code run so far.
194
Spotfire S+ Workbench Debugger Tasks
4. Highlight a variable in the Variables view and note that its
value is displayed in the Details pane.
Figure 4.55: Variables view during debugging session.
5. On the Variables view toolbar, click the Show Type Names
button ( ). Note that the Variables view now displays the
variable type information.
Figure 4.56: Variables view showing type names for the variables.
6. Take some time examining the variables using the menu
options and buttons in the Variables view, clicking Resume
in the Debug view and watching the variables change.
Setting a
Watch
Expression
You can track variable assignments in the Variables view, and you
can track variables and expressions in the Expressions view. This
section demonstrates how to track individual variable assignments
and interesting expressions.
Note on Expressions
An expression is any syntactical interaction that Spotfire S+ can
evaluate. Expressions persist from session to session. Spotfire S+
recognizes a wide variety of expressions, but in interactive use the
195
Chapter 4 TIBCO Spotfire S+ Workbench Tasks
most common are names, which return the current definition of the
named data object, and function calls, which carry out a specified
computation. Any of the following are Spotfire S+ expressions:
1:10
rnorm(5)
mean(1:10)
traceback()
If you were debugging a function, for example:
incrementByTwo <- function(x) {
* x + 2
}
you could have an expression that evaluated:
x + 2
at the breakpoint (denoted with the * in the above function
definition).
For more information about expressions, see the Programmer’s Guide,
or see the Spotfire S+ Help topic ExpressionLanguage.
To watch expressions
1. Right-click the Expressions view to display the contextsensitive menu.
2. From the menu, select Add Watch Expression.
3. In the Add Watch Expression dialog, type the following:
kahanValues[["sum"]]
Figure 4.57: Add Watch Expression dialog with expression added.
196
Spotfire S+ Workbench Debugger Tasks
4. Add a second expression to watch:
kahanValues[["correction"]]
5. Click the Variables view and right-click the variable x.
6. On the context-sensitive menu, click Create
Expressions.
7.
Watch
The debugger returns to the Expressions view. Note that the
variable X is now on the list.
8. Add the following two more expressions to watch:
sum(x)
sum(x)-kahanValues[["sum"]]
The first expression provides the sum of the variable x.
The second expression provides the difference between the
sum of x and the sum of kahanValues.
Optionally, restart debugging to start evaluating the expressions from
the start, pausing to see the results between the Variables view and
the Expressions view.
Figure 4.58: Evaluating expressions.
Stepping into,
over, and out
of a function
Other common debugging tasks include stepping through, over, and
out of a routine’s functions. When you step through a routine, the
debugger pauses at every function and function body, giving you the
opportunity to examine the results.This feature is also used to enter
if/else statements, for loops, while loops, and other routines.
197
Chapter 4 TIBCO Spotfire S+ Workbench Tasks
To step into a routine
1. Click the Step Into button (
into routines and their bodies.
). Repeat to continue to step
2. Note that as you click Step Into, the code being evaluated is
highlighted in the Script Editor and is evaluated in the call
stack.
3. Keep stepping into the code until you come to an internal
function. (See Figure 4.59).
Because this function is not in your project files, note that the
function is displayed in a temporary file. (You can set a
breakpoint in such a function, and continue to evaluate it in
future debugging sessions.)
Figure 4.59: Stepping into a function displayed in a temporary file.
198
Spotfire S+ Workbench Debugger Tasks
You can also step over a function (
function (
), or you can step out of a
), using the buttons on the Debug view toolbar.
Note
If you are debugging using the Run button, rather than running a function via the Console view,
when you reach the last expression, you can find yourself in internal Spotfire S+ code. To avoid
this situation, type the name of the function and parameters in the Console view instead. See the
section Debugging Using the Run Button on page 206 for more information.
Examining
Resource
Usage
You can track resource allocation usage by engaging the Spotfire S+
Workbench Profiler.
To track resource usage
1. On the Spotfire S+ Workbench main menu, click the Profiler
button ( ) to toggle it on.
2. Click the Allocations view tab.
3. Examine the resource usage. Note that it is sorted
alphabetically by type. Click the Type column head; note that
the view is now sorted in reverse.
4. Click the Amount column head; note that the view is now
sorted by amount, smallest to largest.
5. Click Amount again; note that it re-sorts, largest to smallest.
6. Click the drop-down menu, and then
Allocations. Note that the table is cleared.
Examining
Function Calls
click
Reset
In the next section, examine the functions used in the example. You
can examine the functions either in an expandable tree view or in a
table view. (Make sure the Profiler is engaged by toggling on the
Profiler button on the main menu.)
To track functions used
1. Click the Function Calls view tab.
199
Chapter 4 TIBCO Spotfire S+ Workbench Tasks
2. Examine the tree. Note that after each function, in
parentheses, is the amount of time the function call took to
run.
3. Scroll down to the kahanAddNext function, expand the
selection, and examine the time values.
Figure 4.60: Tree view of the Function Calls view.
4. Right-click the Function
Function Tree to clear it.
Calls view and click Show
5. Examine the resulting table.
6.
Scroll down to the kahanAddNext function and review the call
count (that is, number of times called so far) and duration.
Figure 4.61: Table view of the Function Calls view.
200
TROUBLESHOOTING
5
Introduction
202
“Workspace in Use” Error
203
Working with Calls to Spotfire S+ GUI Functions
204
View is Not Visible
205
Debugging Using the Run Button
206
Subclipse Add-in Error with Workbench
207
201
Chapter 5 Troubleshooting
INTRODUCTION
This section provides information about using TIBCO Spotfire S+
code in the Workbench, and presents workarounds and solutions for
special cases you might encounter.
202
“Workspace in Use” Error
“WORKSPACE IN USE” ERROR
Occasionally, when you start the Spotfire S+ Workbench, you might
see an error that the workspace is already in use when you have not
been running a Workbench session.
This problem occurs when you switch computers or versions of
UNIX, and you have changes to absolute paths to a given directory.
1. Check your computer to ensure that the path listed in the
Workspace Selection dialog exists.
2. After you set the appropriate path to an existing workspace, if
the problem persists, check for a .lock file in the
WORKSPACE/.metadata directory. Delete this file.
3. If you do not find a .lock file, check the running processes to
see if old Eclipse processes are running that point to the
workspace. End the processes and try re-starting the Spotfire
S+ Workbench.
203
Chapter 5 Troubleshooting
WORKING WITH CALLS TO SPOTFIRE S+ GUI FUNCTIONS
While you are working with Spotfire S+, you might encounter
libraries or sample code that include calls to Spotfire S+ GUI
functions. For example, the nSurvival library includes calls to
guiCreate and guiRemove functions in their .First.lib and
.Last.lib objects, respectively.
To solve this problem, in .First.lib and .Last.lib functions, wrap
the code that creates and removes Windows GUI elements in
conditional statements. For example:
if(interactive() && platform() == "WIN386" &&
getenv("S_ECLIPSE") == "") {
##...Code that creates or removes Windows GUI elements...##
}
204
View is Not Visible
VIEW IS NOT VISIBLE
If you accidentally close a view, or if the view you want to see is not
visible, on the Windows Show View menu, select the view to
display. If the view to display is not on this list, click Other to display
the Show View dialog, and then select the folder, and then the view
to display.
205
Chapter 5 Troubleshooting
DEBUGGING USING THE RUN BUTTON
When you use the Run button to invoke a debug session rather than
using the Console, and you come to the last expression and click
Step, Step In, or Step Out, you can end up in internal Spotfire S+
functions that are called by your code.
This behavior occurs because any time you click Run, the expression
that Spotfire S+ runs is wrapped in a complex S expression designed
to capture parse errors, syntax errors, and so on.
To avoid finding yourself in this internal code, run the function by
typing it in the Console.
206
Subclipse Add-in Error with Workbench
SUBCLIPSE ADD-IN ERROR WITH WORKBENCH
If you are running the Subclipse add-in while you run the Spotfire S+
®
Workbench in Microsoft Windows , you might see the following
error when you switch between projects:
"Unknown problem executing expression (interrupt?)"
It is possible to remove this problem by performing an SVN Cleanup
operation in the Workbench.
207
Chapter 5 Troubleshooting
208
INDEX
Symbols
C
.Data
working 53
.Data database 12
.metadata database 12
changing databases
adding a directory 154
adding a library 153
adding a module 154
clear History view 70
code completion 50, 59, 158
code indenting 60
code problems
locating 74
collapsing breakpoints 118
color options
user-defined 21
commands
persisting history 19
scroll through 49
comparing versions 62
console fonts 19, 24
Console view 44, 48, 68, 98
Console view menu 47, 51
copy
project files between projects
135
copy history to the Console view 70
copying code
from the Console view 165
copying from script to console 164
Copy to Console 34
create a Workbench project 126
current working directory 53
customized menus 31
customized toolbars 31
A
add a task
in script file 163
Allocations view 44, 98
anonymous functions
showing in outline 23
B
background color 21
background color in Console view
changing 19, 24
Breakpoint
types 115
breakpoints
Line 115
Breakpoints view 44, 98, 113
Breakpoints view menu
Deselect Default Working Set
119
Select Default Working Set 119
Working Sets 119
Breakpoints view toolbar 117
build packages 170
209
Index
D
databases
detaching 76
examining search path 75
manipulating 71
debugger 206
Debug perspective 90
Debug perspective views 98
Debug view 98
Debug view toolbar 101
Define Folding Region 33
defining color
user terms 21
deselecting default working set
Breakpoints view menu 119
Details pane
Expressions view 113
Variables view 110
device
default 17
dialog
Filters 74, 87
Outline options 23
Preferences 14
Select Perspective 150
Show View 150
Sorting 74, 87
Task Tags 25
Workspace Launcher 126
directory
attaching 76
down arrow 49
E
Eclipse 3
edit code 157
editing
function definitions 159
editor 57
empty project
creating 129
environment variables 10
existing files
210
creating a project for 130
existing project
importing files for 130
expanding breakpoints 118
Export dialog 171
expression evaluating
hovering 21, 105
expressions 195
limiting return 109
Expressions view 98
Details pane 113
Expressions view control menu 108
Expressions view toolbar 112
external files
opening 63
F
file associations 14
files
formatting 52
opening files not in your project
31
filtering files 63
Filters dialog 74, 87
find
function calls 34
FIXME
high-priority tasks 86
font settings
console and output 19, 24
format code 33
Format Spotfire S+ Files 52
Function Calls view 99
function definition
editing 34, 159
function definitions
editing 159
function help 8
functions
watching 23
G
Go to File for Breakpoint 117
Index
Group By 119
H
help
displaying 60
help menu 37
high-priority tasks 86
history
persisting 19
History view 68, 69, 165
hover 109
hovering
evaluating expression 21, 105
I
IDE defaults
Spotfire S+ perspective 14
importing files 130
Import menu command 135
indenting
code 60
internal Spotfire S+ functions
in temporary files 206
interrupt code 58
M
medium-priority tasks 86
menu
Console view 47, 51
help 37
Objects view 71
Problems view 74, 75
Run 36
Spotfire S+ 33
Tasks view 87
Window 37
menus
customized 31
module
attaching 76
monitor a job 183
multiple projects 133
N
Navigator view 69, 156
New Project wizard 31
Create Spotfire S+ Package
structure 129
O
J
java.new.plot.action 17
Java graph 17
Java virtual machine 10
L
library
attaching 76
Line breakpoints 115
line limits
History view 71
line numbers 157
displaying 59
low-priority tasks 86
Object Explorer
Workbench 73
object members
changing number displayed in
Objects view 73
objects
examining 72
Objects view 68, 71
Objects view menu 71
opening external files 31, 60
Outline dialog 23
Outline view 54, 68, 99
Outline view toolbar 56
output fonts 19, 24
Output View 99
Output view 56, 68
211
Index
P
S
package 129, 168
packages
building 170
PDF reader
specifying 9
Perspective 4
perspective 42
Debug 90
Spotfire S+ 67
pkgutils 168
Preferences
debugging 93
preferences 14
setting 138
Preferences dialog 14
Problems view 68, 74, 166
Problems view menu 74, 75
profiler 91
project files
copying 135
removing 156
schedule a job 181
Schedule Job 84
script
creating 156
Script Editor 57
in the Debug perspective 99
script output
sending to console 17, 139
searching terms 62
Search Path View 75
Search Path view 69, 153
selecting the default working set
Breakpoints view menu 119
Select Perspective dialog 150
server 178
setting memory heap size 11, 12
setting return limits
variables and expressions 109
shared views 44
show anonymous functions 23
Show Breakpoints Supported by
Selected Target 117
Show View dialog 150
simultaneous sessions 3
Skip All Breakpoints 117
Sorting dialog 74, 87
soundex 168
Source Spotfire S+ Files 52
specifying a PDF reader 9
splus.environment.vars 10
Spotfire S+
internal functions 206
Spotfire S+ Debugger
toggling 39, 41
Spotfire S+ error breakpoint
toggling 42
Spotfire S+error breakpoint
toggling 40
Spotfire S+ menu 33
Find 34
Find Packages 36
Find References 34
Format 33
R
refreshing
Objects view 72
Problems view 74
Search Path view 76
views 155
remote job 178
Remove All Breakpoints 117
removing
project files 156
restoring files 62
reviewing objects 72
run 36
Run Current File 164
Run menu 36
run next command 36
running code 36, 58, 163, 164
on startup 16
running scripts 164
running Spotfire S+ code 38, 41
212
Index
Open Spotfire S+ Help File 34
Run Current File 33
Run Selection 33
Shift Left 33
Shift Right 33
Toggle Comment 33
Update Packages 35
Spotfire S+ Packages 9
Spotfire S+ Package Upload 186
Spotfire S+ perspective 67
Spotfire S+ perspective views 68
Spotfire S+ Profiler
toggling 39, 41
Spotfire S+ warning breakpoint
toggling 40
Spotfire S+warning breakpoint
toggling 41
Spotfire S+ Workbench 3
Spotfire S+ Workbench Properties
dialog 10
starting the Workbench 10
Statistics Services view 69
step into
internal Spotfire S+ code 206
stop 36
store console history 19
toggle Spotfire S+ error breakpoint
37
toggle Spotfire S+ warning
breakpoint 37
Toggle Working Spotfire S+ Project
53
toggling comments 33
toggling Spotfire S+ Debugger 39,
41
toggling Spotfire S+ error
breakpoint 40, 42
toggling Spotfire S+ Profiler 39, 41
toggling Spotfire S+ warning
breakpoint 40, 41
toolbar
Breakpoints 117
Debug view 101
Expressions view 112
Outline view 56
Spotfire S+ Workbench 38
Tasks view 87
toolbars
customized 31
tooltip 21, 105
tree view pane
Objects view 73
T
U
table pane
Objects view 72
task levels 86
Tasks view 69
Tasks view menu 87
Tasks view toolbar 87
task tags
defining 25
Task Tags dialog 25
text variables
limiting return 109
TODO
medium-priority tasks 86
toggle Debug mode 36
toggle Profile mode 37
up arrow 49
V
Variables view 99, 107
Details pane 110
Variables view control menu 108
view
Allocations 98
Breakpoints 98
Console 98
Debug 98
definition 43
Expressions 98
Function Calls 99
Monitor Jobs 183
213
Index
Outline 99
Output 99
refreshing 76
Search Path 75, 153
Statistics Services 178
Variables 99
views
changing display 149
customizing 148
Debug perspective 98
shared 44
Spotfire S+ perspective 68
W
watching functions 23
Window menu 37
Workbench Project 5
214
Workbench project
creating 126
Workbench Script Editor 6
Workbench User Guide 7
Workbench View 6
working directory
setting current 53
Working Sets
Breakpoints view menu 119
Workspace 5
workspace 12, 126
changing 126
Workspace Launcher dialog 126
X
XXX 86