1
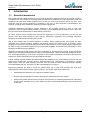
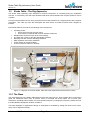
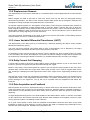
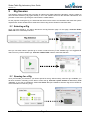
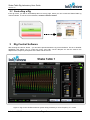
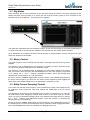
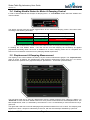
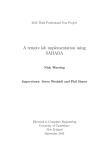
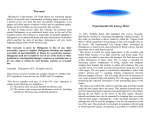
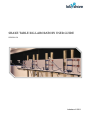
SHAKE TABLE RIG LABORATORY USER GUIDE VERSION 2.0 Labshare © 2011 Shake Table Rig Laboratory User Guide Version 2.0 Table of Contents 1 Introduction ................................................................................................................................................. 2 1.1 1.2 Remote Laboratories .......................................................................................................................... 2 Shake Table - The Rig Apparatus ....................................................................................................... 3 1.2.1 1.2.2 1.2.3 1.2.4 1.2.5 2 Rig Session ................................................................................................................................................ 5 2.1 2.1 2.1 3 Selecting a Rig .................................................................................................................................... 5 Queuing for a Rig ................................................................................................................................ 5 Controlling a Rig ................................................................................................................................. 6 Rig Control Software .................................................................................................................................. 6 3.1 3.2 3.3 3.4 3.5 3.6 3.7 4 Rig Status ........................................................................................................................................... 7 Motor Control ...................................................................................................................................... 7 Eddy Current Damping Control........................................................................................................... 7 Linking Enable States for Motor & Damping Control .......................................................................... 8 Displacement & Damping Measurement ............................................................................................ 8 Fast Fourier Transform (FFT) Generation .......................................................................................... 9 Lissajous Curve Generation ............................................................................................................... 9 Rig Data Acquisition ................................................................................................................................. 10 4.1 4.2 4.3 Saving Displacement & Coil Damping Data .....................................................................................10 Exporting Fast Fourier Transform (FFT) Data ..................................................................................10 Downloading Saved Data ................................................................................................................. 11 4.3.1 4.3.2 5 The Base........................................................................................................................................ 3 Displacement Sensors ................................................................................................................... 4 Linear Variable Differential Transformer (LVDT) ............................................................................ 4 Eddy Current Coil Damping ........................................................................................................... 4 Data Acquisition and Feedback ..................................................................................................... 4 During a Rig Session .................................................................................................................... 11 After a Rig Session ....................................................................................................................... 11 FAQ & Troubleshooting ............................................................................................................................ 12 5.1 5.2 Contacting Support ...........................................................................................................................12 Providing Feedback ..........................................................................................................................12 Revision History 0.1 0.2 1.0 1.1 1.2 1.3 2.0 22/09/2009 21/06/2010 14/09/2010 12/11/2010 02/05/2011 01/07/2011 12/08/2011 Labshare © 2011 First draft Revision Internal Release Revision and general formatting Screenshot update Labshare logo update Updated for Shake Table v1.10 Page 1 LaReine Yeoh LaReine Yeoh Ellie Burke Ellie Burke Ellie Burke Ellie Burke Luke Cogar Shake Table Rig Laboratory User Guide Version 2.0 1 Introduction 1.1 Remote Laboratories Remote laboratories enable students to access physical laboratory apparatus through the internet, providing a supplement to their studies and existing hands-on experience. Students carry out experiments using real equipment, but with much greater flexibility since access can occur from anywhere and at any time. Their interaction with the remote equipment is assisted by the use of data acquisition instrumentation and cameras, providing direct feedback to students for better engagement. Traditional engineering laboratories require students to be physically present in order to work with equipment, which may limit student flexibility. Conversely, remote laboratories let students work in their own time and even repeat experiments for better learning outcomes. Of course students cannot actually touch and feel the equipment in a remote laboratory, but they can still perform most other tasks relevant to their learning. Sometimes, separation from potentially hazardous equipment is preferable from a safety point of view. Due to the increased use of remote operation in industry, where machinery and entire plants are often controlled from a distant location, students may directly benefit from learning how to remotely control equipment. Furthermore, remote laboratories provide the opportunity to access a wider range of experiments as costly or highly specialised equipment may not be locally available. This presents the opportunity to share laboratory facilities between institutions. Significant research and pilot studies have been undertaken in Australia and by several groups around the world into the educational effectiveness of using remote laboratories. These studies have consistently shown that, if used appropriately in a way that is cognizant of the intended educational outcomes of the laboratory experience, remote laboratories can provide significant benefits. Indeed, multiple research studies have demonstrated that whilst there are some learning outcomes that are achieved more effectively through hands-on experimentation (e.g. identification of assumptions, specific haptic skills), there are other learning outcomes that are achieved more effectively through remotely accessed laboratories (e.g. processing of data, understanding of concepts). Engineering students are able to access the Shake Table rigs to help them develop and verify their mathematical models of the complex system dynamics. The Shake Table allows students to: Characterise the behaviour of a 2 degree of freedom system. Acquire experimental data to assist in developing a simplified model of the system. Analyse the system response across a range of frequencies by measuring displacement, performing a Fast Fourier Transform (FFT) on the data in real-time or generating Lissajous curves for each level in real-time. Labshare © 2011 Page 2 Shake Table Rig Laboratory User Guide Version 2.0 1.2 Shake Table - The Rig Apparatus The Shake Table Laboratory was designed to model the behaviour of a building during an earthquake scenario. It is hosted by UTS and helps students break down and understand the complex dynamics of such a system. Five rigs were developed as two-storey structures that emulate vibrations in a single direction with 2 degrees of freedom. Two extra rigs were also developed with three-stories to model movement with 3 degrees of freedom. Each Shake Table rig consists of the following main components: A building model; Where each level has a known mass. Connected by a material with a known stiffness coefficient. Displacement sensors for each level of the building. The base plus a motor to provide appropriate excitation. Damping coils with a known damping coefficient. Data acquisition and control hardware. A web camera for visual feedback. A control interface written in LabVIEW. Level 2 Displacement Sensors Eddy Current Coil Dampers Electric Motor Level 1 LVDT Level 0 Guide Rail Scotch Yoke Mechanism Figure 1: 2 Degrees of Freedom Shake Table with base displacement measurement (LVDT). 1.2.1 The Base The model itself sits on the Shake Table platform where the base level (i.e. level 0) glides along a low-friction guide rail. Rotational motion from an electric motor is converted into linear motion via a „scotch yoke‟ mechanism, providing base excitation at a user-specified frequency. Changing this frequency allows the user to model different earthquake vibration conditions. The base amplitude of displacement during an earthquake is modelled by setting the stroke on the motor, which can be adjusted manually. Labshare © 2011 Page 3 Shake Table Rig Laboratory User Guide Version 2.0 1.2.2 Displacement Sensors The displacement of each level is measured by a contactless MTS C-series Magnetostrictive Linear-Position Sensor. Button magnets are fixed at the back of each level, which travel up and down the waveguide sensing element during vibration. The effect of the external magnetic field causes the ferromagnetic material of the waveguide to change its shape at that particular point on the sensor. To read the magnets‟ position, an “interrogation current pulse” is sent along the waveguide from the base of the sensor, which generates a radial magnetic field as it travels. When it reaches the point at which the button magnet is placed, the two magnetic files interact with one another. Then a mechanical strain pulse is emitted back towards the base of the sensor (in the form of an “impact soundwave”) which is detected and converted into a voltage signal by the sensor electronics. The button magnets are attached to the center of each level, with the rest position of the building structure roughly between 70-75 mm, in absolute displacement. 1.2.3 Linear Variable Differential Transformer (LVDT) The displacement of the base (level 0) is measured by a Solartron Metrology DG Series Linear Variable Differential Transformer (LVDT). The LVDT has three solenoid coils placed within a tube. A ferromagnetic core is attached to the object requiring position measurement and this moves along the axis of the tube. An alternating current is driven through the primary (centre) solenoid coil, which mutually induces a voltage in the secondary coils. As the ferromagnetic core moves, the induced voltages change and the position can be measured by measuring the difference between (i.e. the differential) the two secondary coil voltages. 1.2.4 Eddy Current Coil Damping A copper plate is fixed to each level of the building model, extending between a pair of coils which when turned on, generate a magnetic field that permeates through the copper. Motion in each storey of the model causes the copper to move at a given velocity relative to the coils, which generate eddy currents within the copper itself. These eddy currents in turn create a magnetic field of their own, resulting in a damping force that opposes the motion of the copper, hence suppressing vibration for that level. Note that the current in each coil is supplied by an amplifier and the temperature of each coil measured using a temperature diode. If the temperature rises above 85ºC, the system automatically turns off the coils to prevent damage to the equipment. The rig will not be operable until the temperature falls below this threshold. 1.2.5 Data Acquisition and Feedback Data acquisition and control is implemented using a LabJack UE9 device and National Instruments cRIO. These are linked to the rig server PC via an Ethernet connection. Software written in LabVIEW, hosted on a virtual machine running Windows Server 2003, allows users to gather the data and operate a single Shake Table Rig. An Apple iSight webcam gives the user visual feedback of the Shake Table in action, in real-time, accessible via the Internet from the Remote Labs web page. Remote data acquisition and feedback control on a fast moving, dynamic system is a challenge over the Internet. For a good control system to work, both the acquisition and feedback should be done within a very small timeframe to achieve a good response. In order to achieve this, data is constantly being streamed from the LabJack and cRIO using a fast, hardware timed acquisition rate. Labshare © 2011 Page 4 Shake Table Rig Laboratory User Guide Version 2.0 2 Rig Session The following section outlines the procedure for utilising the Shake Table Rig Laboratory, which is similar to other Remote Laboratory Rig types already in use. The software that runs the Remote Laboratories and provides access to the rigs through a web browser is called Sahara. For the purpose of using the rig, it is assumed that users have access to a workstation that meets the system requirements. Users should refer to Labshare‟s Generic Rig Access Guide for this information. 2.1 Selecting a Rig Once you have logged in, you will be directed to the Rig Selection page. On this page, click the “Shake Table” tab if it is not already selected. Now you can either select a specific rig to control or select from any of the available rigs. It is suggested to select from any of the available rigs. Click the “Shake Table” icon to make this selection. 2.1 Queuing for a Rig Once you‟ve made your selection, you need to queue for the rig. After this step, when the rig is available, you will enter a session, whereby you are able to control the rig. Click the “queue” button or alternatively click “reserve”, if you wish to schedule a session for future use (see Labshare‟s Generic Rig Access Guide for more information on reserving a rig). Labshare © 2011 Page 5 Shake Table Rig Laboratory User Guide Version 2.0 2.1 Controlling a Rig If the rig is free, you will be immediately taken to the rig page, where you can access the Shake Table rig control software. To run the control software, click the “launch” button. 3 Rig Control Software After clicking the “launch” button – you should be presented with the rig control software. This is a LabVIEW application that allows you to control the motor and eddy current dampers as well as observe the displacement, frequency and phase of the base and each level. Figure 2: Rig Control Software with the system being excited by a motor frequency of 1.75 Hz. Labshare © 2011 Page 6 Shake Table Rig Laboratory User Guide Version 2.0 3.1 Rig Status Upon launching the rig control software for the first time during the session, two green indicators in the bottom left hand corner will light up to inform the user that the current system is now connected to the hardware server and initialised – “Connected” and “Logged In”. The status bar underneath will read “Resetting system” as the coils are turned on to provide full damping for a couple of seconds to ensure that any vibrations are removed from the system before operation. Once initialisation is completed, the status bar will change to “System Ready” and the controls for the coils and motor will become accessible. 3.2 Motor Control The motor frequency can be controlled by the slider on the right hand side of the rig control software. The frequency can be adjusted from 0 Hz (stopped, no rotation) to 8 Hz in intervals of 0.01 Hz. The motor has been calibrated for this frequency range. The frequency can be adjusted either by dragging the yellow slider marker up and down with your mouse cursor, by typing the desired frequency in the motor frequency input field or by clicking the “+” and “-“ frequency adjustment buttons, which will increase and decrease the motor frequency by 1 Hz respectively. Be sure to click the “enable” toggle button to put the motor in the enabled state (green) at the motor at the frequency you have set. The motor can be stopped by either toggling the button back to the disabled state (red) or by adjusting the frequency to 0 Hz. 3.3 Eddy Current Damping Control In the same way that the motor frequency can be controlled, the eddy current dampers can be controlled, via the sliders for each level towards the middle-right of the rig control software. The damping for each level can be adjusted from 0 to 100% in increments of 1%. This can be performed by either dragging the yellow slider marker up and down with your mouse cursor, by typing in the desired damping level in the damping level input field or by clicking the “+” and “-“ damping level adjustment buttons, which will increase or decrease the damping level by 1% respectively. Be sure to click the “enable” toggle button to put the damper in the enabled state (green) at the damping level you have set. The damping can be removed by either toggling the button back to the disabled state (red) or by adjusting the damping level to 0%. Labshare © 2011 Page 7 Shake Table Rig Laboratory User Guide Version 2.0 3.4 Linking Enable States for Motor & Damping Control In order to assist students with analysis of damping times – a “Link Enable” button has been added to the control software. This button inversely links the enable toggle buttons for the motor and damping control. The button works according to the following truth table: Link Enable Motor Enable Level 1 & Level 2 Damper Enable User-Disabled (Red) Independently-Toggled Independently-Toggled User-Enabled (Green) User-Enabled (Green) Auto-Disabled (Red) User-Enabled (Green) User-Disabled (Red) Auto-Enabled (Green) e.g. If the Link Enable button is enabled and the user enables the motor, the damping will automatically be disabled. In enabling the “Link Enable” button – the user can be sure that damping will consistently be applied (repeatable time-delay) when the motor is disabled. As a result, damping times can be compared and sources of error/variation removed from any damping-related experiments. 3.5 Displacement & Damping Measurement The majority of the control software is taken up by the various measurement graphs. The “Displacements” graph is shown by default. The displacement graph displays displacement sensor data for a 10 second interval from the “present time” (right hand side) to “present time - 10 seconds” (left hand side). The left hand scale axis is used for displacement and by default measures from -80mm to +80mm. An “Autoscale” tick box has been added to allow for more precise measurements at small displacements. The base displacement, level 0, is indicated by the white line. Level 1 is indicated by a red line and level 2 by a green line. The right hand scale axis is used for damping and by default measures from 0% to 100%. The damping level applied to the level 1 damper is indicated by a blue line, with the level 2 damper indicated by a pink line. Labshare © 2011 Page 8 Shake Table Rig Laboratory User Guide Version 2.0 3.6 Fast Fourier Transform (FFT) Generation A real-time Fast Fourier Transform (FFT) can be performed on the displacement data. This can assist in finding the resonant modes or in performing various other frequency-based analysis techniques on the system. Be sure to click the “FFT” tab to generate the FFT on the displacement data. The FFT is a plot of the amplitude on the left hand scale axis against the frequency (Hz) along the horizontal axis. The figure above shows the FFT generated on the first few seconds of data at an excitation frequency of 1.75 Hz. The FFT performed on the base, level 0, data is indicated by the white line, level 1 by the red line and level 2 by the green line. 3.7 Lissajous Curve Generation A real-time Lissajous curve can be generated based on the displacement data. This allows you to determine the phase relationship of the various levels. Be sure to click the “Lissajous” tab to generate the curve. The selection of “Level X versus Level Y” can be toggled via the plot drop-down menu at the top-right of the curve plot. The phase relationship can be determined by the curve shape. Labshare © 2011 Page 9 Shake Table Rig Laboratory User Guide Version 2.0 4 Rig Data Acquisition Users are able to save sensor data for displacement, coil damping as well as the generated Fast Fourier Transform (FFT). 4.1 Saving Displacement & Coil Damping Data Displacement data can be saved whilst your session and the rig control software is active by clicking the “Start Save” button. Data will be recorded and saved to a tab-delimited text (.txt) file at 0.01 second intervals. The data is divided up into columns, with the column order being: Time (s), Level 0 Displacement (mm), Level 1 Displacement (mm), Level 2 Displacement (mm), Level 1 Coil Output (%), Level 2 Coil Output (%) When you have completed your experiment or recorded the appropriate data, be sure to click the “Stop Save” button. 4.2 Exporting Fast Fourier Transform (FFT) Data Real-time Fast Fourier Transform (FFT) data can be saved whilst your session and the rig control software is active, by clicking the “Export FFT” button. Data will be recorded and saved to a tab-delimited text (.txt) file. The data is divided up into columns, with the column order being: Frequency (Hz), Level 0 Amplitude, Level 1 Amplitude, Level 2 Amplitude Since the FFT data is purely real-time acquisition (i.e. a snapshot), there are no other buttons to press/consequently no need to stop saving the data. Labshare © 2011 Page 10 Shake Table Rig Laboratory User Guide Version 2.0 4.3 Downloading Saved Data As noted, any saved/exported data is saved to a tab-delimited text (.txt) file. This/these file(s) can be retrieved either whilst in a rig session or after the rig session has concluded. Please follow the processes outlined below for each scenario. 4.3.1 During a Rig Session If you wish to download your data during a rig session, go to the UTS Remote Labs website window you used to launch the rig control software. On this page, there will be a “Session Files” heading – with a list of all saved text files. Click the text file title (e.g. 20110812_163753.txt) to download & save the file to your computer. After clicking the text file title, a browser-specific download window should appear - be sure to click “Save File” or similar in this window to save the file in an appropriate location on your computer. 4.3.2 After a Rig Session If you have completed a rig session previously, and saved data, you are able to retrieve the saved files by clicking the “Data Files” heading on the UTS Remote Labs website. A list of previously saved data files should appear, to download & save the file to your computer, click the text file title (e.g. 20110812_163753.txt). After clicking the text file title, a browser-specific download window should appear - be sure to click “Save File” or similar in this window to save the file in an appropriate location on your computer. Labshare © 2011 Page 11 Shake Table Rig Laboratory User Guide Version 2.0 5 FAQ & Troubleshooting 5.1 Contacting Support Any questions regarding the nature of assessment tasks should initially be directed to the relevant academic. If the user encounters any difficulties during the course of using the rigs, the “Contact Support” button should be used to request assistance and report an incident. The following popup will appear – please enter your name and a valid email address, followed by a category from the “Type” drop down list. You may then enter a brief statement regarding the nature of the request in the “Purpose” field. Be sure to enter as detailed a description as possible of the incident in the “Feedback” field. 5.2 Providing Feedback Users are strongly encouraged to leave feedback and comments of their experience with the rigs to help improve the system, as well as any suggestions for additional features to be included in the future. For any enquires or assistance, contact the Labshare helpdesk at: [email protected] Labshare © 2011 Page 12