1
Lightweight, High-Resolution Monitoring
for Troubleshooting Production Systems
Sapan Bhatia
Princeton University
Abhishek Kumar
Google
Marc E. Fiuczynski
Princeton University
Abstract
healthy” but to also understand why it is not. This
data should not be restricted to a set of detectable
failures (e.g. access violations) but should enable the
diagnosis of faults that cannot be characterized a priori. The data must be collected at all times, to capture root causes temporally distant from faults and
failures. It must also be collected for the whole system to capture “domino effects” that are typical in
built-from-components systems.
Production systems are commonly plagued by intermittent problems that are difficult to diagnose. This paper
describes a new diagnostic tool, called Chopstix, that continuously collects profiles of low-level OS events (e.g.,
scheduling, L2 cache misses, CPU utilization, I/O operations, page allocation, locking) at the granularity of
executables, procedures and instructions. Chopstix then
reconstructs these events offline for analysis. We have
used Chopstix to diagnose several evasive problems in a
large-scale production system, thereby reducing these intermittent problems to reproducible bugs that can be debugged using standard techniques. The key to Chopstix
is an approximate data collection strategy that incurs very
low overhead. An evaluation shows Chopstix requires under 1% of the CPU, under 256Kbytes of RAM, and under
16Mbytes of disk space per day to collect a rich set of
system-wide data.
1
Larry Peterson
Princeton University
• Robustness. Diagnosis must be possible even in
conditions in which the system crashes, preventing
postmortem analysis of the live system. It should
not be restricted to deterministic problems and be
able to handle complex scenarios that involve nondeterminism (e.g., disk-I/O or network packet timing).
• Non-intrusiveness: System monitoring and diagnosis must not impose prohibitive overhead; need modifications to applications or the OS; or require taking
the system offline.
Introduction
Troubleshooting complex software systems is notoriously
difficult. Programmers employ a wide array of tools to
help harden their code before it is deployed—ranging
from profilers [1, 8, 9, 10, 28] to model checkers [27]
to test suites [2]—but fully protecting production systems
from undetected software bugs, intermittent hardware
failures, configuration errors, and unanticipated workloads is problematic.
Our experience operating PlanetLab [20] convinces us
that no amount of pre-production (offline) testing will uncover all the behaviors a built-from-components system
will exhibit when stressed by production (online) workloads. Unfortunately, it is also our experience that existing online tools do not offer sufficient information to
diagnose the root cause of such problems, and in many
cases, it is difficult to even narrow in on a descriptive set
of symptoms. In short, we have found production-only
problems hard to reproduce and diagnose using existing
tools and techniques. We attribute this situation to a set of
unique challenges posed by such problems:
To address these shortcomings, we developed Chopstix, a tool that continuously collects succinct summaries
of the behavior of the whole system, including all applications and the OS. These summaries contain comprehensive (with a coverage of 99.9%) logs of events that cut
across low-level OS operations (e.g. page allocation, process scheduling, locking and block-level I/O), storing detailed contextual information such as stack traces for each
event. Using post-processing, aggregation and visualization tools developed as part of Chopstix, complex misbehaviors can be reconstructed through the quantitative and
qualitative analysis of logs. For example, seemingly unresponsive services can be investigated by quantitatively
analyzing scheduling events to threshold total scheduling
delays, which may be due to resource blocking or other
reasons. Relevant events (i.e. delayed schedulings of the
service) can then be studied qualitatively to isolate their
root cause (e.g., by studying partial stack traces collected
with the event).
It is our contention that Chopstix hits a sweet spot in
the online diagnostic toolkit design space in that it is:
• Comprehensiveness. Enough data must be available
to not only answer the binary question “is the system
1
• Comprehensive: The events tracked have a highfrequency (e.g., once per context switch), which enables them to capture deviations in the system’s behavior even when they are short-lived. Each event
sample is sufficiently detailed so that its circumstances can be accurately reconstructed.
the next Section. Chopstix consists of three components:
a data collector, a data aggregator, and a visualizer. The
collector is implemented in the kernel of each monitored
node and controlled by a companion user process that
periodically copies data from the kernel to the disk. A
polling process regularly fetches this data from various
nodes to a central location. The aggregator processes this
data at multiple timescales (5 minutes, 1 hour, 1 day) and
filters it with a set of user-defined aggregation functions.
The output of these functions, along with overall trends
in the raw data, are rendered in the visualizer and can
be viewed—using a conventional web browser—for each
timescale.
Although each of these components is integral to the
overall workflow, the Chopstix data collector represents
the key contribution—the ability to collect extensive monitoring data at low overhead. This section presents the
salient features of the Chopstix collector and briefly summarizes the role of the aggregator and visualizer.
• Robust: It covers the whole system and maintains a
long-term execution history, currently measured in
weeks. This history can be used to analyze crashes
and to interpret complex and unforeseen system behavior.
• Unintrusive: It has negligible run-time overhead and
space requirements: typically < 1% CPU utilization,
256Kbytes RAM and 16MB of daily log.
The combination of these features has made Chopstix
suitable to help debug a class of problems that are difficult
to diagnose by construction, problems that are intermittent and cannot be characterized. For example, it offers
sufficient coverage to answer a question such as “what
was the system doing last Wednesday around 5pm when
the ssh prompt latency temporarily appeared high yet system load appeared low?”. In doing so, it is comprehensive enough to pinpoint the function calls where the system was blocked, combined with (partial) stack traces that
may lead to the potential root causes of such a problem.
Specifically, Chopstix’s value is to help isolate the root
cause of a fault or anomaly in sufficient detail to enable
the responsible developer to localize and reproduce it—
and hence, fully debug it using existing debugging tools.
In describing Chopstix, this paper makes contributions
at two levels. At the mechanistic level, it describes how
a probabilistic data structure—called sketches—enables
data collection that is both detailed and lightweight. At
the semantic level, it shows how system administrators
can use this data to isolate problems arising from nonobvious behavior inherent in complex computer systems.
On the latter point, the paper narrates our experiences diagnosing stubborn bugs encountered in PlanetLab.
The rest of the paper is organized as follows: Section 2 presents Chopstix’s salient features, Section 3
works through our experiences in using Chopstix to resolve real bugs on PlanetLab, Section 4 gives details on
the implementation, Section 5 evaluates its unintrusive
nature and high coverage, Section 6 discusses limitations
and requirements, Section 7 contrasts Chopstix with other
solutions, and Section 8 presents concluding remarks.
2
2.1
Data Collector
Monitoring tools for production systems must function
within a limited set of resources. Chopstix addresses
the tradeoff between monitoring visibility and monitoring
overhead by introducing sketches [12, 13] to the domain
of system monitoring.
A sketch is a probabilistic data structure that allows the
approximate tracking of a large number of events at the
same cost as deterministically tracking significantly fewer
events. Sketches are an alternative to uniform sampling,
which has the disadvantage of drawing most of its samples
from events with large populations.
To see the limitation of uniform sampling, imagine two
processes that are scheduled 99% of the time and 1%
of the time, respectively. For a scheduler clock rate of
1000Hz, a uniform sampling rate of 1/100 would require
the latter process run for a period of ≈7 seconds for the
probability that it be recorded to be over 50%. For shorter
periods, it is unlikely to be sampled. Sketches cope with
this situation by setting the sampling rate for a given event
to be a decreasing function of its current population in a
given monitoring interval. As a result, events with small
and medium-sized populations that would otherwise “fly
under the radar” are more likely to be counted.
Specifically, a sketch treats an event in two steps. In
the first step, it updates its approximation of the event’s
population in the current monitoring interval. In the second step, it evaluates a sampling function to determine if
this event should be sampled, and if so, saves a sample of
relevant information. Specific details on the choice of the
data structure and sampling functions used are provided
in Section 4 and their error rate is evaluated in Section 5.
System Overview
This section gives a brief overview of Chopstix, providing enough context for the usage scenarios presented in
2
For now, we concentrate on the use of this data structure.
Sketches make it possible to continuously track a variety of generic system events—e.g., process scheduling,
mutex locking, page allocation—whose frequency would
overwhelm the resources available for monitoring if they
were tracked deterministically. Accordingly, event populations corresponding to each such event type are stored
in their own sketch. Section 4 describes this data structure
in more detail; for now, we focus on event types, which
we sometimes call the system’s vital signs.1
An event is given by a tuple that includes its type
(i.e., the vital sign to which it belongs), a virtual address
(e.g., the value of the program counter at the time the
event occurs), an executable-file identifier, a user identifier, and a weight (this field is used by the sketch data
structure). The tuple also includes a stack trace and other
event-specific variables that depict the circumstances of
the event. For example, a scheduling-delay event specifies
that a process—identified as a username/program pair—
was not scheduled in spite of being runnable for a period
corresponding to the event’s magnitude and provides a
stack trace taken as the process waited.
Using Chopstix to monitor nodes in PlanetLab as well
as other systems running open-source software has helped
refine our notions of what vital signs should be chosen
as part of the monitoring set. The kinds of bugs we see
typically have temporal and spatial ambiguities. These
bugs typically cannot be reproduced, and when they happen, they do not leave behind a trail of evidence. Since
we begin without a priori knowledge about the problem,
or even a complete characterization of the problem, we
devise a strategy to study deviations in the health of the
system. Thus, a good vital sign for monitoring is a property that serves as a useful witness—has a strong temporal
and spacial presence—so that when incidents do occur, it
captures enough information to reconstruct the system’s
behavior.
To this end, Chopstix monitors 11 vital signs, chosen
to cut across OS operations at the lowest level. The current set includes: CPU utilization, scheduling delay, resource blocking, disk I/O activity, user page allocation,
kernel page allocation, L2-cache utilization, system call
invocation, signal delivery, socket transmission, and mutex/semaphore locking. Note that we do not claim this set
is complete, but the set is easily extended by adding new
collectors statically (through code patches for the kernel),
or dynamically (through loadable modules or an instrumentation toolkit [18, 3]). Capturing a new vital sign can
be accomplished by deploying as little as six lines of code.
Continuing the metaphor of computer system as medical patient, we treat unusual behavior in one or more vital signs as a symptom of the problem we are diagnosing.
This definition is admittedly vague, where identifying and
interpreting symptoms corresponds to the art of diagnosing a problem. We return to this process in Section 3.
For now, we give a simple example. A steady overall rate of disk I/O might indicate good health of the
I/O subsystem. However, observing breakdowns of this
rate—e.g., specific I/O requests and responses—may reveal requests that are not satisfied (i.e., the request size
was greater than the response size). Such behavior would
contradict the assumption that all requests are satisfied,
indicating a disk problem is possible.
2.2
Data Aggregator
The data collected by Chopstix on a node is periodically
transferred to a central location where it is processed and
rendered. Data from one or more nodes is aggregated
by an engine tailored to time-series multi-sets. Specifically, the raw data is aggregated at fixed-sized timescales
of 5 minutes, 1 hour and 1 day and passed to a set of
multi-set aggregation operators (called filters) via a welldefined API that can be used to deploy new operators.
For example, an experimental Exponentially-WeightedMoving-Average (EWMA) anomaly detector has been
implemented as such an operator in about 80 lines of code.
Other similar functions sort the sets, measure affinities between items across epochs, and so on. The aggregator also
reconstructs the sketching data structures to compute the
values of the vital signs.
2.3
Visualizer
The visualizer accepts user requests for data for specific
time ranges and passes them on to the aggregator, which
returns the vital signs corresponding to each epoch in the
range. These statistics are plotted as a line graph. A user
can compare vitals and look for symptoms by overlapping graphs and zooming into specific epochs of interest
to retrieve detailed samples, including breakdowns of the
vital signs. Clicking on a sample brings up further eventspecific information such as a stack trace.
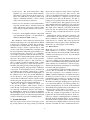
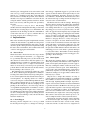
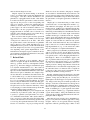
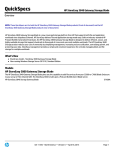
Figure 1 presents a screenshot of the visualizer, showing the main navigator window in which the vital signs of
interest can be selected and overlapped. The X-axis corresponds to time, with a least count of 1 minute and the Yaxis is normalized. Specific epochs can be clicked on at a
given timescale to view filtered samples for any vital sign.
In this example, the spike at the far right was detected to
be a busy loop in the web browser Opera. The correlation
that led to this conjecture is a high CPU-utilization rate at
1 We have found the parallels between medical diagnosis and troubleshooting complex software systems amazingly rich, and so have
adopted terminology from the former when the intuition they provide
is helpful.
3
as the symptoms do not bear any relationships, then the
current set of symptoms is discarded and this step is repeated.
Once the problem has been diagnosed to a given set
of symptoms, then it may either be reproduced by artificially triggering the symptoms, or alternatively avoided
by working around the circumstances that led to the symptoms. The information available at this point should usually suffice to employ standard debugging tools.
Figure 1: A screenshot of the Chopstix visualizer. Two vital signs are
visualized together: CPU utilization (red – the smooth line) and L2cache misses (blue – the “spiky” line). The X-axis corresponds to time
and the Y-axis is normalized. Selecting an epoch, timescale and any
vital (not necessarily the ones visualized) displays filtered samples for
that vital. This information is not shown in the figure.
3.2
Interpreting symptoms is the “art” of diagnosing system
faults. Chopstix’s value is in recording the vital signs, and
visualizing those vitals to expose unusual behavior—i.e.,
symptoms. It is often through finding correlations across
multiple symptoms that the root cause of the problem is
understood.
While we cannot postulate an automated “symptom
correlator,” we can formulate a set of rules to guide the
diagnosis process. These rules typically depend on the
components to which the symptoms in question apply, and
thus require an understanding of the semantics of these
components. Nevertheless, some rules are universal because they are inherent to the underlying OS. This section
presents a collection of such rules, some of which have
been implemented as filters and can be made to report
these relationships in the visualizer.
Each rule maps one or more symptoms into the highlevel behaviors that typically lead to such symptoms.
Some rules are intuitive (e.g., a continuous increase in
net memory allocated is a sign of a memory leak), while
others are based on the repeated observation of a given
cause and effect (e.g., a near-zero L2-cache-miss rate and
heavy CPU utilization indicates a busy loop). The following classification of values as low and high is vital-signspecific, and may have been flagged by appropriately set
thresholds by the visualization sub-system.
Rule #1: High CPU utilization (cpuu) with a low
(nearly-zero) L2-cache-miss rate (l2mi) is a symptom of
a busy loop; i.e., a loop that is unproductive but that does
not yield the CPU to the scheduler. This is because processes in busy loops consume CPU resources but do not
generate much memory traffic. The value of l2mi gives
a rough approximation of memory traffic, and when it is
seen to be low with a high cpuu, it usually amounts to a
busy loop.
Rule #2: An increase in the net (user or kernel) memory allocated is an indicator of a memory leak.
Rule #3: Ungratified I/O requests indicate bad blocks
on the disk. An ungratified I/O request is defined as one
for which the size of the data requested is greater than the
size of the data returned in the corresponding response.
a comparatively low L2-cache utilization rate, which we
have observed to be a feature of busy loops.
3
Usage Model
This section traces the Chopstix workflow, using examples drawn from our experiences diagnosing problems on
PlanetLab to illustrate the insights into system behavior
revealed by Chopstix.
One obvious takeaway from this section is that diagnosing system failures is a difficult and inherently humanintensive activity. Re-enforcing that conclusion is not the
point of this section. The main contribution is to demonstrate how detailed information collected on a production
system can effectively be used to isolate the most stubborn
bugs. A secondary contribution is to summarize several
“system diagnosing rules” that we believe have general
applicability.
3.1
Correlating Symptoms
Workflow
The basic workflow for using Chopstix is as follows. A
user starts by determining that he would like to use Chopstix to diagnose a misbehavior. This may be because there
it is found to have temporal ambiguity (i.e., a bug that
is not punctual and seemingly cannot be reproduced); or
to have a space ambiguity (i.e., a bug that cannot be localized to a component). We assume that Chopstix has
been collecting data on one or more systems for which
the problem is observed.
Next, Chopstix data is searched to identify possible
symptoms (unusual vital sign behavior). If the misbehavior has been reported to have occurred at specific times
then the visualizer can be used to zoom into the corresponding epochs at various time granularities. If the
epoch of misbehavior does not yield an interesting symptom, then the information prior to these epochs is searched
to find outliers in the vital signs. This is a fairly mechanical process and can be performed by thresholding filters.
Candidate symptoms are then correlated in the light of the
observed misbehavior. If no diagnosis can be formulated
4
Rule #4: When the combined value of cpuu for processes is low, scheduling delay (sched) is high, and the
total cpuu is high for the system, it is often a sign of a
kernel bottleneck (e.g., a high-priority kernel thread). In
this case, processes are not scheduled because the scheduler is not given a chance to run. This rule also applies to
preemptable kernels, with the caveat that the symptoms
are less conspicuous.
Rule #5: When the resource blocking vital (blck) for
a process is high, then it is typically mirrored by one
or more of the following vitals: disk I/O (blio), locking
(lock) or socket traffic (sock), thereby isolating the source
of the blockage.
Rule #6: When the amount of user-memory allocated
(umem) is high for a process and blck and blio are high
for the same process, then it is a sign of low main memory
and swap activity. When the latter two are low, it means
that abundant main memory was available on the system
at the time.
Rule #7: When cpuu is low for a process and low for
the kernel, and if sched is high for the same process, then
the process is being held from scheduling. If cpuu is high
for the system, then it is being held normally, in line with
fair sharing of the CPU. If it is low, then it is being held
abnormally.
Rule #8: When kmem for a process is low compared
to the rate of system calls (syscall), then it often indicates
a busy loop with a system call; e.g., a send call that fails.
The intuition is similar to that of Rule #1: A high value
of kmem is indicative of a process that causes heavy system activity. Accordingly, a high syscall rate should be
mirrored by a high value of kmem.
Rule #9: Low l2mi and high user-memory allocation
(umem) in an application is a sign of application initialization. If l2mi is high with a high umem then it is a
sign of increasing load. User memory is made available to
processes on demand, when they access virtual-memory
pages that have not yet been mapped to physical ones. At
initialization time, processes “touch” several such pages
while initializing data structures, but generate comparatively low memory traffic, leading to a low value of l2mi.
Similarly, when memory is paged in and is accompanied
by high memory traffic, then it is a sign of increasing load.
Rule #10: An abrupt disappearance of the vital signs
of a process can indicate that it has died, or that it stopped
functioning. The cause of death can be investigated by
looking at the signals that it received and the syscalls
it executed (e.g., in Linux, the sys exit system call
would indicate voluntary death, a SIGSEGV signal or a
segmentation fault would indicate accidental death, and a
SIGKILL signal would mean that the process was killed.
In the case of a bug, the program counter associated with
the stack trace can be used to trace the problem to the exact code site at which the problem was caused.
In summary, we have presented a collection of
frequently-used rules used to interpret vital signs. We now
use these rules along with other intuitions to describe our
experiences in debugging real problems on PlanetLab.
3.3
Case Study
This section presents a case study of an especially complex and troubling bug that we found using Chopstix.
The PlanetLab team had been investigating it for over 6
months (Chopstix was not stable and had not been deployed up to this point) but was unable to pinpoint or reproduce the problem.
The example illustrates how the key features of Chopstix are leveraged: (1) multiple vital signs are correlated to
understand the problem, (2) a long history saved through
continuous data collection is mined for information, and
(3) contextual information is used to rule out misdiagnoses and isolate anomalies to specific code sites.
Observed Behavior. Nodes were observed to crash every 1–7 days without leaving any information on the console or in the system logs. Shortly before such crashes it
was observed that ssh sessions to nodes would stall for
tens of seconds. Some nodes that were running an identical software stack did not suffer these crashes, indicating
that the problem was load-dependent. KDB [22], a kernel
debugger, was activated on one node in the hope that it
would take over at the time of the lockup, but it did not
survive the crash. The NMI watchdog was programmed
to print a stack trace, but it printed program counters on
the stack and often random false information.
Symptoms and Correlations (First Attempt). Visual
inspection of the vital signs on nodes that had crashed
showed spikes in the resource-blocking vital. Processes of
the ssh daemon could be seen here, confirming that this
accounted for the stalls on the ssh prompt. Rule #5 was
applied and attributed the blocking to locking as well as
I/O. To investigate the problem further, the stack traces for
blocked processes on the I/O and lock signs were pulled
out. The stack traces for locks resembled the following
one:
c0601655
c0601544
f885b1b4
f8857e8e
f8857f81
f889805b
f88938a4
c048a217
c04824f5
in
in
in
in
in
in
in
in
in
mutex lock slowpath
mutex lock
log wait for space
start this handle
journal start
ext3 journal start sb
ext3 dirty inode
mark inode dirty
touch atime
Apparently, a process attempted to update the access time
5
in the scheduler) we found the corresponding bottleneck
to be at line 6 of the following block of code.
of a file, which led to an update of a journal transaction
in the underlying file system. This code path can be deciphered to reveal that the journal transaction was protected
by a locked mutex and was in the process of being committed to disk.
For I/O, the stack traces were similar to the one below:
c0600f1f
c048d922
c06010ff
c0601181
c048d887
f885f908
f8863128
c043167e
c0405a3b
in
in
in
in
in
in
in
in
in
1
2
3
4
5
6
7
io schedule
sync buffer
wait on bit
out of line wait on bit
wait on buffer
journal commit transaction
kjournald
kthread
kernel thread helper
try unhold :
v x t r y u n h o l d ( rq , cpu ) ;
pick next :
i f ( u n l i k e l y ( ! rq−>n r r u n n i n g ) ) {
/ ∗ can we s k i p i d l e t i m e ? ∗ /
i f ( v x t r y s k i p ( rq , cpu ) ) g o t o t r y u n h o l d ;
}
A casual examination revealed this code to contain a
tight loop. We then confirmed this problem by using
kprobes to inject code at this site. This information was
reported to the developers who wrote this code, which lies
in the scheduler. Additional contextual information (e.g.,
the stack trace at this point) was also provided to them.
They confirmed it to be a fault and went on to fix the bug.
In conclusion, the availability of a long history of multiple vital signs allowed anomalies across them to be correlated and access to contextual detail allowed these anomalies to be traced to a specific code site. The application of
these features to a problem that conventional approaches
could not resolve is a validation of the diagnostic abilities
of Chopstix.
This particular stack trace reveals the reason that the
aforementioned batch of processes was blocked. The
journal is trying to commit the current transaction to disk.
Many other processes were similarly blocked. It was
speculated that the source of these blockages would also
block all subsequent activities on the system and result in
the crash. However, contrary to our expectations, it was
found that in the epochs corresponding to this blockage,
I/O throughput degraded negligibly and request-response
latencies stayed low. Also, using a filter implementing
Rule #3 to search this data for ungratified requests did
not return any results adding to the evidence that the I/O
subsystem was functioning normally. The clinching proof
came with the observation that the activity was interrupted from time to time over many epochs during which
there was little or no I/O, wherein many of the previously
blocked processes would get unblocked and the blocking
vital drop to a normal, low value.
Thus, the I/O “problems” were telltale and only a reflection of a legitimately heavy I/O workload. Chopstix
was able to rule out the misdiagnosis through the correlation of multiple symptoms (I/O, blocking and locking)
and through detailed hindsight that allowed the disk subsystem to be diagnosed postmortem.
3.4
Other Examples
We now briefly list other examples of diagnosis using
Chopstix. Unlike the bug described in the case study,
these problems were resolved relatively swiftly—usually
within a day—as the relationships between the observed
symptoms were more straightforward. To save space, we
omit specific details and restrict ourselves to outlining the
problem and the symptoms that led to the diagnosis.
SMP-dependent memory corruption in the kernel. By
using a filter to find memory leaks, we were able to identify double deallocations of a socket structure provoked
by an SMP race. This bug had prevented PlanetLab from
using SMP hardware for over a year.
Hung file-system transactions. By correlating disk
I/O, mutex locking and resource blocking, we were
able to determine that a locking bug was poisoning the
inode cache with uninitialized (locked) mutexes, causing filesystem misbehavior.
Out of low-memory crashes. Correlating spurts of I/O,
kernel memory and blocking shortly before such crashes
revealed that certain processes were unable to deallocate
memory as they were blocked on I/O, causing memory to
run out. The swap daemon was seen to be blocked as well,
explaining why memory could not be reclaimed.
Watchdog restarts a failed program. By correlating
disk I/O, syscalls, Socket activity and User-page allocation, we found that an application would fail to read
its configuration file and crash, but that it would then
be restarted immediately by a watchdog process imple-
Symptoms and Correlations (Second Attempt). Since
the above symptoms did not yield a diagnosis, they were
discarded. A new outlier was then discovered on the
resource-blocking vital in the time shortly before the
crashes. Some processes had been blocked for seconds,
but this time Rule #5 did not apply. Furthermore, investigating stack traces showed that the blocking sites were
not invocations of blocking operations. We wrote a filter
to locate this effect throughout the available data set and
found it interspersed throughout the history of the system. Closely coupled with these in the same epochs, were
symptoms that matched Rule #4, that is, high scheduling
delays with heavy CPU utilization in the kernel. On examining these spikes (the lead was now hinting at a bug
6
One strategy to implement triggers is to poll various vital
signs at set intervals and invoke Chopstix if they are seen
to change significantly. In practice, however, it is always
more efficient to instrument the OS interfaces that cause
the relevant vital sign to change and invoke Chopstix on
every invocation of such interfaces.
We illustrate this idea with an example. Kernel-page
allocation may be monitored by polling the total number
of free pages on the system. However, there may be periods during which there is no page allocation, making
the polling process a waste of system resources. At other
times, the page-allocation frequency may be higher than
the corresponding polling rate, making the latter insufficient to account for each such event and leading to the
limitations of uniform sampling. Thus, we instrument the
interface to the page allocator to convey every page allocation to Chopstix as an event, which in turn accounts
for each event in a sketch data structure and samples the
events with better coverage than would be the case with
the polling strategy. For monitoring hardware-related vital signs such as CPU utilization and L2-cache misses, the
underlying processor can be made to generate interrupts
to convey their values. The handlers for these interrupts
are then used as placeholders for the event triggers corresponding to these vital signs.
mented as part of the application. On each crash it would
write out a log to disk, eventually filling the disk. Other
methods (e.g. searching for large files on the disk) may
have been used to identify this problem, but would have
entailed a more rigorous examination of how the file, the
config file and the watchdog interacted with one another
than it was necessary with the global view provided by
Chopstix.
ps gets blocked accessing the kernel. The blocking
and I/O vital isolated unexplained blocking to a line in the
kernel that was accessing the process command line. The
explanation for the blocking was that the commandline is
stored in the stack area of a process, which in this case
was being swapped out for dormant processes.
4
Implementation
This section describes Chopstix’s implementation. It first
outlines the data structures, algorithms and design decisions involved in implementing the data collector. It then
describes specific vital signs we have implemented using
this data collector mechanism, and concludes with a brief
overview of the aggregator and visualizer.
4.1
Data Collector
Sketch-based data collection involves five steps, the first
four of which happen in the kernel: (1) a trigger fires
for a potentially interesting event; (2) the relevant event
data structure is retrieved and a sketch is updated; (3) a
sampling function is evaluated to determine if this event
should be recorded; (4) if so, a sample of relevant information is saved; and (5) a user-level process periodically
polls the kernel for this data and resets the data structure,
thereby defining a data collection epoch.
The sampling process is designed to balance two objectives. First, it should capture enough detail to identify interesting events. This is achieved by incorporating the notion of event-weights in the data structure that tracks perevent frequencies. A competing objective is to limit resource use to keep the overhead within predefined bounds.
This is achieved through the use of an adaptive tuning
mechanism that changes the effective sampling rate depending on the recent history of resource usage. The use
of a logarithmic sampling function contributes to both objectives, minimizing the false negative rate to ensure accurate identification of important events, while reducing the
resource consumption by aggressively reducing the sampling rate for events with large counts. We describe these
features in detail below.
4.1.1
4.1.2
Sketch Update
The sketch data structure employs a sampling function
where the probability with which an event is sampled depends on its frequency. The frequency of events is approximated by counting the number of times the event occurs
in a given data-collection epoch. Since maintaining exact per-event counts at the high frequency of vital signs is
prohibitively expensive, we relax the requirement of exactitude in exchange for an approximate estimate that is
relatively easy to obtain.
Chopstix uses a simple data structure—an array of
counters indexed by a hash function (HCA)—to maintain
these estimates, as well as to record samples collected for
each vital sign. Updating an HCA is simple. Upon the reception of an event, the event label is extracted and hashed
to generate an index for the HCA for the event type (vital
sign). The label is specific to each vital sign, but typically
consists of a virtual memory address, an executable identifier, and a user identifier. The counter at this index is
incremented by the weight of the event (next paragraph).
This counter is later used by the selection process to decide if a sample should be collected (next subsection).
An important observation about the events is that they
are not all created equal. For example, iowait events can
last from a few microseconds to several seconds. Clearly
iowaits that run into seconds need to be assigned more
Event Triggers
The entry point into Chopstix is an event trigger, which
invokes Chopstix in response to a change in a vital sign.
7
consumption within an epoch, and doubles the value of
t whenever the actual resource usage reaches this watermark. Similarly, a low watermark is used, and the value
of t is halved if resource usage at epoch boundaries is below this low watermark. The watermarks are defined in
terms of the number of CPU cycles consumed by Chopstix, which are updated at the end of every epoch . These
watermarks are configured by the administrator and can
be used to set aside a fixed amount of CPU for monitoring.
“weight” in any performance analysis. Fortunately, the
model of per-event counters can be extended easily to accommodate this requirement—while updating the HCA,
the counters are incremented by a value that reflects the
weight of the event being tracked. Returning to our I/O
example, the length of the iowait period can be counted in
jiffies (one jiffy is equal to the time period of the scheduler) and used as the weight associated with an iowait
event. In this manner, call sites that are reached only a
small number of times but account for a large amount of
total time spent in iowait will get the same “count” as call
sites that are reached more frequently but result in smaller
aggregate iowait time.
Collisions in the hash function may cause two or more
events to be hashed into the same location in the HCA.
We do not have any explicit mechanisms to handle collision as such a mechanism would impose an overhead
that would be unsustainable at the targeted event frequencies. This decision makes the selection processes very
fast and allows us to monitor a large number of highfrequency event-types with nearly zero overhead. It results in false negatives, but their probability is negligible,
as documented in Section 5.
We considered other more precise data structures than
HCAs, but were satisfied by the ensuing low probability of false negatives (i.e., important events that go unsampled) of HCAs and found their computational simplicity to be a good trade-off for the tighter bounds that
come with more precise accounting data structures such
as a Space-code Bloom Filters [14] and Counting Bloom
Filters [5].
4.1.3
4.1.4
Event Samples
When an event is selected for sampling, a variety of contextual information is collected and appended to a list of
samples for the corresponding vital sign. The information includes a stack trace, the user identifier, a program
identifier and other event-specific details that are descriptive of the circumstances at that point. The event-specific
details usually include an operation field (eg. allocation
or deallocation for memory events, locking or unlocking
for locks, read or write for I/O). Kernel stack traces are
collected by following the current frame pointer as is customary.
User-level stack traces are collected similarly. However, since user memory may be paged out, and Chopstix being interrupt-safe is not allowed to block, it is first
checked if the desired pages on the user stack are available in memory, failing which the trace is abandoned. In
Linux, the executable file associated with a process is the
first executable memory mapping in its address space and
can be looked up quickly, but its path cannot be included
in the sample as it can be arbitrarily long. To overcome
this problem, we use a facility in Linux called dcookie,
which stores the address of the data structure representing
the file on disk (a dentry structure in Linux) in a hash
table. We store the hash index in the sample and retrieve
information about the data structure from user space at
synchronization time at the end of every epoch.
Sampling Function
Our objective in the selection process is to collect event
samples for as many events as possible, without wasting resources on repetitive collection of the same (highfrequency) event. To achieve this objective, we use dynamic sampling probabilities computed as a function of
the event-count in a given epoch. The function is chosen
in such a way that the expected number of samples collected for any one event grows as log of the count of that
event.
In practice, a simple threshold-based algorithm can
achieve this effect. Using an integer sampling threshold
t, the selection process selects an event if its estimated
count is an integral power of t. The integer arithmetic can
be simplified by picking a t that is a power of 2. The accuracy of the logarithmic sampling function is evaluated
in Section 5.
To ensure bounded resource usage, Chopstix implements an adaptive scheme that tunes the threshold t.
Chopstix uses a high watermark for the total resource
4.1.5
Epochs
Data collection is carried out in fixed-sized epochs, under
the control of a user-level process. The process invokes
event-specific serialization functions on the sample list for
each vital sign, and their output is saved, along with the
HCAs from the previous epoch. The HCAs and all other
data structures are then reinitialized. To avoid interruptions in monitoring at synchronization time, two copies
of the HCA and sample arrays are maintained for each vital sign. At the end of each epoch, pointers are swapped
and the unused HCAs are activated.
Having fixed epoch sizes allows us to circumvent an
issue that arises with continuous monitoring. As data is
8
other and that are semantically dependent. Sketching on
the other hand assumes tracked events to be independent,
failing which it suffers from the weaknesses of uniform
sampling [12]. By dropping the low bits of the PC, we
reduce this dependency and make the collection of these
events more robust. Note that the data collected when
these events are sampled does not contain such an adjustment and instead uses the real value of the PC.
Scheduling Delay and Resource Blocking. Processes
commonly get delayed in their normal course of execution by virtue of accessing resources that are not immediately available or as a result of scheduling policy. Rarely,
as discussed in Section 3, processes may also get delayed
due to system bugs. The scheduling delay and resource
blocking vital signs correspond to the amount that various processes are delayed or blocked. The determination
of whether a process is delayed or blocked is made based
on the state of the process, which is changed by the kernel
when a process accesses a resource that is unavailable.
The trigger for these events lies in the routine that performs context switches between processes. On each context switch, the time since the last run of the process to be
scheduled next is calculated. When this value exceeds a
delay-qualifying threshold, a Chopstix event is generated.
The time since the last run is calculated based on a timestamp, which is recorded by Chopstix in the context-switch
routine at the time the process is scheduled, or when it undergoes a state transition.
The event label includes the site at which the process
was preempted, which may be in the kernel. If in the
kernel, computing this address entails tracing the stack
and has an unacceptably high overhead for each context
switch. Therefore, we use two-stage sampling, using only
the pid in the first stage and tracing the stack to determine
the value of the preemption site in the second stage.
Disk I/O and Page Allocation (Kernel and User). The
Disk I/O trigger is located in the block I/O layer. On each
such request, Chopstix determines the site of preemption
and uses it as part of the event label. The data collected
includes the site from which the I/O request was invoked.
This site is not used in the event label as the number of
such sites is small (10s to 100s) and the number that is
actually used at a time is even smaller (5-10). The number
of sites in the process at which disk I/O can be invoked is
unlimited as a program and its data can be swapped out
to disk and all system calls can lead to journal commits,
which lead to disk activity. Therefore, using the latter in
the event label yields a more uniform hash function.
Kernel page allocation uses the allocation site in the
event label. The Chopstix trigger for this event is located
in the lowest-level page-allocation interface so as to cap-
accumulated while monitoring a running system, it also
needs to be passed on for further processing. One approach is to identify certain entities, such as a process id,
and export all data corresponding to an entity when the
entity is no longer present in the system (i.e., export all
events associated with a process when the process is terminated.). However, there are a few problems with this
approach. First, data associated with entities is not available for analysis until the entity has expired. This may
be acceptable during development but is a handicap when
monitoring a production system. Second, the lifetime of
entities is almost always some complex distribution that
brings an additional layer of complexity if statistical analysis of the aggregate data is desired [4].
4.2
Vital Signs
The mechanisms just defined enable the efficient tracking of high-frequency system events. A set of vital signs
have been defined to use these mechanisms as a way to
diagnose common problems on systems. An interface has
been defined in the C language for allowing the extension of this set to define new event types. Since the processes downstream of event sampling do not depend on
the number of event types monitored in the system, the
extensions can be plugged in dynamically using instrumentation toolkits such as Dtrace [3] and Kprobes [18].
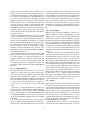
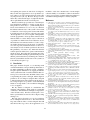
We now describe the implementation of the vital signs
and the process of deploying new ones. Figure 2 tabulates the main characteristics of each vital sign, namely,
where in the kernel it is implemented, the label used for
hashing and the data collected when an event of this type
is sampled.
CPU and L2-cache Utilization. CPU and L2-cache
utilization are collected through hardware performance
counter interrupts [23]. These counters are typically controlled through a set of model-specific registers (MSRs)
which are used to select the type of event monitored and
a counting threshold. When the number of processor
events of a certain type exceeds this threshold value, a
non-maskable interrupt (NMI) is generated and the value
of the corresponding counter is conveyed to the OS. The
Chopstix L2-cache and CPU triggers are located in the
handler of this interrupt and trigger when an interrupt
is delivered for the CPU-utilization and L2-cache-miss
counters.
The event label used for the purpose of hashing consists
of a PC, which is masked to drop the low 8 bits and an
event subtype. The value of the PC can be obtained using
MSRs and corresponds to the site whose CPU utilization
or L2-cache misses is being measured. The PC is masked
based on the observation that these events often register
samples containing sites in close neighborhoods of each
9
Vital sign
CPU utilization
L2-cache misses
Scheduling delay
Resource blocking
Disk I/O activity
Page allocation (kernel)
Page allocation (user)
System-call invocation
Signal delivery
Socket data transfer
Locking
Trigger site
NMI handler
NMI handler
Context switch
Context switch
Block I/O requests
Page allocation and free routines
Page fault handler
System-call handler
Signal-delivery function
Filesystem read/write
Lock and unlock slowpath
Event label
Masked program counter (PC)
Masked PC
Pid, site of pre-emption
Pid, site of pre-emption
Pid, context-switch site,
Pid,allocation or deallocation site
PC of page fault in process
Masked stack pointer, syscall number
Context-switch site,signal number
Pid, call site
Lock owner, locking or unlocking site
Data collected (please refer to the caption)
PC (not masked)
PC (not masked)
Process priority and age
Process priority and age
Device attributes,request site, callback
Amount of free memory (vector)
Amount of free memory (vector)
First argument and return value
Address of handler
Destination address,port and protocol
Number of waiters
Figure 2: Vital signs and their implementation. Note that the event label always includes an executable id and a user id, and that the data collected
always includes the event label and a stack trace.
follows. We would like to differentiate between system
calls from different locations in the program. Since we
cannot obtain this address, we will try to approximate it
using a value that typically remains constant at a given
code site. We have found the value of the stack pointer
to work extremely well for this purpose. The reasoning
behind this behavior is that the stack pointer reflects the
execution path taken up to the execution of a system call,
and that the number of unique paths that lead to system
calls is relatively small for programs in general. Nontail-recursive functions that execute system calls are rare
but can unfortunately subvert this vital sign by flooding
the sketch data structure, since each level of recursion is
seen by Chopstix as a separate site. This case however, is
easy to identify, even without inspecting the source code
of the program in question, since the virtual memory addresses seen in the samples appear at constant offsets of
each other.
The trigger for sockets sends and receives is a “catchall” point for all types of sockets and lies in the filesystem
layer. It is triggered when a file descriptor is read or written to, and when its file is of type socket. The type of data
collected is the destination address, destination port and
protocol number.
Locking.
The locking vital involves mutexes and
semaphores, which cause processes to sleep when they
are accessed in locked state. Such processes are pushed
into a queue and woken up sequentially when the owner
of the lock unlocks the lock. Linux implements a fastpath for locks, which checks if the lock is available and
acquires it by atomically testing its reference count and
incrementing it. We do not modify this fastpath in the
interest of its original design. Furthermore, the locking
vital is interesting only when there is contention in the
system, which is not the case when the fastpath succeeds.
Accordingly, we modify the slow path of the locking and
unlocking operations, which are invoked when an attempt
is made to access a lock that is held by another process.
ture this event as exhaustively as possible. However, allocation sites in the kernel invoke these functions indirectly through higher-level interfaces which would normally make it necessary to trace the stack to determine
the value of the call site. We cope with this situation by
modifying the interface to these low-level page-allocation
functions so that the calling site is passed to them as a parameter. The value of this parameter is used to construct
a Chopstix event. The scope of these modifications was
minor and involved less than 10 lines of changes to the
relevant file.
User page allocation (or user memory allocation) is
triggered in response to certain page faults. Such page
faults are generated when a process touches memory that
has been allocated to it, but that has not been mapped in.
The context-switch site (i.e., the PC of the process at the
time it accessed the unavailable memory) is used in the
event label here. Usually, such sites have been observed
to lie in the neighborhood of calls to allocate memory in
user-space (e.g., malloc). However, this may not necessarily be the case as there may be a significant lag between a
process allocating memory and its actual use of it.
The data collected for both user and kernel allocations
consists of the state of free memory for various regions
of memory, such as low memory, high memory and swap.
This information can be used to study out-of-memory scenarios and at the same time reason about memory and disk
traffic.
Syscalls, Signals and Socket Operations. Triggers to
system calls and signals are implemented in the respective dispatchers. For system calls, the virtual memory address in the event label cannot correspond to the site from
which the system call was invoked (i.e., the site of context switch) for the following reason. System calls are invoked via library functions that are typically implemented
in a shared library. Thus, the calling site always has the
same value, which corresponds to the syscall function
defined in libc in Linux. We overcome this problem as
10
Test
We have modified the relevant lock data structures to contain a field identifying the owner of the lock, which is
used in the event label as well as the data collected. When
contention is noticed in the system, the owner can be referenced to determine the reason for the contention.
4.3
getpid
read
write
stat
fstat
open/close
select (10 fds)
select (500 fds)
signal handler
protection fault
pipe latency
fork+exit
fork+execve
Data Aggregator
This section discusses the design of the Chopstix aggregation engine, which is tailored to the data produced by
Chopstix.
The goal of the aggregator is twofold. First, it organizes
the information collected at multiple timescales, to filter
them with a set of user-defined transformation functions
and to pass the resulting information to the visualizer.
Second, it reconstructs the sketch data structure for each
epoch to compute the weighted sum of the vital signs for
the epoch, and the total number of unique events seen (eg.
for memory allocation, these numbers correspond to the
total memory allocated and the total number of memoryallocation sites). These actions happens in two stages:
a processing phase in which the data is aggregated and
transformed once and for all and cached, and a retrieval
phase in which contents of the cache are returned to the
requesting user. Queries for arbitrary intervals are supported but not cached. Cached retrievals are faster than
un-cached ones by about a factor of 10.
The aggregator is invoked by the visualizer when a user
requests the visualization of a given time range of activity. The main data structure used by the aggregator is a
list of queues. The number of entries in the list corresponds to the number of timescales (currently three). As
mentioned previously, the data collected by Chopstix is
organized as a set of timestamped directories. The data
aggregator reads data from these directories in chronological order. As data is read in, it is also aggregated and
transformed. Transformation functions are implemented
as queue operators, are compiled into shared libraries and
are scanned in when the aggregator is called into operation by the visualizer. When a transformation function is
added, changed or removed, all caches are invalidated.
4.4
Chopstix
disabled
0.1230
0.2427
0.2053
0.9738
0.3175
1.64
0.7411
15.3139
1.565
0.432
4.3461
69.185
259.336
Chopstix
enabled
0.1263
0.2422
0.2054
0.9741
0.3195
1.66
0.7498
15.3649
1.540
0.432
4.3940
66.8312
259.61
Slowdown
2.6%
0.2%
¡0.1%
¡0.1%
0.6%
1.2%
1.2%
0.3%
¡0.1%
¡0.1%
1.1%
¡0.1%
¡0.1%
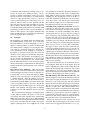
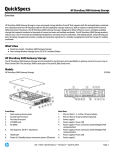
Table 1: LMbench: with and without Chopstix
tive timescale are displayed.
5
Evaluation
The effectiveness of Chopstix relies on its low overhead,
which enables it to run continuously; and its extensive
coverage of the events monitored, which prevents potentially interesting behaviors from flying under the radar.
This section evaluates these two key properties, along
with the responsiveness of the Aggregator and the Visualizer. We measure the data collection overhead through
micro- and macro-benchmarks, comparing the macrobenchmarking results to those obtained for a comparatively information-poor system profiler. We quantify coverage in terms of the probability of false negatives for
which we derive a formula. We verify empirically that
this probability is low in practice.
For our experiments, we use a system with a Core2Duo
processor and 4GB of RAM running Linux version
2.6.20.1. The performance counter hardware was configured to generate NMI interrupts for every 107 CPU cycles
and for every 6 ∗ 105 L2-cache misses. The configuration of Chopstix was set to disable all limits on the CPU
utilization that are otherwise used in adaptive sampling.
5.1
Visualizer
Data Collection
Table 1 reports the results of running the lmbench [16]
micro-benchmark with and without Chopstix. The main
takeaway is that the overhead is negligible. It exceeds 1%
only for simple operations for which the sketch update is
not amortized, but these operations are being executed in
a busy-loop that is uncommon and usually considered to
be an anomaly in a production environment.
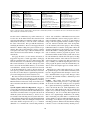
Table 2 displays the results of two macro-benchmarks:
a kernel compile and an HTTP server. These tests compare the performance of a Chopstix-monitored system
with that of a vanilla system, as well as with the perfor-
The visualizer is web-based and is implemented in
Macromedia Flash. The aggregator returns the information requested by the visualizer in two parts. The magnitudes of vital signs for each epoch are URL-encoded
and the output of the transformation functions consisting
of samples including program counters, stack traces and
other contextual information are returned in XML format.
The magnitudes of the vital signs are plotted in line graphs
in separate panes that can be overlapped. When a given
epoch is clicked on, the corresponding samples for the ac11
Test
Kernel
compile
apachebench
Chopstix
disabled
213 secs
(±4secs)
4080req/sec
(±75/sec)
Chopstix
enabled
214 secs
(±4secs)
4080req/sec
(±75/sec)
OProfile
5.3
We now analyze the probability that a qualifying event
is missed by our method of sampling. Consider an
event with frequency n, where the corresponding counter
reaches a value of N . Note that N is never smaller than
n. The counter value N could exceed n if one or more
other events with total frequency N − n collided with it.
The probability that N > n is dependent of the actual distribution of the event frequencies. While such a distribution is not known in general, we can use the total number
of events (say M ) observed during a monitoring interval,
and the size of the HCA (number of counters, say m) to
estimate the probability of collisions. Given such a distribution, the probability of false negatives can be shown to
k
be: P [unsampled|N − n, n] = N k−n NN−n
where k is blog2 N − tc, and t represents the threshold
below which nothing is sampled. Thus, the probability of
false negatives can be manipulated by varying the value
of t and the size of the HCA. In this way, these values can
be adjusted so that qualifying events are sampled with a
very high probability even when they collide with noise
events in the HCA.
Next, we experimentally evaluate this probability in the
context of a PlanetLab dataset by maintaining exact state
for a small set of events, for which collisions are resolved.
The probability of false negatives for a given vital sign is
calculated as an average over these events. At the time of
initial deployment of Chopstix, trial and error with this
experiment was used to fix the value of the HCA data
structure for various vital signs. In our current configuration, in which HCAs vary between 128 bytes and 4 kilobytes in size, the probability of false negatives for each
of the vital signs lies between 10−3 and 10−4 . That is,
Chopstix captures over 99.9% of the relevant events.
370 secs
(±13secs)
3229req/sec
(±75req/sec)
Table 2: Kernel compile and web-server performance.
mance of a system running OProfile [10]. Oprofile was
configured to track only two events—CPU utilization and
L2-cache utilization—both at the same rate as Chopstix.
It was configured to collect stack traces in its profiles.
Chopstix was configured to collect all the vitals and auxiliary information described throughout this paper.
The kernel compile was carried out using the following
steps: clean the kernel tree (make mrproper), configure the kernel (make oldconfig), reboot the system,
and compile it. For the web-server benchmark, we used a
tool named apachebench, which sends requests to the
benchmarked system over a fixed number of connections
specified at the command line. The number of connections was set to 512, and a single HTML file of about
1400 bytes was used as a target. We ran both the client
and the server on the same machine to eliminate the dependence of the experiment on the network. Both tests
were conducted 10 times for each configuration.
As shown in Table 2, Chopstix has a near-zero overhead. Moreover, when compared to Oprofile, it is effectively an order of magnitude more efficient on the kernelcompile benchmark and significantly more efficient on the
HTTP benchmark. This in spite of the fact that it is collection significantly more information. Some of the microbenchmark results give an edge to the performance of
the system with Chopstix enabled. We verified that this
difference was the result of two different kernels being
used, and that disabling Chopstix did not influence it.
5.2
Coverage of Sketches
6
Discussion
For a problem to be diagnosed using Chopstix, it needs
to satisfy two properties. First, it must have a measurable effect on the system’s behavior. A logical bug that
causes the generation of incorrect outputs in a program
falls out of scope, unless the incorrect outputs are associated with a deviation in behavior; e.g., higher latency,
smaller size of data leading to lower memory traffic, and
so on. Second, the system must stay up for at least one
Chopstix epoch from the time of the first manifestation of
the problem. “Red-button conditions,” which happen instantly whenever the appropriate trigger is set off, are not
covered by Chopstix. Sometimes, even with these properties satisfied, the problem may not be captured on the
vital signs in sufficient detail to yield a diagnosis. Still,
our experience is that situations in which no progress is
Aggregation/Visualization
The responsiveness of the combined aggregator and visualizer was measured by requesting a data set spanning
three days via the visualizer, first in uncached mode and
then in cached mode. This process was repeated 10 times.
The aggregator was configured to use six filters to postprocess the data.
The initialization of the session to the aggregator, during which the requested data is read and post-processed,
took about 80 seconds when it was not cached and about 3
seconds when it was cached. In both cases, once the session had been initialized and the data was available in the
memory of the aggregator, queries for contextual information about specific epochs completed instantaneously.
12
alization tools are also tailored to this purpose. Samples
are accounted for deterministically and restricted to the
process id and program counter. OProfile [10] is an implementation of the DCPI concept for Linux. We evaluate
the performance of Chopstix against that of OProfile in
Section 5.
Ganglia [6] is a cluster-monitoring tool that collects
system-wide totals of several high-level variables; e.g.,
CPU utilization, throughput, free disk space for each
monitored node. CoMon [19] is a distributed monitoring
tool deployed on PlanetLab that is similar to Ganglia in its
functioning. At the usability level, the difference between
Chopstix and these tools is in the depth of information
available and the type of variables monitored. Chopstix
focuses on low-level variables and saves contextual detail
while CoMon and Ganglia focus on high-level variables
(uptime, boot state, free disk etc.) and track only systemwide totals. At the functional level, they serve a different
purpose. The role of tools like CoMon and Ganglia is to
help flag misbehaviors (e.g., “a node went down”) while
the role of Chopstix is to explain such misbehaviors.
Dtrace [3], kprobes [18] and JIT-i [17] facilitate the insertion of custom code into the OS kernel at run time.
Such code can be used to perform arbitrary actions, but
it is typically used to collect debugging information for
fault diagnosis. These tools are difficult to apply to the
type of problems addressed by Chopstix as they require
the search space first be narrowed to a set of candidate
code sites to be instrumented. Furthermore, there is no
explicit provision to manage large amounts of data if the
instrumented site is executed with a high frequency. On
the other hand, these tools function well as companions
to Chopstix, as they can be used to instrument code sites
that Chopstix identifies as being of interest.
Recently, techniques have been developed to deal with
system bugs without requiring an intervention from a programmer. Triage [25] and Rx [21] are tools that use
lightweight re-execution support to respond to bugs in this
way. Triage revisits the point of failure repeatedly in an
attempt to isolate the condition that led to the bug. Rx on
the other hand tries to eliminate such conditions. Both of
these tools require a characterization of a problem to the
extent of attributing it to a given application and defining the condition of failure (e.g., a segmentation fault at
a given virtual address). This point reaffirms the value
of Chopstix in providing such characterizations and completing the chain of diagnosis.
There have also been several tools for deterministic replay [7, 11, 24]. These are alternative approaches to using
Chopstix. These tools are typically invasive, imposing
high CPU overheads, generating large volumes of data
made at all in the diagnosis are rare.
Chopstix requires the kernel running on monitored
nodes to be extended with a patch that implements the
event triggers. The data collection mechanism is implemented as a pluggable kernel module. CPU utilization and L2-cache-miss performance counters should be
supported by the processor for the corresponding vital
signs to be activated. Software into which stack-tracevisibility is desired needs to be compiled with framepointer support. In order for instruction addresses to be
translated into code sites, programs need to include debugging information—and their source code needs to be
available on the centralize analysis server where the aggregator runs—not on the monitored node.
We do not believe that Chopstix needs any special OS
support that ties it to Linux (or UNIX), as the vital signs
of Chopstix are common across all OSes. Still, there
are specific features, such as the retrieval of a pathname
using a directory cookie, which will likely have to be
reimplemented if it is ported to another OS. Event labels
and event samples may also have to be populated otherwise depending on the specific implementation of callback functions and request-response semantics in the target OS. However, the high-level information conveyed by
these items should stay the same.
7
Related Work
A plethora of diagnostic tools are available. They are
related to Chopstix through the mechanism they implement (e.g., profilers, monitors) or through their common
purpose (e.g., interactive debuggers, deterministic replay
tools, dynamic instrumentation tools). The former are
geared more towards performance tuning than failure diagnostics and have fundamental differences at the mechanistic level, in spite of similarities. For example, Chopstix uses sketches to streamline its data and is hence able
to collect numerous types of data in extensive detail. To
the best of our knowledge, Chopstix is the first diagnostic tool to use such data collection technique. As for the
latter set, Chopstix differentiates itself by attacking problems that cannot be reproduced or localized. To this end,
Chopstix can be used in conjunction with many of these
tools by helping to localize and characterize problems that
can then be debugged using standard tools.
More specifically, DCPI [1] is a profiler designed to run
continuously on production systems. The goal of DCPI
is profiling to optimize system performance, not diagnosis to find faults and anomalies. This objective makes it
focus on processor events that aid in uncovering inefficiencies at the instruction level, answering questions such
as “how long did a particular instruction stall on average
because of a cache miss”. Its post-processing and visu13
modified to add to the contextual state of event samples
collected. Finally, we would like to add more automation
to the post-processing tool-chain, perhaps through the use
of machine learning techniques to classify symptoms.
and requiring that systems be shut down for diagnosis.
They are thus less appropriate for use on production systems. Other tools collect execution histories in the same
way Chopstix does [26, 15]. However, the type of information they collect and the types of symptoms they handle are quite different from the ones in Chopstix.
Recent research has proposed the use of statistical pattern classification techniques to classify system state as
being normal or erroneous [? ? ]. Their training data is
based on user-defined Service-Level Objective functions
that indicate when the state of the system is inconsistent
as a function of low-level properties such as CPU utilization. Their approach, in contrast to Chopstix’ approach is
“knowledge-lean” as it does not require online guidance
from the programmer to detect problems. However, their
method enables root-cause analysis only for a known set
of problems for which Service-Level Objectives are defined and have been annotated with a root cause. Chopstix enables diagnosis based on the study of comprehensive event logs carry detailed information to allow rootcause analysis in cases in which a problem is discovered.
The granularity of its data is also much finer than the
works in question, which do not operate at the instruction
and block level. We believe that leveraging these techniques (and machine learning in general) in Chopstix can
enhance problem detection by automating the correlation
between system failures and the state of the system as it
is described by Chopstix’ logs.
8
References
[1] J. M. Anderson, L. M. Berc, J. Dean, S. Ghemawat, M. R. Henzinger, S.T. A. Leung, R. L. Sites, M. T. Vandevoorde, C. A. Waldspurger, and W. E.
Weihl. Continuous profiling: where have all the cycles gone? ACM Trans.
Comput. Syst., 15(4):357–390, 1997.
[2] B. Beizer. Software Testing Techniques. International Thomson Computer
Press, June 1990.
[3] B. Cantrill, M. W. Shapiro, and A. H. Leventhal. Dynamic instrumentation
of production systems. In USENIX Annual Technical Conference, General
Track, 2004.
[4] C. Estan, K. Keys, D. Moore, and G. Varghese. Building a better netflow. In
SIGCOMM ’04: Proceedings of the 2004 conference on Applications, technologies, architectures, and protocols for computer communications, pages
245–256, 2004.
[5] L. Fan, P. Cao, J. Almeida, and A. Z. Broder. Summary cache: a scalable
wide-area web cache sharing protocol. In SIGCOMM ’98: Proceedings of
the ACM SIGCOMM ’98 conference on Applications, technologies, architectures, and protocols for computer communication, 1998.
[6] Ganglia Development Team.
Ganglia monitoring system.
URL:
http://ganglia.info.
[7] D. Geels, G. Altekar, S. Shenker, and I. Stoica. Replay debugging for distributed applications. In Proceedings of the annual conference on USENIX
’06 Annual Technical Conference, 2006.
[8] S. L. Graham, P. B. Kessler, and M. K. McKusick. gprof: a call graph execution profiler. In SIGPLAN Symposium on Compiler Construction, pages
120–126, 1982.
[9] Intel.
VTune performance analyzer homepage:
developer.intel.com/software/products/vtune/index.html.
[10] John Levon et al. OProfile - a system profiler for ulinux. URL:
http://oprofile.sourceforge.net/doc/index.html.
[11] S. T. King, G. W. Dunlap, and P. M. Chen. Debugging operating systems
with time-traveling virtual machines. In Proceedings of the annual conference on USENIX Annual Technical Conference, 2005.
[12] A. Kumar, M. Sung, J. Xu, and J. Wang. Data streaming algorithms for
efficient and accurate estimation of flow size distribution, 2002.
[13] A. Kumar and J. Xu. Sketch guided sampling - using on-line estimates of
flow size for adaptive data collection. In Proc. IEEE INFOCOM, 2006.
[14] A. Kumar, J. Xu, J. Wang, O. Spatschek, and L. Li. Space-code Bloom filter
for efficient per-flow traffic measurement. In Proc. IEEE INFOCOM, Mar.
2004.
[15] B. Liblit, A. Aiken, A. X. Zheng, and M. I. Jordan. Bug isolation via remote
program sampling. In PLDI ’03: Proceedings of the ACM SIGPLAN 2003
conference on Programming language design and implementation, 2003.
[16] L. McVoy and C. Staelin. lmbench: portable tools for performance analysis. In Proceedings of the annual conference on USENIX Annual Technical
Conference, 1996.
[17] M. Olszewski, K. Mierle, A. Czajkowski, and A. D. Brown. JIT instrumentation: a novel approach to dynamically instrument operating systems.
SIGOPS Oper. Syst. Rev., 41(3), 2007.
[18] P. S. Panchamukhi. Kernel debugging with kprobes: Insert printk’s into the
linux kernel on the fly. URL: http://www.ibm.com/developerworks/library/lkprobes.html.
[19] K. Park and V. S. Pai. Comon: a mostly-scalable monitoring system for
planetlab. SIGOPS Oper. Syst. Rev., 40(1):65–74, 2006.
[20] L. Peterson, A. Bavier, M. E. Fiuczynski, and S. Muir. Experiences building
planetlab. In OSDI ’06: Proceedings of the 7th symposium on Operating
systems design and implementation, 2006.
[21] F. Qin, J. Tucek, Y. Zhou, and J. Sundaresan. Rx: Treating bugs as
allergies—a safe method to survive software failures. ACM Trans. Comput.
Syst., 25(3), 2007.
[22] SGI. KDB - built-in kernel debugger. URL: http://oss.sgi.com/projects/kdb.
[23] B. Sprunt. The basics of performance-monitoring hardware. IEEE Micro,
22(4):64–71, 2002.
[24] S. M. Srinivasan, S. Kandula, C. R. Andrews, and Y. Zhou. Flashback:
a lightweight extension for rollback and deterministic replay for software
debugging. In Proceedings of the annual conference on USENIX Annual
Technical Conference, 2004.
[25] J. Tucek, S. Lu, C. Huang, S. Xanthos, and Y. Zhou. Triage: diagnosing production run failures at the user’s site. In SOSP ’07: Proceedings of twenty-
Conclusion
This paper describes Chopstix, a tool that helps track
down the intermittent, non-reproducible problems that often make maintaining production systems a challenge.
Chopstix captures misbehaviors by logging all behavior
on the system in the form of succinct summaries that contain logs of low-level OS events. We think of these events
as representing the system’s vital signs, and the diagnosis
problem as one of looking for symptoms that correspond
to unusual variations in (and correlations among) these vitals. Using Chopstix, it is possible to isolate intermittent
failures in enough detail to allow traditional debugging
tools to be applied.
The key enabler for Chopstix is a randomized data
structures called sketches, which results in a negligible
overhead (1% CPU utilization) and high coverage (99.9%
of the relevant events). We have used Chopstix to troubleshoot problems that we were not able to diagnose using
existing tools.
The next step for Chopstix is to look for correlations
across multiple monitored nodes to find network-wide
bugs. We would also like to correlate Chopstix data with
network-level flow logs, and to allow applications to be
14
first ACM SIGOPS symposium on Operating systems principles, 2007.
[26] C. Verbowski, E. Kiciman, A. Kumar, B. Daniels, S. Lu, J. Lee, Y.-M. Wang,
and R. Roussev. Flight data recorder: monitoring persistent-state interactions
to improve systems management. In OSDI ’06: Proceedings of the 7th symposium on Operating systems design and implementation, 2006.
[27] J. Yang, P. Twohey, D. Engler, and M. Musuvathi. Using model checking to
find serious file system errors. ACM Trans. Comput. Syst., 24(4):393–423,
2006.
[28] X. Zhang, Z. Wang, N. Gloy, J. B. Chen, and M. D. Smith. System support
for automatic profiling and optimization. SIGOPS Oper. Syst. Rev., 31(5):15–
26, 1997.
15