1
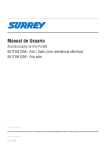
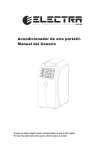
Installation and Operating Instructions for Air-Bubbler Differential Pressure Aquagauge Tank Level Telemetry System. ______________________________________________________________ Liquid depth is measured using a pressure sensor at the top of a column of air extending to the bottom of the storage tank and this air line is periodically purged and refilled by an air pump. By these means the pressure sensor and associated electronics are always isolated from the liquid. Backpressure is measured at regular intervals and compensated for changes in atmospheric pressure. These measurements are automatically converted to a depth reading using a preset value of the liquid density. This technique is particularly applicable to many liquid hydrocarbons since in these instances there must be no possibility of any electrical contact that may cause an explosion. The system must only be used in a vented storage tank. The system uses 433MHz transmitter and receiver modules and has a range of about 0.5-1.5km clear line of sight. The standard air line is 5 meters long. Tank Level Pressure Sensor and RF Transmitter (Figure 1.) Installation. • Lower the air line with attached sinker through an appropriate hole or opening above the maximum level in the tank and ensure that the end of the hose is sitting on the bottom of the tank. Excess air line can be pushed into the tank. • Plug in the solar panel power supply to the 2-pin socket on the side of the transmitter. • The unit can be set to calculate liquid depth based on the density of the liquid at 20 C. Liquids ranging in density from 0.7 to 1.3 g/mL can be measured. (The default setting is for diesel fuel with a standard density of 0.832 g/mL) • The air pump will purge the air line once every 10 seconds for 3 minutes from startup then once every 30 seconds thereafter. • Normally one depth reading is transmitted approximately every 10 seconds 0 RF Receiver and Display Unit (Figure 2.) Installation. • Mount the receiver antenna as high as possible and as close to line-of-sight to the transmitter as practicable. • The receiver /display unit has a single external power supply and an internal battery pack (4AA). Plug in the 240V AC to 9V DC power adapter to the display unit and depress the display “ON/OFF” key. Press the “DISPLAY” key to switch between sensor readings. • The display will initially show ”0” and if no RF signal is being received from any sensor then “Nil" will be displayed after about 4 minutes. • The display will retain a reading for about 4 minutes if no new data is received. The unit must therefore be periodically switched on and off when testing reception range. Note: The 5W 12V solar panel will require at least an average of 2.5 hr full sunlight per day over any 4 day period to keep the 12V 2.4Ah lead acid battery fully charged. If the system is intermittently shutting down due to lack of electrical power then a higher power solar panel should be used. Electrosense Technologies 2012 1 Data Logging and Charting Software Option. If the system has been purchased with the optional serial data collection package (for WINDOWS 95 or later WINDOWS operating system) then the AQUACHART software supplied on CD will need to be installed. Insert the CD and run the setup program and follow the instructions. Once installed connect the supplied serial cable to the socket on the AQUAGAUGE display unit and an available serial port on the PC. If the PC has USB ports but no serial port you will need to use a USB to serial converter cable. Install the software that comes with the USB/serial converter and locate the COM port number assigned to the device using the Windows Control Panel/ System/ Hardware/ Device Manager tool. Check that the chosen serial port is not allocated to other software running on the PC. Start the AQUACHART software and select appropriate data collection parameters as follows: Serial Port: select the COM port to which the serial cable is connected. Make sure that no other software is using the com port that you connect to. Data Storage Buffer Size: default size is 51200. This value will determine the number of data points available for display in the main text box. If the data buffer size is exceeded it will automatically be saved and appended to a file named Aquachart_overflow_data.txt Time Interval Between Readings: Choose an appropriate interval for data collection Initial x-axis Span: Determines the initial time span for the data plots. The START button commences data collection The STOP button stops data collection The CLEAR button erases all data The PRINT button prints the graphs The SAVE button will save the data displayed in the text box in a text file of choice Drag handles are provided on the charts for data rescaling and a cursor can be used to determine x,y values at any position on both charts. OPTIONAL DATA LOGGING AND CHARTING SOFTWARE Electrosense Technologies 2012 2 Figure 1. Pressure sensor /transmitter unit Electrosense Technologies 2012 3 Figure 2. Receiver /display. Electrosense Technologies 2012 4 SYSTEM INSTALLATION DIAGRAM Transmitter unit Differential pressure sensor Non-return valve Atmospheric pressure Air pump Solar /battery power supply Microprocessor RF module Air line to tank Solar panel and rechargeable battery RF receiver /display unit Depth =123cm Water tank Air line Power supply PC with charting software (Optional) Sinker Electrosense Technologies 2012 5