1
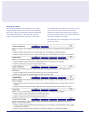
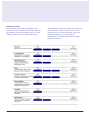
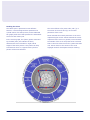
> SHL Sales Report User Manual SHL Sales Report User Manual Page 1 A Guide to the SHL Sales Report 3 Using this report 4 Sales Foundations 5 Motivation 8 Sales Cycle 11 Sales Profile 15 More Information 17 SHL Sales Report User Manual Page 2 A Guide to the SHL Sales Report Introduction The SHL Sales Report is a sophisticated measurement of an individual’s personal styles in a sales context. This report uses a sales competency model that has been psychometrically validated and tested in a wide variety of sales roles. It provides an accurate measure of an individual’s strengths and weaknesses in a sales context. This report is ideal for both selection and development. It provides a snapshot of an individual’s natural styles in key areas that are critical to sales success (the Sales Foundations). It also offers insights into what motivates an individual (the Sales Motivation section), critical in understanding aspects of motivation to keep sales people performing at their peak. Finally, it presents a unique view of the individual within a typical Sales Cycle. This helps to understand how an individual is likely to perform in specific sales situations. (e.g. Closing the Sale vs. Making Contact.) The SHL Sales Report is based on the results of the Occupational Personality Questionnaire (OPQ32) and optionally the Motivation Questionnaire (MQ). The OPQ is a well-known and respected personality questionnaire. It is used by thousands of companies around the world, and is based on more than 20 years of research and validation evidence. Please refer to the SHL Sales Report Technical Manual for detailed validation and development information for this report. The information in this report can be applied without specific training or knowledge. All of the factors in the SHL Sales Report are shown to relate to sales effectiveness. However, to correctly apply the results of the sales report to a particular job, the results of a job analysis should be consulted to determine which factors are likely to be related to success in a given job and which are not. Only the factors that are essential and/or relevant to job performance should be used when making selection decisions for a specific job. (In some cases, it may be appropriate to also consider desirable factors that are relevant for future potential.) It is the user’s responsibility to ensure the use of this tool conforms to local guidelines and legislation governing selection procedures. Further evidence from interviews and other relevant assessments should be sought during the selection process to determine the applicant’s suitability. This information provided in the SHL Sales Report is also suitable for identifying a candidate’s strengths and development areas. The Motivation Questionnaire is a self-report questionnaire that offers a comprehensive understanding of the situations that will increase and reduce an individual’s motivation. Since the MQ is optional, the Sales Report will leave the graphs in the Motivation section blank if the MQ is not completed. SHL Sales Report User Manual Page 3 Using this report The SHL Sales Report has four main sections: Sales Foundations Motivation Sales Cycle Sales Profile The results displayed in the Sales Foundations section are based on the findings from the OPQ32. The section focuses on factors that are important to sales effectiveness in most sales situations. While the relevance of these factors may vary from job to job, these are key factors that apply to most sales roles. The Motivation section focuses on motivators that typically influence sales effectiveness. These scores are based on the results of the MQ. Motivation is the force that drives an individual to perform. Motivation determines how much energy someone will channel into a job and what can help someone maintain this energy. Motivation can have a significant impact on output and success. The Sales Cycle section is also based on the OPQ32 results. It focuses on factors that are important in a typical sales process. It indicates the likely effectiveness of an individual in eight critical stages of a sales process. Understanding an individual’s natural strengths in the sales cycle can help to determine the type of sales environment in which s/he can be most effective. It can also identify areas where development or training can improve overall effectiveness. The Sales Profile is the last section of the report. It presents the data from the Sales Foundations, Motivation, and Sales Cycle sections in a single page. This Sales Profile section makes it convenient to match this individual profile with factors required for specific sales situations or roles. SHL Sales Report User Manual Page 4 Sales Foundations There are six Sales Foundations: Sales Confidence Sales Drive Sales Resilience Adaptability Listening Embracing Change The Sales Foundation section describes a candidate’s fundamental sales orientation. Each of these factors has been shown to influence sales success across a variety of sales situations. As a general rule, a higher level in any factor is preferred for most sales roles. However, some factors may be more or less relevant in different sales situations. The user should determine which factors are more and less relevant for a specific situation (see Introduction). The Sales Foundation factors relate to sales effectiveness in most sales situations. The bar chart indicates the level of strength in each area. The definition for each factor is shown immediately below the bar graph. Descriptions of high and low scores are presented below each definition. These ratings can identify areas of strength that can be harnessed to improve sales effectiveness. They can also identify key areas where targeted development and/or training may improve sales performance. Sales Confidence Sales Confidence measures the amount of confidence this individual typically exhibits in sales situations. This includes the ability to stay relaxed in stressful situations. Individuals with higher scores tend to be very self-confident even in challenging and stressful situations. Individuals with lower scores may be shy or reserved. SHL Sales Report User Manual They may seem to be intimidated or uncertain in some situations. Research shows that the degree of social confidence, being less modest and having a tendency to worry less then others has an impact on Sales Confidence Sales Drive Sales Drive measures how strong someone’s desire is to prevail as a sales person. Generally, people with a higher Sales Drive will generally find it natural to “stick it out” and their strong salesoriented drive makes them think of effective ways to get a client to buy. They will tend to exhibit constant activity and will always seem to be in “sales mode.” In contrast, people with lower Sales Drive typically lack the need to constantly drive forward with a sales pitch and may not exhibit a constant push for sales activity. Research shows that the degree of achievement orientation and competitiveness and the enjoyment of vigorous activity have an impact on Sales Drive. Sales Resilience Sales Resilience measures the individual’s ability to ignore personal criticism, to focus on the positive and to approach work in a relaxed fashion. Generally, people with a higher Sales Resilience are seen as people who do not give up easily, and even when faced with tough circumstances can maintain a positive outlook. In contrast, people with lower Sales Resilience are probably more readily affected by adversarial circumstances and are more likely to give up when the going gets tough. Research shows that the degree of tough mindedness and optimism and the ability to be relaxed influence the degree of Sales Resilience. Page 5 SHL Sales Report User Manual Page 6 Adaptability Adaptability measures the personal sensitivity to identify how to best respond to a customer. It also measures an individual’s flexibility to adopt the personal approach of dealing with a particular customer in order to maximize the likelihood of success in a given situation. Individuals with higher scores are sensitive to others and very flexible and deliberate in the way they behave in front of customers. Individuals with lower scores do not as readily adjust their style or approach based on specific situations or people. in workflow. Individuals with higher scores deal effortlessly with changes of policy and workflow, showing the ability to quickly adapt to changing work conditions. Individuals with lower scores don’t react as efficiently or positively to situational or organizational changes. Research shows strong connection between personal preference to be not conventional, to think conceptually, to seek variety and to be adaptable and Embracing Change. Research shows that individuals with a high score in this factor describe themselves as adaptable and enjoy analyzing people and their behavior. Listening Listening provides a broad measure of how well someone tends to listen to others and how much they ensure that their communication is understood. It also includes being sympathetic and empathetic, and observing and interpreting other peoples' behavior. People with higher scores listen attentively and relate well to others. People with lower scores tend to come across as poor listeners. Research shows a strong tie between Listening and the preference to deal with others democratically, the tendency to care about others, and the degree to which someone tries to understand motives and behaviours of others. Embracing Change Embracing Change is relevant in organizations that tend to change frequently or in situations where changes in the sales process occur. Embracing Change measures how an individual is able to quickly adapt to dramatic and continued changes in the workplace or environment and how well and individual can likely respond to changes SHL Sales Report User Manual Page 7 Reading the Chart The Sales Foundations are displayed in the report using a simple 5-point scale. The blue bar indicates how much a person represents behavior associated with a particular factor. A bar with just one blue segment indicates that the individual is not likely to exhibit behaviors related to the factor. At the other end of the scale, a bar with five blue segments indicates that the person is high on a particular factor and is very likely to show the behaviors related to the factor. The definitions of low and high scores are shown below the scales. SHL Sales Report User Manual Page 8 Motivation This section is generated from the Motivation Questionnaire and identifies specific motivators. The conditions present at work that drive an individual’s motivation are called motivators. Motivators describe what influences an individual’s drive and determination to succeed. The bar charts below indicate how effective each motivator can be in driving an individual’s behavior. The definition for each motivator is also presented. The information provides a look at how an individual feels he/she can be motivated. A high score indicates that a motivator might work very effectively to influence behavior or results. A low score indicates that this type of condition does not have an enhancing impact on the individual’s performance. It is important to recognize that these factors indicate what motivates an individual but these factors do not necessarily indicate how much an individual is motivated. The Sales Drive factor in the Sales Foundations section is a better indicator of overall sales motivation. An individual that has many “Very Motivating” factors can be motivated in many different ways. In contrast, an individual that has more motivators that fall in the “Not Motivating” category may indicates that s/he requires very specific conditions to feel motivated. Identifying motivators that are effective for an individual provides an opportunity to understand what is likely to drive their sales performance. For example, knowing that an individual is very motivated by Money may encourage a focus on jobs and sales situations that provide high earnings potential. Someone highly motivated by Growth is well suited for positions that offer ongoing development and training opportunities. SHL Sales Report User Manual Money Money measures how important money, salary, commissions, and bonuses are as a motivator. Those who score high on this factor can be demotivated if there is no connection between salary and effort or if the monetary rewards are too low. They generally work better when they feel that the job pays well and rewards are linked to effort and success. Low scores indicate a lesser need for a strong link between material rewards and the job, and increased pay is less likely to increase motivation. Competition Competition measures the level of motivation created by competing with others or situations where performance can be directly compared with others. High scorers feel spurred when there is competition and comparison between peers, and can be exhilarated by being the best and coming out ahead. Low scorers generally don’t find competitive situations motivating, and may not invest additional energy to win in a competitive sales situation. Achievement Achievement measures the extent to which tough goals and personal performance is important. Individuals who are highly motivated by achievement value being ‘stretched’ and having their abilities challenged. When there is nothing to achieve they typically don’t invest additional energy. Low scorers are not motivated when faced with difficult or ‘stretch’ targets. They may prefer not having specific targets, and may find targets to be demotivating. Page 9 SHL Sales Report User Manual Page 10 Pace Pace measures the level of motivation obtained from managing lots of activity and having a busy schedule. Those motivated by a fast pace have a need to be constantly on the go, are driven by pressure, and like to accomplish large volumes of work. Low scorers are generally more motivated when they can take their time completing tasks and allow events to proceed at their own pace. Enormous volumes of work and work pressure can decrease motivation for low scorers. Social Contact Social Contact measures the extent that having contact with others is a motivator. High scorers are motivated to work in an environment that offers the opportunity to meet many people and to collaborate with peers. Low scorers feel neutral about the prospect of working with others, and some are even demotivated by collaboration. Low scorers are not overly motivated by opportunities to acquiring new skills and by personal development. Autonomy Autonomy measures how less structured and flexible environments motivate people. High scorers have a need to work without strong supervision. They are driven by their own initiative and prefer the flexibility of organizing their work as they see best. Imposed constraints will generally reduce their motivation. Low scorers feel indifferent about the degree to which they are supervised. The lack of supervision might even reduce their motivation. Recognition Recognition measures the motivation generated from praise and the recognition for good work. High scorers are motivated by congratulations and recognition for work well done. Lack of praise or no recognition for good work generally reduces their motivation. Low scorers are generally not motivated by recognition. Growth Growth measures the motivation from personal development opportunities and the development of new skills. High scorers are motivated by opportunities to acquiring new skills and by personal development. They feel less motivated when these opportunities are not available. SHL Sales Report User Manual Page 11 Reading the Chart The bar charts in the report how effective each motivator can be in driving an individual’s behavior. The definition for each motivator is shown in each category. Lower scores are represented by bar SHL Sales Report User Manual charts with fewer segments; higher scores will have more segments in the bar chart. The bar charts indicate how well a certain motivator works for a particular individual. Low scores indicate indifference to a motivator; high scores indicate stronger motivation. Page 12 Sales Cycle The Sales Cycle displays the individual’s preferences using factors that are important in a typical sales cycle. Each factor indicates the likely effectiveness of an individual in one of eight critical stages of the sales process. Looking at the Sales Cycle profile helps to determine where in a typical sales cycle this person will be most effective. Developing a Game Plan Developing a Game Plan measures elements in the sales cycle such as market analysis, understanding product positioning, effectively planning sales activities and analyzing and using product strengths to increase sales success. High scorers tend to analyze and conceptualize the market, their product(s) and understand how they will approach market opportunities. Low scorers do not naturally analyze and conceptualize opportunities, and may not overtly plan their attack before entering into sales situations. Research shows that the degree of interest in working with and using data, conceptual thinking, and the degree to which one evaluates information critically influence Developing a Game Plan. Making Contact Making Contact measures elements in the sales cycle such as initiating contact with new clients, cold calling, building networks, and starting relationships with potential acquaintances to convert them to business opportunities. High scorers are likely to be outgoing in nature, are comfortable breaking the ice, easily approach others with confidence, and will have some creativity. Low scorers are not as outgoing and generally won’t find it as easy to approach new contacts. SHL Sales Report User Manual Research shows that the level of persuasion, affiliative and outgoing behavior, social confidence and flexibility in social situations as well as a general feeling of relaxedness influence Making Contact. Building Desire Building Desire measures the factors that relate to engaging clients in an emotional sale, creating a preference to buy, and developing a sense of urgency or loyalty for a product or service. High scorers are savvy in the way they deal with customers, can read customers’ actions carefully, and can manipulate customer perceptions to maximize the effectiveness of their sales activity. Low scorers may lack smoothness in their style with the customers and they are less likely to influence the customer’s buying decision on an emotional level. Research shows that the level of persuasiveness, outgoing and socially confident behavior, and an interest in understanding how people behave influence the strength of Building Desire. Creating Options Creating Options measures factors relating to the capability to correctly understand and integrate client information into a coherent and conceptually sound proposal or offering. It also measures the degree of innovation in both the types of solutions proposed and the form of the proposal. High scorers are generally highly analytical and can digest large amounts of information; they understand the core of the issue and can add a creative touch to proposed solutions. Low scorers are less analytical and rely less on using data for propositions and proposals. Research shows that the degree of critical evaluation, conceptual thinking, level of innovation, being less conventional and not feeling restricted by Page 13 procedures influence Creating Options. SHL Sales Report User Manual Page 14 Presenting Presenting measures the factors related to presentation ease and comfort and the ability to confidently present products and/or solutions in an engaging manner. High scorers easily connect with others, present themselves and their solutions with confidence and persuasiveness. They present complex information in a clear and comprehensive way. Low scorers are less apt to connect with others, are not as self-confident and may not be able to comprehensively present complex facts. Research shows that the level of persuasiveness, social confidence, conceptual thinking and being able to digest information critically influence Presenting. Closing the Sale Closing the Sale deals with factors that influence bringing business home, pushing for closure, managing the client effectively, dealing with objections, and negotiating price and conditions of sale. High scorers effectively manage the relationship to maximize the commitment and see the deal through to completion. Their persuasive and take-charge approach tends to help pressure decision makers into action. Low scorers are less apt to push for closure or action, and don’t typically place emphasis on influencing the sales process after the proposal has been presented. client, and the extent to which one takes all steps necessary to satisfy a customer. High scorers follow up on all details diligently and relentlessly. Low scorers may drop the ball on a couple of details and prone to miss some detail. Research shows that the detail consciousness and conscientiousness have a key role in Satisfying the Customer. Managing and Growing Managing and Growing covers factors relating to maintaining the customer relationship after a sale is completed and looking to identify emerging needs and new business opportunities from existing clients. High scorers are typically highly conscientious and show a good understanding of the client and their needs. Low scorers typically aren’t as driven to grow existing accounts and may not be as in tune with customer relationship management that is typical for strong ‘farmers’. Research shows that the level of take charge behavior, conceptual understanding and long-term thinking, the level of conscientiousness, and achievement orientation impact Managing and Growing and impact an individual’s predisposition to farm an account. Research shows that being persuasive and controlling have a significant influence on Closing the Sale. Satisfying the Customer Satisfying the Customer measures the factors involved in post sale care. It looks at the level of focus and persistence in follow-up, how effectively a sales person monitors the deliverable to the SHL Sales Report User Manual Page 15 Reading the Chart The Sales Cycle is presented in two different formats: a circular diagram that represents the cyclical nature of a sales process, and a traditional bar graph profile chart that presents the individual’s scores for each sales cycle. In the circular graph, the (white) points connected by the bold (blue) line indicate the likely effectiveness of an individual in eight critical stages of the sales process. This profile can help to determine where in a typical sales cycle this person will be most effective. SHL Sales Report User Manual The scores follow a five-point scale, with (1) in the center of the circle and (5) on the outer perimeter of the circle. Points towards the outside perimeter of the circle represent higher scores. Points towards the center represent lower scores. In general, scores towards the outside of the circle are preferred in each area that is critical to sales success for a particular sales role. Scores closer to the center of the circle highlight areas for development and/or training. Page 16 Reading the Chart The blue bar indicates how much a person represents behavior associated with a particular factor. A bar with just one blue segment indicates that the individual is not likely to exhibit behaviors related to the factor. At the other end, a bar with five blue segments indicates that the person is high on a particular factor and is is very likely to show the behaviors related to the factor. SHL Sales Report User Manual Page 17 Sales Profile This section provides an overview of an individual’s results. If this information is used to match a candidate against a profile of a specific sales job, the factors should be weighed according to their relevance. It is important to determine which factors are critical to success in that specific role. Typically, before a comparison between an individual’s profile and an ideal sales job profile is made, information from a job analysis is used to differentiate between factors that are essential, important and nice-to-have. (The “Important for Success” column in the chart on page 16 can be used to record these findings). Because Motivators help to drive success on an individual basis, they should not be compared against an ideal profile specific to a job or situation. Instead, they should be reconciled against motivators likely to be available to the individual and those that are not. Although the information in this report represents an accurate assessment of the individual’s sales factors and motivations, it is important to remember that all information presented in the report is based on a self-report questionnaire. There are many other factors that can also have an impact on sales effectiveness. Therefore, if this report is used to match an individual with an ideal job profile, it is important that additional information on experience, knowledge, and ability is considered when evaluating the fit. SHL Sales Report User Manual Page 18 SHL Sales Report User Manual Page 19 More Information The SHL Sales Report was developed in line with accepted professional standards for the development of psychometric instruments for use in employment contexts. Validation of the model is based on the results from seven different studies with a total N of 1469. In all seven studies, 14 constructs showed predictive potential. These studies provide good support for the general validity of the model for sales roles and for its ability to be sensitive to differences between situations. The model was tested on OPQ32™ data collected in North America, Europe and the UK in 2005 and on data collected in Singapore and Malaysia in 2004. The validation studies cover a wide range of sales jobs, differing types of sales criteria (sales assessment centre ratings, supervisor performance ratings and hard sales data) and very different organizations and cultures. As expected, the pattern of relationships between sales success and sales performance criteria and the personalitybased measures of competency potential (from the OPQ™) do vary from study to study in a meaningful manner. The differences in patterns of predictive competencies can be explained in terms of differences in organizational culture, economic life cycle status and industry between the different samples. More information about the SHL Sales Report is available from your local SHL office or affiliate. Global and local SHL representatives can be reached via the web at http://www.shl.com. SHL Sales Report User Manual Page 20 More Information Copyright © 2006 - 2007 SHL Group ltd www.shl.com SHL and OPQ are trademarks of SHL Group ltd. No part of this publication may be reproduced, stored in a retrieval system, or transmitted in any form or by any means, electronic, mechanical, photocopying, recording, scanning, or otherwise, except as permitted under Section 107 or 108 of the 1976 United States Copyright Act, without either the prior written permission of the Publisher. Requests to the Publisher for permission should be addressed to the address above. SHL Sales Report User Manual Page 21