1
HelpAndManual_unregistered_evaluation_copy
FastReport 3.0
User's Manual
© 1998-2006 FastReports Inc.
I
FastReport 3.0 User's Manual
Table of contents
I
2
Chapter I Designer
1 Control keys
................................................................................................................................... 3
2 Mouse control
................................................................................................................................... 3
3 Toolbars ................................................................................................................................... 4
Designer mode
.........................................................................................................................................................
bar
4
“Standard”.........................................................................................................................................................
toolbar
5
“Text” toolbar
......................................................................................................................................................... 6
“Frame” toolbar
......................................................................................................................................................... 7
“Align” toolbar
......................................................................................................................................................... 7
4 Designer options
................................................................................................................................... 8
5 Report settings
................................................................................................................................... 9
6 Page options
................................................................................................................................... 11
14
Chapter II Creating reports
1 Report objects
................................................................................................................................... 14
2 “Hello, World!”
...................................................................................................................................
report example
15
3 The “Text”
...................................................................................................................................
object
16
4 HTML-tags
...................................................................................................................................
in the “Text” object
19
5 Displaying
...................................................................................................................................
expressions with the help of the “Text” object
19
6 Bands in...................................................................................................................................
FastReport
21
7 Databands
................................................................................................................................... 23
8 Connecting
...................................................................................................................................
to the database
23
9 “Customer
...................................................................................................................................
List” report
24
10 Displaying
...................................................................................................................................
DB fields with the help of the “Text” object
27
11 Aliases ................................................................................................................................... 28
12 Variables................................................................................................................................... 29
13 “Picture”...................................................................................................................................
object
31
14 Report with
...................................................................................................................................
pictures
33
15 Multi-lined
...................................................................................................................................
text displaying
34
16 Data splitting
................................................................................................................................... 36
17 Text wrap...................................................................................................................................
of objects
39
18 Displaying
...................................................................................................................................
data in the form of a table
40
19 Printing labels
................................................................................................................................... 43
20 Child-bands
................................................................................................................................... 45
21 Shifting objects
................................................................................................................................... 46
22 Report with
...................................................................................................................................
two data levels (master-detail)
48
© 1998-2006 FastReports Inc.
Table of contents
II
23 Headers and
...................................................................................................................................
footers of a data band
51
24 Report with
...................................................................................................................................
groups
53
25 Other group
...................................................................................................................................
features
55
26 Lines numbering
................................................................................................................................... 57
27 Aggregate
...................................................................................................................................
functions
58
28 Page and...................................................................................................................................
report totals
61
29 Inserting...................................................................................................................................
aggregate function
62
30 Values formatting
................................................................................................................................... 63
31 Inline formatting
................................................................................................................................... 64
32 Conditional
...................................................................................................................................
highlighting
66
33 Show stripes
...................................................................................................................................
(Alternate color every other data row)
67
34 Multipage...................................................................................................................................
reports
69
35 Nested reports
...................................................................................................................................
(subreports)
70
36 Side-by-side
...................................................................................................................................
subreports
71
37 Limitations
...................................................................................................................................
on using subreports
71
38 PrintOnParent
...................................................................................................................................
option
72
Chapter III Cross-tab reports
75
1 Construct...................................................................................................................................
a cross-report
76
2 Using functions
................................................................................................................................... 80
3 Sorting values
................................................................................................................................... 81
4 Table with
...................................................................................................................................
composite headers
81
5 Adjusting...................................................................................................................................
cell width
83
6 Font colors
...................................................................................................................................
and highlighting
84
7 Managing...................................................................................................................................
a cross-table from the script
85
8 Adjusting...................................................................................................................................
rows/columns size
90
9 Filling a table
...................................................................................................................................
manually
91
Chapter IV Charts
95
1 Limitation
...................................................................................................................................
of number of chart values
98
2 Some useful
...................................................................................................................................
settings
99
3 Chart with
...................................................................................................................................
specified values
100
4 Chart completion
...................................................................................................................................
from Script
101
Chapter V Script
104
1 Taste of...................................................................................................................................
script
104
2 Structure
...................................................................................................................................
of a script
106
3 "Hello, World!"
...................................................................................................................................
script
108
4 Using objects
...................................................................................................................................
in the script
109
5 Calling the
...................................................................................................................................
variables from the report’s variables list
110
© 1998-2006 FastReports Inc.
III
FastReport 3.0 User's Manual
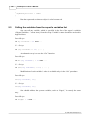
6 Calling the
...................................................................................................................................
DB fields
111
7 Using aggregate
...................................................................................................................................
functions in the script
111
8 Displaying
...................................................................................................................................
the variable’s value in a report
111
9 Events ................................................................................................................................... 112
10 Example...................................................................................................................................
of using the “OnBeforePrint” event
113
11 Printing...................................................................................................................................
the group’s sum total in the group’s header
115
12 “OnAfterData”
...................................................................................................................................
event
119
13 Service ...................................................................................................................................
objects
120
“Report”.........................................................................................................................................................
object
121
“Engine”.........................................................................................................................................................
object
121
"Outline".........................................................................................................................................................
object
123
14 Using the
...................................................................................................................................
“Engine” object
124
15 Anchors................................................................................................................................... 127
16 Using the
...................................................................................................................................
“Outline” object
128
17 “OnManualBuild”
...................................................................................................................................
page’s event
132
18 Creation...................................................................................................................................
of objects in the script
137
Chapter VI Dialogue forms
140
1 Controls................................................................................................................................... 140
2 “Hello, World!”
...................................................................................................................................
report
142
3 Entering...................................................................................................................................
parameters and transferring them into a report
143
4 Interaction
...................................................................................................................................
of controls
143
5 Several ...................................................................................................................................
dialogue forms
144
6 Dialogue
...................................................................................................................................
forms managing
145
Chapter VII Wizards
149
1 New report
...................................................................................................................................
wizard
149
2 New connection
...................................................................................................................................
wizard
154
3 New table
...................................................................................................................................
wizard
155
4 New query
...................................................................................................................................
wizard
156
5 Query construction
................................................................................................................................... 157
Query constructor
.........................................................................................................................................................
usage
159
Complicated
.........................................................................................................................................................
query building
161
Chapter VIII Dot-Matrix Reports
165
1 Cross-tab
...................................................................................................................................
in dot-matrix
168
2 Dot-matrix
...................................................................................................................................
reports printing
169
3 “Command”
...................................................................................................................................
object
170
Chapter IX Report viewing, printing and
export
173
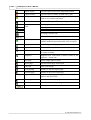
1 Control ...................................................................................................................................
keys
175
© 1998-2006 FastReports Inc.
Table of contents
IV
2 Mouse control
................................................................................................................................... 175
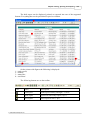
3 Report printing
................................................................................................................................... 175
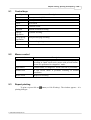
4 Text search
...................................................................................................................................
in report
176
5 Report Export
................................................................................................................................... 177
Export to.........................................................................................................................................................
PDF Format
178
Export to.........................................................................................................................................................
RTF Format
179
Export to.........................................................................................................................................................
Excel
180
Export to.........................................................................................................................................................
XML Format
182
Export to.........................................................................................................................................................
CSV Format
183
Export into
.........................................................................................................................................................
HTML Format
183
Export to.........................................................................................................................................................
Text Format
185
Export to.........................................................................................................................................................
Jpeg, BMP, Gif, Tiff Graphic Formats
185
6 Sending...................................................................................................................................
a Report via E-mail
187
7 Report Design
...................................................................................................................................
References
189
© 1998-2006 FastReports Inc.
HelpAndManual_unregistered_evaluation_copy
I
FastReport 3.0 User's Manual
© 1998-2006 FastReports Inc.
Chapter
I
Designer
2
FastReport 3.0 User's Manual
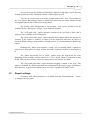
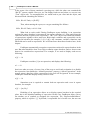
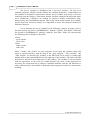
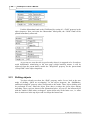
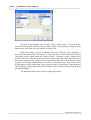
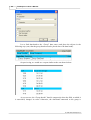
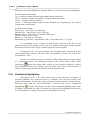
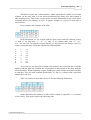
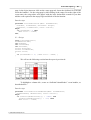
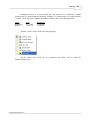
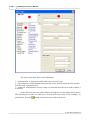
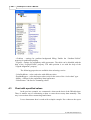
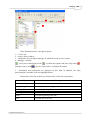
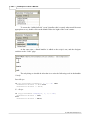
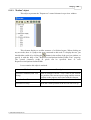
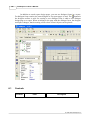
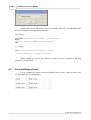
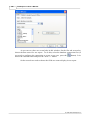
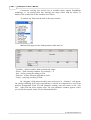
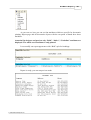
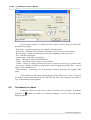
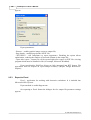
FastReport contains the visual report designer, which can be called from the
"Start" menu («Start»-> «Programs»-> «FastReports» -> «FastReport Studio» ->
«FastReport Designer». The designer provides the user with all the tools for designing a
report’s appearance, along with the ability of simultaneous previewing. Designer’s
interface meets up-to-date requirements. It contains several toolbars, which can be docked
wherever you want. The information about bar’s location, along with all other designer
settings is stored in a ini-file, if one is assigned, or in the registry, and is restored each
time you launch the designer.
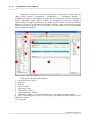
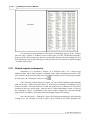
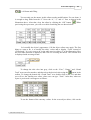
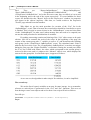
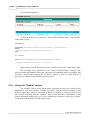
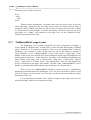
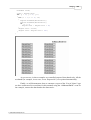
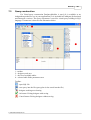
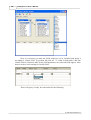
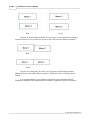
In the picture, denoted with numbers:
1 – report design work space;
2 – menu bar;
3 – toolbars;
4 – object's toolbar;
5 – report pages’ tabs;
6 – “Report tree” window;
7 – “Object inspector” window;
8 – “Data tree” window. You can drag elements to a report page from this window;
9 – rulers. When dragging a ruler to a report page, the guide line (which objects can be
adhered to) appears;
10 – status line.
© 1998-2006 FastReports Inc.
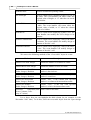
Designer
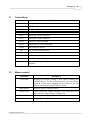
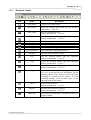
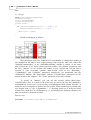
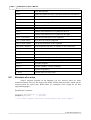
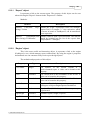
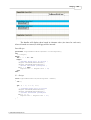
1.1
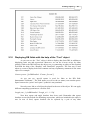
Control keys
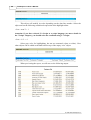
Keys
Description
Ctrl+O
“File|Open…” menu command
Ctrl+S
“File|Save” menu command
Ctrl+P
“File|Preview” menu command
Ctrl+Z
“Edit|Undo”menu command
Ctrl+C
“Edit|Copy” menu command
Ctrl+V
“Edit|Paste” menu command
Ctrl+X
“Edit|Cut” menu command
Ctrl+A
“Edit|Select all” menu command
Arrow
Move between objects
Del
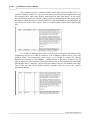
1.2
3
Delete of the selected objects
Enter
Call the editor of the selected object
Shift+arrows
Modify sizes of the selected objects
Ctrl+arrows
Move the selected objects
Alt+arrows
The selected object is adhered to the nearest one in the specified
direction.
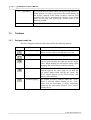
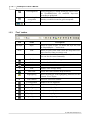
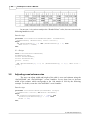
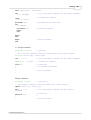
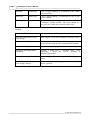
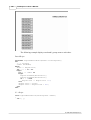
Mouse control
Operation
Description
Left button
Selecting an object; pasting a new object; moving and
resizing objects. For the selected objects, you can perform
zooming in and out by dragging the red square in the left
bottom corner of the selected objects’ group.
Right button
Selected object's contextual menu.
Double-click
Object editor call. Double-clicking on the white space of a
page calls the “Page Settings” dialogue box.
Mouse wheel
Scrolling a report page.
Shift + left button
© 1998-2006 FastReports Inc.
Toggle object's selection.
4
FastReport 3.0 User's Manual
Ctrl + right button
Alt + left button
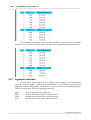
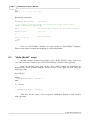
1.3
Toolbars
1.3.1
Designer mode bar
If you hold the left mouse button during moving a mouse, a
frame appears. As soon as you release the mouse button, all
the objects captured in the frame would be selected. This
operation can also be performed by clicking on the blank
space on the page, and moving the mouse cursor to the
required position.
If the “Text” object is selected, it edits its contents in place.
The bar is integrated with the object bar and has the following buttons:
Icon
Name
Description
Object selecting
A standard mode of operation, in which a cursor
allows to select objects, modify their sizes, etc.
Hand
Clicking on this icon allows dragging a report page.
Zoom
Clicking on the left button doubles the zoom (adds
100%), while clicking the right one zooms out by
100%. When holding the left mouse button while
dragging, the selected area would be zoomed.
Text editor
Clicking on the “Text” object allows editing its
contents right on the report page. If you hold the
left mouse button when moving the cursor, the
“Text” object appears in the selected place, and
then its editor launches.
Format copying
The button becomes enabled when the “Text”
object is selected. When clicking on the “Text”
object with the left button, it copies formatting,
which has the previously selected “Text” object,
into the object.
© 1998-2006 FastReports Inc.
Designer
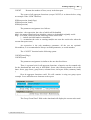
1.3.2
5
“Standard” toolbar
Icon
Name
Description
New report
Creates a new blank report.
Open report
Opens an existing report from the file. Hotkeys
combination – “Ctrl+O.”
Save report
Saves a report into the file.
Hotkeys combination – “Ctrl+S.”
Preview
New page
Performs report constructing and its previewing.
Hotkeys combination – “Ctrl+P.”
Adds a new page into the report.
New dialogue form Adds a new dialogue form into the report.
Delete page
Page properties
Variables
Calls a dialogue with page properties.
Calls the report variable’s editor.
Cut
Cuts the selected objects into the clipboard.
Hotkeys combination – “Ctrl+X.”
Copy
Copies the selected objects into the clipboard.
Hotkeys combination – “Ctrl+C.”
Paste
Pastes objects from the clipboard.
Hotkeys combination – “Ctrl+V.”
Formatting pattern
Sets the “Text” object’s formatting pattern. Select
the “Text” object and click on this button. All the
following pasted “Text” objects will have the same
formatting as specified in the pattern. To reset
formatting settings, click on blank space of the
page and click on this button.
Cancel
Undo the last operation.
Hotkeys combination – “Ctrl+Z.”
Repeat
Redo the last cancelled operation.
Hotkeys combination – “Ctrl+Y.”
Show grid
© 1998-2006 FastReports Inc.
Deletes the current page.
Shows the grid on the page. Grid pitch can be set in
designer options.
6
FastReport 3.0 User's Manual
Grid alignment
During dragging or during modifying object sizes,
the coordinates/sizes are modified step-wise,
according to grid pitch.
Locate in grid
crosspoints
Modifies sizes/location of the selected objects so
that they would be located at grid crosspoints.
Zoom
1.3.3
Sets the zoom.
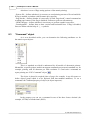
“Text” toolbar
Icon
Name
Description
No style
Style
Allows to select a style. To define the style list, call
the “Report|Styles…” menu item.
Arial
Font
Allows to select font name from the drop-down list.
Stores last five fonts previously used.
8
Font size
Allows to select font size from the drop-down list.
Size can also be entered manually.
Bold
Enables/disables font bolding.
Italic
Enables/disables italics.
Underline
Tt
Font
Font color
ab
Enables/disables font underlining.
Displays Font settings dialog.
Selects font color from the drop-down list.
Highlighting
Shows the dialogue with highlighting attributes for the
selected “Text” object.
Text rotation
Allows to select text rotation.
Left alignment
Enables text left alignment.
Center alignment
Enables text center alignment.
Right alignment
Enables text right alignment..
Justify by width
Enables text justifying by width.
Top alignment
Enables text top alignment..
Height alignment
Enables text height alignment..
© 1998-2006 FastReports Inc.
Designer
Bottom alignment
1.3.4
Enables text bottom alignment.
“Frame” toolbar
Icon
Description
Top line
Bottom line
Description
Enables/disables top frame line.
Enables/disables bottom frame line.
Left line
Enables/disables left frame line.
Right line
Enables/disables right frame line.
All lines
Enables all frame lines.
No lines
Disables all frame lines.
Shadow
Enables/disables shadow.
Background color Selects background color from the drop-down list.
2
1.3.5
Line color
Selects line color from the drop-down list.
Line style
Selects line style from the drop-down list.
Line width
Selects line width from the drop-down list.
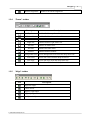
“Align” toolbar
Icon
Description
Align left edges.
Center across.
Align by right edges.
Align top edges.
Justify vertically.
© 1998-2006 FastReports Inc.
7
8
FastReport 3.0 User's Manual
Align bottom edges.
Justify by width.
Justify by height.
Center across in window.
Center vertically in window.
Set the same width as in the first selected object
Set the same height as in the first selected object
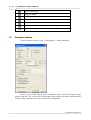
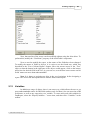
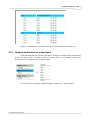
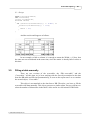
1.4
Designer options
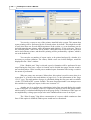
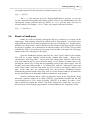
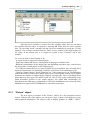
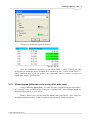
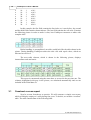
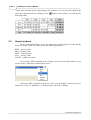
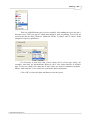
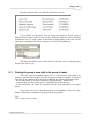
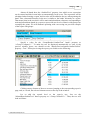
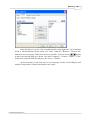
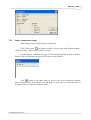
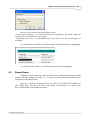
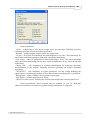
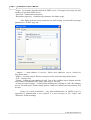
Set the designer options via the “View|Options..." menu command.
Here you can set the desired units (centimeters, inches, pixels), and specify grid
step for each unit. Tip: You can also switch units in the designer by double-clicking on the
left part of the status line where the current units are displayed.
© 1998-2006 FastReports Inc.
Designer
9
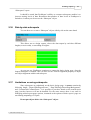
You can also specify whether grid should be displayed, and align to grid. This can
be done by buttons in the “Standard” toolbar of the designer as well.
You can set a font for the code editor window and for the “Text” object editor. If
the “Use object's font settings” option is enabled, the font in the text editor window would
correspond with the font of the object being edited.
The default white background of the designer and service windows can be
modified by the “Workspace” and the “Tool windows” buttons.
The “LCD grid color” option increases contrast of the grid lines a little, and it
improves their visibility on LCD monitors.
The “Show editor after insert” option controls what happens when new objects are
inserted. If the option is enabled, its editor will be displayed each time an object is
inserted. When creating a large number of blank objects, it is recommended to disable the
option.
Disabling the “Show band captions” option, you can disable bands’ captions in
order to save some place in a page. At that, the band’s captions would be written inside of
it.
The “Show drop-down list of fields” option stops the drop-down list from
displaying when pointing with the mouse to a “Text” object which is connected to data
fields. This may be necessary if there are many narrow text objects in a band
The “Free band placement” option disables snapping of bands to the page. This
option is disabled by default and bands are automatically grouped in page according to
their function. A gap between bands can be set in the “Gap between bands” field.
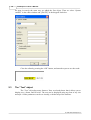
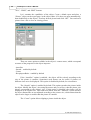
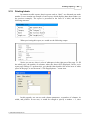
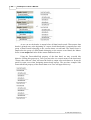
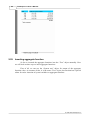
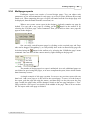
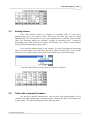
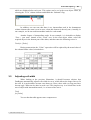
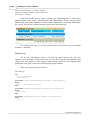
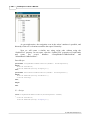
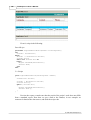
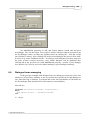
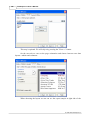
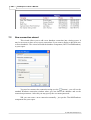
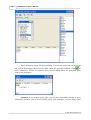
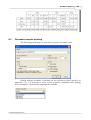
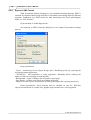
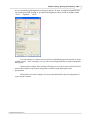
1.5
Report settings
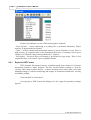
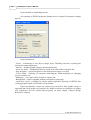
A window with report parameters is available from the “Report|Options...” menu.
A dialogue has two pages:
© 1998-2006 FastReports Inc.
10
FastReport 3.0 User's Manual
You can tie a report to one of the printers installed in the system. This means that
report printing will be performed by the selected printer by default. This might be useful
in case when there are several different printers in the system; e.g. text documents can be
tied with monochrome printer, while documents with graphics - to the color one. There is
the “Default printer” item in the list of printers. When this item is selected, the report will
not be tied with any printer, and therefore printing will be performed by a printer, which is
set as the default one.
You can also set number of report copies to be printed and specify, whether it is
necessary to perform collation. The values, which a user sets in this dialogue, would be
displayed in the “Print” window.
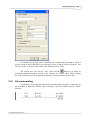
If the “Double pass” flag is selected, report’s formation will be performed in two
steps. During the first pass, a report is formed, and is divided into pages, but the result is
not saved anywhere. In the second pass a standard report formation with saving a result in
the stream is performed.
Why two passes are necessary? Most often, this option is used in cases when in a
report there is a need for the total number of pages in it, i.e. the information of the “Page
1 of 15” type. The total number of pages is calculated during the first pass and is available
via the “TOTALPAGES” system variable. The most frequent mistake is an attempt to use
this variable in a single-pass report; in this case it returns “0.”
Another use is to perform any calculations in the first pass and display the results
in the second pass. For example, when it is required to display a sum in the group header,
which usually is calculated and displayed in the group footer. Calculations of this type are
accomplished by writing report script code in the OnBeforePrint event of an object.
The “Print if empty” flag allows construction of a report, which contains no data
lines. If this option is disabled, blank reports would not be constructed.
© 1998-2006 FastReports Inc.
Designer
11
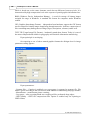
The “Password” field enables setting of a password which must be entered before
opening a report.
Controls in the second page of the dialogue allows you to set report’s description
properties..
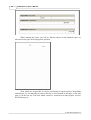
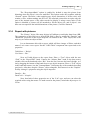
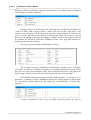
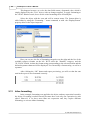
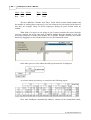
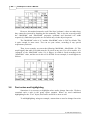
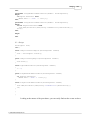
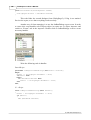
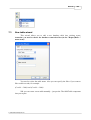
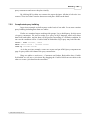
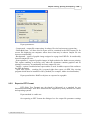
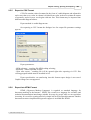
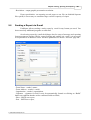
1.6
Page options
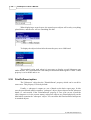
Page’s parameters are available via either the “File|Page settings...” menu, or by
double-clicking on page blank space. The dialogue has two pages:
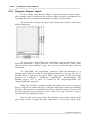
On the first dialogue page, you can select size and alignment of paper, as well as
set margins. In “Paper source” drop-down lists you can select a printer tray for the first
page and the rest of the report pages.
You can set the number of columns for multi-column reports’ printing. The current
settings are displayed in the designer.
The “Print to previous page” flag allows you to print pages, beginning from blank
space of the previous page. This option can be used in case when a report template
consists of several pages or when printing batch (composite) reports.
The “Mirror margins” option switches right and left margins of page for even
© 1998-2006 FastReports Inc.
12
FastReport 3.0 User's Manual
pages during previewing or printing a report.
The “Large height in design mode” option increases page’s height several times
more. This feature can be useful if many bands are located in the page, and must be used
when working with the overlay band. This only effects the page height in design mode..
© 1998-2006 FastReports Inc.
Chapter
II
Creating reports
14
FastReport 3.0 User's Manual
In this chapter we will observe features of the FastReport main components and
objects, which constitute the basis of such reports, as text and band objects. One will learn
about how to build simple reports, containing data from DB tables.
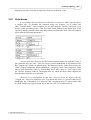
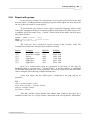
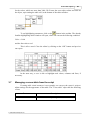
2.1
Report objects
A blank report in FastReport is presented as a paper page. At any place on the
page, a user is able to add objects, which can display different information (such as text
and/or graphics), as well as to define report’s appearance. Let us describe briefly the
assignment of the FastReport objects, which are included in the standard package:
- “Band” object allows creation on a design page, of an area which has definite
behaviour; according to it’s type.
- “Text” object displays one or several text lines within the rectangular area;
- “Picture” object displays a graphic file in “BMP,” “JPEG,” “ICO,” “WMF,” or
“EMF” format;
- “Line” object displays a horizontal or a vertical line;
- “System text” object displays service information (date, time, page number, etc), as
well as aggregate values;
- “Subreport” object allows inserting an additional report design page inside the basic
one;
- the objects of “Draw” category represent different geometrical figures (diagonal line,
rectangle, rounded rectangle, ellipse, triangle, and diamond);
- “Chart” object displays data in the form of charts of different kinds (circle chart,
histogram, and so on);
- “RichText” object displays a formatted text in Rich Text Format (RTF);
- “CheckBox” object displays a checkbox with either a check or a cross;
- “Barcode” object displays data in the form of barcode (many different types of
barcodes are available);
- “OLE” object is able to display any object using OLE technology.
The basic objects you most likely need to work with are the “Band” and “Text”
objects. You will learn about their capabilities in detail further in this chapter.
© 1998-2006 FastReports Inc.
Creating reports
2.2
15
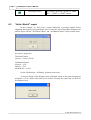
“Hello, World!” report example
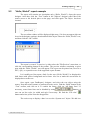
The report will contain one inscription only (“Hello, World!”). Open the report
designer. After that, click the “Text” button in the "Objects" designer panel. Move the
mouse cursor to the desired place on the page, and click again. The object has been
inserted.
The text editor window will be displayed right away; if it does not appear (this can
be set in the designer settings), then doubleclick the object. Enter the “Hello, World!” text,
and then click the “ОК” button.
The report is created. To preview it, either select the "File|Preview" menu item, or
click the corresponding button in the toolbar. The preview window containing a report
page with the “Hello, World!” text will appear. This report can be printed out, saved to a
file (*.fp3), or exported to one of the supported export formats.
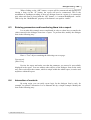
Let’s modify our first report a little. Let the text (“Hello, World!”) be displayed in
bold letters with yellow background and a frame. Also let us make the current date be
displayed next to the text.
Once again, open FastReport’s designer, and select the text object using the
mouse. Note that some buttons on toolbars become active. Find the “Bold” button in the
“Text” toolbar, and click on it. To enable the frame, click on “All frame lines”. If
necessary, some frame lines can be disabled by using
buttons. A
user can set line color, its width, and style if necessary. We find the “Fill color”
button and select yellow from the dropped list.
The easiest way to display a date is to use the “System text” object. We add it to
© 1998-2006 FastReports Inc.
16
FastReport 3.0 User's Manual
the page in exactly the same way we added the first object. Then we select “System
variable” in the editor window and “[DATE]” in the dropped list below.
Close the editor by pressing the “OK” button, and start the report to see the result.
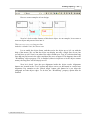
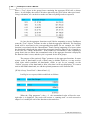
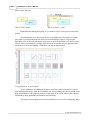
2.3
The “Text” object
The “Text” object has many features. Now we already know that it allows you to
display text, a frame, and fill color. The text can be displayed using any font of any size
and style. All the parameters can be set visually, with the help of the toolbars:
© 1998-2006 FastReports Inc.
Creating reports
17
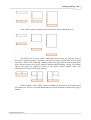
Here are some examples of text design:
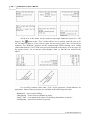
Now let’s look at other features of this basic object. As an example, let us create a
new text object and put two lines into it:
This is a very, very, very long text line.
And this is another line, the shorter one.
Let us enable the object frame, and then resize the object up to 9x3 cm with the
help of the mouse. We see that the object can display not only a single line of text, but
several lines as well. Now let us reduce the object width up to 5cm. It is obvious that long
lines did not find room in the object and therefore were wrapped. This happens due to the
“WordWrap” object property. If it is disabled (either in inspector or in the object context
menu), the long lines will be simply cut off.
Now let’s check how the text alignment inside the object works. Alignment
buttons are located in the “Text” toolbar and allows one to set horizontal or vertical text
alignment. Pay attention to the “Block Align” button; this button let’s you align the
paragraph on both object edges. To do this, the “WordWrap” property option must be
enabled.
© 1998-2006 FastReports Inc.
18
FastReport 3.0 User's Manual
All the text in the memo can be rotated at any angle within the limit of 0.. 360
degrees. The
button in the “Text” toolbar allows you to quickly rotate the text at 45,
90, 180 and 270 degrees. If you wish to rotate the text at any other value, use the object
inspector. The “Rotation” property sets the required angle. When rotating a text, setting
values other than 90, 180, 270 the text can exceed bounds of the object, as in our case (see
the picture below). Let us increase object height a little, so that the text would fit the
object.
Let us briefly examine some other “Text” object properties, which influence its
appearance. Most of these properties are available in the object inspector only:
- BrushStyle – type of object filling;
- CharSpacing – sрасe between symbols in pixels;
- GapX, GapY – text indents from object’s left and top boundaries (in pixels);
- LineSpacing – space between lines (in pixels);
© 1998-2006 FastReports Inc.
Creating reports
19
- ParagraphGap – the first paragraph line indent (in pixels).
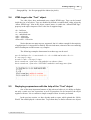
2.4
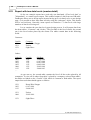
HTML-tags in the “Text” object
Yes, this object does understand some simple HTML tags. Tags can be located
inside the text of an object. Tags are disabled by default; to enable them, either select the
“Allow HTML tags” item in the object context menu, or enable the “AllowHTMLTags”
property in the object inspector. Here is the list of supported tags:
<b> - bold text
<i> - text in italic
<u> - underlined text
<sub> - subscript
<sup> - superscript
<font color> - font color
Notice that not too many tags are supported, but it is rather enough for the majority
of applications. It is impossible to modify font size and name; otherwise the text-rendering
unit in FastReport would become very complex.
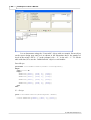
The following examples demonstrate how these tags can be used.
text <b>bold text</b> <i>text in italic</i> <b><i>bold and in italic</b></i>
E = mc<sup>2</sup>
A<sub>1</sub> = B<sup>2</sup>
this is a usual text, <font color=red>and this is a red one</font>
this is a usual text, <font color="#FF8030">and this is an orange one</font>
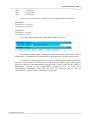
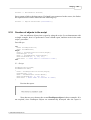
2.5
Displaying expressions with the help of the “Text” object
One of the most important features of this universal object is it’s ability to display
not only a static text, but expressions as well. Expressions can be located in the object
together with text. Let us examine a simple example of how it can be performed.
In the previous section, we have already made a report, which printed the “Hello,
World” line and displayed a current date. To perform that, we had to allocate two objects
© 1998-2006 FastReports Inc.
20
FastReport 3.0 User's Manual
in the report. One of them contained a greeting text, while the other one contained the
“DATE” system variable. However, we can display both text and a date, we can use one
“Text” object only. To accomplish this, we would need to put a line into the object, and
this would look something like follows:
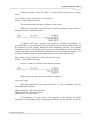
Hello, World! Today is [DATE].
Thus, when running the report, we can get something like follows:
Hello, World! Today is 01.01.2004.
What lead to such result? During FastReport report building, it an expression
enclosed in square brackets is encountered, the engine calculates it’s value and inserts the
value into the text (in place of the expression ). The “Text” object can contain any number
of expressions, together with a usual text. Both single variables and expressions can be
enclosed in brackets (for example, [1+2*(3+4)]). Any constants, variables, functions, and
DB fields can be used in expressions. We will learn more about these features later, in the
chapter.
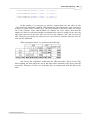
FastReport automatically recognizes expressions enclosed in square brackets in the
text. But what should be done if our object contains square brackets, and we do not want
them to be considered as expressions? For example, if we need to display such text as
following:
a[1] := 10
FastReport considers [1] as an expression, and displays the following:
a1 := 10
that is not what we want, of course. One of the ways to avoid such a situation is to disable
the expression. Just disable the “AllowExpressions” property (“Allow Expressions” in the
context menu), therefore all the expressions in the text will be ignored. In our example,
FastReport would then display exactly what we need:
a[1] := 10
Sometimes text is required to contain both an expression and a text in square
brackets, for example:
a[1] := [myVar]
Disabling of an expression allows us to display square brackets in the required
place, but it also disables handling of expression. In this case, FastReport allows you to
use another set of symbols to designate the expression. The “ExpressionDelimiters”
property, which is equal to “[,]” by default, is responsible for it. In this case, the user can
© 1998-2006 FastReports Inc.
Creating reports
21
use angular brackets for the expressions, instead of square ones:
a[1] := <myVar>
The “<,>” value must be set in the “ExpressionDelimiters” property. As you can
see, the comma divides opening and closing symbols. There is one limitation however: the
opening and closing symbols cannot be similar, so “%,%” will not work. One can set
several symbols, for example “<%,%>” Thus, our example will look as follows:
a[1] := <%myVar%>
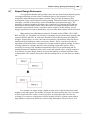
2.6
Bands in FastReport
Bands are used for logically placing the objects it contains at a location on the
output page. When placing an object in a band, such as “Page Header,” we tell the report
engine that the given object must be displayed at the top of each page of a finished report.
Similarly, the “Page Footer” band is displayed at the bottom of each page together with all
the objects it contains. Let us demonstrate it with an example. We’ll create a report, which
contains the “Hello!” text at the top of the page, a current date to the right of it, and a page
number at the foot of the page (to the right).
Open the FastReport designer and click the “New report” button in the toolbar.
You will see a report template, which already contains three bands: “Report title,”
“Master data,” and “Page footer.” Let us remove the “Master data” band for a while (to do
that, click either on any free space inside the band, or on its header, and then remove it by
pressing the “delete” key or using the corresponding section in the context menu). Now let
us add a new band (“Page header”). To perform this, click the “Add band” button and
select “Page header” from the drop down list. We see that a new band is added to the
page. At the same time, the existing bands were moved down. FastReport designer
automatically positions bands on the page, and, as a result, header-bands are positioned on
the top, data-bands are in the middle, and footer-bands are at the bottom.
Now let’s add some objects. Add a “System text” object in the “Page header” band
and select “System variable” in its editor “[DATE]” (you should remember that the date
can be displayed in a “Text” object by typing “[DATE]” in its editor). We add a “Text”
object, which will contain the “Hello!” text in the “Report title” band. Note you can see,
the text object, which displays page number, is already added to the “Pagefooter” band.
© 1998-2006 FastReports Inc.
22
FastReport 3.0 User's Manual
When running the report, you will see that the objects in the finished report are
allocated on the page in the appropriate position.
Thus, bands are responsible for object positioning in required places. Depending
on band type, we can add objects either at the top or at the bottom of the page, on the first
page, or on the last one. The basic bands, which we would need in most reports, work in
the following way:
© 1998-2006 FastReports Inc.
Creating reports
23
- “Page header” band is displayed at the very top of each page;
- “Page footer” band is displayed at the very bottom of each page;
- “Report title” band is displayed at the top of the first page, but below the “Page header”
band (depending upon the “TitleBeforeHeader” page property assigned in the object
inspector);
- “Report summary” band is displayed at the very end of a report, at white space.
2.7
Databands
Now, we are about to learn how to print the data from DB tables or queries. What
is considered a table in such case? It is a required number of lines (records/rows), each of
which has a certain number of columns (fields). To print information of this kind,
FastReport uses a special type of band (databands). These are bands with names of “xxx
data level” type. To print a whole table or some of its fields, you must add these band(s) to
the report, connect it to the table, and add to it the objects with the fields you want to be
printed out. When FastReport builds these bands, they will be printed on the output page
as many times, as there are records in the table. If there is no free space left on the output
page, new output pages will be formed as needed by the report engine
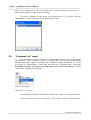
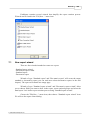
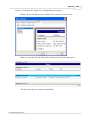
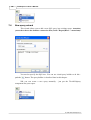
2.8
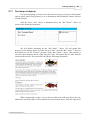
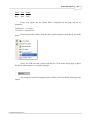
Connecting to the database
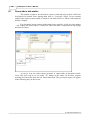
FastReport uses the Microsoft ADO technology to connect to the data. You can
use any database which has the ODBC driver. To set up the connection, go "View|
Connections..." menu item:
By default there is one connection to the FastReport demo database. You can
© 1998-2006 FastReports Inc.
24
FastReport 3.0 User's Manual
create a new connection or edit an existing one. To edit the connection, press the "..."
button at the right side of the connection string.
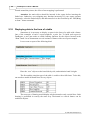
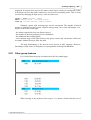
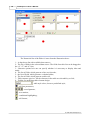
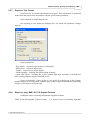
To access a database in the report, you should select it. To do this, click the
"Report|Data..." menu item and select the desired connection:
2.9
“Customer List” report
Our second report will be much more complicated than the first one (it will contain
DB table data, a list of clients of a firm). To perform this, let us use the demonstration
database demo.mdb, which is included in the FastReport Studio distribution kit. Create
new report. Go "Report|Data..." menu item and select the "FR Demo Base" connection
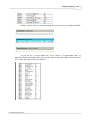
(remember you have to do this every time when you create a new report!). Put the
"ADO Table" component to the page:
and set its properties:
TableName = 'Customer'
Now the table and all its fields become visible in the “Data” service pane window.
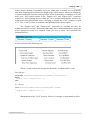
Now let’s create the report. First, add a “Text” object with the “List of clients”
© 1998-2006 FastReports Inc.
Creating reports
25
text to the “Report title” band. Next, we connect the “Master data” band to our dataset.
This can done in one of three ways:
- double-click on the band;
- select the “Edit...” item in the band contextual menu;
- click on the “DataSet” property in the object inspector.
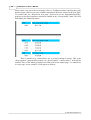
Now we will place four text objects (which will display a client’s number, a
customer name, phone and fax fields of the dataset) on the band. Let us do it in several
different ways in order to demonstrate the features of the FastReport designer. Put the first
“Text” object on the band and enter "[ADOTable1."CustNo"]", into it. This is the most
inconvenient way, since the link has to be entered manually, and there is a possibility of
entering the text incorrectly. To insert the field links into the text object easier, we can use
the expression designer (its button is located in the toolbar of the “Text” object’s editor
window click it and the data dialog window will appear.). To insert our field, double-click
on the required field in the dialogue. Then click the “OK” button, toe close the dialogue
and see the field inserted into the text.
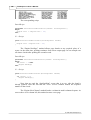
The second way of adding the DB field into the text object is by setting properties
with the object inspector. Put a second “Text” object to the band, without writing anything
in the editor. We’ll set it’s properties using the inspector:
DataSet = ADOTable1
DataField = 'Company'
Since both of the properties are presented as a list, we only need to select the
desired value using the mouse.
The third way is to “drag and drop” the required field from the “Data” service
window into the report. It is the simplest and easiest way. Before doing this we should
disable the “Create header” flag at the bottom of the “Data” window (otherwise we will
create a second ‘Text” object, containing the field title, in addition to the desired field).
Using the mouse select the “Phone” field, and then drag it to the band.
The fourth way. Requires the designer option ("View|Options...", “Show
drop-down list of fields” flag be set and the band connected to dataset. ). Place a blank
“Text” object on the band, and then move the cursor to the object. In the right part of the
object you will see the image of a button with the down arrow (as in opening lists). This is
the DB fields’ opening list. Click the button and select the ”FAX” field in the list.
© 1998-2006 FastReports Inc.
26
FastReport 3.0 User's Manual
Our report design is finished:
Click on the “Preview” button to see the result.
© 1998-2006 FastReports Inc.
Creating reports
2.10
27
Displaying DB fields with the help of the “Text” object
As you can see, the “Text” object is able to display data from DB, in addition to
displaying static text and expressions. Moreover, we can do it in two ways: by either
placing a link to the DB field into the object text, or connecting an object to the required
field with the help of the “DataSet” and “DataField” properties. The first way is used
when we want to display both field contents and any explanatory statement in the same
object. For example:
Contact person: [frxDBDataSet1."Contact_Person"]
As you can see, special syntax is used for links to the DB field:
datasetname.“fieldname”. The field name (as well as the set name) can contain spaces.
Space between the “point” and “quote” symbols is not permitted.
Not only can a link to a field can be placed in the text of the object. We can apply
different computing operations to a field as well:
Length (cm): [<frxDBDataSet1."Length_in"> * 2.54]
Note how square and angle brackets have been used. Remember that square
brackets are used by default for delimiting expressions, which are included in the object’s
text. In case of need, square brackets can be replaced by a pair of any other
© 1998-2006 FastReports Inc.
28
FastReport 3.0 User's Manual
opening/closing sequences (see the “Displaying expression with the help of the “Text”
object” section). Angular brackets are used inside expressions for marking out the
FastReport variables or DB fields. To be logical, we should write
Contact person: [<frxDBDataSet1."Contact_Person">]
instead of
Contact person: [frxDBDataSet1."Contact_Person"]
Nevertheless, both these notations are correct, since FastReport allows absence of
angular brackets, in case when an expression contains only one variable or only one DB
field. However, if an expression contains several members, the brackets are obligatory:
Length (cm): [<frxDBDataSet1."Length_in"> * 2.54]
2.11
Aliases
In the previous report, we used the data source with the ADOTable1 name and the
following fields: “CustNo,” “Company,” “Phone,” and “FAX.” Accordingly, we had to
insert something like "[ADOTable1."CustNo"]" into the report. Does it seem to be quite
clear? Not really. One may want to rename the data source, and the field, naming it “Our
clients” and “Number” respectively. There is however a way out. The user can use
so-called pseudonyms or aliases in such situations. Both the data source and the field
possess second names, i.e. aliases, which can easily be modified (the original names, of
course, are not modifiable). If a name has an alias, this alias is what is used in FastReport.
Otherwise, the original name is used.
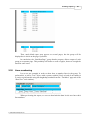
It is very easy to rename a data source and its fields in FastReport. To open the
alias editor, double-click on the ADOTable1 component. You can modify the data source
name, names of its fields, and select the fields you would need in the report. Let us rename
the source and fields (see picture):
© 1998-2006 FastReports Inc.
Creating reports
29
Note, that an alias of the source can be modified without using the alias editor. To
perform this, modify the “UserName” property of the ADOTable1 component.
Now we need to modify the report, as the names of the fields have been changed.
To modify the names of fields in objects, it is easier to use the fourth way, which was
described in the "List of clients Report" chapter. Move the mouse cursor to the “Text”
object so that the button in the right part of the object would appear, click on the button,
and select the desired field in the list. As you can see, now the data source name and its
fields’ names are more than understandable.
Note: It is better to assigning an alias in the very beginning, before designing a
report. This will avoid subsequent need to rename fields in the report.
2.12
Variables
In addition to usage of aliases, there is one more way, which allows the user to set
more understandable names for DB fields (and not only for them). One can associate a DB
field name, as well as any expression, to a variable. To create and work with variables in
FastReport, select the “Report|Variables...” menu item, and then click “Variables” in the
toolbar.
© 1998-2006 FastReports Inc.
30
FastReport 3.0 User's Manual
The list of variables in FastReport has a two-level structure. The first level
contains categories, and the second contains the variables themselves. Categorization of
the variables is designed for convenience when a list of variables is too long. A list must
contain at least one category. That means, that the variables cannot be located at the upper
level. Furthermore, categories are needed for logical variables classification only,
therefore, they are not included in reports. That is why, when setting a name for a variable,
do not forget that it must be unique; it is impossible to create two identical variables in
different categories.
Let us illustrate the use of variables by the following example. Assume we have
two data sources: the first is “frxDBDataSet1” with the “CustNo” and “Name” fields and
the second is “frxDBDataSet2” with the “OrderNo” and “Date” fields. We can associate
the following list of variables to the fields:
Clients
Client number
Client name
Orders
Order number
Order date
where “Clients” and “Orders” are two categories. Let us open the variables editor and
create a required structure with the help of the “New category,” “New variable,” and
“Edit” buttons. To associate the variables to the DB fields, let us select a variable and
double-click on the required DB field in the right part of the window. The link to the DB
field will be moved to the bottom pane of the window. The variable is now associated
with the expression, so the value of variable becomes the value of the expression. If
necessary, the expression can be edited or modified manually and any FR functions or
other variables may be used within it. Remember that categories must not be associated to
anything.
© 1998-2006 FastReports Inc.
Creating reports
31
After the list of variables is created, close the variables editor. Now we can insert
the variables into the report. In contrast to inserting DB fields, there are fewer variants
here. We can either insert a variable into the object text manually by typing the “[Client
number]” text, or drag a variable from the “Data” service window to the required place of
the report. In the second case, it is required to switch to the “Variables” tab in this
window.
Let’s review what we have learned so far,
- A report design is composed of design pages.
- Pages may contain FR objects, either placed on the page or within a band.
- Bands are placeholders on the design page and depending upon their type, control where
the objects they contain appear on the output page(s).
- Text Objects contain the text we want to output at a given position, they are multi-lined,
and may contain static text, datafields, variables, expressions, or a combination of all.
- Data type bands, Master, Detail, Subdetail etc., when connected to an TfrxDbDataset
control the number of times these bands appear (rows) and together with the report engine
determine the number of finished pages output by a design page. Note: even though these
data bands may have types like master detail etc., this is only a place relationship of the
bands hierarchal position on the output pages(s). the actual data relationships are
dependant on the table/query relationships to which the frxdbdatasets are connected. Each
databand level requires an TfrxDbDataset or equivalent association..
2.13
“Picture” object
The next object to examine is the “Picture” object. It is also frequently used in
reports. With the aid of this object, you can insert a logo, a photo of an employee or any
other graphical information. The object is able to display graphics in “BMP,” “JPEG,”
© 1998-2006 FastReports Inc.
32
FastReport 3.0 User's Manual
“ICO,” “WMF,” and “EMF” formats.
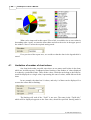
Let’s examine the capabilities of the object. Create a blank report and place a
“Picture” object on the report page. in the object editor (if it does not open automatically,
then doubleclick on the object). Load any desired picture and click “OK.” You can load a
picture from a file or clear an existing picture
There are some options available in the object’s context menu, which correspond
to names of the properties in the object inspector.
- AutoSize
- Stretch – enabled by default
- Center
- KeepAspectRatio – enabled by default
If the “AutoSize” option is enabled, the object will be resized, according to the
size of the picture it contains. Sometimes such feature can be useful, if pictures of
different sizes are to be displayed. This option is disabled by default, for convenience.
The “Stretch” option is enabled by default. This option stretches the picture inside
the object. Modify the object’s size using the mouse and you will see, that the picture size
always corresponds to the object’s size. If this option is disabled, the picture will be
displayed in its original size. This behaviour differs from the “AutoSize” option because
the object dimensions are not adjusted according to the picture size, which means that the
object can be larger or smaller than the picture it contains.
The “Center” option allows aligning a picture inside the object.
© 1998-2006 FastReports Inc.
Creating reports
33
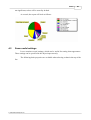
The “KeepAspectRatio” option is enabled by default it stops the picture from
distorting when the object’s sizes are modified. This option works only together with the
“Stretch” option. Therefore, when applying any object dimensions, a drawn circle will
remain a circle, without turning into an oval. The stretched picture then occupies only the
part of the internal space of the object needed to display it using correct ratios. If the
option is disabled, a picture will be stretched to fill the object size, and if object’s size
does not correspond to the initial dimensions of the picture, it will be distorted.
2.14
Report with pictures
The “Picture” object, like many objects in FastReport, can display data from a DB.
The connection of this object to a desired DB field is done by setting the “DataSet” and
“DataField” properties in the object inspector. In contrast to the “Text” object, this is the
only way to connect an object to data.
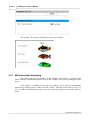
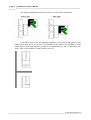
Let us demonstrate this with a report, which will have images of fishes, and their
names. Let's create a new report. Put the "ADO Table" component into report and set its
properties:
TableName = 'Biolife'
UserName = 'Bio'
Now we’ll add objects to the report form. Place a “Text” object with the text
“Fish” in the “ReportTitle” band. Connect the “Master Data” band to the data source
(double-click on the band and select “Bio” from the list). Increase the band’s height to 5
cm by dragging the bottom of the band down or use object inspector. Place a “Text” object
in the band and connect it to the”CommonName” field using any of the methods described
previously. After that, drop the “Picture” object alongside, and connect it to the “Graphic”
field by setting it’s properties using the object inspector:
DataSet = Bio
DataField = 'Graphic'
Note, that both of these properties are of the “List” type, and one can select the
required values using the mouse. To make room for the picture, stretch the object up to 4 x
2.5cm.
© 1998-2006 FastReports Inc.
34
FastReport 3.0 User's Manual
We are done. The report is finished (see the picture below):
2.15
Multi-lined text displaying
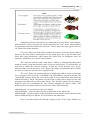
We’ll add to the previous example In the “Biolife” table, there is a “Notes” field,
which contains a detailed description of each fish. Update our report by adding this field
into it.
At first glance, everything seems to be easy: add the “Text” object to the databand
between the existing objects, connect it to the “Notes” field and set the object’s size (8 x
2.5 cm). When previewing the report, you will see that the output is not exactly what we
want:
© 1998-2006 FastReports Inc.
Creating reports
35
FastReport performed just what it was instructed to do. The”Notes” field contains
multi-lined text, whose size may vary. At the same time, the “Text” object, which displays
the information from this field, has a fixed size. That is why some lines appear to be cut
off. What to do in this situation?
Of course, either size of the object could be increased, or font size can be reduced.
However, this may lead to wasted space on the output page, due to the fact that some
fishes have long descriptions, while others have short ones. In FastReport, there are
properties which allow us to resolve this problem.
This concerns both the band’s and object’s ability to automatically adjust their
height in order to create the necessary space of a given record (row). To perform this, we
just need to enable the “Stretch” property of both the “band” and the “text” object.
However, that is not all, because a “text” object with longer text should be able to stretch
by itself, we’ll need to set some of it’s properties also.
The “text” object can automatically set its height and width in order to find room
for it’s contents. One can use the “AutoWidth” and “StretchMode” properties for this. The
“AutoWidth” property allows the “text” object width to vary so that all the lines find room
without division of words. This mode is useful when an object has a single text line and
growing to the right will not effect other objects. The “Stretch” property lets the object’s
height to grow to accommodate the text, without changing the objects width.. This
property has several modes and you can select one in the object inspector:
smDontStretch – do not stretch an object, by default;
smActualHeight – stretch an object in order to find room for the whole text;
smMaxHeight – stretch an object so that its bottom would coincide with the bottom of the
band in which the object is placed.. We will examine this mode later.
Now we are interested in the “Stretch” property of the “Text” object. Enable it in
© 1998-2006 FastReports Inc.
36
FastReport 3.0 User's Manual
the object context menu or set the “StretchMode = smActualHeight” property value. Also,
enable the “Stretch” band property. Preview the report and make sure that everything
works as expected.
As you can see, when constructing a report, FastReport fills objects with data,
stretches them with the “Stretch” option enabled, and then computes the band’s height in
order to find room for all the objects. If the band “Stretch” option is disabled, the height
setting is not performed, and the band is displayed according to height specified in the
designer. If we disable this option, we would see that the objects with longer texts are still
stretched, although the band is not. This leads to text overlaying, since each next band is
displayed right after the previous one.
2.16
Data splitting
Let us pay attention to a peculiarity of this report: There is a lot of blank space at
bottom of the pages. Why does it happen? When a report is constructed, the FastReport
core fills whitespace of the page with bands. After displaying each band, the current
position shifts down. When FastReport finds out that there is not enough space to display
the next band (its height is larger than white space left on the page), then a new page is
formed and band displaying continues there. This operation continues being performed as
© 1998-2006 FastReports Inc.
Creating reports
37
many times as there are records in the dataset.
Our report contains an object with large text, and that is why the band height is
rather large. Furthermore, if a large band does not find room on a page, it is transferred to
the next one, and much unused space remains at the bottom of the page. This is shown at
the following illustration:
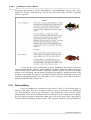
To limit paper wastage, let us use a FastReport feature, which paragraphs the band
’s contents. All we need do is to enable the “AllowSplit” option of the “First level data”
band. You see that there is less white space at the bottom of report pages:
How does band splitting work? There are some objects in FastReport, which
support this feature. They are the “Text,” “Line,” and “RichEdit” objects. They can be
“split,” while other objects cannot. When FastReport comes across the need to split a
band, it performs it in the following way:
- displays the non-splittable objects, which find room on white space;
- partially displays splittable objects (text objects are displayed in a way that all lines find
room in the object);
- forms a new page and continues object displaying;
- if a non-splittable object does not find room on whitespace, it is transferred to the next
page; at the same time, all the objects located underneath, are shifted according to need;
- the process continues until all the band objects are fully displayed.
© 1998-2006 FastReports Inc.
38
FastReport 3.0 User's Manual
The splitting algorithm will become clearer if to look at the illustration:
It should be noted, that the splitting algorithm is not perfect and quality of the
output report may not be as expected. You should use this option very carefully in cases
when objects on the split band are grouped in a complicated way, and / or their font sizes
differ. Here is the example of what could be received:
© 1998-2006 FastReports Inc.
Creating reports
2.17
39
Text wrap of objects
For report designing, in some cases it becomes necessary to wrap text around other
objects (often, when using pictures). Let us demonstrate this FastReport feature with our
current example.
Add one more “Text” object to databand below the “Bio.”Notes”” object, as
shown in the following illustration:
We will disable stretching for the “Bio.”Notes”” object. We will enable this
property for the bottom object. To make the text “flow” from the “Bio.”Notes”” object to
the bottom one, set the “FlowTo” property of the “Bio.”Notes”” object. This property is
set in the object inspector and is of the “drop list” type. The bottom object’s name must be
selected from this list. The result will look like the following illustration:
When constructing a report, if a text does not find room in the top object, the part,
which does not fit the object, will be transferred to the bottom object. Since the objects are
© 1998-2006 FastReports Inc.
40
FastReport 3.0 User's Manual
located around the picture, the effect of text wrapping is performed.
Attention: the main object should be inserted in the report before inserting the
linked one. Otherwise, text wrapping may function incorrectly! If your report operates
incorrectly, select the linked object, and then transfer it to the forefront by the “Edit|Bring
to front ” menu command.
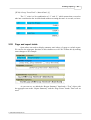
2.18
Displaying data in the form of a table
Sometimes it is necessary to display a report in the form of a table with a frame.
One of the examples of such a report might be a price list. To build such report in
FastReport, a user just needs to enable framing function for the objects located in the
“Data” band. Let us demonstrate several variants of frames with a test report example.
Let us create a report of the following kind:
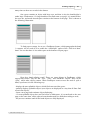
Place the “text” objects on the band side by side, and minimize band’s height.
The first and the simplest type of the table is a table with a full frame. To do this,
one needs to enable all frame lines in every object:
The next type of framing would display only horizontal or only vertical lines. Such
framing is performed in exactly the same way. Horizontal or vertical frames can be
enabled in objects.
© 1998-2006 FastReports Inc.
Creating reports
41
Finally, to show only the external framing, the report needs to be slightly modified:
As you can see, we have added two “Text” objects 1 in pageheader and 1 in
pagefooter bands and enabled frame lines for the objects along the edges of the data-band.
As a result, the report will look as follows:
© 1998-2006 FastReports Inc.
42
FastReport 3.0 User's Manual
All examples covered, contained bands, which had fixed sizes. But how is it
possible to display a table, in a case where the band is stretched? Let us explain that, using
the example below. Add a new field (a multi-lined text from “Bio.Notes”) to our report.
As you already learned, the “Stretch” property must be enabled both for this object and for
the band, in which the object is located. In this case, the band height is sized depending on
size of the text in the “Text” object. Thus, we would output a report which appears like
this:
It is a little bit different from what we need; one would prefer the frames of the
neighboring objects to be able to stretch as well. FastReport allows one to solve this
problem easily. For constructing such reports, it is enough to enable the “Stretch
downwards” property (or StretchMode = smMaxHeight in the object inspector) for all
objects, which are to be stretched. Thus, the FastReport core first calculates the maximum
band height, then it “stretches” objects with the enabled option to the bottom band edge.
Due to the fact that object frames stretches together with the object, the report’s
appearance changes:
© 1998-2006 FastReports Inc.
Creating reports
2.19
43
Printing labels
In contrast to table reports, data in reports such as “label,” are allocated one under
another. Let us examine an example of such report, which displays data about fishes (see
the previous example). The report is presented in the form of a label, and has the
following structure:
When previewing this report, we would see the following output:
Notice you can see, there is a lot of whitespace in the right part of the page. To fill
the whole page, the number of columns, where the data will be displayed, can be set in
report page settings. To perform this, you should either double-click on the area of white
space on the page, or use the menu’s “File Page|Options...” menu item.
In this pagetab, one can set such column parameters, as number of columns, its
width, and position. In our case, it would be enough to specify a number = 2, since
© 1998-2006 FastReports Inc.
44
FastReport 3.0 User's Manual
FastReport adjusts all the other parameters automatically. The column frame is displayed
in the designer as a thin vertical line:
Printing will now be performed in the following way. FastReport will display the
“First level data” band as long as there is white space on the page. After that, a new
column in the same page will be formed (in contrast to simple reports, in which a new
page is created), and band would continue to be displayed on the top. However, now all
the objects are shifted to the right, according to column’s width. It will continue until all
the columns are displayed. After that, FastReport forms a new page and continues to
display data from the first column.
Our report with two columns should appear as below:
The “Columns” property, available in all data-bands, is another way to set number
of columns. It allows to set number of columns for a particular band and not for the whole
page (as it was in previous example). Thus, data will display from left to right, then from
top to bottom , instead of, from the top to bottom, then from the left to the right,”.”
We’ll disable columns in the page (set the columns number = 1) and enter “2” in
the band ‘s “Columns” property. FastReport displays the column frames as dotted lines.
We can modify column dimensions by setting the “ColumnWidth”, “Column Gap”
properties:
A report constructed in such a way, will differ from the previous one only by
© 1998-2006 FastReports Inc.
Creating reports
45
displaying the data “from-left-to-right, then from-top-to-bottom” order.
2.20
Child-bands
Let us examine the case when one of the lines in a report of “label” type, may have
a variable size. To simulate the situation using our example, let us reduce the
“Bio.”Common Name”” object width to 2.5 cm, and enable the “Stretch” option for it. Let
us also enable stretching in the “First level data” band. Enable all the frame lines in all
objects so that the principle of the stretching function will become clear. This will output a
report with the following appearance:
You see, that in the first case the first object contains longer text, and this is why it
was stretched into two lines. Thus, the object (located underneath it and linked to the
Bio.”Length (cm)” field) was shifted down. This happens because all the objects have the
“Shift” property enabled by default (ShiftMode = smAlways in the object inspector). Such
objects shift downwards if there is a stretchable object above them (a “Text” object with
the “Stretch” property enabled). The height value, by which the object shifts, depends on
how the object from above is stretched.
However, it is unacceptable in this case, since we need the object with the
“Length, cm.” text to be shifted as well. To perform this, there is a special band type in
FastReport, the “Child-band.” It is linked to (and is displayed after) it’s parent band. Add
a “Child” band to our reports design layout and move the 2 Text objects into it.
© 1998-2006 FastReports Inc.
46
FastReport 3.0 User's Manual
Link the Masterdata band to the Child band, by setting it’s “Child” property in the
object inspector. Now, each time the “Masterdata” band prints, the “Child” band will be
printed immediately afterward:
As you can see, now the title is typed exactly where it is supposed to be. In order to
avoid child-band’s transferring to the next page (which basically means, it will be
widowed from the parent band), enable the “Keepchild” property for the parent band
(“KeepChild” in the object inspector).
2.21
Shifting objects
You have already seen how the “Shift” property works. Let us look at the next
mode of shifting, “Shift on overlapping.” In the object inspector, the “ShiftMode=
smWhenOverlapped” property value corresponds to this mode. Thus, object shifting will
be performed in case, when the object from above overlaps the given object during
stretching. Three cases are shown in the illustration below. As you see, the bottom object
with the enabled “Shift when overlapped” option shifts only in the latter case, i.e. when
there is much text in the top object and it overlaps the bottom one.
© 1998-2006 FastReports Inc.
Creating reports
47
If the “Shift” option is enabled, the bottom object will be shifted anyway:
This allows one to create rather complicated report output, by using the logic of
the object’s design properties, especially if an object overlaps several other objects at the
same time. Thus, in the following example both of the upper objects contain stretchable
texts, and the bottom one has the enabled “shifting when blocking” option. The bottom
object will always be displayed closely to the object, which contains more text,
irrespective of text size in the upper objects:
In this example, if the “Shift” option is enabled for this object, the bottom object
will shift twice, since it is located underneath two objects and thus an unnecessary gap is
formed.
© 1998-2006 FastReports Inc.
48
2.22
FastReport 3.0 User's Manual
Report with two data levels (master-detail)
So far our example reports have used only one data-band, (“First level data” or
”Masterdata”), to control report output. This enabled output of data from one DB table.
FastReport allows one to design report layouts having up to six data levels, on one design
page. (It is possible to have more data levels by using the “subreport” object. This feature
will be covered later). Generally, most reports are limited to 1-3 data levels with large
numbers of data levels being rare.
Let us examine the two data level report design process. It will output data from
the demo tables: “Customer” and “Orders.” The first table is the list of clients; the second
one is the list of orders placed by the clients. The tables contain data in the following
fields:
Customer:
CustNo
1221
1231
1351
….
Company
Kauai Dive Shoppe
Unisco
Sight Diver
Orders:
OrderNo
1003
1023
1052
1055
1060
1123
….
CustNo
1351
1221
1351
1351
1231
1221
SaleDate
12.04.1988
01.07.1988
06.01.1989
04.02.1989
28.02.1989
24.08.1993
As you can see, the second table contains the list of all the orders placed by all
companies. To view all of orders from table 2, placed by a company, selected from table1,
the tables are linked on the “CustNo” field, which is common to both tables. The report
output from such data should appear as follows:
1221
1023
1123
Kauai Dive Shoppe
01.07.1988
24.08.1993
1231
1060
Unisco
28.02.1989
1351
Sight Diver
© 1998-2006 FastReports Inc.
Creating reports
1003
1052
1055
49
12.04.1988
06.01.1989
04.02.1989
Create a new report.Put two "ADO Table" to the page and set its properties:
ADOTable1:
TableName = 'Customer'
UserName = 'Customers'
ADOTable2:
TableName = 'Orders'
UserName = 'Orders'
Now add a “Master data” and “Detail data” bands on the page:
Note that the “Master Data” band must be placed above the “Detail Data” band! If
placed under it, FastReport will generate an error message when you preview the report.
If you previewed the report now, you would see that the list of orders remains the
same for every customer and contains all records from the “Orders” table. This happens
because we did not set the mastersource property of the “Orders” table. Set the "Master =
ADOTable1" property in the "ADOTable2" component. Now, we have set a
“master-detail” connection. After that, we select the fields to link on. Set the
“MasterFields” property of the "ADOTable2" component:
© 1998-2006 FastReports Inc.
50
FastReport 3.0 User's Manual
We need to link together two “CustNo” fields in both sources. To perform this,
select the desired fields, and then click on “Add” button. Fields linkage will appear in the
bottom pane. After that, close the editor by clicking “ОК.”
When previewing a report, FastReport does the following. After outputting a
record from the master table (Customer), it will set the filter on the detail table (Orders).
Only those records, which match the “Orders.CustNo = Customer.CustNo” condition will
remain in the table. That means that for each customer only those orders which belong to
the current customer will be displayed in the detail band. Note this is an important concept
to grasp. Even though databands may be of master or detail type, they only control where
the data appears on the output page (order and no of times of appearance). What data their
objects display is dependant upon which fields the objects contain and the external tables
relationship linkage.
The illustration below shows the new output appearance.
© 1998-2006 FastReports Inc.
Creating reports
51
Reports, containing up to 6 data levels can be constructed in the similar way.
2.23
Headers and footers of a data band
Each data band may have header and footer. Headers are output before a data band,
footers are output after all data records are output. Here is an example of how the
headers/footers working in case of simple report:
Let's look at more complex example using two data levels - master-detail:
© 1998-2006 FastReports Inc.
52
FastReport 3.0 User's Manual
As we can see the header is output before all data-band records. Thus master data
header is printed once at the beginning of a report, detail data header is output before each
group of detail bands belonging to the current master record band. The detail footer is
output after the group of detail bands belonging to the master record band, the Master
footer is not output until after all the master databand records.
Using the FooterAfterEach property of the data band, we may override this
behavior. Setting this property to True (you may also use context menu of the data band,
"Footer after each row" item) will cause the footer to output after each data row. It may be
useful in some cases when designing master-detail reports. The previous example with
FooterAfterEach property of the master data set to True will appear this way:
© 1998-2006 FastReports Inc.
Creating reports
2.24
53
Report with groups
In the previous example We constructed a two-leveled report based on the data
from two tables . FastReport allows designing of reports which appear the same, based on
one set of data, the result of a joined query.
To perform this, one needs to create a query using SQL language, which would
return data, arranged according to a certain condition, from both of the tables. In our case,
a condition will be the value of the “CustNo” fields in both of the tables. An SQL-query
may look as follows:
select * from customer, orders
where orders.CustNo = customer.CustNo
order by customer.CustNo
The "order by" line is needed to sort the records on the “CustNo” field. The
example below shows how the query data would be returned:
CustNo
1221
1221
1231
1351
1351
1351
Company
…
Kauai Dive Shoppe
Kauai Dive Shoppe
Unisco
Sight Diver
Sight Diver
Sight Diver
OrderNo
1023
1123
1060
1003
1052
1055
SaleDate
01.07.1988
24.08.1993
28.02.1989
12.04.1988
06.01.1989
04.02.1989
How can a multi-leveled report be constructed on the basis of this data? In
FastReport there is a special band – “Group Header”. A special condition is established
for the band (DB field value or an expression); the band is output every time the field's
value is changed. The following example illustrates this.
Create new report. Put the "ADO Query" component to the page and set its
properties:
SQL =
select * from customer, orders
where orders.CustNo = customer.CustNo
order by customer.CustNo
UserName = 'Group'
After that, add the “Group header” and “Master data” bands to the report. Set a
condition (in this case, it is “Group.CustNo” data field) in the “Group header” band editor:
© 1998-2006 FastReports Inc.
54
FastReport 3.0 User's Manual
Let us link data-band to the “Group” data source and place the objects in the
following way (note, that the group header must be placed above the data-band):
On previewing, we would see a report similar to the one shown below:
As you can see, the “Group header” band is output only when the field, to which it
is associated, changes its value. Otherwise, the data-band connected to the group is
© 1998-2006 FastReports Inc.
Creating reports
55
displayed. If compare this report to the master-detail report, which we constructed earlier,
it should be obvious that order numbers are not sorted in ascending order. This is easily
corrected by changing the SQL query’s order by clause text:
select * from customer, orders
where orders.CustNo = customer.CustNo
order by customer.CustNo, orders.OrderNo
Similarly, reports with nested groups can be constructed. The number of nested
groups is unlimited in such reports. Reports using groups, have some advantages over
reports of the master-detail type:
- the whole report needs only one dataset (query);
- the number of the data grouping levels is unlimited;
- the additional data sorting feature;
- more optimal usage of the DB resources (the query returns only one dataset, which can
be output, without having to filter the data).
The only disadvantage is the need to write queries in SQL language. However,
knowledge of SQL basics is obligatory for a programmer working with databases.
2.25
Other group features
Let’s look at how the group is transferred to the next output page:
When looking at the printout of the report, it is unclear which client the list of
© 1998-2006 FastReports Inc.
56
FastReport 3.0 User's Manual
orders on the very top of the second page refers to. FastReport allows repeating the group
header output (which in our case contains information about the client) on the next page.
To perform this, the “Reprint on new page” menu item (or the “ReprintOnNewPage”
property in the object inspector) should be enabled in the “Group header” band. This will
then display the following output:
There is another way, which allows one to avoid breaking of groups. This is the
“Keep together” group header property (or “KeepTogether” context menu ) It should be
enabled. Then, if the whole group does not find room on the output page, it is transferred
to a new page. In our example, it will appear as follows:
© 1998-2006 FastReports Inc.
Creating reports
57
Thus, much blank space may appear on several pages, but the group will be
displayed as a whole on the page if possible.
In conclusion, the “StartNewPage” group header property allows output of each
group on a separate page. This probably will lead to a waste of paper, however it might be
useful in some cases.
2.26
Lines numbering
Let us use our example in order to show how to number lines in the group. To
perform this, w add a “Text” object with a system variable [Line] to both of our bands (it
is easier to perform this using the drag&drop method from the “Variables” page tab of the
“Data Tree” tool window).
When previewing the report, we can see that both the data levels now have their
line numbers:
© 1998-2006 FastReports Inc.
58
FastReport 3.0 User's Manual
For continuous numbering of the second level data, we use the “Line#” variable
instead of “Line” in the text object on the data-band. The result will then appear as below:
2.27
Aggregate functions
In most cases, group reports need to display some summary result information
(such as: “total of a group,” “number of group elements,” etc). FastReport provides these
aggregate functions this purpose. With their use, one can retrieve the defined aggregate
value over a data span. The list of aggregate functions:
SUM
MIN
MAX
AVG
Returns the total of the expression
Returns the minimal value of the expression
Returns the maximal value of the expression
Returns the average value of the expression
© 1998-2006 FastReports Inc.
Creating reports
COUNT
59
Returns the number of lines (rows) in the data span
The syntax of all aggregate functions (except COUNT) is as shown below, using
an example of the “SUM” function):
SUM(expression, band, flags)
SUM(expression, band)
SUM(expression)
The parameters assignment is as follows:
expression – the expression, the value of which will be handled
band – the name of data band, on which the value(s) to be handled originally reside
flags – a bit field, which can be the following values or their sum
1 – include invisible bands in calculation
2 – accumulate the value or running total(do not reset the result value when the
current data span resets)
An expression is the only mandatory parameter; all the rest are optional.
Nevertheless, it is recommended to always use band parameters, to avoid mistakes.
The “COUNT” function has the following syntax:
COUNT(band, flags)
COUNT(band)
The parameters assignment is similar to the one described above.
There is a general rule for all aggregate functions: a function can be counted only
for the data-band and used only in that band’s footer (the following bands refer to the
latter: footer, page footer, group footer, column footer, and report footer( summary band)
).
How do aggregate functions work? We will examine it using our group report
example. Let us add some new elements to the report:
The Group."ItemsTotal" field on the data-band will display the current order total.
© 1998-2006 FastReports Inc.
60
FastReport 3.0 User's Manual
Place a “Text” object in the group footer containing the aggregate SUM call, as shown
above,. It will display the total of all orders placed by the given client when previewed.
Using a calculator, we can check to make sure that everything works as expected:
So, how do the aggregate functions work? Before outputting a report, FastReport
scans the “Text” objects’ contents in order to find the aggregate functions. The functions
found will be associated to the corresponding data-bands (in our example, the “SUM”
function is associated with the “MasterData1” band). During outputting of a report (when
the data-band is displayed) the value of the aggregate functions linked to it is counted up.
In our case, the “Group."ItemsTotal"” field’s values are accumulated. After outputting a
group footer (the one where the accumulated value of the aggregate function is displayed)
the function value is reset, and the cycle is repeated for the next groups.
The purpose of the optional “Flags” parameter in the aggregate functions. In some
reports, some of data-bands (or all of them) may be hidden, however, we may need to
result value which considers all data-bands, visible or not. In our example, set the
“Visible” property of the data-band to false; after that it will stop displaying. To count a
total on the hidden data-band, we add the optional parameter to the function call:
[SUM(<Group."ItemsTotal">,MasterData1,1)]
It will give us a report, which would look as follows:
When the “Flag parameter” value = 2, the accumulated value will not be reset
right after it is displayed. The result will become a “running total” on each successive
output. Let’s modify the call of the function as shown below:
© 1998-2006 FastReports Inc.
Creating reports
61
[SUM(<Group."ItemsTotal">,MasterData1,3)]
The “3” value is a bit combination of “1” and “2,” which means that we need to
take into consideration the invisible bands without resetting the total. As a result, we have:
2.28
Page and report totals
Quite often, one needs to display summary total values of a page or a whole report.
We can use the aggregate functions in this situation as well. We’ll show this by making
some changes to our example.
As you can see, we added the “Report Summary” band and a “Text” object with
the aggregate sum to the “Report Summary” and the “Page Footer” bands. That is all we
need.
© 1998-2006 FastReports Inc.
62
2.29
FastReport 3.0 User's Manual
Inserting aggregate function
So far we inserted the aggregate functions into the “Text” object manually. Now
we will look at other ways to insert aggregate functions.
First of all, we can use the “System text” object for output of the aggregate
function value. As a matter of fact, it is the same “Text” object, but one that has a special
editor for easier insertion of system variables or aggregate functions.
© 1998-2006 FastReports Inc.
Creating reports
63
You should step by step select a function type, a data-band (according to which it
will be counted), and a DB field or an expression, value of which will be computed. You
can also set the “Count invisible bands” and “Running totals” flags.
The second way is to use the “Text” object and the
button in its editor, to
invoke the additional window, similar to the “System text” object editor. When clicking
the “OK” button, the call of the aggregate function is inserted into the object's text.
2.30
Values formatting
A peculiarity of the aggregate functions returned numerical values, is that they are
not formatted. It should be evident, when referring to the first example with the “SUM”
function:
© 1998-2006 FastReports Inc.
64
FastReport 3.0 User's Manual
This happens because, as a rule, the data fields return a formatted value, which is
simply displayed by the “Text” object, with no changes applied. To apply formatting to
the “SUM” function result, let us use the value formatting tools of FastReport.
Select the object with the sum and call its context menu. The format editor is
called either by using the “Formatting...” menu command, or with the “DisplayFormat”
property editor in the object inspector.
Here you can see, the list of formatting categories on the right and the list of the
available category formats on the left. We’ll select the “Number” category, and the
"$1,234.50" format. At that, the format string corresponding to the selected format and the
decimal separator character will be displayed. You can modify a format string as well as a
separator.
After clicking the “ОК” button and report previewing, you will see that the sum
total in the report is now formatted correctly:
2.31
Inline formatting
In the example, formatting was applied to the object, and any expression located in
the object. Everything worked correctly because there was only one expression in each
object. However, if we have more than one expression and, they require different
formatting, we can use inline formatting.
© 1998-2006 FastReports Inc.
Creating reports
65
Using the example, resize the footer, it’s object and the objects text as shown
below.
Total: [SUM(<Group."ItemsTotal">,MasterData1)]
Number: [COUNT(MasterData1)]
The total and number of orders will display in the object.:
When previewing both of the values are presented in monetary format (which we
had previously set), which is incorrect:
To display each value correctly, they should be formatted individually. To
accomplish this, we use format tags. They are added before the closing square bracket of
the expression. For our example, disable the object formatting (select the “Text (without
formatting)” category in the format editor). Now we need to modify the format of the first
variable, since the second will definitely be displayed correctly (without formatting, i.e. as
an integer, and this is what we need). Modify the object text in the following way:
Sum: [SUM(<Group."ItemsTotal">,MasterData1) #n%2,2m]
Number: [COUNT(MasterData1)]
Preview, to make sure that the object displays correctly:
When using format tags, the general syntax is as follows:
[expression #tag]
Note that space between the expression and the “#” sign is mandatory! The tag
itself might look as follows:
#nFormattingLine – the numerical format
#dFormattingLine – date/time format
#bFalse,True – boolean format
“FormattingLine” in every case is the argument to the function, by which
formatting is accomplished. Thus, for numerical formatting, Format function is used, for
© 1998-2006 FastReports Inc.
66
FastReport 3.0 User's Manual
date/time it is the FormatDateTime function. Below are several values used in FastReport:
for the numerical formatting:
%g – a number with the minimal signs number after decimal point
%2.2f – a number with the fixed number of signs after decimal point
%2.2n – a number with bits delimiter
%2.2m – a monetary format, accepted in the Windows OS, depending on the regional
settings in the control panel.
for the date/time format:
dd.mm.yyyy – date of the 23.12.2003 type
dd mmm yyyy – date of the 23 Nov. 2003 type
dd mmmm yyyy – date of the 23 November 2003 type
hh:mm – time of the 23:12 type
hh:mm:ss – time of the 23:12:00 type
dd mmmm yyyy, hh:mm – time and date of the 23 November 2003, 23:12 type
It is acceptable to use a comma or dash instead of period in the line for the
numerical format. This symbol will be used as a separator between the integer and the
fractional parts of the value. Usage of other separators is not acceptable.
Formatting of the “#b” type (boolean), the formatting line is presented as two
values separated by comma. The first value corresponds to “False,” the second one
corresponds to “True.”
In order to avoid the necessity to memorize all these tags and their meanings, there
is a convenient resource for formatting insertion in the “Text” object editor. When
clicking the
button, the format editor (which we have already examined) is called.
After selecting a format, it is inserted to the text. Thus, if the cursor is placed before or
after the closing square bracket, the format will be inserted correctly.
2.32
Conditional highlighting
This feature of the ”Text” object allows one to color an object according to a
specified condition. Any expression can be a condition. We’ll use the example with
groups to demonstrate. Let the order totals, which are larger than 5000, be green-colored.
Select the object with the “Group."ItemsTotal"” field and click on the “Conditional
highlighting”
button in the designer toolbar. In the conditional highlight editor, enter
a condition, which after the value is exceeded, the object will be highlighted, and specify
the color attributes to change (font parameters and background color).
© 1998-2006 FastReports Inc.
Creating reports
67
The preview result will appear as follows:
Note the conditional expression we specified (Value > 5000). Value is the DB
field value, to which the object is linked. In a similar way, the “<Group."ItemsTotal"> >
5000” condition may be set. In general, any expression, which is correct in terms of
FastReport, may be specified here.
2.33
Show stripes (Alternate color every other data row)
Using conditional highlighting, it is easy to create a report having this appearance,
by “coloring” every second data line. Using the “Customer List” report example which we
constructed previously, to save effort.
Remove all the “text” objects from the “Master data” band. Put a “Text” object on
the data-band and stretch it, so that it would occupy practically all the band space:
© 1998-2006 FastReports Inc.
68
FastReport 3.0 User's Manual
This object will modify its color depending on the data line number. Select the
object and set the following conditional expression in the highlight editor:
<Line> mod 2 = 1
Attention: if you have selected C++Script as a script language (see more details in
the "Script" chapter), you should write the condition using C++Script:
<Line> % 2 == 1
Select gray color for highlighting, but not too saturated (closer to white). Now
other objects can be added to the data-band on top of the empty “text” object:
When previewing the report, we will can see the following output:
© 1998-2006 FastReports Inc.
Creating reports
2.34
69
Multipage reports
FastReport reports can consist of several design pages. You can adjust such
parameters as size and orientation for each page, as well as to place different objects and
bands on it. When outputting this type of report, all bands from the first design page will
be displayed, then the bands from the second one, etc.
When a user creates a new report in the designer, it already contains one page by
default. You can add a new page by clicking on the
button in the toolbar or by
selecting the “File|New page” menu command. Then you would see that a new page tab
appears in the designer:
One can easily switch between pages by clicking on the required page tab. Page
tabs can be dragged (“drag&drop”), to easily modify their order An unnecessary page can
be deleted using the
button in the toolbar or by selecting the “Edit|Delete page" menu
command. One can also call the context menu by right-clicking on the page tab:
The number of design pages in a report is unlimited. As a rule, additional pages are
used either for previewing title pages, or in more complicated reports, those which contain
data from many sources.
A simple example of title page creation. Let us use our previous report with one
data level. Add a new page to it, this will be the second page. To move it to the front of
the report, grab the page tab using the mouse, and then drag it to the place near the first
page. At that, the pages order will be changed. Switch to the new page and place a “Text”
object (with the “Our report” text inside) in the middle of the page. That is all we need to
do. The report with a title page is finished:
© 1998-2006 FastReports Inc.
70
FastReport 3.0 User's Manual
It is necessary to pay attention to one feature of multipage reports. If the “Print to
previous page” option is enabled in the second page (use the “PrintToPreviousPage”
property in the object inspector), then the second page objects will start printing not on a
new output page, but on the white space of the previous one. This allows to print the pages
’ contents “line-to-line.”
2.35
Nested reports (subreports)
Sometimes it is required to display in a particular place, on a design page
additional data, which may represent a separate report with a complicated structure. One
may construct such report by using a set of FastReport bands, but it is not always possible.
In such cases, the “Subreport” object is used
.
After inserting such an object to a report, we can see that FastReport automatically
adds a new page, connected to this object. A nested report resembles a multipage one in
terms of structure. The only difference is that the nested report is displayed in a specified
location on the basic design page , and not after it. When outputting a report, as soon as
the “Subreport” object is encountered, the report engine, outputs the associated design
page, until it is complete. After that, basic design page output will continue.
One can also place a “Subreport” object in a Subreport design page, increasing the
nesting level. An example of such a report can be found in the demo program, the
© 1998-2006 FastReports Inc.
Creating reports
71
“Subreports” report.
It should be noted that FastReport’s ability to construct subreports enables it to
increase nesting levels of data. Remember that number of data levels in FastReport is
limited to six when you do not use the “Subreport” object.
2.36
Side-by-side subreports
You can have two or more “Subreport” objects side by side on the same band:
This allows one to design reports, where the data output by each has different
lengths (rows/records), or stretching or heights :
As you can see, FastReport continues to output the basic design page, after the
longest Subreport is finished. One can also use the Vertical alignment property to adjust
text object alignment within each subreport.
2.37
Limitations on using subreports
Since subreports are substituted on the basic design page, it cannot contain the
following bands: “ReportTitle/ReportFooter,” “PageTitle/PageFooter/PageBackground,”
and “ColumnTitle/ColumnFooter.” It is possible to put these bands on the nested report
page, but they however will not be handled. For the same reason, there is no sense in
modifying nested report pages options, inasmuch as the options of basic report’s page are
used during outputting of a report.
Do not put objects below the “Subreport” object:
© 1998-2006 FastReports Inc.
72
FastReport 3.0 User's Manual
When displaying a nested report, the nested report objects will overlay everything
placed below, and the user will see something like this:
To display the objects below/after the nested report, use a child-band:
This method is also used when it is necessary to display several Subreports one
under another, use a child band for each Subreport and chain them together. Child1’s child
property is set to child2 and so on.
2.38
PrintOnParent option
The "Subreport" object has the "PrintOnParent" property which can be useful in
some cases. This property is False by default.
Usually a subreport is output as a set of bands on the basic report page. In this
case the parent band (which contains a "subreport" object) do not depend on the subreport
bands, i.e. can't stretch. If the "PrintOnParent" property is True (you can set it from the
object inspector or in the context menu), subreport's objects are printed physically on the
band which contains the "subreport" object. You can make this band stretched and put on
it stretched objects:
© 1998-2006 FastReports Inc.
Creating reports
© 1998-2006 FastReports Inc.
73
Chapter
III
Cross-tab
reports
Cross-tab reports
75
This kind of report has a table structure, which means that it consists of rows and
columns. At the same time, it is not known beforehand, how many lines and columns a
table would possess. That is why a report grows not only downwards (as the report types
examined above) but sideways as well. A typical example of a report of such type is
shown below.
Let us examine the elements of the table:
In the illustration, we see a table with two lines (rows) and four columns, where
“a” and “b” are line titles, “1,” “2,” “3,” and “4” are column titles, and “a1”..”a4,”
“b1”..”b4” are cells. To construct a report like this, we need just one set of data (a query or
a table), which has three fields and contains the following data:
a
a
a
a
b
b
b
b
1
2
3
4
1
2
3
4
a1
a2
a3
a4
b1
b2
b3
b4
As you can see, the first field contains a line number, the second one has a column
number, and the third one contains the cell contents at intersection of the table with the
selected number. When outputting a report, FastReport creates a table in memory and fills
it with data. Thus, the table expands dynamically, if a line or a column with a specified
number does not exist.
Titles can consist of more than one level. See the following illustration:
In this illustration, the number, or index of the column is composite, i.e. it consists
of two values. This report requires the following data:
© 1998-2006 FastReports Inc.
76
FastReport 3.0 User's Manual
a
a
a
a
b
b
b
b
10
10
20
20
10
10
20
20
1
2
1
2
1
2
1
2
a10.1
a10.2
a20.1
a20.2
b10.1
b10.2
b20.1
b20.2
In this example, the first field contains the line index, as it was before; the second
and the third fields contain column indexes. The last field contains the cell value. Examine
the following picture in order to make it clear, how FastReport constructs a tables with
complex titles:
Before handling is accomplished, our table would look like the table shown in the
picture. During handling, FastReport unites the title cells with equal values, which are
allocated on one level.
The next table element, which is shown in the following picture, displays
intermediate totals and totals:
This report is constructed using the same data, as we used in the previous one. The
columns, highlighted with gray in the picture, are calculated automatically and are not
included in the initial data set.
3.1
Construct a cross-report
Now let us turn from theory to practice. We will construct a simple cross-report,
which will display employees’ salary during four years. To do this, we need the “crosstest”
table. The table contains data of the following kind:
© 1998-2006 FastReports Inc.
Cross-tab reports
Name Year
Ann 1999
Ben 2002
….
77
Salary
3300
2000
Create new report. Put the "ADO Table" component on the page and set its
properties:
TableName = ' crosstest'
UserName = 'SimpleCross'
From design mode toolbar, click the other objects button to show the fly out menu
below.
Select the “DB cross-tab” object from the list: Click on the design page to place
the object, which appears as a simple rectangle:
All settings are specified using the object’s editor. Call it by double-clicking on the
object:
© 1998-2006 FastReports Inc.
78
FastReport 3.0 User's Manual
The Numerical list of the Editor’s items from the illustration above:
1 – A drop-down list with available data sources;
2 – The list of fields in the selected data source. The fields from this list can be dragged to
the “4,” “5,” and “6” lists;
3 – Structure options here one can specify whether it is necessary to display titles and
totals;
4 – The list of fields, which generate a line (row),header;
5 – the list of fields, which generate a column header;
6 – The list of fields, which generate a table cell;
7 – Table structure preview. All the elements in the table are selectable by a click;
8 – Toolbar for modifying table element design:
- table style select, choose a predefined style;
- cell font parameters;
- text alignment;
- text rotation;
- conditional highlighting;
- cell format;
© 1998-2006 FastReports Inc.
Cross-tab reports
79
- cell frame and filling.
You can only use the mouse in this editor to make modifications. For our demo, it
is enough to drag fields from the “2” list to the “4,” “5,” and “6” lists, as shown in the
illustration above. After that, close the editor by clicking the “ОК” button
. When
previewing the report now, you will see a table resembling the one shown below:
Let’s modify the object’s appearance. Call the object editor once again. The first
thing we want to do, is to modify the titles’ colors and to display “Total” instead of
“Grand total.” It is very easy to do, in the table preview editor (7) in the illustration. Here
the cross-table structure is displayed, and it can be set using the mouse. The selected area
is displayed with an orange frame:
To change the title color into gray, click on the “Year,” “Name,” and “Grand
Total” areas one after another, and then select the desired color using the
button in the
toolbar. To change the bottom left “Grand Total” text, double-click on the cell, and then
you will see the familiar text editor, where one can type “Total.” After that, when our
report is previewed it will appear as follows:
To set the format of the currency values: In the cross-object editor, click on the
© 1998-2006 FastReports Inc.
80
FastReport 3.0 User's Manual
“Total” object and the object representing a cell (with the “0” text) one after another and
select the required format by clicking on the
following result:
3.2
button in the toolbar. You will get the
Using functions
In our previewed example, we see the sum total of each employee’s salary during
four years in the “Total” line. One can use the following functions:
SUM – sum of values
MIN – minimal value
MAX – maximal value
AVG – average value
COUNT – number of values
Let’s use the “MIN” function in our example. Open the cross-object editor in area
(6) the "Salary" field item, click the down arrow.
Select the “MIN” function in the menu. Now one can modify a text in the cell of
totals from “Total” to “Minimum.” A finished report will look as follows:
© 1998-2006 FastReports Inc.
Cross-tab reports
3.3
81
Sorting values
Lines and columns values are arranged in ascending order, if values have
numerical type, they are sorted by value, and if they have line type, they are sorted
alphabetically. We can separately set our own sorting mode for each line and/or column
value. The following modes are available: “arrange in ascending order,” “arrange in
descending order” and “perform no sorting.” In the latter case, values in lines/columns
will be displayed depending on their entries.
Let us modify column sorting in our example. Let years be arranged in decreasing
order. To perform this, let us enter the cross-object editor and select the “Year” column
element (5). To modify sorting, click on the item’s down arrow select descending:
Close the editor and preview the report. It will look as follows:
3.4
Table with composite headers
Our previous example contained one value per line, and column headers. Let us
examine cross table design using a complex header, which means that it will contain two
or more values. The table contains data of the following kind:
© 1998-2006 FastReports Inc.
82
FastReport 3.0 User's Manual
Name Year
Ann 1999
Ben 2002
….
Month
2
1
Days Salary
3
1000
5
2000
We have added the “Month” and “Days” fields, which contain month number and
the number of working days respectively. One can construct several reports on the basis of
this data, for example, salary of all the employees during all years, broken down by
months.
What kind of a report we are going to get? It must resemble the report from the
previous example, but at the same time it must be broken down by months as well. The
cross-object must be set in the same manner. We’ll add the “Month” field into the column
header by dragging it to the column header list. See the illustration below.
In the table preview of the editor the table layout structure is displayed:
As a result, when previewing, we would see the following report:
Note, that FastReport automatically added a column of the intermediate totals,
© 1998-2006 FastReports Inc.
Cross-tab reports
83
which are displayed after each year. This option can be set in the cross-object editor, by
selecting the “Year” column element and disable the “Subtotal” flag:
In addition, one can note that there is no intermediate total in the bottommost
column element (the same is true in cases, when this element is the only one). Actually, in
our example, we do not need intermediate totals for each month.
Another feature of intermediate totals: In our example, it is desirable to display
“Year + year total” instead of the “Total” text. In the cross-object editor, select the
required object in the bottom part of the editor, and then enter the following text to it:
Total for [Value]
During construction, the “Value” expression will be replaced by the actual value of
the column header value, located above:
3.5
Adjusting cell width
When looking at the previous illustration, it should becomes obvious that
FastReport automatically adjusts cells width in a way, which allows the longer lines to fit
the cells. It is not desirable in some cases however, since values with very long text lines
become ugly. What can be done in such case? The simplest way is to break lines in the
text of object with intermediate totals, i.e. to insert a line into it:
Total
for[Value]
You see that the table appears more compact now:
© 1998-2006 FastReports Inc.
84
FastReport 3.0 User's Manual
However, this method cannot be used if the lines’/columns’ values are rather long,
they cannot be corrected by breaking the line manually. This is why the cross-object has
the “MinWidth” and “MaxWidth” properties (minimal and maximal cell width
respectively). Both these properties are accessible only via the object inspector.
The “MinWidth” value is “0,” and the “MaxWidth” value is “200” by default. This
is quite enough in most cases. You can set your values, according to any special
requirement you desire.
Thus, in our example, we can set the following: MinWidth = MaxWidth = 50. This
would signify that table cell width must be 50 pixels at any rate. If a cell is smaller, it is
“adjusted” to the “MinWidth” value, if it is bigger, its width is fixed according to the
“MaxWidth” value, and the text in the cell is divided. In our example, it would appear as
follows:
3.6
Font colors and highlighting
Sometimes it is necessary to highlight values and/or change font color. We have
examined such a task in the group report example. Where we used conditional
highlighting for the “Text” object, this can be useful for us now as well.
To add highlighting: using our example, assume that we need to change font color
© 1998-2006 FastReports Inc.
Cross-tab reports
85
for the values, which are more than 3000. We’ll enter the cross-object editor and click on
the object, representing the table cell, in the bottom of the editor window:
To set highlighting parameters, click on the
button in the toolbar. The already
familiar highlighting editor window will open, where one can set the following condition:
Value > 3000
and the font color to red
This is all we need. Close the editor by clicking on the “OK” button and preview
our report:
In the same way, a user is able to highlight total values, columns and lines, if
necessary.
3.7
Managing a cross-table from the script
If setting table visual resources is not enough, one can use the report’s script to
adjust settings for the appearance of the table. The “Cross-table” object has the following
events:
Event
OnAfterPrint
© 1998-2006 FastReports Inc.
Description
Event is called after printing a table.
86
FastReport 3.0 User's Manual
OnBeforePrint
Event is called before printing a table
OnCalcHeight
Event is called before calculating length of a row in
the table. The event handler can return either the
required value of height, or “0” when the row needs
to be hidden.
OnCalcWidth
Event is called before calculating column’s width in
a table. The event handler can return either the
required value of width, or “0” when the column
needs to be hidden.
OnPrintCell
Event is called before displaying a table’s cell. The
event handler can modify the cell’s design or its
contents.
OnPrintColumnHeader
Event is called before displaying a title of the table’
s columns. The event handler can modify design or
contents of the title’s cell.
OnPrintRowHeader
Event is called before displaying a title of the table’
s rows. The event handler can modify design or
contents of the title’s cell.
We can use the following methods of the “Cross-table” object in events:
Method
Description
function ColCount: Integer
Returns the number of columns in a table.
function RowCount: Integer
Returns the number of rows in a table.
function IsGrandTotalColumn
(Index: Integer): Boolean
Returns “True,” if the column with specified
number is the total one.
function IsGrandTotalRow
(Index: Integer): Boolean
Returns “True,” if the row with specified
number is a total one.
function IsTotalColumn
(Index: Integer): Boolean
Returns “True,” if the column with specified
number is a column with intermediate totals.
function IsTotalRow
(Index: Integer): Boolean
Returns “True,” if the line with specified
number is a line with intermediate totals.
procedure
AddValue(const Adds a value to the table.
Rows, Columns, Cells:
array of Variant)
Let us show, how one can highlight the third column (in our example it is the
“November 1999” date). To do this, select the cross-table object from the report design
© 1998-2006 FastReports Inc.
Cross-tab reports
87
page, in the object inspector click on the events page tab, locate the OnPrintCell event and
create the handler’s on the script page by dbl-clicking in the empty list to the right of the
event name, the script editor will appear with the basic declaration created for you then
add the code required in the empty begin end block of the declaration:
Pascal script:
procedure Cross1OnPrintCell(Memo: TfrxMemoView;
RowIndex, ColumnIndex, CellIndex: Integer;
RowValues, ColumnValues, Value: Variant);
begin
if ColumnIndex = 2 then
Memo.Color := clRed;
end;
C++ Script:
void Cross1OnPrintCell(
TfrxMemoView Memo,
int RowIndex,
int ColumnIndex,
int CellIndex,
Variant RowValues,
Variant ColumnValues,
Variant Value)
{
if (ColumnIndex == 2) { Memo.Color = clRed; }
}
We will see the following result when the report is previewed:
To highlight a column title, create an “OnPrintColumnHeader” event handler, as
described above :
Pascal script:
procedure Cross1OnPrintColumnHeader(Memo: TfrxMemoView;
HeaderIndexes, HeaderValues, Value: Variant);
begin
if (VarToStr(HeaderValues[0]) = '1999') and
(VarToStr(HeaderValues[1]) = '11') then
Memo.Color := clRed;
© 1998-2006 FastReports Inc.
88
FastReport 3.0 User's Manual
end;
C++ Script:
void Cross1OnPrintColumnHeader(
TfrxMemoView Memo,
Variant HeaderIndexes,
Variant HeaderValues,
Variant Value)
{
if ((VarToStr(HeaderValues[0]) == "1999") &&
(VarToStr(HeaderValues[1]) == "11"))
{
Memo.Color = clRed;
}
}
Result would appear as follows:
How the scripts work. The “OnPrintCell” event handler is called before printing a
cell included in the table’s body (when printing cells from the table title, either the
“OnPrintColumnHeader,” or the “OnPrintRowHeader” handler is called). At the same
time, a link to the “Text” object, which represents a table’s cell (“Memo” parameter), and
the cell’s “address” in two variants: the number of row, column and cell (the last is
relevant, if your cross-table contains multi-leveled cells) in the “RowIndex,”
“ColumnIndex,” and “CellIndex” parameters respectively, are transmitted into the
“OnPrintCell” handler. The “RowValues” and the “ColumnValues” parameters are the
second variant of the “address.” The “Value” parameter is the cell’s contents.
To specify an “address,” you can use the second variant (RowValues,
ColumnValues), since it is easier in the given case (as well as the first one (RowIndex,
ColumnIndex)). In our case, it was necessary to highlight the third column; therefore, it
would be more convenient to analyze the first variant. Since numbering of columns and
rows begins with “0,” the “ColumnIndex = 2” checking allows us to define the third
column. One could do it in a different way, i.e. by analyzing the required column by its
data (we need the 11th month of 1999):
Pascal script:
procedure Cross1OnPrintCell(Memo: TfrxMemoView;
© 1998-2006 FastReports Inc.
Cross-tab reports
89
RowIndex, ColumnIndex, CellIndex: Integer;
RowValues, ColumnValues, Value: Variant);
begin
if (VarToStr(ColumnValues[0]) = '1999') and
(VarToStr(ColumnValues[1]) = '11') then
Memo.Color := clRed;
end;
C++ Script:
void Cross1OnPrintCell(
TfrxMemoView Memo,
int RowIndex,
int ColumnIndex,
int CellIndex,
Variant RowValues,
Variant ColumnValues,
Variant Value)
{
if ((VarToStr(ColumnValues[0]) == "1999") &&
(VarToStr(ColumnValues[1]) == "11"))
{
Memo.Color = clRed;
}
}
Values, which are transferred in the “RowValues” and the “ColumnValues”
parameters, are arrays of the “Variant” type with a zero base. The zero element is a value
of the highest level of the table’s title; the first one is a value of the next level, etc. In our
case, the “ColumnValues[0]” contains years, and the “ColumnValues[1]” contains
months.
Why is “VarToStr” function necessary? This guarantees absence of errors during
type conversion. When operating with the “Variant” type, FastReport attempts to
automatically cast the strings to number format, which, in its turn, can lead to an error
when attempting to cast the “Total” and “Grand Total'” columns’ values.
The “OnPrintColumnHeader” event handler is called during output of column title
cells. The set of parameters is similar to the parameters of the “OnPrintCell” handler,
although in this case the cell’s “address” (the “HeaderIndexes” and “HeaderValues”
parameters) is transferred in a different way. The “HeaderValues” parameter returns the
same values, as the “ColumnValues” and “RowValues” parameters in the “OnPrintCell”
handler. The “HeaderIndexes” parameter is also an array of values of the “Variant” type,
which contains an address of the title’s cell in a different form: the zero element is the
serial number of the highest level of the table’s title, the first one is the number of the next
level, etc. To make the principle of cells numbering clear, refer to the picture below:
© 1998-2006 FastReports Inc.
90
FastReport 3.0 User's Manual
In our case, it is easier to analyze the “HeaderValues” value, but one can write the
following handler as well:
Pascal script:
procedure Cross1OnPrintColumnHeader(Memo: TfrxMemoView;
HeaderIndexes, HeaderValues, Value: Variant);
begin
if (HeaderIndexes[0] = 0) and (HeaderIndexes[1] = 2) then
Memo.Color := clRed;
end;
C++ Script:
void Cross1OnPrintColumnHeader(
TfrxMemoView Memo,
Variant HeaderIndexes,
Variant HeaderValues,
Variant Value)
{
if ((HeaderIndexes[0] == 0) && (HeaderIndexes[1] == 2)) { Memo.Color =
clRed; }
}
3.8
Adjusting rows/columns size
The user can adjust width and height of the table’s rows and columns using the
“OnCalcWidth” and “OnCalcHeight:” events’ handlers. Let us show how to increase
width of the column, which corresponds to the 11th month of 1999 by the following
example. To do this, create the “OnCalcWidth” event’s handler:
Pascal script:
procedure Cross1OnCalcWidth(ColumnIndex: Integer;
ColumnValues: Variant; var Width: Extended);
begin
if (VarToStr(ColumnValues[0]) = '1999') and
(VarToStr(ColumnValues[1]) = '11') then
Width := 100;
end;
© 1998-2006 FastReports Inc.
Cross-tab reports
91
C++ Script:
void Cross1OnCalcWidth(
int ColumnIndex,
variant ColumnValues,
Extended &Width)
{
if ((VarToStr(ColumnValues[0]) == "1999") &&
(VarToStr(ColumnValues[1]) = "11"))
{
Width = 100;
}
}
And the result would appear as follows:
In our example, to hide a column, it is enough to return the Width := 0. Note, that
the sums are not recalculated at the same time, since the matrix is already full of values at
this time.
3.9
Filling a table manually
There are two versions of the cross-table: the “DB cross-table” and the
“Cross-table.” All this time we’ve been working with the first object attached to the data
from the DB table and fills itself automatically, as soon as the report runs. Let us examine
the second object, “Cross-table.”
This object is not attached to the data from a DB. Therefore, you have to fill the
cross-table with data manually. This object possesses a similar editor, but you will have to
select the number of dimensions in the table’s titles and in its cells instead of DB fields:
© 1998-2006 FastReports Inc.
92
FastReport 3.0 User's Manual
Let us demonstrate using the “Cross-table” object with an example. Put an object
on the report design page and set it as shown in the illustration above: the number of
levels in the strings’ title is “1,” in the columns’ title – “2,” in the cell – “1.” To fill the
table with data, let us use the “OnBeforePrint” object’s event handler:
PascalScript:
procedure Cross1OnBeforePrint(Sender: TfrxComponent);
begin
with Cross1 do
begin
AddValue(['Ann'], [2001, 2], [1500]);
AddValue(['Ann'], [2001, 3], [1600]);
AddValue(['Ann'], [2002, 1], [1700]);
AddValue(['Ben'], [2002, 1], [2000]);
AddValue(['Den'], [2001, 1], [4000]);
AddValue(['Den'], [2001, 2], [4100]);
end;
end;
C++ Script:
void Cross1OnBeforePrint(TfrxComponent Sender)
{
Cross1.AddValue(["Ann"], [2001, 2], [1500]);
Cross1.AddValue(["Ann"], [2001, 3], [1600]);
© 1998-2006 FastReports Inc.
Cross-tab reports
93
Cross1.AddValue(["Ann"], [2002, 1], [1700]);
Cross1.AddValue(["Ben"], [2002, 1], [2000]);
Cross1.AddValue(["Den"], [2001, 1], [4000]);
Cross1.AddValue(["Den"], [2001, 2], [4100]);
}
In the handler, it is necessary to add the required data into the table via the
“TfrxCrossView.AddValue” method. This method has three parameters; each of them is
an array of values of the “Variant” type. The first parameter is the row's value, the second
one is the column’s value, and the third one contains the cells’ values. Note that the
number of values in each array should correspond to the object’s setting! In our case, the
object has one level in the rows' title, two levels in the columns’ title, and one level of
cells. Therefore, we transfer one value for rows, two values for columns, and one value for
cells into the AddValue.
When running the report, we would see the following:
One can use the “AddValue” method for the “DB cross-table” object as well. This
allows adding the data (which are not in the data source attached to the object) into the
cross-table. Otherwise, if there are such data, they are summarized with the data in the
table.
© 1998-2006 FastReports Inc.
Chapter
IV
Charts
Charts
95
FastReport allows us to insert charts into the report. Let us illustrate a simple
construction of a chart using the following example. To perform this, we would need the
“country” table. The table contains data about countries, their area and population:
Name
Argentina
Bolivia
….
Area
2 777 815
1 098 575
Population
32 300 003
7 300 000
Add the “Chart” object to the report design page:
Set the object size (18x8 cm). To customize the object, call its editor by
double-clicking on it.
© 1998-2006 FastReports Inc.
96
FastReport 3.0 User's Manual
The areas of the chart editor in the illustration:
1 – chart structure. A chart can contain either one or several series.
2 – object inspector, which displays the properties of the element selected in the window.
Teak the chart’s properties here.
3 – toolbar for connection the series to data; it is activated once the series in the window 1
is selected.
On the first activation, the editor window will appear as in the image shown above.
The first thing to be done is to add one or several series (one series in our example). To
perform this, click the
button and select the pie chart in the menu:
© 1998-2006 FastReports Inc.
Charts
97
There are eight different types of series available. After adding the series, the bar 3
becomes active. Here you specify, which data should be used for plotting. First of all, let
us select the data set in the “Data set” pulldown. Fill the “X values” and “Y values” fields
using their respective pulldowns:
It is necessary to note here, that X-axis values can be of any type (string, for
example), since they are informational. However, the Y-axis values must be of numeric
type. In our case (with circle chart) the X-axis values are used for comments (legends,
labels), while only the Y-axis values are used for the chart construction.
Click “OK” to close the editor and then preview the report:
© 1998-2006 FastReports Inc.
98
FastReport 3.0 User's Manual
What can be improved in this report? First of all, it would be nice to sort values in
descending order. Again, we enter the chart editor and select the series in the upper part of
the window. Now we select the required sorting mode:
If we previewed the report now, we would see that the data in the legend table is
sorted.
4.1
Limitation of number of chart values
Our chart looks rather crowded, since there are too many small values in the chart,
which are invisible anyway. FastReport allows limiting of the number of values displayed
in a chart by a predefined value. Thus, all the values, which do not belong to the limit set,
would be displayed as a single value, representing the sum of values, which did not fit the
chart.
In our example, the chart has 18 values, and only 8 of them can be displayed. Let
us enter the editor and set limiting:
The limiting will work if the “TopN” is not zero. The name in the “TopN title,”
which will be displayed opposite to the sum value, should be specified. Sorting mode is
© 1998-2006 FastReports Inc.
Charts
99
not significant; values will be sorted by default.
As a result, the report will look as follows:
4.2
Some useful settings
Let us examine several settings, which can be useful for setting chart appearance.
These settings can be specified in the object inspector only.
The following basic properties are available when selecting a chart in the top of the
list:
© 1998-2006 FastReports Inc.
100
FastReport 3.0 User's Manual
- Gradient – settings for gradient background filling. Enable the “Gradient.Visible”
property for gradient displaying.
- Legend – settings for explanatory table appearance. The table can be disabled with the
help of the “Legend.Visible” property. The table position is set with the help of the
“Legend.Alignment” property.
The following properties are available when selecting a series:
- ColorEachPoint – color each value with different colors.
- ExplodeBiggest – select the largest value (only for the series of the “circle chart” type.
- Marks – settings for the explanatory hints appearance.
- ValueFormat – the line for formatting values.
4.3
Chart with specified values
In the previous example, we constructed a chart on the basis of the DB table data.
There is another way of constructing a chart: to enter the necessary data manually. This
way is convenient when constructing small charts.
Let us demonstrate how it works with a simple example. Put a chart on the report
© 1998-2006 FastReports Inc.
Charts
design page and enter its editor. Add the series of the “column chart” type
properties:
101
and set its
The result:
4.4
Chart completion from Script
Let us examine the last chart completion from script. To perform this leave empty
XValues and YValues fields in chart editor. In report script write the following:
PascalScript:
begin
Chart1.SeriesData[0].XSource := 'Jan;Feb;Mar;Apr';
Chart1.SeriesData[0].YSource := '31;28;31;30';
end.
C++Script:
{
Chart1.SeriesData[0].XSource = "Jan;Feb;Mar;Apr";
Chart1.SeriesData[0].YSource = "31;28;31;30";
}
© 1998-2006 FastReports Inc.
102
FastReport 3.0 User's Manual
SeriesData[0] in this case allows us to set parameters for the first series in the
chart. If chart has several series, you can address them via SeriesData[data_number].
© 1998-2006 FastReports Inc.
Chapter
V
Script
104
FastReport 3.0 User's Manual
Script is a program written in a higher-level language, which is a part of a report.
As a report runs, the script runs as well. A script is able to perform data handling, which
cannot be performed via regular means of the FastReport core, for example, to hide
useless data according to any predefined condition. The script is also used for controlling
properties of dialogue forms, which are the components of the report.
The script should be written using one of the languages, which are the components
of the script engine (FastScript). Currently, the following languages are supported:
- PascalScript
- C++Script
- BasicScript
- JScript
The following FastScript features available in the script engine:
- standard language set: variables, constants, procedures, functions (with nesting
capability) with variables, constants, default parameters, all standard operators (including
case, try, finally, except, with), types (integral, fractional, logical, character, line,
multidimensional arrays, set, variant), classes (with methods, events, properties, indexes,
and default properties);
- declarations of the following types absent: records, classes in the script; no records, no
pointers, no sets (however, the 'IN' - "a in ['a'..'c','d']" operator usage is possible), no
shortstring type, no unconditional jump (GOTO);
- types’ compatibility checking;
- ability to access any report’s object.
You can create scripts in the FastReport designer, which contains the scripts’
editor with syntax’s highlighting. Also there is an embedded debugger, which possesses
the following functions: “Step,” “Breakpoint,” “Run to cursor,” and “Evaluate.”
5.1
Taste of script
Tools for working with the script are located in the “Code” tab of the FastReport
editor. When switching to this tab, the designer appears as follows:
© 1998-2006 FastReports Inc.
Script
105
In the illustration above, the figures denote:
1 – “Code” tab;
2 – script’s editor window;
3 – a dropdown for selecting a language, in which the script is to be written;
4 – debugger’s toolbar:
- run report in debugging mode;
interrupt script’s work;
- perform the regular code line (Step into);
-
- preview expressions’ evaluation (Evaluate).
5 – bookmarks and breakpoints are displayed in this field; in addition, the lines,
possessing the executable code are highlighted there.
Below there is the list of the keys, which can be used in the script editor.
Key
Meaning
Cursor arrows
Move the cursor
PageUp, PageDown
Go to the previous/next page
Ctrl+PageUp
Go to the beginning of the text
Ctrl+PageDown
Go to the end of the text
Home
Go to the beginning of the line
End
Go to the end of the line
© 1998-2006 FastReports Inc.
106
5.2
FastReport 3.0 User's Manual
Enter
Go to the next line
Delete
Delete the symbol at cursor’s position; delete the selected text
Backspace
Delete the symbol to the left from the cursor
Ctrl+Y
Delete the current line
Ctrl+Z
Undo last action (up to 32 events)
Shift+Cursor arrows
Select a text block
Ctrl+A
Select the whole text
Ctrl+U
Shift the selected block by 2 symbols to the left
Ctrl+I
Shift the selected block by 2 symbols to the right
Ctrl+C, Ctrl+Insert
Copy the selected block to the clipboard
Ctrl+V, Shift+Insert
Paste the text from the clipboard
Ctrl+X, Shift+Delete
Cut the selected block to the clipboard
Ctrl+Shift+<number>
Set a bookmark with the 0..9 number on the current line
Ctrl+<number>
Jump to the set bookmark
Ctrl+F
Search a line
Ctrl+R
Replace a line
F3
Repeated search/replacement from the cursor’s position
F4 or F5
Set the breakpoint and script’s running (Run to cursor)
Ctrl+F2
Reset the program
Ctrl+F7
Preview variables’ values (Evaluate)
F9
Run the script (Run)
F7 or F8
Execute code line (Step into)
Structure of a script
Script’s structure depends on the language you use; however there are some
common elements. They are the script’s title, body, and the main procedure, which will be
executed when the report runs. Below there are examples of the scripts for all four
supported languages:
PascalScript’s structure:
#language PascalScript // optional
// optional
program MyProgram;
// the “uses” chapter should be located before any other chapter
© 1998-2006 FastReports Inc.
Script
107
uses 'unit1.pas', 'unit2.pas';
var
i, j: Integer;
// the “variables” chapter can be placed anywhere
const
pi = 3.14159;
// “constants” chapter
procedure p1;
var
i: Integer;
// procedures and functions
procedure p2;
begin
end;
// nested procedure
begin
end;
begin
end.
// main procedure.
C++Script’s structure:
#language С++Script
// optional
// the “include” chapter should be placed before any other chapter
#include "unit1.cpp", "unit2.cpp"
int i, j = 0;
// the “variables” chapter can be placed anywhere
#DEFINE pi = 3.14159
// “constants” chapter
void p1()
{
}
// functions
// no nested procedures
{
}
// main procedure.
JScript’s structure:
#language JScript
// optionally
// the “import” chapter should be before any other chapter
import "unit1.js", "unit2.js"
var i, j = 0;
anywhere
// the “variables” chapter can be located
function p1()
{
}
// functions
//
// main procedure.
© 1998-2006 FastReports Inc.
108
FastReport 3.0 User's Manual
p1();
for (i = 0; i < 10; i++) j++;
BasicScript’s structure:
#language BasicScript
' optionally
' the “imports” chapter should be located before Any other chapter
imports "unit1.vb", "unit2.vb"
Dim i, j = 0
' the “variables” chapter can be placed anywhere
Function p1()
{
}
' functions
'
' main procedure.
For i = 0 To 10
p1()
Next
Later, we will examine examples of scripts written in “PascalScript” language.
When a new report is created, this language is selected by default.
5.3
"Hello, World!" script
We have already examined an example of the "Hello, World!" report; now let us
view, how to create a simple script, which would display a window with a greeting.
Enter the designer and click on the “New report” button for FastReport to
automatically create a blank template. Switch to the "Code" page tab and write the
following script:
PascalScript:
begin
ShowMessage('Hello, World!');
end.
C++ Script:
{
ShowMessage("Hello, World!");
}
After that, run the report. As we expected, FastReport displays a little window
with a greeting:
© 1998-2006 FastReports Inc.
Script
109
Let us explain some details. We created a script consisting of a single “begin..end”
block. Thus, our script has a very simple structure; it consists of a main procedure only
(see the “Structure of a script” in this chapter). The main procedure is executed as soon as
the report runs. In this case, it displayed a greeting window; the procedure ends right after
the window is closed. After the main procedure is finished, report building starts.
5.4
Using objects in the script
One can address any report’s object from the script. So, if there are, for example,
the “Page1” page and the “Memo1” object, one can use them in the script, calling them by
names, for example:
PascalScript:
Memo1.Color := clRed
C++Script:
Memo1.Color = clRed
The list of the report’s objects available from the script is displayed in the “Report
tree” service window. What objects’ properties are available in the script? The answer is
simple: those ones, which are visible in the object’ inspector. At the same time, at the
bottom of the inspector, there is a hint concerning the selected property. Both windows
(report’s tree and inspector) are available during working with the script. To get a detailed
help about objects’ properties and methods, use the FastReport help file, which is included
in distribution kit.
A simple example. Put a “Text” object with the “MyTextObject” name and the
“Test” text on the report’s design page. Then write in the script:
PascalScript:
begin
MyTextObject.Color := clRed
end.
C++Script:
© 1998-2006 FastReports Inc.
110
FastReport 3.0 User's Manual
{
MyTextObject.Color = clRed
}
Run the report and see that our object’s color became red.
5.5
Calling the variables from the report’s variables list
One can call any variable, which is specified in the list of the report’s variables
(“Report|Variables..." menu item), from the script. Variable’s name should be enclosed in
angle brackets:
PascalScript:
if <my variable> = 10 then ...
C++ Script:
if (<my variable> == 10) { ... }
An alternative way is to use the “Get” function:
PascalScript:
if Get('my variable') = 10 then ...
C++ Script:
if (Get("my variable") == 10) { ... }
Modification of such variable’s value is available only via the “Set” procedure:
PascalScript:
Set('my variable', 10);
C++ Script:
Set("my variable", 10);
One should address the system variables, such as “Page#,” in exactly the same
way:
PascalScript:
if <Page#> = 1 then ...
© 1998-2006 FastReports Inc.
Script
111
C++ Script:
if (<Page#> == 1) { ... }
5.6
Calling the DB fields
Just as with variables, one should use angle brackets for calling the DB fields:
PascalScript:
if <Table1."Field1"> = Null then...
C++ Script:
if (<Table1."Field1"> == Null) { ... }
And just as well, one can use the “Get” function (as a matter of fact, this function
is always used in implicit way for calculating expressions, enclosed in angle brackets).
5.7
Using aggregate functions in the script
An idiosyncrasy of an aggregate function is that it should be used inside the “Text”
object; one can call it in the script after it is used. If an aggregate function is used in the
script only, (without using it in the “Text” object), an error message will appear. That
happens due to the fact that an aggregate function must be connected with a definite band,
and only then will it work correctly.
5.8
Displaying the variable’s value in a report
To display the contents of any script variable in a report, one should describe this
variable and bind a value to it. Here is a simple example of a script variable:
PascalScript:
var
MyVariable: String;
begin
MyVariable := 'Hello!';
end.
C++ Script:
string MyVariable;
© 1998-2006 FastReports Inc.
112
FastReport 3.0 User's Manual
{
MyVariable = "Hello!";
}
The variable’s value can be displayed in the “Text” object, for example, by placing
the [MyVariable] text into it.
A variable’s name should be unique, which means that it should not coincide with
the names of the report’s objects, standard functions, and constants. If there is an error in
the script, a message will be displayed, and report construction process will be stopped.
5.9
Events
So far we have examined scripts with only one main procedure, which is
performed when a report starts running. In the main procedure, one can perform any initial
settings, initialize variables. However, this is not enough for total control over the process
of report's forming. To control a report as much as possible, every report object has
several events, to which a handler (i.e. a procedure from the script) may be assigned. For
example, in the handler, connected to the data-band, one can perform records' filtering,
which means that the band will be hidden or displayed according to any specified
conditions.
Let us demonstrate the process of creation of a report and of events, which are
generated during it, with the example of a simple report, which contains one page, one
"Master data" band, and two "Text" objects on the band:
As stated previously, the main script's procedure is called in the very beginning of
a report. After that, the essential process of report construction starts. In the beginning of
the report, the “OnStartReport” event of the "Report" object is called. Before the page is
being formed, the “OnBeforePrint” page event is called. This event is called once for each
design page of the report's template (it should not be confused with the output pages of a
report!). In our case, the event is called once, as the report's design consists of one design
page.
Then output of data-bands begins, in the following order:
1. the band's “OnBeforePrint” event is called;
2. the “OnBeforePrint” events of all the objects, belonging to the band, are called;
3. all the objects are filled with data (in our case with values of the “Company” and
© 1998-2006 FastReports Inc.
Script
113
“Addr1" DB fields); after that, the “OnAfterData” events of all the objects are called;
4. such actions as positioning of objects on the band (if there are stretchable objects
among them), calculating of the band's height, and stretching (if it is stretchable) are
performed;
5. the band's “OnAfterCalcHeight” event is called;
6. a new output page is formed, if the band does not find room in white space of the page;
7. the band and all of its objects are displayed on the report’s output page;
8. the “OnAfterPrint” event of all the band's objects is called;
9. the “OnAfterPrint” event of the band itself is called.
Bands are printed as long as there are data in the source connected to the band.
After that, forming of a report stops; the “OnAfterPrint” report's page events and, finally,
the “OnStopReport” event of the "Report" object are called.
Thus, by using events of different objects, one can manage practically every
moment of report's formation process. A key to using events is a thorough understanding
of the bands' output process, discussed in the next nine sections. Most of the actions can
be performed using the band's “OnBeforePrint” event only; any modifications made to an
object are displayed immediately. However, in this event it is impossible to analyze, in
which page the band will be printed, if it is stretchable, since calculation of band's height
will be performed in the step 4. This can be performed either by the “OnAfterCalcHeight”
event in the step 5, or the “OnAfterPrint” event in step 8, but in the latter event a band will
already have been output so any modification of objects will not have any effect.
One should clearly understand “where and when” bands are output and the timing
(firing order) of each of their events, as well as those of objects contained in the band.
5.10
Example of using the “OnBeforePrint” event
To demonstrate create a report, which represents the list of clients. This report will
include only those companies, whose names begin with the letter “A.”
Enter the report’s editor and create a report of the following type:
Select the data-band and switch to the “Events” page tab in the objects’ inspector:
© 1998-2006 FastReports Inc.
114
FastReport 3.0 User's Manual
To create the “OnBeforePrint” event’s handler (this is exactly what would be most
appropriate to us), double-click on the blank field to the right of the event’s name:
At the same time, a blank handler is added to the script’s text, and the designer
switches to the “Code” page.
The only thing we should do after that is to write the following code in the handler
’s body:
PascalScript:
if Copy(<Customers."Company">, 1, 1) = 'A' then
MasterData1.Visible := True else
MasterData1.Visible := False;
C++Script:
if (Copy(<Customers."Company">, 1, 1) == "A")
MasterData1.Visible = true;
else
MasterData1.Visible = false;
© 1998-2006 FastReports Inc.
Script
115
Run the report and make sure, that the script works correctly:
Let us explain several details. You can assign one handler to several events of
different objects at once; in this case the “Sender” parameter defines the object, which has
initiated the event. To assign a name of the already existing handler to the event, one can
either enter it manually in the objects’ inspector, or select it in the pulldown:
The link to the handler can be easily deleted. To do that, select a required property
and click the “Delete” key.
5.11
Printing the group’s sum total in the group’s header
This quite often-used method requires use of scripts because total value in an
ordinary report becomes available only after all group's records are handled. To display a
sum in the group's header (before the group is handled), the following algorithm is used:
- the two-pass option of the report is turned on ("Report|Options..." menu item);
- in the first pass, the sum of each group is calculated and saved in an array;
- in the second pass, the values are extracted from the array and typed in the group's
header.
Let us show, two ways of how this task may be accomplished. Create new report.
Put the "ADO Query" component to the page and set its properties:
SQL =
select * from customer, orders
© 1998-2006 FastReports Inc.
116
FastReport 3.0 User's Manual
where orders.CustNo = customer.CustNo
order by customer.CustNo, orders.OrderNo
UserName = 'Group'
Enable the double pass in report's settings (the "Report|Options..." menu item).
Add two bands to the report: "Group header" and "Master data." In the "Group header"
band's editor, specify the condition (“Group.CustNo” data field). Connect the data-band to
the “Group” data source, and then arrange objects in the following way:
For entering sum value, we use the selected object in the picture (in our example
its name is “Memo8”).
The first way.
We use the “TStringList" class as an array for sums' storage. We will store
numeric values as strings. At the same time, the first line in the list corresponds to the
value of the first group, etc. The integer-valued variable (which we will augment after
printing the next group) is used for calculating the group's number.
Thus, our script will look as follows:
PascalScript:
var
List: TStringList;
i: Integer;
procedure frReport1OnStartReport(Sender: TfrxComponent);
begin
List := TStringList.Create;
end;
procedure frReport1OnStopReport(Sender: TfrxComponent);
begin
List.Free;
end;
procedure Page1OnBeforePrint(Sender: TfrxComponent);
begin
i := 0;
© 1998-2006 FastReports Inc.
Script
117
end;
procedure GroupHeader1OnBeforePrint(Sender: TfrxComponent);
begin
if Engine.FinalPass then
Memo8.Text := 'Sum: ' + List[i];
end;
procedure GroupFooter1OnBeforePrint(Sender: TfrxComponent);
begin
if not Engine.FinalPass then
List.Add(FloatToStr(SUM(<Group."ItemsTotal">,MasterData1)));
Inc(i);
end;
begin
end.
C++ Script:
TStringList List;
int i;
void frReport1OnStartReport(TfrxComponent Sender)
{
List = TStringList.Create();
}
void frReport1OnStopReport(TfrxComponent Sender)
{
List.Free();
}
void Page1OnBeforePrint(TfrxComponent Sender)
{
i = 0;
}
void GroupHeader1OnBeforePrint(TfrxComponent Sender)
{
if (Engine.FinalPass)
Memo8.Text = "Sum: " + List[i];
}
void GroupFooter1OnBeforePrint(TfrxComponent Sender)
{
List.Add(FloatToStr(SUM(<Group."ItemsTotal">,MasterData1)));
i++;
}
{
}
Looking at the names of the procedures, you can easily find out the events we have
© 1998-2006 FastReports Inc.
118
FastReport 3.0 User's Manual
used.
They
are:
“Report.OnStartReport,”
“Report.OnStopReport,”
“Page1.OnBeforePrint,”
“GroupHeader1.OnBeforePrint,”
and
“GroupFooter1.OnBeforePrint.” As for the first two events, they are called, as it was said,
in the beginning and in the end of the report respectively. To create handlers for these
events, one should select the "Report" object in the "Report tree" window; its properties
will appear in the objects' inspector. After that, we would switch to the inspector's
"Events" page tab and create the handlers.
Why didn't we use the main procedure for creation of the “List” list in the
“OnStartReport” event? That is because the created object should be cleared after a report
is finished. This is logical to create objects in the “OnStartReport” event and clear them
via the “OnStopReport.” In other cases (when memory does not need to be emptied) one
can use the main procedure for initialization of variables.
Everything concerning creation and clearing of the “List” object seems to be quite
obvious. Now let us examine the work of the script. In the beginning of the page, the
counter of the current group (the “i” variable) is reset to “0” and increments after printing
each group (in the “GroupFooter1.OnBeforePrint” event). The calculated sum's value is
added to the list in this event. The “GroupHeader1.OnBeforePrint” event does not trigger
during the first pass (the “Engine.FinalPass” verification). During the second pass (when
the “List” list is filled with values), the value, which corresponds to the current group is
retrieved in this event, and it is output to the “Memo8” object's text, which displays the
sum total in the group title. In a finished report, it appears as follows:
As we can see, the algorithm is rather simple. Nevertheless, it can be simplified.
The second way.
We use the list of report's variables as an array for sums' storage. As we remember,
reference to such objects is performed via the “Get” and “Set” functions. This saves us
from having to create extra objects and to free them. Our script will look as follows:
PascalScript:
procedure GroupHeader1OnBeforePrint(Sender: TfrxComponent);
begin
© 1998-2006 FastReports Inc.
Script
119
if Engine.FinalPass then
Memo8.Text := 'Sum: ' + Get(<Group."CustNo">);
end;
procedure GroupFooter1OnBeforePrint(Sender: TfrxComponent);
begin
Set(<Group."CustNo">,
FloatToStr(SUM(<Group."ItemsTotal">,MasterData1)));
end;
begin
end.
C++ Script:
void GroupHeader1OnBeforePrint(TfrxComponent Sender)
{
if (Engine.FinalPass)
Memo8.Text = "Sum:" + Get(<Group."CustNo">);
}
void GroupFooter1OnBeforePrint(TfrxComponent Sender)
{
Set(<Group."CustNo">,
FloatToStr(SUM(<Group."ItemsTotal">,MasterData1)));
}
{
}
As you can see, the script was rather simplified. A code in the
“GroupFooter1.OnBeforePrint” handler sets a variable's value with a name similar to the
client's number (one can use any identifier, which unambiguously identifies the client, for
example, his name <Group."Company">). If there is no such variable, it would be created;
if there is, its value would be changed. In the “GroupHeader1.OnBeforePrint” handler, a
variable's value with the number of the current group is computed.
5.12
“OnAfterData” event
This event is generated after the report's object is filled with the data, to which it is
connected. Use this event for analyzing either a DB field value, or an expression contained
in the object. The fact is that this value is placed to the “Value” service variable, the value
of which is available in this event only. So, having two "Text" objects with the
[Table1."Field1"] and [<Table2."Field1"> + 10] contents, one could analyze the value of
these expressions referring to the “Value” variable:
PascalScript:
© 1998-2006 FastReports Inc.
120
FastReport 3.0 User's Manual
if Value > 3000 then
Memo1.Color := clRed
C++ Script:
if (Value > 3000)
Memo1.Color = clRed;
instead of writing something like this:
PascalScript:
if <Table1."Field1"> > 3000 then
Memo1.Color := clRed
C++ Script:
if (<Table1."Field1"> > 3000)
Memo1.Color = clRed;
The use of “Value” instead of an expression provides you with a possibility to
write one multipurpose handler of the “OnAfterData” event, and to connect it to several
objects.
One more thing is to be noted. If there are several expressions in an object (for
example, [expr1] [expr2]) a value of the last expression is transferred to the “Value”
variable.
5.13
Service objects
In addition to the objects included in the report (pages, bands, "Text" and other
objects), some service objects are available in the script, which may be of some use when
managing report's construction. The “Engine” object, which we used in the previous
chapter, refers to this kind of objects. The list of service objects is given below:
- Report - the "Report" object;
- Engine - the link to the report's slider;
- Outline - the link to the "Report tree" control element in a preview window.
Let us examine each of these objects.
© 1998-2006 FastReports Inc.
Script
121
5.13.1 “Report” object
It represents a link to the current report. The property of this object can be seen
when selecting the "Report" element in the "Report tree" window.
Methods:
Method
Description
function
Calc(const
String): Variant
Expr: Returns the “Expr” expression's value, for example,
Report.Calc('1+2') returns “3.” Any expression, which
is correct in terms of FastReport's, can be transferred
as an expression.
function
GetDataSet(const Returns a data set with a specified name. The data set
Alias: String): TfrxDataSet
should be included into the list of the report's data
("Report|Data..." dialogue).
5.13.2 “Engine” object
This is the most useful and interesting object, it represents a link to the engine
(FastReport’s core, which manages report construction). By using the engine’s properties
and methods one can construct really exotic report design layouts.
The methods and properties of this object.
Property
Type
Description
CurColumn
Integer
The number of the current column in a
multi-columned report. A value can be bound to this
property.
CurX
Extended
The current shift of the coordinates on the X-axis. A
value can be bound to this property.
CurY
Extended
The current shift of the coordinates on the Y-axis. A
value can be bound to this property.
DoublePass
Boolean
Equal to “True,” if the report is a two-pass one.
Analogous to Report.EngineOptions.DoublePass.
FinalPass
Boolean
Equal to “True,” if the last pass of the two-pass report
is performed.
PageHeight
Extended
Printable region’s height, in pixels.
PageWidth
Extended
Printable region’s width, in pixels.
© 1998-2006 FastReports Inc.
122
FastReport 3.0 User's Manual
StartDate
TDateTime
Time of report running. A counterpart of the <Date>
system variable.
StartTime
TDateTime
Time of report running. A counterpart of the <Time>
system variable.
TotalPages
Integer
A number of pages in a report. A counterpart of the <
TotalPages> system variable. The report should be a
two-pass one, so that this variable can be used.
Methods:
Method
Description
procedure AddAnchor (const
Text: String)
Adds “anchor” to the list of anchors. See more below.
procedure NewColumn
Creates a new column in a multicolumn report. After
the last column, page break is automatically inserted.
procedure NewPage
Creates a new page (page break).
procedure ShowBand(Band:
TfrxBand)
Displays a band with a specified name. After
displaying a band, the “CurY” position is
automatically shifted.
function FreeSpace: Extended
Returns height value of white space left on a page, in
pixels.
function GetAnchorPage(const
Text: String): Integer
Returns the number of the page, in which the specified
anchor is placed.
© 1998-2006 FastReports Inc.
Script
123
5.13.3 "Outline" object
This object represents the "Report tree" control element in a preview window.
This element displays a treelike structure of a finished report. When clicking on
any tree node, there is a jump to the page connected to this node. To display the tree, you
should either enable it by clicking the
button in the toolbar of the preview window, or
specify it with the help of the “Report.PreviewOptions.OutlineVisible=True” property.
The control element's width in pixels can be specified there as well:
Report.PreviewOptions.OutlineWidth.
Let us examine this object's methods.
Method
Description
procedure AddItem(const Text:
String)
Adds an element with the “Text” name to the current
tree position. The current report’s page and the current
position on the page are associated with the element.
procedure LevelRoot
Shifts the current position in the tree to the root level.
procedure LevelUp
Shifts the current position in the tree on one level up.
© 1998-2006 FastReports Inc.
124
5.14
FastReport 3.0 User's Manual
Using the “Engine” object
We have already stated that the “Engine” object represents the report's engine,
which manages report's construction. By using the engine's properties and methods, one
can manage the process of band(s)s arrangement on a page. First some theory.
The picture below displays the report's page and properties' names, which return
different dimensions.
The page has the “PaperWidth” and “PaperHeight” physical dimensions. These
dimensions correspond to page's properties of the same name that are visible in the
objects' inspector when selecting a page. So, size of an A4-format page would be
210x297mm.
The “PageWidth” and “PageHeight” parameters define the dimensions of a
printable region, which is usually less than physical dimensions of a page. The size of
printable region is defined by the page's fields, which depend on such report page
properties as “LeftMargin,” “TopMargin,” “RightMargin,” “BottomMargin.” The
printable region’s size in pixels is returned by the “Engine.PageWidth” and
“Engine.PageHeight” properties.
Finally, the “FreeSpace” parameter defines the height of free space on a page. If
there is a "Page Footer" band on the page, its height is taken into account when calculating
FreeSpace. This parameter is returned in pixels by the “Engine.FreeSpace” function. Note
that after displaying the next band, free space reduces on a page, and this is what is
considered during calculating FreeSpace.
How do ready report's pages form? The FastReport core produces bands on the
page as long as there is enough free space. When there is no free space left the “Page
© 1998-2006 FastReports Inc.
Script
125
Footer" band is printed (if available) and a new blank page is formed. As it was already
said, after displaying the next band, the height of free space reduces. Moreover, displaying
of a next band begins from the current position, which is defined by coordinates on X-axis
and Y-axis. This position returns in the “Engine.CurX” and “Engine.CurY” properties
respectively. After printing the next band, the CurY position automatically increases by
height value of the printed band. After a new page is formed, the “CurY” position is equal
to “0.” The “CurX” position is modified when printing multi-column reports.
The “Engine.CurX” and “Engine.CurY” properties are available not only for
reading, but also for writing. That means that bands can be shifted manually by using one
of the appropriate events. For example, when you have a report that resembles the
illustration below.
it can be printed in the following way:
This is a result of the script assigned to the band's “OnBeforePrint” event:
PascalScript:
procedure MasterData1OnBeforePrint(Sender: TfrxComponent);
begin
Engine.CurX := Engine.CurX + 5;
end;
C++ Script:
void MasterData1OnBeforePrint(TfrxComponent Sender)
{
Engine.CurX = Engine.CurX + 5;
}
Manipulation of the “CurY” property allows, for example, to print bands in splice:
© 1998-2006 FastReports Inc.
126
FastReport 3.0 User's Manual
The corresponding script:
PascalScript:
procedure MasterData1OnBeforePrint(Sender: TfrxComponent);
begin
Engine.CurY := Engine.CurY - 15;
end;
C++ Script:
void MasterData1OnBeforePrint(TfrxComponent Sender)
{
Engine.CurY = Engine.CurY - 15;
}
The “Engine.NewPage” method allows page breaks at any required place of a
report. At the same time, printing continues from a new output page. In our example one
can insert a break after printing the second record:
PascalScript:
procedure MasterData1OnAfterPrint(Sender: TfrxComponent);
begin
if <Line> = 2 then
Engine.NewPage;
end;
C++ Script:
void MasterData1OnAfterPrint(TfrxComponent Sender)
{
if (<Line> == 2)
Engine.NewPage();
}
Note, that we used the “OnAfterPrint” event (that is to say, after the band is
already printed). Note the fact that the “Line” service variable returns the sequence
number of the record.
The “Engine.NewColumn” method breaks a column in multi-columned reports. As
soon as there is no column left, this method creates a new page
© 1998-2006 FastReports Inc.
Script
5.15
127
Anchors
Anchor is one of the elements of the hyperlink system, which allows one to jump
to any element, connected to the finished report’s object by clicking on it (in the preview
window).
Anchor is a special tip, which is set via the “Engine.AddAnchor” method. Anchor
has a name, which corresponds with the page number position of the page. To jump to an
anchor with a specified name, put the following line into the URL property of any report's
object:
#AnchorName
or
#[AnchorName]
In the latter case, FastReport will substitute a value for the expression.
Clicking on this object executes a jump to the part of the report, where the anchor
was added.
Use anchors when constructing the "Contents" chapter, for example with links to
corresponding chapters. Let us illustrate this by the following example. To perform this,
we need the familiar “Customer” table.
Our report will be a multipage one (with two design pages). We will place the
"Contents" chapter on the first page, and the list of clients on the second one. Clicking on
the content line executes jumping to a corresponding report's element.
The first design page:
Let us place the following text in the URL property of the "Text" object, which
belongs to the data-band
#[Customers."Company"]
and set the font’s properties: to blue color and underlining to simulate a hyperlink’s
appearance.
© 1998-2006 FastReports Inc.
128
FastReport 3.0 User's Manual
The second design page:
To add an anchor, let us create the “MasterData2.OnBeforePrint” event handler
in the band’s script:
PascalScript:
procedure MasterData2OnBeforePrint(Sender: TfrxComponent);
begin
Engine.AddAnchor(<Customers."Company">);
end;
C++ Script:
void MasterData2OnBeforePrint(TfrxComponent Sender)
{
Engine.AddAnchor(<Customers."Company">);
}
That is all we needed. Preview the report, to make sure that our “hyperlinks” work.
The last thing to be mentioned is the “Engine.GetAnchorPage” function. This
function returns the number of the page, where the corresponding anchor was added. This
function is useful when creating the “Contents” chapter as well. A report must be a
two-pass one; otherwise this function cannot be used.
5.16
Using the “Outline” object
The “Outline” object, as previously stated, represents a report’s tree, which can be
displayed in a preview window. Clicking on a tree’s element executes jumping to the
report’s output page, which is associated to the tree’s element. It is not necessary to use
the script for operating with the “Outline,” since some bands have a mechanism, which
enables automatic forming of a tree. Let us examine two examples of how the “Outline”
can be used with the help of bands and the script.
© 1998-2006 FastReports Inc.
Script
129
Almost all bands have the “OutlineText” property, into which a text expression
can be entered and this in turn helps to automatically create a tree. The expression will be
calculated when forming a report, and its value will be added to the tree when printing the
band. Thus, elemental hierarchy in the tree is similar to the bands’ hierarchy in a report.
That means, that in the tree there will be main and subordinate elements, corresponding to
main and subordinate bands in a report (a report with two levels of data or with groups can
exemplify the point). We will illustrate operating with a tree using our previous example
of the report with groups..
Specify a value for the “GroupHeader1.OutlineText” band’s property as
“<Group."Company">.” To make the tree be displayed automatically as soon as the
preview window opens, one should set the “Report.PreviewOptions.OutlineVisible”
property = True”. When previewing the report, you would see the following:
Clicking on any element of the tree executes jumping to the corresponding report’s
page, and, as a result, the selected element occurs at the top of the window.
Let us add the second level to the report’s tree. Just set the
“MasterData.OutlineText” band’s property as “<Group."OrderNo">.” Thus, the tree will
look as follows:
© 1998-2006 FastReports Inc.
130
FastReport 3.0 User's Manual
As you might notice, the navigation even in the orders’ numbers is possible, and
hierarchy of the tree’s elements resembles the report’s hierarchy.
Now we will create a similar tree using script code without using the
“OutlineText” property. In our report, clear the “OutlineText” properties of both bands
and
create
two
event’s
handlers:
“GroupHeader1.OnBeforePrint”
and
“MasterData1.OnBeforePrint”:
PascalScript:
procedure GroupHeader1OnBeforePrint(Sender: TfrxComponent);
begin
Outline.LevelRoot;
Outline.AddItem(<Group."Company">);
end;
procedure MasterData1OnBeforePrint(Sender: TfrxComponent);
begin
Outline.AddItem(<Group."OrderNo">);
Outline.LevelUp;
end;
begin
end.
C++ Script:
void GroupHeader1OnBeforePrint(TfrxComponent Sender)
{
Outline.LevelRoot;
Outline.AddItem(<Group."Company">);
© 1998-2006 FastReports Inc.
Script
131
}
void MasterData1OnBeforePrint(TfrxComponent Sender)
{
Outline.AddItem(<Group."OrderNo">);
Outline.LevelUp;
}
{
}
Preview the report, to make sure that it works in the same way as the previous
report, where the tree was formed automatically. Let us examine, how a tree is formed.
The “Outline.AddItem” method adds a child block to the current tree block, and
then makes the child block a current one. Thus, if “AddItem” were called several times in
a row, we would obtain a “ladder” as shown below:
Item1
Item2
Item3
...
The “LevelUp” and “LevelRoot” Outline methods are used for controlling the
current element. The first one moves the cursor to the element, which is located on a
higher level. Thus, the script
Outline.AddItem('Item1');
Outline.AddItem('Item2');
Outline.AddItem('Item3');
Outline.LevelUp;
Outline.AddItem('Item4');
constructs a tree like this
Item1
Item2
Item3
Item4
This means, that “Item4” will be a child element in relation to the “Item2”
element. The “LevelRoot” method shifts the current element to the root of the tree. For
example, the script
Outline.AddItem('Item1');
Outline.AddItem('Item2');
Outline.AddItem('Item3');
Outline.LevelRoot;
Outline.AddItem('Item4');
© 1998-2006 FastReports Inc.
132
FastReport 3.0 User's Manual
constructs a tree, like the one below
Item1
Item2
Item3
Item4
Thanks to these explanations, it becomes clear, how our report works. Every time
when outputting a group title, the root of the tree becomes the current element, where a
company’s name is added. After that, the list of orders is output, and each order is added
as a child element of the company. To make the number of orders located on one level,
not display as a “ladder”, the transition to the upper level via the “Outline.LevelUp”
method is performed in the script.
5.17
“OnManualBuild” page’s event
The FastReport core is usually responsible for report construction. It displays a
report’s bands in a definite order, as many times, as there are data, thus forming a finished
report. Sometimes it is necessary to display a report in a non-standard form, which the
FastReport core is unable to create. In this case, one can use the ability to construct a
report manually via the “OnManualBuild” event, of the report’s design page. If the
handler of this event were defined, then when forming an output page the FastReport core
would transfer control to it. At the same time, the report’s core automatically displays the
bands located in the page, such as "Report title," "Page title," "Column title," "Report
footer," "Page footer," "Column footer," and "Background." The core also handles the
process of forming of new pages and columns. The task of the “OnManualBuild” event’s
handler is to display data bands and their titles and footers in a definite order.
That is to say, the “OnManualBuild” handler’s essence is to give a command for
displaying particular bands to the FastReport’s core. The core will do the rest itself: it will
form a new page, as soon as there is no free space on the current one; handle the scripts
attached to events; etc.
Let us demonstrate a handler with a simple example. In the report, there are two
master data bands, which are not connected to data:
© 1998-2006 FastReports Inc.
Script
133
The handler will display these bands in alternate order (six times for each one).
After six bands are created, a small gap will be inserted.
PascalScript:
procedure Page1OnManualBuild(Sender: TfrxComponent);
var
i: Integer;
begin
for i := 1 to 6 do
begin
{ выводим бэнды друг за другом }
Engine.ShowBand(MasterData1);
Engine.ShowBand(MasterData2);
{ делаем небольшой промежуток }
if i = 3 then
Engine.CurY := Engine.CurY + 10;
end;
end;
C++ Script:
void Page1OnManualBuild(TfrxComponent Sender)
{
int i;
for (i = 1; i <= 6; i++)
{
// выводим бэнды друг за другом
Engine.ShowBand(MasterData1);
Engine.ShowBand(MasterData2);
// делаем небольшой промежуток
if (i == 3)
Engine.CurY = Engine.CurY + 10;
}
}
© 1998-2006 FastReports Inc.
134
FastReport 3.0 User's Manual
The following example displays two bands’ groups next to each other.
PascalScript:
procedure Page1OnManualBuild(Sender: TfrxComponent);
var
i, j: Integer;
SaveY: Extended;
begin
SaveY := Engine.CurY;
for j := 1 to 2 do
begin
for i := 1 to 6 do
begin
Engine.ShowBand(MasterData1);
Engine.ShowBand(MasterData2);
if i = 3 then
Engine.CurY := Engine.CurY + 10;
end;
Engine.CurY := SaveY;
Engine.CurX := Engine.CurX + 200;
end;
end;
C++Script:
void Page1OnManualBuild(TfrxComponent Sender)
{
int i, j;
© 1998-2006 FastReports Inc.
Script
135
Extended SaveY;
SaveY = Engine.CurY;
for (j = 1; j <= 2; j++)
{
for (i = 1; i <= 6; i++)
{
Engine.ShowBand(MasterData1);
Engine.ShowBand(MasterData2);
if (i == 3)
Engine.CurY = Engine.CurY + 10;
}
Engine.CurY = SaveY;
Engine.CurX = Engine.CurX + 200;
}
}
As you can see, in these examples we controlled output of data-bands only. All the
rest bands (for example, in our case, it was “Report title”) were printed automatically.
Finally, we will demonstrate, how to construct a report of the “List of clients” type
(we have constructed it several times in this manual) using the “OnManualBuild” event. In
our example, connect the data-band to the data source.
© 1998-2006 FastReports Inc.
136
FastReport 3.0 User's Manual
Event’s script is the following:
PascalScript:
procedure Page1OnManualBuild(Sender: TfrxComponent);
var
DataSet: TfrxDataSet;
begin
DataSet := MasterData1.DataSet;
DataSet.First;
while not DataSet.Eof do
begin
Engine.ShowBand(MasterData1);
DataSet.Next;
end;
end;
C++Script:
void Page1OnManualBuild(TfrxComponent Sender)
{
TfrxDataSet DataSet;
DataSet = MasterData1.DataSet;
DataSet.First();
while (!DataSet.Eof)
{
Engine.ShowBand(MasterData1);
DataSet.Next();
}
}
Preview the report, to make sure that the result of the script’s work does not differ
from a standard report. Note how we got a link to the Dataset; in our example we
connected a band to the data source, and used the script code
© 1998-2006 FastReports Inc.
Script
137
DataSet := MasterData1.DataSet;
line to return a link to the data source. If a band is not connected to the source, the link to
the required source can be achieved in the following way:
DataSet := Report.GetDataSet('Customers');
5.18
Creation of objects in the script
One can add new objects into a report by using the script. Let us demonstrate with
a simple example, how it is performed. Create a blank report, and then write in the main
script’s procedure:
PascalScript:
var
Band: TfrxReportTitle;
Memo: TfrxMemoView;
begin
Band := TfrxReportTitle.Create(Page1);
Band.Height := 20;
Memo := TfrxMemoView.Create(Band);
Memo.SetBounds(10, 0, 100, 20);
Memo.Text := 'This memo is created in code';
end.
C++ Script:
TfrxReportTitle Band;
TfrxMemoView Memo;
{
Band = TfrxReportTitle.Create(Page1);
Band.Height = 20;
Memo = TfrxMemoView.Create(Band);
Memo.SetBounds(10, 0, 100, 20);
Memo.Text = "This memo is created in code";
}
Preview the report:
Note, that we never destroy the created FastReport objects in these examples. It is
not required, since FastReport objects are automatically destroyed after the report is
© 1998-2006 FastReports Inc.
138
FastReport 3.0 User's Manual
completed.
© 1998-2006 FastReports Inc.
Chapter
VI
Dialogue forms
140
FastReport 3.0 User's Manual
In addition to usual report design pages, you can use dialogue forms in a report.
For dialogue form creation, the same designer as for report pages is used. The
button in
the designer toolbar is used for creating a new dialogue form; it adds a new dialogue
design page to a report. When switching to the page with the dialogue form, the designer
workspace changes, thus becoming a form where control objects can be placed:
6.1
Controls
Element
Name
Description
© 1998-2006 FastReports Inc.
Dialogue forms
141
TfrxLabelControl
This control is used for displaying
explicative inscription on the dialogue
form.
TfrxEditControl
This control is used for entering a text line
with the help of the keyboard.
TfrxMemoControl
This control is used for entering several
text lines with the help of the keyboard.
TfrxButtonControl
The control represents a button.
TfrxCheckBoxControl
The control represents a flag, which can
perform two statuses: enabled and
disabled. Near the flag, the explicative
inscription is displayed.
TfrxRadioButtonControl
The control represents a switch key
counterpart with radio button. This is the
reason why it cannot be used alone.
TfrxListBoxControl
The control represents the list of lines with
a possibility to select one of them.
TfrxComboBoxControl
The control represents the drop-out list of
lines with a possibility to select one of
them.
TfrxDateEditControl
The control represents a field with a
drop-out calendar for date entering.
TfrxGroupBoxControl
The control represents a bar with
explicative inscription which is used for
uniting several controls.
TfrxPanelControl
The control represents a bar, which is
designed for uniting several controls.
TfrxBitBtnControl
The control represents a button with
picture.
TfrxSpeedButtonControl
The control represents a button with
picture.
TfrxMaskEditControl
The control represents a text box for
entering information set in a template.
TfrxCheckListBoxControl The control represents a list of lines with
flags.
TfrxBevelControl
© 1998-2006 FastReports Inc.
The control is used for the dialogue form
design.
142
FastReport 3.0 User's Manual
TfrxImageControl
6.2
The control represents a picture in “BMP,”
“ICO,” “WMF,” or “EMF” format.
“Hello, World!” report
In this example, we will create a report displaying a greeting window before
outputting the report by using a dialogue form. Create new report and add a dialogue form
into the report. Put the “TfrxLabelControl” and “TfrxButtonControl” objects on the form:
Set objects’ properties:
TfrxLabelControl:
Caption = 'Hello, World!'
TfrxButtonControl:
Caption = 'OK'
Default = True
ModalResult = mrOk
Set the “BorderStyle = bsDialog” property in the form.
As soon as design of the dialogue form is finished, return to the report design page
and place a “Text” object with some text in it there. Preview the report and you will see
the dialogue form:
© 1998-2006 FastReports Inc.
Dialogue forms
143
When clicking on the “OK” button, a report will be constructed and displayed. If
closing a form via the “Х” button, the report will not be constructed. This is the
mechanism of FastReport working: if there are dialogue forms in a report, it is constructed
only when each form is closed with the “ОК” button, i.e. it returns ModalResult = mrOk.
That is why the “ModalResult” property of the button is set equal to “mrOk.”
6.3
Entering parameters and transferring them into a report
Let us make this example more complicated in order to show how to transfer the
values entered in the dialogue form into a report. To perform this, modify the dialogue
form in the following way:
Place a “Text” object containing the following text on a page:
You entered:
[Edit1.Text]
Preview the report and make sure that the parameter you entered is successfully
displayed in the report. You can address other objects of the dialogue form In the same
way. Since each object has a name, which is unique within the whole report, it can be used
anywhere within the report.
6.4
Interaction of controls
By using script, you can easily create logic for the dialogue form’s work, for
example, its controls’ interaction. Let us illustrate this by a simple example. Modify the
form in the following way:
© 1998-2006 FastReports Inc.
144
FastReport 3.0 User's Manual
Double click on the “CheckBox” object, so that the “OnClick” event handle would
be created, and then write the following script:
PascalScript:
procedure CheckBox1OnClick(Sender: TfrxComponent);
begin
Button1.Enabled := not CheckBox1.Checked;
end;
C++ Script:
void CheckBox1OnClick(TfrxComponent Sender)
{
Button1.Enabled = !CheckBox1.Checked;
}
When running the report, you would see that the button responds to the flag
condition’s modification.
6.5
Several dialogue forms
Let us examine how report with two dialogue forms works. Create a report with
two dialogues and one design page:
© 1998-2006 FastReports Inc.
Dialogue forms
145
Set ModalResult properties of OK and Cancel buttons (mrOk and mrCancel
accordingly). Now run the report. First of all we will be offered to answer questions from
the first dialogue (name, are there any children), then, on clicking ОК – from the second
one (children’s names). After clicking ОК in the second dialogue the report will be built.
In such a way works FastReport kernel – involving several dialogue boxes they appear in
the order of their creation, moreover, every further dialogue will be displayed after
clicking OK in the previous one (with ModalResult property = mrOk). If any dialogue
were denied (via Cancel or cross on window heading), report building would stop.
6.6
Dialogue forms managing
In the previous example both dialogue forms are displayed irrespective of the fact
whether we ticked "Have children" or not. Let us show how to hide the second dialogue in
case when this flag is disabled. To perform this create OnClick handler of ОК button on
the first dialogue form (double-click on the button to create handler):
PascalScript:
procedure Button1OnClick(Sender: TfrxComponent);
begin
DialogPage2.Visible := CheckBox1.Checked;
end;
C++Script:
© 1998-2006 FastReports Inc.
146
FastReport 3.0 User's Manual
void Button1OnClick(TfrxComponent Sender)
{
DialogPage2.Visible = CheckBox1.Checked;
}
This code hides the second dialogue form (DialogPage2), if flag is not marked.
Preview the report, to see that everything works correctly.
Another way of form managing is to use the OnRunDialogs report event. In order
to create this event handler select Report object in report tree or object inspector and
switch to “Events” tab in the inspector. Double-click on OnRunDialogs event to create
necessary handler:
Write the following code in handler:
PascalScript:
procedure frxReport1OnRunDialogs(var Result: Boolean);
begin
Result := DialogPage1.ShowModal = mrOk;
if Result then
begin
if CheckBox1.Checked then
Result := DialogPage2.ShowModal = mrOk;
end;
end;
C++Script:
void frxReport1OnRunDialogs(bool &Result);
{
Result = DialogPage1.ShowModal == mrOk;
if (Result)
{
if (CheckBox1.Checked)
© 1998-2006 FastReports Inc.
Dialogue forms
147
Result = DialogPage2.ShowModal == mrOk;
}
}
How the handler works we show the first dialogue. If it was closed via ОК, look at
CheckBox1 flag status and show the second dialogue, if it is necessary. If handler returns
Result = True, report is building; if Result = False, report stops.
© 1998-2006 FastReports Inc.
Chapter
VII
Wizards
Wizards
149
FastReport contains several wizards that simplify the report creation process.
Wizards can be found in the "File|New..." menu item.
7.1
New report wizard
There are four wizards intended to create new report:
- Standard report wizard
- Dot-matrix report wizard
- Standard report
- Dot-matrix report
Wizards of type "Standard report" and "Dot-matrix report" will create the empty
standard or dot-matrix report (you can read more about dot-matrix reports in the next
chapter). The report will contain one empty page.
Wizards of type "Standard report wizard" and "Dot-matrix report wizard" allow
you to choose fields you want to show in the report, create optional groups and select the
data layout. Let's look at report creation process using "Standard report wizard".
Choose the "File|New..." menu item, then choose "Standard report wizard" item.
We will see the report wizard dialog:
© 1998-2006 FastReports Inc.
150
FastReport 3.0 User's Manual
As you can see, there are several tabs in this window. On the first tab we need to
choose the data source for our report. To do this, select the database connection first (if
you need to configure the connection or create a new one, press the
choose the customer table and press the "Next >>" button.
button). Let's
On the next tab we need to choose the fields we want to display in our report:
© 1998-2006 FastReports Inc.
Wizards
151
In the left side we can see a list of available fields; in the right side - list of selected
fields, it will be displayed in the report. Use "Add", "Add all", "Remove", "Remove all"
buttons to move necessary fields from one list to another. You can also use
buttons
to move the selected field up or down. Let's add "Company", "Contact", "Phone", "FAX"
fields to the selected fields list and press the "Next >>" button.
On the next tab we can create one or several groups. In this case FastReport will
add the Group header, Group footer bands in our report.
© 1998-2006 FastReports Inc.
152
FastReport 3.0 User's Manual
This step is optional. We will skip it by pressing the "Next >>" button.
On the next tab we can set the page orientation and choose between two data
layouts - tabular and columnar:
When choosing the layout we can can see the report sample at right side of the
© 1998-2006 FastReports Inc.
Wizards
window. It will show the sample for corresponding report layout.
Finally, the last tab displays the available color schemes for your report.
When we press the "Finish" button the wizard creates the following report:
We can run the preview window immediately:
© 1998-2006 FastReports Inc.
153
154
7.2
FastReport 3.0 User's Manual
New connection wizard
This wizard allows you to add a new database connection into existing report. It
may be necessary to have two or more connections if you want to display a data from two
or more databases. The wizard will add the database component (like TfrxADODatabase)
to your report.
You need to construct the connection string (use the
button) - you will see the
standard Windows connection window where you can choose the database and set the
connection parameters. After this you may specify the user name/password.
NB: you can create a new connection manually - just put the TfrxADODatabase
component into your report:
© 1998-2006 FastReports Inc.
Wizards
7.3
155
New table wizard
This wizard allows you to add a new database table into existing report.
Attention: you need to choose the database connection first (in the "Report|Data..."
menu item)!
You need to select the table name. Also you can specify the filter if you want to
filter a table records, for example:
(CustNo > 2000) and (CustNo < 3000)
NB: you can create a new table manually - just put the TfrxADOTable component
into your report:
© 1998-2006 FastReports Inc.
156
7.4
FastReport 3.0 User's Manual
New query wizard
This wizard allows you to add a new SQL query into existing report. Attention:
you need to choose the database connection first (in the "Report|Data..." menu item)!
You need to specify the SQL here. You can use visual query builder to do this push the
button. The query builder is described later in this chapter.
NB: you can create a new query manually - just put the TfrxADOQuery
component into your report:
© 1998-2006 FastReports Inc.
Wizards
7.5
157
Query construction
For Visual query construction FastQueryBuilder is used. (It is available as an
independent product for use in your applications). It is included in FastReport Professional
and Enterprise versions. The query constructor is used for visual query building in SQL
language. Constructor is shown in the illustration below:
1 - toolbar
2 – designer work area
3 – the list of available tables
4 – selected table fields parameters area
Toolbar:
- open SQL file
- save query into the file (query plan is also saved into the file)
- designer working area clearing
- Ок button. Exiting designer with saving.
- Cancel button. Exiting designer without saving.
© 1998-2006 FastReports Inc.
158
FastReport 3.0 User's Manual
Constructor working area and the list of available tables support Drag&Drop
technology, i.e. for placing table into working area drag it there with the mouse, or
double-click on table title in the available list of tables.
To include any field from the table in the query mark it:
Marked fields appear in the fields parameter table area (4):
- Visibility – defines whether field is included in output
- Where – field selecting condition. For example, '> 5'
- Sort – defines sorting according to field.
- Function – defines function applicable to field
- Group – grouping according to field.
By “dragging” fields between tables in the work area (2), “Join lines” will appear.
On joining connecting field’s type compatibility is verified. It is impossible to create joins
between incompatible fields. For link parameter settings, place the cursor on the “join
line”, right click and select Options item. The join parameters window appears, where
you can set the required values: See the illustration below.
© 1998-2006 FastReports Inc.
Wizards
7.5.1
159
Query constructor usage
Build a simple report using the query constructor.
Click “New report”
on designer toolbar. A report page with “Report heading”,
“First level data”, “Page footer” bands is created.
Put ADO Query component on page. It will be displayed at the bottom of window.
Double-click on component and you will see query editor window.
Click
button in sql editor and you will see the query constructor window.
Select Customer table in the table list (3) and drag it to work area (or can double-click on
it). Mark CustNo, Company and Phone fields:
© 1998-2006 FastReports Inc.
160
FastReport 3.0 User's Manual
That is all that necessary for query building. You can see query code on SQL page
tab, and on Result page tab you can see data which the query has returned. Click
to
close constructor. At that we return to query editor window where the generated query
code is now displayed:
Attention! If you modify query code, you will lose plan (tables placing in query
constructor and their joins). Do not modify query code manually, you can always enter
© 1998-2006 FastReports Inc.
Wizards
161
query constructor and correct the plan visually.
By clicking ОК in editor we return to the report designer. All that is left to do is to
connect “First level data” band to data source and place fields on the band.
7.5.2
Complicated query building
In previous example we built reports on the basis of one table. Let us now examine
query building including data from two tables.
Earlier we examined report working with groups. Let us build query for this report
via query constructor. We need to make up a query in SQL language which will return
data from both tables, and the data will be grouped according to a definite condition. In
our case the condition will be CustNo fields in both tables. SQL-query may look like this:
select * from customer, orders
where orders.CustNo = customer.CustNo
order by customer.CustNo
As in the previous example, create new report and put ADO Query component on
page. It query editor click button for query construction.
Drag two tables to work area – Customers and Orders. Both tables have CustNo
field which we will use to join them. By dragging the CustNo field from one table to the
other we create a join between the two tables:
© 1998-2006 FastReports Inc.
162
FastReport 3.0 User's Manual
Now it is necessary to mark the fields which are to be included and group it
according to CustNo field. To perform this tick off "*" fields in both tables, and also
CustNo field in Customer table. In the field parameters area selected fields appear. After
that we need to select sorting for CustNo field:
That is all. Query is ready. Its code looks like the following:
© 1998-2006 FastReports Inc.
Wizards
© 1998-2006 FastReports Inc.
163
Chapter
VIII
Dot-Matrix
Reports
Dot-Matrix Reports
165
Earlier we examined reports intended for printing with ordinary printers (stylus,
laser,etc.). If sent to a dot-matrix printer their printing will be very slow. FastReport
allows us to create special reports for dot-matrix printer where only standard font symbols
without graphic elements are printed. That is why printing is rather fast.
Let us examine report building of “List” type which is intended for dot-matrix
printing. Earlier we created such kind of report, see “”List of clients” report”. We need the
same data for report.
Enter report designer and select “File|New…” menu item. The report wizard
dialogue appears with a report wizard list. Select the "dot-matrix report" item:
On clicking ОК you see empty design page layout marked for dot-matrix font:
© 1998-2006 FastReports Inc.
166
FastReport 3.0 User's Manual
The list of objects available for inserting has changed – now they are the “Band”,
“Text”, “Line”, “ESC-Command”, “Enclosed report” and “Cross-tab” objects. Other
objects cannot be used in dot-matrix printer.
Place Report title, Page header and Master data bands on report page:
Place “Text” objects on bands in the following way:
Dot-matrix objects placing principle is the same as in ordinary report. Difference is
in the fact that objects are strictly bound to netting, and it is impossible to set another font
size or color for them. But some font attributes can be modified. To perform this select
“Text” object and click “Tt” on toolbar:
© 1998-2006 FastReports Inc.
Dot-Matrix Reports
167
As you can see, here you can set font attributes which are specific for dot-matrix
printing. Report page and all dot-matrix objects with the exception of bands have these
attributes.
Attention! In designer and preview only “Bold”, “Italics”, “Underline” attributes are
displayed. The whole set of attributes is only printed.
Let us modify our report appearance with “Bold” style for headings:
Report is ready, you can run preview mode:
© 1998-2006 FastReports Inc.
168
8.1
FastReport 3.0 User's Manual
Cross-tab in dot-matrix
The number of objects for dot-matrix report is restricted only by those which can
be displayed in textual form. Among them there is “Cross-tab” object. Let us examine
simple cross-report creation which is similar to one built earlier in “Table with composite
headers” chapter.
For dot-matrix report creation perform the same steps like in the previous chapter
– call “Empty dot-matrix report” wizard. Put “DB cross-table” component on report page
and enter its editor:
As can be seen, the editor shows structure of output table in dot-matrix mode.
Cross cells style can be set via using “Tt” button in the editor. In all other respects
working does not differ from the one earlier described. The previewed report will appear
in the following way on the screen:
© 1998-2006 FastReports Inc.
Dot-Matrix Reports
8.2
169
Dot-matrix reports printing
The following print dialogue is used when you print a dot-matrix report
Printing dialogue resembles a standard one, but dot-matrix printer specifics are
added here. So, it is necessary to select system of printer commands before printing
(ESC-commands). The following commands are available:
© 1998-2006 FastReports Inc.
170
FastReport 3.0 User's Manual
Also there is a set of flags setting options of dot-matrix printing:
- Print to file – defines whether it is necessary to send printing stream to file on hard disk.
If flag is enabled, a window with file name query appears;
- Page breaks – defines whether it is necessary to send “Page break” control command on
reaching page bottom. If the flag is disabled, it allows to print on roll stationery;
- ОЕМ-codepage – defines whether it is necessary to perform symbol conversion;
- Pseudographic – defines how to draw vertical and horizontal lines. If flag is disabled,
lines are drawn with the help of -, |, + symbols.
8.3
“Command” object
As it was described earlier, you can determine the following attributes set for
dot-matrix report objects:
This is a standard set which is understood by all models of dot-matrix printers.
Meanwhile, a specific printer model can support commands not present in standard set, for
example, printing with 20 character per inch resolution. To send such a command on
report printing use “ESC-Command” object
.
The object is placed in required place of page (for example, in top left corner or
before objects group which is to be depicted with non-standard attributes). To set a
command edit Command property of object (in object inspector):
In the property you can set a command in one of the three forms: decimal (for
example, #27#40) or hexadecimal (1B28).
© 1998-2006 FastReports Inc.
Dot-Matrix Reports
© 1998-2006 FastReports Inc.
171
Chapter
IX
Report viewing,
printing and
export
Report viewing, printing and export
173
The built report can be displayed, printed or exported into one of the supported
formats. Everything that can be performed in preview window.
On the picture with figures the following is displayed:
1 – ready report;
2 – toolbar;
3 – status line;
4 – scroll bars.
The following buttons are on the toolbar:
Icon
Name
Description
Print report
Prints report. Hotkey analogue – Ctrl+P.
Open report
Opens file with ready report (*.fp3).
Save report
Saves report to file (*.fp3).
© 1998-2006 FastReports Inc.
174
FastReport 3.0 User's Manual
Report export
Exports report to one of the supported formats.
Export to PDF
Exports report to Adobe Acrobat file (*.pdf).
Send via e-mail
Exports report to one of the supported formats and
sends it via e-mail as enclosure.
Text search
Text search in report. Hotkey analogue – Ctrl+F.
Entire page.
Scale
Page edgewise.
Initial size (100%).
Two pages side by side.
Selects arbitrary scale.
Full screen
Displays report at full screen. For returning to
normal conditions perform double-click on report.
Page properties
Calls dialogue with page properties.
Report tree
Shows or hides report tree.
Hand
Hand tool. Move mouse with pressed right button
for report scrolling.
Magnifier
Magnifier tool. Left button of mouse zooms in, the
right one – zooms out.
New page
Inserts empty page to report.
Delete page
Deletes current page from report.
Edit page
Edits current page.
To beginning
Transfer to the first report page.
Previous page
Transfer to previous report page.
Page number
Transfer to report page with pointed number. Enter
number and click Enter.
Next page
Transfer to next report page.
To end
Transfer to the last report page.
Close window
Close preview window.
© 1998-2006 FastReports Inc.
Report viewing, printing and export
9.1
Control keys
Keys
9.2
Description
Ctrl+S
Save report to *.fp3 file.
Ctrl+P
Print report.
Ctrl+F
Text search.
F3
Continue search.
Стрелки
Smooth document scrolling.
PageUp,
PageDown
Up/down scrolling.
Ctrl+PageUp,
PageDown
Next/previous page scrolling.
Home
Document beginning.
End
Document end.
Mouse control
Action
9.3
175
Description
Left button
Click on selected object (in interactive report); report
scrolling in “hand” mode (move mouse with pressed button);
zoom in is performed in “magnifier” mode.
Right button
Context menu; in “magnifier” mode zoom out is performed.
Double-click
It full screen mode it performs returning to normal
conditions.
Mouse scroll
Report list scrolling.
Report printing
To print a report click on
printing dialogue.
© 1998-2006 FastReports Inc.
button (or Ctrl+P hotkey). The window appears – it is
176
FastReport 3.0 User's Manual
You can select a printer via which you want to print a report. Also you can specify
the following settings:
- Properties – set printer properties, for example, printing quality;
- Print to file – printing is not performed via printer, report is saved to file instead;
- Reverse pages – pages are printed in reverse order, beginning with the last one;
- All – print all report pages;
- Current page – print only current page;
- Pages – print pages with specified numbers;
- Copies – how many report copies are to be printed;
- Collate – if there is a task to print several copies, at first one report copy is printed, then
– the next etc. If flag is disabled, several copies of the first page are printed, then – several
copies of the second one etc.;
- Print all pages – which pages are to be printed. Variants: All pages, Even pages, Odd
pages.
After clicking on ОК report printing begins. If the “Print to file” flag is selected,
file name is called. And report is saved to this file (file with *.prn extension. It contains a
copy of information sent to printer).
9.4
Text search in report
FastReport allows to search a set text line in a text in preview window. To perform
that there is
button on toolbar (or its hotkey analogue - Ctrl+F). After that search
dialogue appears:
© 1998-2006 FastReports Inc.
Report viewing, printing and export
177
Here you can set search line and options as well:
- Search from beginning – to search text from the beginning of document. Otherwise
search will be performed from current page;
- Distinguish letter case – to distinguish letter cases (lower-case and capital types) on
searching.
On clicking ОК text search is performed and the first found element is highlighted:
To continue search click F3. The following element will be highlighted
9.5
Report Export
FastReport allows exporting a built (output) report to different formats for further
editing, archiving, sending via e-mail, etc... To export you must add the desired FR export
components to the Delphi form.
Export to 11 formats is supported. They are: PDF, Excel, XML, RTF, HTML, text,
CSV, BMP, Jpeg, Tiff, and Gif. There is the ability to send report via e-mail in any
above-listed formats with FastReport means.
© 1998-2006 FastReports Inc.
178
FastReport 3.0 User's Manual
Exports in FastReport use one of the following three methods:
- Layer-by-layer – object transferring to resulting file is performed alternately. Expert
accuracy is approximated to original;
- Table – on object transferring transitional matrix of object allocation is used. There is
high accuracy to original based on the assumption that rules of creating correct report
sample were followed (“Report Design References” chapter);
- Enveloping – all report objects enveloping is performed on page image. There is full
original accuracy. It is used on export to graphic formats.
9.5.1
Export to PDF Format
PDF (Portable Document Format): a platform-stand alone format of electronic
documents created by Adobe Systems. The free Acrobat Reader package is used for
viewing. This format is rather flexible – it allows inclusion of necessary fonts, vector and
bitmapped images; it allows transferring and storage of documents intended for viewing
and further printing.
Export method is a layered one.
On exporting to PDF format the dialogue box for output file parameter settings
appears.
© 1998-2006 FastReports Inc.
Report viewing, printing and export
179
Export parameters:
- Compressed – output file compressing. It reduces file size but increases export time;
- Embedded fonts – all fonts used in report will be contained in the PDF output file for
correct file displaying on computers where these fonts may be absent. Output file size
increases considerably;
- Background – export of graphic image assigned to a page into PDF file. It considerably
increases output file size;
- Print optimized – output of graphic images in high resolution for further correct printing.
This option enabling is necessary only when the document contains graphics and its
printing is necessary. It considerably increases output file size;
- Outline – option is enabled when report outline is used. It enables export of the outline to
the PDF document;
- Open after export – resulting file is opened right after export via PDF files viewing
program which must be installed in OS by default (for example, Adobe Acrobat Reader).
Export peculiarities: RichText objects are exported as a graphic.
9.5.2
Export to RTF Format
RTF (Rich Text Format) was developed by Microsoft as a standard for text
documents interchange. Now RTF documents are supported by many modern text editors
and operating systems.
Export method is a table one.
On exporting to RTF format the dialogue box for output file parameter settings
© 1998-2006 FastReports Inc.
180
FastReport 3.0 User's Manual
appears.
Export parameters:
- Pictures – enables graphic images export to output file;
- Page breaks – enables page breaks in RTF file;
- WYSIWYG – full compliance to report appearance. Disabling the option allows
optimization, reducing the number of lines and columns in the output file;
- Open after export – output file will be opened right after export via RTF files viewing
program which must be installed in OS (for example, Microsoft WordPad).
Export peculiarities: RichText objects are fully integrated into RTF format. File
appearance and size depend on report sample accuracy (“Report Design References”
chapter);
9.5.3
Export to Excel
Excel – application for working with electronic worksheets. It is included into
Microsoft Office System.
Export method is a table/diagram one.
On exporting to Excel format the dialogue box for output file parameter settings
appears.
© 1998-2006 FastReports Inc.
Report viewing, printing and export
181
Export parameters:
- Styles – transferring of text objects design styles into the table. Disabling increases
exporting speed but worsens document appearance;
- Pictures – includes graphic images export into output table;
- As text – all objects are transferred into table/diagram as text ones. This option may be
useful when transferring numeric fields with complicated formatting;
- Fast export – usage of optimized fast data transferring to Excel. This option disabling
slows down data transferring but increases export compatibility on any errors during data
transferring;
- Merge cells – cells integration in resulting table/diagram for achieving maximum
correspondence to the original. Disabling increases exporting but reduces document
appearance;
- WYSIWYG – full compliance to report appearance. On this option disabling the
optimization for reducing the number of lines and columns in resulting table is performed;
- Background – export of filling color assigned to report page;
- Page breaks – includes page breaks in Excel;
- Open Excel after export – resulting file will be opened right after exporting into Excel.
Export peculiarities: Excel program must be installed on your PC. RichText
objects are transferred as simple text, graphic images transference is supported.
© 1998-2006 FastReports Inc.
182
9.5.4
FastReport 3.0 User's Manual
Export to XML Format
XML (Extensible Markup Language) is an expansible marking language. XML is
intended for structured data storage and also for information interchange between different
programs. FastReport uses XML format for data transferring into Excel table/diagram
editor ver. 2003 and later.
Export method is a table/diagram one.
On exporting to XML format the dialogue box for output file parameter settings
appears.
Export parameters:
- Styles – transferring of text objects design styles. Disabling speeds up exporting but
worsens document appearance;
- WYSIWYG – full compliance to report appearance. Disabling allows reducing the
number of lines and columns in resulting table;
- Background – export of filling color assigned to report page;
- Page breaks – includes page breaks in resulting document;
- Open Excel after export – resulting file will be opened right after exporting into Excel.
Export peculiarities: Excel program must be installed on your PC. RichText
objects are transferred as a simple text; graphic images transference is not supported.
© 1998-2006 FastReports Inc.
Report viewing, printing and export
9.5.5
183
Export to CSV Format
CSV-file contains values formatted in the form of a table/diagram and adjusted in
such a way that every value in column is divided from value in the next column be means
of separator, and every new row begins with new line. This format may be imported into
different table/diagram editors.
Export method is a table/diagram one.
On exporting to CSV format the dialogue box for output file parameter settings
appears.
Export parameters:
- OEM codepage – resulting file OEM coding selecting;
- Separator – values separator in files;
- Open after export – resulting file will be opened right after exporting via CSV files
viewing program which must be installed in OS.
Export peculiarities: on transferring into this format report design is not saved.
Graphic images are not supported.
9.5.6
Export into HTML Format
HTML (Hypertext Markup Language) is regarded as standard language for
document marking in the Internet. HTML was created as a language for scientific and
technical documentation interchange suitable for usage by people who are not specialists
in nesting. It is used for creating relatively simple but nicely designed documents. Besides
document structure simplification hypertext support is included into HTML.
© 1998-2006 FastReports Inc.
184
FastReport 3.0 User's Manual
Export method is a table/diagram one.
On exporting to HTML format the dialogue box for output file parameter settings
appears.
Export parameters:
- Styles – transferring of text objects design styles. Disabling increases exporting but
worsens document appearance;
- Pictures – includes graphic images exporting possibility;
- All in one folder – all additional files are saved in the same folder with main file;
- Page navigator – special navigator for fast shift between pages is created;
- Fixed width – blocking of automatic table/diagram width modifying on changing
preview window size;
- Multipage – every page will be written to separate file;
- Background – export of graphic attributes assigned to report page;
- Open after export – resulting file will be opened right after exporting via HTML files
viewing program which is allocated in OS by default.
Export peculiarities: export may consist of several files. Each graphic image is
supported and saved in their own separate file, RichText objects are transferred as simple
text. Appearance and file volume depend greatly on report sample (“Report Design
References” chapter)
© 1998-2006 FastReports Inc.
Report viewing, printing and export
9.5.7
185
Export to Text Format
Usual text file. It contains information from report. This information is optimized
to the limit and converted in accordance with the given format peculiarity.
Export method is a table/diagram one.
On exporting to text format the dialogue box for output file parameter settings
appears.
Export parameters:
- Page breaks – export of page breaks to resulting file;
- Empty lines – export of empty lines;
- Frames – export of text objects frames;
- OEM codepage – resulting file OEM coding selecting;
- Open after export – resulting file will be opened right after exporting via default text
files viewing program which is installed in OS.
Export peculiarities: report design is not saved on transferring to this format,
graphic images are not supported, exported page width is figured automatically depending
on type of text objects on report page.
9.5.8
Export to Jpeg, BMP, Gif, Tiff Graphic Formats
FastReport allows exporting information to graphic formats.
JPEG (Joint Photographic Experts Group) – is a format based on shrinking algorithm
© 1998-2006 FastReports Inc.
186
FastReport 3.0 User's Manual
which is based not on the same elements search but on difference between pixels. It is
characterized by high compression level at the expense of partial graphic information loss.
BMP (Windows Device Independent Bitmap) – is used for storage of bitmap images
assigned for usage in Windows. A standard file format for computers under Windows
control.
GIF (Graphics Interchange Format) – independent from hardware support the GIF format
was developed for bitmap images transferring through networks. It allows compression of
files containing many homogeneous fillings (logos, inscriptions, schemes) rather well.
TIFF, TIF (Target Image File Format) – hardwarily stand-alone format. Today it is one of
the most widespread and reliable in polygraphy and facsimile information transferring.
Export principle is enveloping.
On exporting to one of above-named graphic formats the dialogue box for image
parameters setting appears.
Export parameters:
- Separate files – if option is enabled, every report page is exported to separate file. File
name is given according to the selected one with addition of underlining and page number;
- Monochrome – monochrome picture creating;
- Crop pages – after exporting blank area cropping will be performed along edges;
- JPEG quality – JPEG file compression ratio. Option is enabled only on exporting to
JPEG format;
© 1998-2006 FastReports Inc.
Report viewing, printing and export
187
- Resolution – output graphic presentation resolution.
Export peculiarities: on exporting several pages to one file (on disabled Separate
files option) it is necessary to remember large resources capacity of export.
9.6
Sending a Report via E-mail
FastReport allows sending a ready report by e-mail in any format you need. You
do not need any additional programs to send mail.
On selecting export by e-mail the dialogue box for setup of message and exporting
format parameters appears. Before export forming and sending via e-mail, it is necessary
to set parameters of mail box owner. All these parameters are on the “Account” page tab:
- From Name – sender’s name;
- From Address – sender’s e-mail;
- Organization – sender’s organization;
- Signature – signature for mail. It may be automatically formed on clicking on “Build”
button on condition that the earlier examined fields are filled;
- Host – SMTP server port;
- Port – SMTP server port;
© 1998-2006 FastReports Inc.
188
FastReport 3.0 User's Manual
- Login – access name for authorization on SMTP server, if its usage is necessary for mail
sending via specified SMTP server;
- Password – authorization password;
- Remember properties – remember all parameters for further usage.
After filling in the necessary parameters for mail sending, you must fill in message
parameters in "E-mail” page tab:
- Address – e-mail address of receiver. Earlier used addresses can be selected in
drop-down menu;
- Subject – message subject. Earlier used topics can be selected in drop-down menu;
- Text – message text;
- Format – format of report attached to mail. One of the available export formats and also
own format of FastReport (FR3) ready report may be selected;
- Advanced export settings – on this option enabling after clicking on “OK” the dialogue
box for selected export format setting appears. Otherwise default export parameters will
be used.
Export via e-mail peculiarities: only plain authentication on SMTP servers is
supported. If authentication is not required, it is not necessary to fill “Login” and
“Password” fields in settings.
© 1998-2006 FastReports Inc.
Report viewing, printing and export
9.7
189
Report Design References
It is significant that the quality of the export into any other format depends greatly
on competent design of initial report. FastReport allows a great number of ways to
manipulate objects during report output creation. This gives the advantage of fast
development of any reports and their further printing. Printed document will look just as
on display. And this is the primary intent of FastReport report generator usage. The
downside of such development freedom is the complexity of exporting the FastReport
document to different data formats, which have their own limits and requirements for
information presentation, and are sometimes rather complex. In this chapter, special
design requirements of reports intended for export to other data formats will be discussed.
Many formats use table data presentation. Formats such as HTML, XLS, XML,
RTF and CSV, do. Not allow cell crossing or arranging in layers when table marking, this
concerns HTML and RTF. In contrast to freedom of report development in FastReport
designer. Export filters, as a rule, take into account these requirements when objects are
transferred from FastReport report to necessary format. This is carried out by special
algorithms which takes object crossings into account and their optimal placing. At object
crossing points new columns and lines in the resulting output table appear. That is
necessary for saving of the FastReport transferable objects exact positioning and for
getting maximum resemblance between the result and original report. A large number of
cross objects in report design, leads to an increased number of columns and lines in the
resulting table. This leads to the need to edit the resulting file in its own editor for further
use.
For example, on report design a slight crossing of two objects placed one under
another on the same band. The number of records on report forming was 150. On export
to RTF format 450 lines will be created (150 lines for each object and 150 ones for
crossing). If we remove crossing there will be already 300 lines. In large reports and on
huge number of objects the difference will be really tremendous. That, of course, will
© 1998-2006 FastReports Inc.
190
FastReport 3.0 User's Manual
affect output file size.
Objects in the report
Export to Excel - result
Remember that during designing, if you want to export your reports in any table
format.
On creating tables in report keep an eye on neighboring cell’s borders to adjoin
each other. It is important that cells do not cross and arrange in layers. Export filter
algorithm will cut off cells but export result may be far from desirable (you will see not
exactly what you wanted to). Arrange objects in such a way that they are placed in line
vertically as well as horizontally. Guidelines can help to perform this.
Using guidelines in the designer
To use guidelines in FastReport designer just click on the horizontal or vertical
ruler limiting report page from the left and the top. Then, holding the mouse button down,
drag the guideline to the required position on the page. You will be able to place objects
immediately along guidelines horizontally and vertically.
Text objects grid alignment can also be helpful in case of cells overlapping. Keep
© 1998-2006 FastReports Inc.
Report viewing, printing and export
191
an eye on enabling grid alignment in designer options. In order to simplify alignment you
can extend grid pitch. Setting of grid pitch and alignment can be found in designer menu
“View” – “Options” – “Grid”.
For text framing it is better to use text object embedded properties instead of single
graphic objects – lines, rectangles, etc. try not to use background objects under transparent
text objects.
Keeping these simple rules in mind will help you to create a report which will look
perfect after export to any format using table (or table-based) marking for data
presentation.
Below there are some examples of correct and undesirable object arrangement on
report design creation.
© 1998-2006 FastReports Inc.
192
FastReport 3.0 User's Manual
Bad
Good
Objects are displaced horizontally. It is necessary to use alignment according to
extension lines as far as possible for objects to have the same horizontal coordinate.
Bad
Good
Objects are overlapping. In such a case on export to table/diagram format
additional useless lines and columns and also 3 additional cells in crossing zone are
created.
It is recommended to get acquainted with demo reports included with the
FastReport installation for mastering basic methods of optimum report development.
© 1998-2006 FastReports Inc.
HelpAndManual_unregistered_evaluation_copy