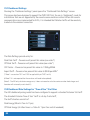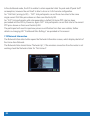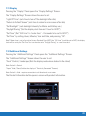
1
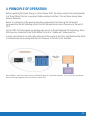
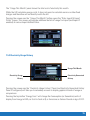
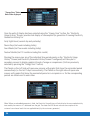
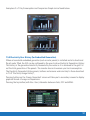
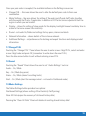
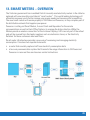
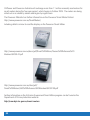
SMART ENERGY IN-HOME DISPLAY
USER MANUAL
TABLE OF CONTENTS
The Central Victoria Solar City Smart Energy In-Home Display User Manual has the
following contents.
1. TABLE OF CONTENTS
1
2. INTRODUCTION
2
3. OVERVIEW 3
4. PRINCIPLE OF OPERATION
5
5. USE IN CENTRAL VICTORIA SOLAR CITY
6
6. GENERAL OPERATION AND NAVIGATION
7
7. GETTING STARTED
9
8. INFORMATION SCREEN
24
9. IHD PROBLEM SOLVING
25
10. FOR IHD TECHNICAL SUPPORT - CONTACT CVSC Head Office
28
11. FOR ENERGY PLAN PRICING & BILLING - CONTACT YOUR RETAILER
28
12. FOR CUSTOMER COMPLAINTS - CONTACT CVSC Head Office
28
13. SMART METERS - OVERVIEW
29
1
2. INTRODUCTION
Participants in the Central Victoria Solar Cities (CVSC) “IHD” trial are receiving a
Smart Energy In-Home Display (IHD).
In Home Displays connect to Smart Meters via a low power wireless connection, and
receive continuous updates of the energy readings from the Smart Meter.
By 2013 all existing meters in Victoria will be replaced with Smart Meters supported
with remote communications back to the Electricity Network and Retailer.
That remote communications will provide the capability for messaging directly to the IHD
including pricing updates.
However in the CVSC trials, many sites will not yet have remote communications implemented
back to the Network/Retailer, and so instead the IHD is operating only with the meter in
“dashboard” mode.
Messaging will therefore not be occurring as part of CVSC, and in the same way retail pricing
can only be updated manually by the user.
CVSC participants are therefore some of the first in Victoria to trial In-Home Displays and provide
feedback for the development of these devices.
The Smart Energy In-Home Display being used in the CVSC trial is manufactured in the United
Kingdom under the trade name of Puffin by Secure Meters Ltd. The following information and
images is based on the Secure PUFFIN Smart Energy In-Home Display Home User’s Guide and
copyright of that material remains with Secure Australia Pty Ltd.
Puffin® is a registered trade name of Secure Meters Ltd.
2
3. OVERVIEW
3.1 Wireless Range
The Smart Energy In-Home Display is connected to the Electricity Meter via a low power (50mW)
Wireless Zigbee signal; this signal has a range of @15M within the home from the wall behind
the meter box. Meters are usually fitted inside a metal meter box, and customers without a metal
enclosure may experience greater range.
When the IHD looses connection from the meter it will display a “Lost Meter” message at the
bottom of the screen, moving the IHD back within the wireless range will automatically
reconnect the wireless connection to the IHD.
3.2 Power Supply
The Smart Energy In-Home Display is provided in a stand with built in recharger and mains power
supply. The stand/recharger should be connected to mains supply to ensure the IHD is constantly
charged. The IHD will display a “Dock not Powered” message at the bottom of the screen if the
AC supply is disconnected.
The IHD has internal rechargeable batteries. The status of the battery charge is shown at the
bottom right hand side of the main “Landscape” screen.
3.3 Display Modes
The Smart Energy In-Home Display has two modes, when docked in the stand the IHD will
display basic information in a “Portrait” format screen, when removed from the stand the display
will change to a “Landscape” format screen.
3.4 Configuration Set Up
Powercor will provide the Smart Energy In-Home Display pre-connected to the Smart Meter, and
configured for the particular IHD package selected, the IHD will display the energy delivered via
the meter to the home, and apply the relevant pricing to that usage
For those customers with Household PV, the IHD can be configured to show the energy delivered
via the meter to the grid, as well as the energy delivered via the meter to the home, this requires
connection of the IHD to a bi-directional Smart Meter.
3.5 Display Screens
3.5.1. “Portrait Mode” - Screen shown while docked in stand.
This shows basic current and total usage and costs
3
3.5.2. “Landscape Mode” – Screen shown when the IHD is removed from the stand, this mode
provides access to a number of screens
- Home or Main Screen – “Smart Energy In Home Display”
- “Primary Display Settings”
- “Electricity Used”, “Usage this Month” & “Electricity Usage History”
- “Electricity Generated History” for use with bi-directional metering
(Access to “Electricity Generated” screens are configured by Powercor)
- “Information Screen”, “Settings” and “Last Utility Message”
Further Screens can be accessed by pressing active Display Panels, the IHD returns to the Main
Screen when idle. The Display is backlit.
(Note the Utility Message feature is not available on dashboard configured IHDs outside the
Smart Meter communications rollout areas and is not being utilized in the CVSC IHD trials.)
4
4. PRINCIPLE OF OPERATION
Before operating the Smart Energy In-Home Display (IHD), the device needs to be bound (paired)
to a Smart Meter that has a compliant ZigBee wireless interface. This will have already been
done by Powercor.
Below is a schematic of the general operating components that make up the full remote
communication Smart Metering system that will be operational across Powercor by the end of
2013.
As the CVSC IHD participants are getting early access to Smart Metering IHD technology, these
IHDs are only connected to the Smart Meter for local or “dashboard” communication.
In many cases there is no mesh radio rolled out to the meter at this time, and therefore the ability
to communicate and message directly from Powercor to the IHD is not available.
Note: ZigBee is a low data rate, two-way standard for domestic automation networks. It uses small very low-power
devices to connect together to form a wireless control web.
5
5. USE IN CENTRAL VICTORIA SOLAR CITY
Participants in the CVSC “IHD” trial are among the first customers in Victoria to trial
In-Home Display Technology.
Powercor will deliver the In-Home Display (IHD) pre-connected to the wireless connection of the
meter, to utilise an IHD the participant must have a Powercor Smart Meter installed. The IHD can
be configured to display Solar Export values.
Powercor will configure the IHD for a default Victorian 5 day Time of Use (ToU) tariff structure by
loading the IHD with the current applicable rates, but these can be changed by the CVSC
participant to match their own rates, including to a “Flat rate” tariff.
The IHD is preset with 2 ToU tariff periods in its “Dashboard Rate Settings”:
Peak Rate Tariff - Mon-Fri 7am to 11pm; and
Off-Peak Tariff – All other times.
Note: The IHD only calculates energy costs, it does not record or calculate service or other fixed charges and therefore
may not match the bill.
In the dashboard mode being used for the CVSC trial, the IHD is unable to retain separate totals
for peak and off-peak tariff consumption, however the unit itself is able to do so in its full remote
configuration.
For “Time of Use “pricing– ‘IHD” trial participants can set those two rates to the current peak
and off-peak prices shown on their own Electricity Bill.
For “Flat Rate” pricing (i.e. GD) – “IHD” trial participants can set those two rates to the same
single current Flat Rate price shown on their own Electricity Bill.
For “IHD” trial participants with solar generation a default Victorian PFIT rate has been
pre-loaded into the IHD by Powercor, again ‘IHD” trial participants can set that rate to the current
PFIT price shown on their own Electricity Bill.
The participant will need to input new prices on notification from their own retailer, further
details on changing IHD “Dashboard Rate Settings” are provided in this manual.
6
6. GENERAL OPERATION AND NAVIGATION
The screen is touch-activated. Tap the screen to activate it from screen saver mode, which is a
default setting used to conserve power.
When placed in the docking unit, the IHD will automatically charge. The IHD is a fully portable
mains powered unit with a built in battery backup to hold a (approximately) 4 hours’ charge.
By default, when the IHD is docked the display will
operate in Portrait mode
When removed from the dock the display will operate
in Landscape mode and provide greater detail of
information and allow access to other features
While in Landscape mode, the touch screen has a number of context sensitive buttons that can
be identified by a ‘blue’ border around the item.
Note: kWh refers to kilowatt hours – the standard method of measuring energy consumption.
5. Information
Screen
2. Messages
3. Electricity
Usage
1. Primary Display
Settings
6. Back Button
4. Settings
7. Active Alerts
8. Battery Status
7
The various items that can be accessed via the touch screen include:
1. Primary Display Settings:
• Defining which parameters (Cash, kWh, CO2) are visible during main display viewing
• Set maximum targets for Cash, kWh and CO2
2. Messages – Number of active messages received. Press to see list.
(Note this feature is not enabled in the “Dashboard” mode being used in the CVSC IHD Trial )
3. Electricity Usage:
• Usage this Month in kWh in the various rates and import and export totals
• Electricity Usage History for:
- Cash;
- kWh; and
- CO2 with trends and comparisons for 48 hours, 7 days, 4 weeks and 12 months
4. Settings
• Change P.I.N.
• Meter Settings
• Display
• Sound
• Network Information
• Additional Settings
5. Information Screen – Provides electricity distributor information
6. Back Button – Return to previous screen
7. Active Alerts – Indicates any active alerts, such as communications issues.
8. Battery Status – Indicates current charge capacity
8
7. GETTING STARTED
Firstly locate the docking station in a suitable location for regular visibility and easy access. Plug
the supplied power adaptor into a power socket and connect the lead into the lower right hand
socket of the IHD.
Once powered, tap the screen to activate the unit. If docked in its stand (by default), the IHD will
display data in Portrait mode.
7.1 Portrait Mode - Summary Screen
In Portrait mode, the Summary Screen is available for viewing data in both numerical and
graphical format. To access more detailed information and to adjust settings, the unit must be in
Landscape Mode.
Note: See the Primary Display Settings menu for defining what information is normally displayed.
Daily Target indicator
Current Energy Usage
- Numerical Data
Current Energy Usage
7.1.2 Current Energy Usage - Bar Graph
The bar graph indicates the current energy usage. The target for the maximum value is set using
the Primary Display Settings menu. As the target is approached, the last few segments will
change to orange and then red.
• If the green light is displayed, the day’s energy consumption is less than 90% of the target
• If the amber light is displayed, the day’s energy consumption is 90-110% of the target
• If the red light is displayed, you are consuming more than 110% of energy generated
9
7.1.3 Current Energy Usage – Numerical Data
The numerical data indicates a number of current parameters in either kW, Cash or CO2. The
enabling/disabling of each of these parameters can be set using the Primary Display Settings
menu.
• Energy usage Today – indicates the amount consumed today in either kW, Cash or CO2. The
cash value is calculated on the rate settings (see section 4.2.2 Electricity Used for setting
these rates)
• Energy usage for the Month – indicates the amount consumed for the month in either kW,
Cash or CO2. The cash value is calculated on the rate settings (see section 4.2.2 Electricity
Used for setting these rates)
• Tariff rate information – indicates the rate in use and the $/kWh
• Current energy usage – indicates the current energy usage in kW and $/hour
7.2 Landscape Mode – Main Screen
To enable Landscape mode, remove the display from the cradle by sliding the unit up and out of
the cradle. In Landscape mode, the IHD will provide greater information and in addition allow
access to other features such as energy history and settings.
The Main Screen provides a number of separate display panels:
Electricity Usage – Shows cost today, and current tariff rate.
Daily Target Indicator – Lit segments show progress towards daily targets*
Current Energy Usage Bar Graph – Graphical and Numerical progress towards daily targets,
colours show level.*
(*These panels are similar to the Portrait Mode displays described in 6.1)
Note: The IHD only calculates energy costs, it does not record or calculate service or other fixed charges and therefore
will not exactly match the bill.
While in Landscape mode, the touch screen has a number of context sensitive buttons that can
be identified by a ‘blue’ border around the panel. In the default main screen shown below, the
Electricity Usage and Primary Display Setting buttons are readily accessible.
10
Information
Screen
Messages
Electricity Usage
Panel
Press for detailed
Electricity usage
data and graphs
Daily Target Indicator
Panel
Press for Primary
Display Settings
Back Button
Active Alerts
Settings
7.3 Primary Display Settings
The “Primary Display Settings” screen allows you to define which parameters (Cash, kWh, CO2)
are visible during display of data for the Daily Target Indicator and Energy Usage Bar Graphs, and
to set maximum targets for Cash, kWh and CO2.
Daily Target Indicator
11
Pressing the touch screen over the “Daily Target Indicator” panel will open the “Primary Display
Settings” Screen.
The “Primary Display Settings” Screen allows the user to set the Daily Targets for Cash, Energy
in kWh or Carbon Emissions in CO2.
The required parameters are turned off or on via the left panel, and the daily target set via the
right panel.
Turn Off/On
which parameters
are visible
Back Button
Set Max.
Target for Cash
Home Button
Hint: Press blue back arrow to return to the previous screen or the home button to return to the home page.
7.4 Messages
Messages can be sent from your utility/retailer company to alert you of rate changes or
promotional offers in your region. This feature is only available if your meter is receiving this
information from your utility/retailer.
(Note: the CVSC IHD trial is using the IHD in “dashboard mode” and as a result, IHD messages
are not enabled until the Powercor mesh radio remote communications is rolled out.)
Messages
12
By pressing on the Messages button, the Last Utility Message screens opens, displaying the
most recent message received. The History button gives access to previous messages.
History
7.5 Electricity Usage
The Main Screen “Electricity Usage” Panel will display current usage “Today” and this “Month”
along with the current tariff rate.
Note: While the IHD calculates energy costs, it does not record or calculate service or other
fixed charges and therefore will not exactly match the bill.
“Electricity Usage”
Panel
13
7.5.1 Electricity Used
Pressing the touch screen over the “Electricity Usage” Panel will open the “Electricity Used”
Screen. (“Electricity Used or Generated” if configured).
Usage This Month
Electricity Usage
History
Electricity Generated
History
This screen shows:
“Usage This Month” in $
Usage “Last Month” in $
“Present Load” in kW
Current “Cost per Hour” in $
The “Usage This Month” and “Electricity Usage History” Panels (and “Elec. Gen. History” if
configured) are active buttons. Press any of these panels and a screen with a more detailed
breakdown will be displayed.
7.5.2 Usage This Month
Usage This Month
Electricity Usage
History
14
Electricity Generated
History
The “Usage This Month” panel shows the total cost of electricity this month.
While the IHD calculates energy costs, it does not record or calculate service or other fixed
charges and therefore will not exactly match the bill.
Pressing the screen over the “Usage This Month” button opens the “Rate, Import & Export
Totals” screen. This screen will provide additional details of usage for Import (and Export if
enabled) at various Import defined Rates.
7.5.3 Electricity Usage History
Usage This Month
Electricity Usage
History
Electricity Generated
History
Pressing the screen over the “Electricity Usage History” Panel (and Electricity Generated History
Panel if configured) will take you to secondary screens to display graphical trends of usage or
comparisons.
Pressing the top button “Energy Cons” will change the Consumption (or Generation) units of
display from Energy in kWh, as Cost in Cash as $, or Emissions as Carbon Dioxide in kgs of CO2.
15
“Energy Cons”Select
Units to be displayed
Once the units of display has been selected using the “Energy Cons” button, the “Electricity
Usage History” Screen provides text display of consumption (or generation if viewing Electricity
Generation History) for:
Forty Eight Hours (current day and yesterday)
Seven Days (last week including today)
Four Weeks (last four weeks including today)
Twelve Months (last 12 months including this month)
Pressing the screen over any of the individual time period panels on the “Electricity Usage
History” Screen (and Electricity Generated History Screen if configured) will take you to
secondary screens to display graphical trends of usage or comparisons. (Units as previously
selected by pressing the “Energy Cons” button).
The Panels on the Left side will open new screens with graphs that show the nominated period
consecutively (i.e. the last 7 days consecutively). The Panels on the right side will open new
screens with graphs that show the nominated period as a comparison i.e. for the corresponding
periods are shown next to each other.
(Note: Where an embedded generator is fitted, the Electricity Usage History will only display the consumed electricity
measured by the meter as it is delivered from the grid. The meter and IHD do not measure consumption of the
customer’s own house loads that are supplied directly by the customers generator).
16
Examples of a 7 Day Consumption and Comparison Graph can be found below.
7.5.4 Electricity Gen. History (for Embedded Generation)
Where a household embedded generator (such as solar panels) is installed and a bi-directional
Smart meter fitted, the IHD can be configured by the user to show Electricity Generation History.
This history is the generated electricity measured by the meter as it is delivered to the grid.It is
not the total generation of the panels. The inverter does not measure your local consumption.
The Electricity Generated History panels, buttons and screens work similarly to those described
in 7.5.3 “Electricity Usage History”,
Pressing buttons on the ‘Energy Generated’ screen will take you to secondary screens to display
graphical trends of usage or comparisons.
Pressing the top button (with Elec. Gen.) alternates between Cash, CO2 and kWh’s.
17
7.5 Settings
The “Settings” button allows you to alter system settings and is password protected.
Settings
The IHD will ask for a pass code by displaying the key pad to enter the pass code; the factory
default is 0000.
18
Once your pass code is accepted, the available buttons on the Settings screen are:
• Change P.I.N. – this area allows the user to alter the default pass code to their own
combination.
• Meter Settings – the area allows for setting of the peak and off peak tariff rates together
with the export tariff rate, if applicable. In addition a CO2 factor can be adjusted to suit the
region in which you are located.
• Display – allows for setting of sleep mode for the display, backlight timeout and delay time to
return to the home screen after inactivity.
• Sound – set audio On/Mute and settings for key press, alarms and alerts.
• Network Information – shows details of the in-home network.
• Additional Settings – set preferences for docking and export functions and display product
information.
7.7 Change P.I.N.
Touching the “Change P.I.N.” Panel allows the user to enter a new 4 digit P.I.N., select and enter
a new 4 digit code and press OK, (remember to write down the new P.I.N.).
Press the blue arrow button to exit without entering a new P.I.N.
7.8 Sound
Touching the “Sound” Panel allows the user to set “Audio Settings” such as:
Audio – On / Mute
Key – On / Mute (key press)
Alarm – On / Mute (alarm for setting limits)
Alert – On / Mute (alert for message arrival – not used in Dashboard mode)
7.9 Meter Settings
The Meter Settings button provides two options:
Dashboard Settings (allows setting of the Electricity Tariff pricing)
Clear All Data (wipes the memory of all stored history data)
Pressing the “Clear All Data” Panel will delete all existing stored history data!
19
7.9.1 Dashboard Settings
Pressing the “Dashboard settings” panel opens the “Dashboard Rate Settings” screen.
This screen has been designed to support the CVSC IHD Trial, for use in “dashboard” mode for
installations that are not supported by the remote communications rollout. When full remote
communications are implemented for IHD’s, it is intended that Retailer tariffs will be remotely
loaded via the wireless connection.
The Rate Settings provide entry for:
Peak Rate Tariff - Powercor will preset this value (see notes*)
Off-Peak Tariff – Powercor will preset this value (see notes*)
CO2 Factor – Powercor has preset this value to 1.350kg/kWh#
Export Tariff – Powercor has present this value to $0.66 per kWh*
(* Note 1: see section 7.9.2 and 7.9.3 for applicability to CVSC tariffs)
(# Note 2: It is not expected that these values will need to be updated)
(Note 3 : The IHD only calculates energy costs, it does not record or calculate service or other fixed charges and
therefore will not exactly match the bill.)
7.9.2 Dashboard Rate Settings for “Time of Use” Trial Sites
The IHD dashboard pricing model has been configured to support a standard Victorian ToU tariff.
The standard Victorian Time of Use” tariff is a 5 day 2 rate tariff,
The tariff structure consists of:
Peak Energy (Mon-Fri 7am to 11pm)
Off-Peak Energy (all other times i.e. Mon-Fri 11pm-7am and all weekend)
20
The IHD Dashboard mode has two tariff rates and these automatically apply the tariff to the
displayed usage and stored usage at the times nominated under the ”ToU” tariff.
Peak Rate Tariff - Mon-Fri 7am to 11pm
Off-Peak Tariff – All other times
Powercor will pre-load typical current price settings into the IHD prior to delivery. The participant
can then update the price settings to match those in their Electricity bill or when notified of price
changes by their retailer. inputting the appropriate “Time of Use” peak and off-peak prices
(excluding any block step variations) in each of the relevant IHD Tariff rates above.
In the dashboard mode for the CVSC trial, the IHD is unable to retain separate totals for peak and
off-peak tariff consumption> The unit, however, is able to do so in its full remote configuration.
For “ToU” pricing, “IHD” trial participants can set those two rates to the current peak and
off-peak prices shown on their own Electricity Bill.
For “IHD” trial participants with solar generation, a default Victorian PFIT rate has been
pre-loaded into the IHD by Powercor. Again, CVSC “IHD” trial participants can set that rate to the
current PFIT price shown on their own Electricity Bill.
The participant will need to input new prices on notification from their own retailer. Further
details on changing IHD “Dashboard Rate Settings” are provided in this manual.
7.9.3 Dashboard Rate Settings for “Flat Rate” Trial Sites
The IHD dashboard pricing model has been configured to support a standard Victorian ToU tariff.
The IHD Dashboard mode has two ToU tariff rates and these automatically apply the tariff to the
displayed usage and stored usage at the times nominated under the ”ToU” tariff.
Peak Rate Tariff - Mon-Fri 7am to 11pm
Off-Peak Tariff – All other times
Powercor will pre-load with typical current ToU pricing into the IHD prior to delivery.
The “Flat Rate” tariff known in the past as GD is commonly used by customers with gas or other
non-electric Hotwater.
The IHD can be used to apply a Flat Rate tariff to usage by setting both the peak and off-peak
tariff rates to the one same value.
The participant can update the 2 rates in the IHD to those applying in their Electricity bill or when
notified of price changes by their retailer, inputting the appropriate “Flat Rate” price (excluding
any block step variations) in each of the relevant IHD Tariff rates above, ie use the same Flat Rate
price in both rates.
21
In the dashboard mode, the IHD is unable to retain separate totals for peak and off-peak tariff
consumption, however the unit itself is able to do so in its full remote configuration.
For “Flat Rate” pricing (ie GD) – “IHD” trial participants can set those two rates to the same
single current Flat Rate price shown on their own Electricity Bill.
For “IHD” trial participants with solar generation a default Victorian PFIT rate has been
pre-loaded into the IHD by Powercor, again ‘IHD” trial participants can set that rate to the current
PFIT price shown on their own Electricity Bill.
The participant will need to input new prices on notification from their own retailer, further
details on changing IHD “Dashboard Rate Settings” are provided in this manual.
7.10 Network Information
The Network Information button opens the Network Information screen, which displays details of
the Home Area Network.
The Network status should show “Network Up”, if the wireless connection from the meter is not
working check the Network status for “Not Joined”.
22
7.11 Display
Pressing the “Display” Panel opens the “Display Settings” Screen.
The “Display Settings” Screen allows the user to set:
“Light Off Time” (sets time to turn off the backlight after idle)
“Return to Default Screen” (sets time to return to main screen after idle)
“Set Backlight” ( sets backlight intensity for Mains and Battery use )
“Daylight Saving” (Set the display clock forward 1 hour for ADST*)
“Set Time” (Set “IHD time” to “meter time” – this needs to be set to AEST*)
“Set Time” by setting Hours, Minutes, Year and Date, and pressing “OK”.
Note* Meter time is set to Australian Eastern Standard Time (AEST) the “IHD time” should be set to AEST, the display
clock will be set by the “Set Time” but can then be set to “Daylight Saving” as a real time clock.
7.12 Additional Settings
Pressing the “Additional Settings” Panel opens the “Additional Settings” Screen.
The “Additional Settings” Screen allows the user to set:
“Dock” Portrait / Landscape (Sets the display mode when docked in the stand)
Note: Default is Portrait.
“Export” Hide / Show (Enables the display of “Electricity Generated” Screens)
Note: Default is Hide – requires connection to a bi-directional smart meter.
The Product Information button opens a screen with product information.
23
8. INFORMATION SCREEN
Information Screen
Pressing on the “Information Screen” button displays information and contact details for your
Electricity Distributor Powercor for Network Faults and Emergencies.
Note: This number should not be used for reporting IHD Faults.
24
9. IHD PROBLEM SOLVING
9.1 - No Display
If the Smart Energy In-Home Display is not displaying it is likely that the battery is flat.
Check that the IHD is docked properly in the Stand.
Check that the Stand recharger is plugged in and turned on.
9.2 - Battery Flat
To turn the Smart Energy In-Home Display after a flat battery:
• Return the IHD to the Stand and ensure the Stand recharger is plugged in.
• Press the screen to start the IHD, the screen will light up and display.
• Leave the IHD in the Stand and let the battery recharge for 1 hour.
9.3 - No Meter Readings after a flat battery
The IHD may need to be reconnected to the meter.
Return the IHD to the Stand and let the battery recharge for 1 hour.
Press the screen to start the IHD, the screen will light up and display.
Touch the Settings button in the bottom right hand corner of the Main Screen.
Enter the pin number 0000, and touch the “Display” Panel.
Touch the “Set Time” Panel.
Using the Clock Set screen set the IHD time to AEST, i.e. non-daylight saving time, by setting
Hours, Minutes, Year and Date, and press “OK”.
The IHD should commence displaying values within 30 seconds.
9.4 - IHD missing Graph Data after flat battery
The IHD will reconnect with the Meter and update the total energy consumption data but cannot
access 30 minute data to supply the missing graph data. This is an expected outcome.
Ensure IHD is returned to stand for recharging to avoid further data loss.
25
9.5 - No Meter Readings - 1
If the IHD is displaying zero values, it is likely that the wireless is disconnected.
If the IHD is displaying a “Lost Meter” message at the bottom of the Main Screen:
• Bring the IHD closer to the location of the Meter Panel.
• The “Lost Meter” message should turn off and readings re-commence.
9.6 - No Meter Readings - 2
If the IHD is displaying zero values but not displaying a “Lost Meter” message, it is likely the IHD
may need to be re-set. To fix, take the following steps:
• Turn the IHD over and insert a pin or thin nail in the reset hole (Just above the Horstmann
nameplate).
• Return the IHD to the Stand.
• Press the screen to start the IHD, the screen will light up and display.
• Touch the Settings button in the bottom right hand corner of the Main Screen.
• Enter the pin number 0000, and touch the “Display” Panel.
• Touch the “Set Time” Panel.
• Using the Clock Set screen set the IHD time to AEST, i.e. non-daylight saving time, by setting
Hours, Minutes, Year and Date, and press “OK”.
The IHD should commence displaying values within 30 seconds.
9.7 - No Meter Readings - 3
If the IHD is displaying zero values but not displaying a “Lost Meter” message or does not
commence displaying values after re-set, the meter and IHD may no longer be joined. To fix, take
the following steps:
• Check the meter for display of a solid HAN symbol on the RHS of the meter display.
• Check the IHD “Network Information” under “Settings”.
• Check for “Network Status” = “Network Up”.
If “Network Status” = “Not Joined” or Meter does not display solid HAN symbol, contact CVSC
Head Office.
26
9.8 - IHD Screen will not respond to presses
If the screen will not respond to pressing icon buttons or Panels, it is likely the IHD may need to
be re-set. To fix...:
• Turn the IHD over and insert a pin or thin nail in the reset hole (Just above the Horstmann
nameplate).
• Return the IHD to the Stand.
• Press the screen to start the IHD, the screen will light up and display.
• Touch the Settings button in the bottom right hand corner of the Main Screen.
• Enter the pin number 0000, and touch the “Display” Panel.
• Touch the “Set Time” Panel.
• Using the Clock Set screen set the IHD time to AEST, i.e. non-daylight saving time, by setting
Hours, Minutes, Year and Date, and press “OK”.
If the IHD will still not respond to presses:
Contact CVSC Head Office.
9.9 - IHD has no display and will not re-start
Try the steps above for ‘Flat Battery’ and ‘No Meter Readings’.
Try the steps above for ‘IHD will not respond to presses’.
No response?
Contact CVSC Head Office.
27
10 . FOR IHD TECHNICAL SUPPORT CONTACT CVSC Head Office
Before contacting Central Victoria- Solar City head office, please write down the details of the
failure and the results of each of the steps tried above.
Please contact CVSC Head Office during normal business hours 9am to 5pm, Monday to Friday on
(03) 5479 1900
11. FOR ENERGY PLAN PRICING & BILLING CONTACT YOUR RETAILER
For enquiries regarding your Energy Plan pricing, or Electricity billing please contact your Retailer.
12. FOR CUSTOMER COMPLAINTS CONTACT CVSC Head Office
For complaints regarding the CVSC Trial or products please Contact the Central Victoria Solar City
Head Office during normal business hours 9am to 5pm, Monday to Friday on (03) 5479 1900.
28
13. SMART METERS – OVERVIEW
The Victorian government has mandated that all manually-read electricity meters in the state be
replaced with new remotely-read interval “smart meters”. This world leading technology will
ultimately empower you to better manage your energy needs and increase retail competition.
The new smart meters will remain property of CitiPower and Powercor, as they comprise part of
the distribution network that supplies your power.
Powercor is rolling out Smart Meters, Access Points and Repeaters for the remote
communications as well as Back Office Systems to manage the data collection. While the
Meters provide a wireless connection for the In-Home Displays, IHD’s are not part of the rollout
and will be sourced from third party suppliers such as electronics stores, or the Electricity
Retailers for those customers who want them.
Smart meter infrastructure provides a new way of measuring and managing electricity
consumption. It involves two important elements:
• a meter that remotely captures half hour electricity consumption data
• a two way communication system that transmits the usage information to CitiPower and
Powercor in near real time and receives control instructions.
29
CitiPower and Powercor Australia will exchange more than 1.1 million manually read meters for
smart meters during the four year project, which began in October 2009. The meters are being
rolled out on a suburb by suburb and region by region basis.
The Powercor Website has further information on the Powercor Smart Meter Rollout.
http://www.powercor.com.au/SmartMeters/
Including details on how to read the display on the Powercor Smart Meter.
http://www.powercor.com.au/docs/pdf/Smart%20Meters/Secure%20Reference%20
Brochure%2005.10.pdf
http://www.powercor.com.au/docs/pdf/
Smart%20Meters/L&G%20Reference%20Brochure%2002.09.pdf
Further information on the Victorian Government Smart Meter program can be found on the
Department of Primary Industries website:
http://new.dpi.vic.gov.au/smart-meters
30