1
USER GUIDE
Copyright NETASQ 2009
engde_nrmonitor-v8.0.3engde_nrmonitor-v8.0.3
Page 1 of 104
USER GUIDE
NETASQ REALTIME MONITOR
V. 8.0.3
USER MANUAL
Date
November 2008
V1.0
Version
Author
NETASQ
January 2009
V1.1
NETASQ
October 2009
V1.2
NETASQ
Details
Update following the
release of software
version 8.0
Backfitting the Common
Criteria
Update following the
release of software
version 8.0.3
Reference: engde_nrmonitor-v8.0.3
Copyright NETASQ 2009
engde_nrmonitor-v8.0.3engde_nrmonitor-v8.0.3
Page 2 of 104
USER GUIDE
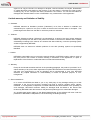
Copyright © NETASQ 2008. All rights reserved.
Any reproduction, adaptation or translation of this current document without prior written permission is
prohibited, except where expressly allowed by copyright laws.
NETASQ applies a method of continual development and as such reserves the right to modify and improve
any product described in the document without prior notice.
Under no circumstances shall NETASQ be held liable for any loss of data or revenue, or any special damage
or incident, resulting from or indirectly caused by the use of the product and its associated documentation.
The contents of this document relate to the developments in NETASQ’s technology at the time of its writing.
With the exception of the mandatory applicable laws, no guarantee shall be made in any form whatsoever,
expressly or implied, including but not limited to implied warranties as to the merchantability or fitness for a
particular purpose, as to the accuracy, reliability or the contents of the document. NETASQ reserves the
right to revise this document, to remove sections or to remove this whole document at any moment without
prior notice.
To ensure the availability of products, which may vary according to your geographical locations, contact your
nearest NETASQ distributor.
Products concerned
U30, U70, U120, U250, U450, U1100, U1500 and U6000
Copyright NETASQ 2009
engde_nrmonitor-v8.0.3engde_nrmonitor-v8.0.3
Page 3 / 104
USER GUIDE: CONTENTS
CONTENTS
CONTENTS
4 FOREWORD
7 1. INTRODUCTION
10 1.1 BASIC PRINCIPLES
1.1.1 WHO SHOULD READ THIS USER GUIDE?
1.1.2 TYPOGRAPHICAL CONVENTIONS
1.1.3 VOCABULARY USED IN THIS MANUAL
1.1.4 GETTING HELP
1.1.5 INTRODUCTION TO NETASQ REALTIME MONITOR
1.2 CONNECTION
1.2.1 ACCESS
1.2.2 CONNECTION
1.2.3 ADDRESS BOOK
10 10 10 12 12 12 13 13 14 15 2. GETTING FAMILIAR WITH NETASQ REAL-TIME MONITOR
19 2.1 PRESENTATION OF THE INTERFACE
2.1.1 MAIN WINDOW
2.1.2 DESCRIPTION OF ICON
2.1.3 MENUS
2.1.4 MENU DIRECTORY
2.1.5 RESULT DISPLAY ZONE
2.1.6 STATUS BAR
2.1.7 BUTTON BAR
2.1.8 SEARCH ENGINE
2.2 INTRODUCTION TO MENUS
2.2.1 FILE
2.2.2 WINDOWS
2.2.3 APPLICATIONS
2.2.4 ? (HELP)
2.3 APPLICATION SETTINGS
2.3.1 STARTUP BEHAVIOR
2.3.2 EXTERNAL TOOLS
2.3.3 REPORT
2.3.4 ADDRESS BOOK
2.3.5 MISCELLANEOUS
2.4 DEFAULT MONITORING SETTINGS
2.4.1 UPDATES
2.4.2 MEMORY
2.4.3 MISCELLANEOUS
19 19 20 20 21 21 31 31 32 33 33 33 34 34 34 34 35 36 38 38 39 39 40 41 3. INFORMATION ON FIREWALLS
42 3.1 OVERVIEW
3.1.1 INTRODUCTION
3.1.2 OVERVIEW OF INFORMATION ON VULNERABILITIES
3.1.3 LIST OF FIREWALLS
42 42 43 43 Copyright NETASQ 2009
engde_nrmonitor-v8.0.3engde_nrmonitor-v8.0.3
Page 4 of 104
USER GUIDE: CONTENTS
3.1.4 CONNECTION LOGS
3.2 DASHBOARD
3.2.1 INTRODUCTION
3.2.2 SELECTING A PRODUCT
3.2.3 SYSTEM INFORMATION
3.2.4 MEMORY
3.2.5 CPU
3.2.6 HARDWARE
3.2.7 ACTIVE NETWORK POLICIES
3.2.8 ALARMS
3.2.9 VULNERABILITIES
3.2.10 VPN TUNNELS
3.2.11 ACTIVE UPDATE
3.2.12 LOGS
3.2.13 SERVICES
3.2.14 INTERFACES
3.2.15 TOP 5 INTERFACES FOR INCOMING THROUGHPUT
3.2.16 TOP 5 INTERFACES FOR OUTGOING THROUGHPUT
3.2.17 TOP 5 HOSTS FOR INCOMING THROUGHPUT
3.2.18 TOP 5 HOSTS FOR OUTGOING THROUGHPUT
44 45 45 46 46 47 47 47 48 48 49 49 49 49 49 49 49 50 50 50 4. REAL-TIME INFORMATION
51 4.1 ALARMS
4.1.1 “ALARMS” VIEW
4.2 SEISMO
4.2.1 INTRODUCTION
4.2.2 VULNERABILITIES TAB
4.2.3 APPLICATION TAB
4.2.4 EVENTS TAB
4.3 HOSTS
4.3.1 “HOST” VIEW
4.3.2 “VULNERABILITIES” VIEW
4.3.3 “APPLICATIONS” VIEW
4.3.4 “EVENTS” VIEW
4.3.5 “CONNECTIONS” VIEW
4.3.6 “ALARMS” VIEW
4.4 INTERFACES
4.4.1 INTRODUCTION
4.4.2 LEGEND VIEW (OR TABULAR VIEW OF INTERFACES)
4.4.3 “DETAILS” VIEW
4.4.4 “BANDWIDTH” TAB
4.4.5 “CONNECTIONS” TAB
4.4.6 “THROUGHPUT” TAB
4.5 QUALITY OF SERVICE (QOS)
4.6 USERS
4.6.1 INTRODUCTION
4.7 QUARANTINE – ASQ BYPASS
4.7.1 “QUARANTINE” VIEW
4.7.2 “ASQ BYPASS” VIEW
51 51 52 52 54 56 58 60 61 62 63 63 64 66 67 67 69 70 70 71 72 73 74 74 75 76 76 5. NETWORK ACTIVITY
77 5.1 VPN TUNNELS
5.2 ACTIVE UPDATE
5.3 SERVICES
5.4 HARDWARE
5.4.1 HIGH AVAILABILITY
5.4.2 ENCRYPTION CARD
5.4.3 RAID
77 78 80 81 81 81 81 Copyright NETASQ 2009
engde_nrmonitor-v8.0.3engde_nrmonitor-v8.0.3
Page 5 / 104
USER GUIDE: CONTENTS
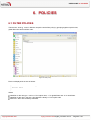
6. POLICIES
82 6.1 FILTER POLICIES
6.2 VPN POLICY
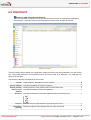
82 83 7. LOGS
85 7.1 STATUS OF USE
7.2 LOG TYPES
7.2.1 TRAFFIC
7.2.2 FILTERS
7.2.3 VPN
7.2.4 SYSTEM
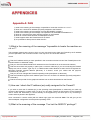
85 86 86 87 88 89 APPENDICES
90 7.3 7.4 7.5 7.6 7.7 90 92 97 98 98 APPENDIX A: FAQ
APPENDIX C: NETASQ LOG FILES
APPENDIX D: SESSION AND USER PRIVILEGES
APPENDIX E: SA STATES
APPENDIX F: SORT CRITERIA
103 GLOSSARY
Copyright NETASQ 2009
engde_nrmonitor-v8.0.3engde_nrmonitor-v8.0.3
Page 6 / 104
USER GUIDE: FOREWORD
FOREWORD
Copyright
© Copyright NETASQ 2007. All rights reserved. Under copyright law, any form of reproduction
whatsoever of this user manual without NETASQ's prior written approval is prohibited. NETASQ
rejects all liability arising from the use of the information contained in these works.
Liability
This manual has undergone several revisions to ensure that the information in it is as accurate as
possible. The descriptions and procedures herein are correct where NETASQ firewalls are
concerned. NETASQ rejects all liability directly or indirectly caused by errors or omissions in the
manual as well as for inconsistencies between the product and the manual.
Notice
WEEE Directive
All NETASQ products that are subject to the WEEE directive will be marked with the mandated
"crossed-out wheeled bin" symbol (as shown above) for items shipped on or after August 13,
2005. This symbol means that the product meets the requirements laid down by the WEEE
directive with regards to the destruction and reuse of waste electrical and electronic equipment.
For further details, please refer
http://www.netasq.com/recycling.html
to
NETASQ's
website
at
this
address:
Licence Agreement
Introduction
The information contained in this document may be changed at any time without prior notification.
Despite the care taken in preparing this document, it may contain some errors. Please do not
hesitate to contact NETASQ if you notice any.
NETASQ will not be held responsible for any error in this document or for any resulting
consequence.
Acceptance of terms
By opening the product wrapping or by installing the administration software you will be agreeing to
be bound by all the terms and restrictions of this License Agreement.
License
NETASQ hereby grants, and you accept, a non-exclusive, non-transferable license only to use the
object code of the Product. You may not copy the software and any documentation associated with
the Product, in whole or in part. You acknowledge that the source code of the Product, and the
concepts and ideas incorporated by this Product, are valuable intellectual property of NETASQ. You
Copyright NETASQ 2009
engde_nrmonitor-v8.0.3engde_nrmonitor-v8.0.3
Page 7 / 104
USER GUIDE: FOREWORD
agree not to copy the Product, nor attempt to decipher, reverse translate, de-compile, disassemble
or create derivative works based on the Product or any part thereof, or develop any other product
containing any of the concepts and ideas contained in the Product. You will be held liable for
damages with interests therein in favor of NETASQ in any contravention of this agreement.
Limited warranty and limitation of liability
a - Hardware
NETASQ warrants its Hardware products ("Hardware") to be free of defects in materials and
workmanship for a period of one year, in effect at the time the Purchaser order is accepted. This
period begins with effect from the date on which the product is activated.
b - Software
NETASQ Software products ("Software") are warranted for a period of 90 days (unless otherwise
stated at purchase) from the date of the product’s activation to be free from defects and to operate
substantially according to the manual, as it exists at the date of delivery, under the operating system
versions supported by NETASQ.
NETASQ does not warrant its software products for use with operating systems not specifically
identified.
c - Default
NETASQ’s entire liability and your exclusive remedy shall be, at NETASQ’s option, either a return of
the price paid for this License or Product resulting in termination of the agreement, or repair or
replacement of the Product or media that does not meet this limited warranty
d - Warranty
Except for the limited warranties set forth in the preceding paragraph, this product is provided "as is"
without warranty of any kind, either expressed or implied. NETASQ does not warrant that the product
will meet your requirements or that its operation will be uninterrupted or error free. NETASQ
disclaims any implied warranties or merchantability or fitness for particular purpose, or noninfringement.
e - Recommendations
In no event will NETASQ be liable to you or any third party for any damages arising out of this
agreement or the use of the product, including lost profit or savings, whether actual, indirect,
incidental, or consequential, irrespective of whether NETASQ has been advised of the possibility of
such damages. NETASQ’s maximum liability for damages shall be limited to the license fees
received by NETASQ under this license for the particular product(s) which caused the damages.
Any possible legal action relating to the alleged defectiveness of the software will come under the
jurisdiction of NETASQ’s headquarters, French law being the binding authority.
Copyright NETASQ 2009
engde_nrmonitor-v8.0.3engde_nrmonitor-v8.0.3
Page 8 / 104
USER GUIDE: FOREWORD
WARNING
1) Certain NETASQ products enable gathering and analyzing logs. This log information allows the
activity of internal users to be tracked and may provide nominative information. The legislation in
force in the destination country may impose the application of certain measures (namely
administrative declarations, for example) when individuals are subject to such monitoring.
Ensure that these possible measures have been applied before any use of the product.
2) NETASQ products may provide cryptographic mechanisms which are restricted or forbidden by
the legislation in force in the destination country. Despite the control made by NETASQ before
exportation, ensure that the legislation in force allows you to use these cryptographic
mechanisms before using NETASQ products.
3) NETASQ disclaims all liability for any use of the product deemed illegal in the destination
country.
Copyright NETASQ 2009
engde_nrmonitor-v8.0.3engde_nrmonitor-v8.0.3
Page 9 / 104
USER GUIDE: 1. INTRODUCTION
1. INTRODUCTION
1.1 BASIC PRINCIPLES
1.1.1 Who should read this user guide?
This manual is intended for network administrators or for users with the minimum knowledge of IP.
In order to configure your NETASQ Firewall in the most efficient manner, you must be familiar with these
protocols and their specific features:
ICMP (Internet Control Message Protocol).
IP (Internet Protocol).
TCP (Transmission Control Protocol).
UDP (User Datagram Protocol).
Knowledge of the general operation of the major TCP/IP services is also preferable:
HTTP
FTP
Mail systems (SMTP, POP3, IMAP).
Telnet
DNS
DHCP
SNMP
NTP
If you do not possess this knowledge, don't worry: any general book on TCP/IP can provide you with the
required elements.
The better your knowledge of TCP/IP, the more efficient will be your filter rules and the greater your IP
security.
1.1.2 Typographical conventions
1.1.2.1 Abbreviations
For the sake of clarity, the usual abbreviations have been kept. For example, VPN (Virtual Private Network).
Other acronyms will be defined in the Glossary.
Copyright NETASQ 2009
engde_nrmonitor-v8.0.3engde_nrmonitor-v8.0.3
Page 10 / 104
1.1.2.2 Display
Names of windows, menus, sub-menus, buttons and options in the application will be represented in the
following fonts:
Menu SEISMO
1.1.2.3 Indications
Indications in this manual provide important information and are intended to attract your attention. Among
these, you will find:
NOTE/REMARKS
These messages provide a more detailed explanation on a particular point.
WARNING
These messages warn you about the risks involved in performing a certain manipulation or about
how not to use your appliance.
TIP
This message gives you ingenious ideas on using the options on your product.
DEFINITION
Describes technical terms relating to NETASQ or networking. These terms will also be covered in
the glossary.
1.1.2.4 Messages
Messages that appear in the application are indicated in double quotes.
Example: "Delete this entry?"
1.1.2.5 Examples
Example
This allows you to have an example of a procedure explained earlier.
1.1.2.6 Command lines
Command lines
Indicates a command line (for example, an entry in the DOS command window).
1.1.2.7 Reminders
Reminders are indicated as follows:
Reminder.
Copyright NETASQ 2009
engde_nrmonitor-v8.0.3engde_nrmonitor-v8.0.3
Page 11 / 104
1.1.2.8 Access to features
Access paths to features are indicated as follows:
Access the menu File\Options.
1.1.3 Vocabulary used in this manual
Appliance
Dialup
UTM Fxx
Firewall
Intrusion
prevention
Slot
Logs
Refers to the security device or firewall appliance developed and designed by
NETASQ.
The terms “appliance” and “security device” refer to the same thing in this manual.
Interface on which the modem is connected.
Refers to the range of NETASQ products. Other terms also used: NETASQ Fxx,
Fxx appliance.
NETASQ UTM product
The term UTM (Unified Threat Management) can also be used.
(Or policy). Configuration, NAT or filter slots or policies.
Records of user activity on the network.
1.1.4 Getting help
To obtain help regarding your product and the different applications in it:
Website: www.netasq.com. Your secure-access area allows you to access a wide range of documentation
and other information.
User manuals: NETASQ UNIFIED MANAGER, NETASQ REAL-TIME and NETASQ EVENT
REPORTER.
1.1.5 Introduction to NETASQ REALTIME MONITOR
NETASQ REAL-TIME MONITOR allows you to visualize your Firewall’s activity in real time and provides the
information below:
Use of the Firewall’s internal resources (memory, CPU, etc.),
List of raised alarms when vulnerabilities are detected
List of connected hosts and users,
Real-time alarms,
Number of connections, bandwidth use, throughput,
Information on the status of interfaces and VPN tunnels,
Last logs generated,
Use of disk space allocated to logs.
With this tool, you can connect to several Firewalls and supervise all of them.
Copyright NETASQ 2009
engde_nrmonitor-v8.0.3engde_nrmonitor-v8.0.3
Page 12 / 104
NETASQ REAL-TIME MONITOR provides a simple display of connections transiting via the Firewall, along
with any alarms it has generated.
Monitor can be shut down by clicking on the cross in the top right corner, but this does not stop it from
operating. Clicking on the Monitor icon in the taskbar restores it.
By default, Monitor can only be run on a machine connected to the internal network and must be running
permanently in order to avoid missing any alarms. You can use it remotely (through the internet) but you
would have to explicitly authorize the service (Firewall_srv) in the filter rules.
1.2 CONNECTION
1.2.1 Access
There are 2 ways to launch the NETASQ REAL-TIME MONITOR application:
Via the shortcut Applications\Launch the NETASQ REAL-TIME-MONITOR in the menu bar on
other applications in the Administration Suite.
Via the menu Start\Programs\NETASQ\Administration
MONITOR.
Suite
8.0\NETASQ
REAL-TIME
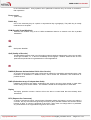
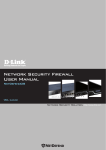
If this is your very first time connecting to your product, a message will prompt you to confirm the serial
number (found on the underside of the appliance).
The Overview window will open upon connection:
Figure 1: Overview
Copyright NETASQ 2009
engde_nrmonitor-v8.0.3engde_nrmonitor-v8.0.3
Page 13 / 104
1.2.2 Connection
NETASQ REAL-TIME MONITOR is opened differently depending on the option chosen in the tab Startup
behavior in Application settings (cf. Part 2/Chapter 3: Startup behavior).
The possible options are:
Direct connection
Connect to automatic connection data sources
None
1.2.2.1 irect connection to a NETASQ UTM Firewall
Direct connection allows you to enter connection information for a specific firewall.
To make a direct connection, go to the menu File\Direct connection. Or, if Monitor has been
configured to connect directly at startup, the following window will appear:
Figure 2: Direct connection
NOTE
For more information regarding connection, please refer to Part 2/Chapter3: Startup behavior.
Indicate the firewall’s IP address in the Address field.
Enter the administrator login in the User field.
Enter the administrator password in the Password field.
REMARK
Select the option Read only to connect to the firewall in read-only mode.
Click on the Connect button. The main window will appear.
1.2.2.2 Opening the address book
Go to the menu File\Address book to open the address book. Or, if Monitor has been configured to
open the address book at startup, the Address book window will appear:
NOTE
For more information regarding the address book, please refer to Part1/Chapter2: Address book.
Copyright NETASQ 2009
engde_nrmonitor-v8.0.3engde_nrmonitor-v8.0.3
Page 14 / 104
1.2.2.3 Connecting automatically to the data source
If this option has been selected in Startup behavior\Application settings, Monitor will directly
open the "Overview" main window and the application will automatically connect to the existing firewalls. (cf.
for more information regarding connection, please refer to the section Part 2/Chapter 3: Startup behavior.)
1.2.2.4 None
If this option has been selected in Startup behavior\ Application settings, Monitor will directly
open the "Overview" main window but no application will be connected to the firewall. Only the Overview
menu will be enabled. The other menus in the directory will be grayed out. (cf. for more information regarding
connection, please refer to Part 2/Chapter 3: Startup behavior.)
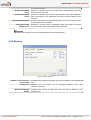
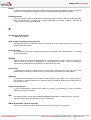
1.2.3 Address book
The address book can be accessed from the menu File\Address book.
REMARK
The address book can also be opened automatically upon the startup of the application if you have
selected the option in Application settings/Startup behavior. (See Part 2/Chapter 3:
Startup behavior).
Figure 3: Address book
It is possible to store connection data on your different Firewalls. This information is stored on the same
client workstation on which the interface has been installed. It may be encrypted if you check the option
This address book is encrypted. In this case, you will be asked to enter an encryption key. The
information that is stored for each firewall includes the IP address, login name, connection password and the
serial number of the Firewall to which you wish to connect. This password belongs to an authorized user.
By specifying a serial number, you will protect yourself from “man-in-the-middle” attacks. If you attempt a
connection on an appliance that does not meet the “serial number” criterion indicated in the address book,
the monitor will inform you that you are attempting to connect to an unknown appliance. You will also be
asked if you wish to add this serial number to the list of authorized appliances. Verify the information
displayed in the monitor before accepting such a request.
Copyright NETASQ 2009
engde_nrmonitor-v8.0.3engde_nrmonitor-v8.0.3
Page 15 / 104
Once this information has been entered, you may save it using the Save button. To open a session on one
of the Firewalls from the address book, click on its name then on the OK button, or simply double click on the
name of the Firewall.
WARNING
If you modify the This address book is encrypted option, the address book has to be saved
once more to apply the changes
Check the option Display passwords to check the passwords used for each Firewall saved in the address
book (passwords are displayed in plaintext).
1.2.3.1 Adding an address
Click on the Add button to add an address to the address book. Other information to supply:
Name
The name of the firewall
Address
IP address of the firewall
Login
The administrator account.
Password
Administrator password
Confirm
Confirms the password
Description
Description or comments regarding the firewall.
1.2.3.2 Modifying an address
The procedure for modifying an address in the address book is as follows:
Select the firewall to be modified.
Click on the Modify button. The following window will appear:
Figure 4: Modifying an address
Make the necessary changes.
Click on OK to confirm changes.
1.2.3.3 Deleting an address
Copyright NETASQ 2009
engde_nrmonitor-v8.0.3engde_nrmonitor-v8.0.3
Page 16 / 104
The procedure for deleting a firewall from the address book is as follows:
Select the firewall to delete.
Click on the Delete button. The following message will appear:
"Confirm deletion of these items?"
Click on Yes or No to confirm deletion or cancel.
1.2.3.4 Importing an address book
The procedure for importing an existing address book is as follows:
Click on the Import button. The following window will appear:
Figure 5: Importing the address book
Select the file to import.
REMARK
The file to import should be in .dat format.
Click on Open.
1.2.3.5 Exporting an address book
The procedure for exporting an existing address book is as follows:
Click on Export. The following window will appear:
Copyright NETASQ 2009
engde_nrmonitor-v8.0.3engde_nrmonitor-v8.0.3
Page 17 / 104
Figure 6: Exporting the address book
Select the file to export.
REMARK
The file to export should be in .dat format.
Click on Save.
Copyright NETASQ 2009
engde_nrmonitor-v8.0.3engde_nrmonitor-v8.0.3
Page 18 / 104
USER GUIDE: 2. GETTING FAMILIAR
2. GETTING FAMILIAR WITH NETASQ
REAL-TIME MONITOR
2.1 PRESENTATION OF THE INTERFACE
2.1.1 Main window
From this window, you can open several windows, each connected to different firewalls.
Figure 7: Overview
Once Monitor is connected, it will open a welcome window (Overview Menu) which will display various
types of information on the firewall’s activity.
It consists of five parts:
A menu bar
A horizontal bar containing icons relating to connection and a search zone
A vertical bar containing a menu directory allowing NETASQ REAL-TIME MONITOR options to be viewed
and configured
A result display zone
A status bar
Copyright NETASQ 2009
engde_nrmonitor-v8.0.3engde_nrmonitor-v8.0.3
Page 19 / 104
USER GUIDE: 2. GETTING FAMILIAR
REMARK
The other windows in the menu directory may contain the following buttons:
Refresh
Show/Hide help
Firewall
Duplicate
2.1.2 Description of icon
Connects via the address book.
Connects to a firewall
Disconnects or deletes a connection.
Connects to the selected firewall.
Disconnects from the selected firewall.
Edits the address book address book.
Displays the dashboard of the selected firewall.
Memory.
List of connected hosts (IP address, interface to which the user is connected, amount
of data transferred, number of connections, throughput used...).
List of authenticated users (user name, IP, remaining time on authentication period...).
List of alarms raised (major and minor).
List of active VPN tunnels.
List of active services.
Status of the Active Update module.
Statistics.
Seismo…
2.1.3 Menus
The main window contains the following menus: File, Windows, Applications, and ? (Help).
File
Windows
Applications
? (Help)
Copyright NETASQ 2009
Allows you to connect to Firewalls and to access the application’s general options.
Allows you to organize the connection windows on the screen.
Enables you to execute the two other applications making up the NETASQ Administration
Suite: NETASQ UNIFIED MANAGER et NETASQ EVENT REPORTER.
Allows you to access the relevant Help file, and to know which version the monitor runs
on.
engde_nrmonitor-v8.0.3engde_nrmonitor-v8.0.3
Page 20 / 104
USER GUIDE: 2. GETTING FAMILIAR
2.1.4 Menu directory
Overview
Console
Dashboard
Alarms
This window lists the firewalls. Monitor opens in this window once the connection
has been established...
When the option Enable is selected in the menu Application
parameters\Miscellaneous in the console zone, you will be able to access
appliances in console mode (CLI commands). When this window is validated, a
Console menu will be added under the Overview menu directory.
This window gives you a summary of the main information relating to your product’s
activity.
This window lists the alarms that the firewall has raised.
Hosts
This window allows you to view alarms being raised and to get help in the event of
vulnerability.
List of hosts on your network.
Interfaces
This window allows you to get statistics on bandwidth, connections and throughput.
SEISMO
Quality of service
Users
ASQ Bypass
Quarantine
VPN Tunnels
Active Update
Services
Hardware
Filters
VPN
Logs
This window allows you to get information on users and session privileges on
authentication.
This window displays the list of dynamically quarantined hosts.
This window displays static information on the operation of VPN tunnels and on the
source and destination.
This window sets out the status of Active Update on the firewall for each type of
update available.
This window shows the active and inactive services on the firewall and how long
they have been active/inactive.
This window shows information on the initialization of high availability and RAID.
This window displays the active filter policy by grouping the implicit and local rules.
This window allows viewing the configuration of different VPN tunnel policies.
This window allows viewing in real time the size of the log file.
The sub-menu Traffic provides information on traffic logs.
The sub-menu Filter provides information on filter rules.
The sub-menu VPN provides information on VPN logs.
The sub-menu System provides system information.
2.1.5 Result display zone
Data and options from the selected menus in the horizontal bar appear in this zone. These windows will be
explained in further detail in the corresponding sections.
2.1.5.1 Contextual menu on columns
Columns can be hidden or shown.
Columns can be resized according to their contents (option Adjust columns to fit contents).
Furthermore, the administrator can sort the table by clicking on the column by which he wishes to sort.
Copyright NETASQ 2009
engde_nrmonitor-v8.0.3engde_nrmonitor-v8.0.3
Page 21 / 104
USER GUIDE: 2. GETTING FAMILIAR
2.1.5.2 Contextual menu on lines
Right-clicking against a line will display a contextual menu that allows various operations. The options
offered vary according to the table.
2.1.5.2.1
Overview
3 contextual menus can be opened in this window:
When right-clicking against a firewall
When right-clicking against an empty zone in the list of firewalls
When right-clicking against in the “Connection logs” view
2.1.5.2.1.1
Show dashboard…
Generate a web report…
Disconnect
Delete this firewall from
the list of connections…
Add a new firewall to the
list of connections and
connect to it
Add a firewall from the
address book to the list of
connections
Add this firewall to the
address book
Edit the address book
2.1.5.2.1.2
Add a new firewall to the
list of connections and
connect to it
Add a firewall from the
address book to the list of
connections
Edit the address book
Copyright NETASQ 2009
Contextual menu relating to a firewall
Opens the Dashboard menu of the selected appliance.
Clicking on this button will generate a report in HTML. This report will
contain the following information at any given moment: system
information, memory, connected users, services, Active Update status,
bandwidth statistics, connection statistics, vulnerabilities, number of
hosts, authenticated users, number of major and minor alarms,
quarantine, the number of VPN tunnels, filter rules and configured IPSec
tunnels.
Allows disconnecting from the selected appliance.
Enables disconnecting and deleting the entry that corresponds to this
connection.
Displays the direct connection window to enable connecting to a firewall.
Opens the address book window to allow the selection of a registered
appliance.
Opens a window that will allow saving the selected firewall in the
address book.
Opens the address book window to enable editing.
Contextual menu from right-clicking against an empty zone
Displays the direct connection window to enable connecting to a firewall.
Opens the address book window to allow the selection of a registered
appliance.
Opens the address book window to enable editing.
engde_nrmonitor-v8.0.3engde_nrmonitor-v8.0.3
Page 22 / 104
USER GUIDE: 2. GETTING FAMILIAR
2.1.5.2.1.3
Copy
Copy the link
Select all
Delete logs
2.1.5.2.2
Contextual menu relating to connection logs
Copies the selected log line(s).
Copies the location of the link.
Selects all the log lines.
Deletes all log lines.
Alarms
Right-clicking against a line containing an alarm will bring you to the contextual menu that will allow you to:
Filter by these criteria
View source host…
View destination host…
Send source to
quarantine
View packet...
Empty alarms
Copy to the clipboard
This option allows restricting the list of results to the selected field. For
example, if the data is filtered by the priority “Major”, the administrator will
get all the lines containing “Major”.
Indicates the name of the source host. If this option is selected, the
Hosts menu will open.
Indicates the name of the destination host.
Allows quarantining the source host for a fixed period of 1 minute, 5
minutes, 30 minutes or 3 hours.
Allows opening the tool that will allow viewing malicious packets.
Purges the list of displayed alarms.
Copies the selected line to the clipboard.
Figure 8: Quarantining the source
2.1.5.2.3
SEISMO
In the Vulnerability tab, 3 contextual menus can be opened:
Copyright NETASQ 2009
engde_nrmonitor-v8.0.3engde_nrmonitor-v8.0.3
Page 23 / 104
USER GUIDE: 2. GETTING FAMILIAR
When right-clicking against a line detailing a vulnerability
When right-clicking against a line detailing a host
When right-clicking against the help zone
2.1.5.2.3.1
Contextual menu relating to a vulnerability
Right-clicking against a line containing vulnerability will bring you to the contextual menu that will allow you
to:
Filter by these criteria: This option allows restricting the list of results to the selected field. For
example, if the data is filtered by the priority “Major”, the administrator will get all the lines containing “Major”.
Copy to the clipboard: Copies the selected line to the clipboard.
2.1.5.2.3.2
Contextual menu relating to a host
Right-clicking against a line containing a host will bring you to the contextual menu that will allow you to:
Filter by these criteria: This option allows restricting the list of results to the selected field. For
example, if the data is filtered by the priority “Major”, the administrator will get all the lines containing “Major”.
View the host: The Hosts menu directory will open to display additional information on the detected
host. During “pre-filtering”, the host concerned will be selected. The data will be filtered according to the
hostname if available, or by its address.
Copy to the clipboard: Copies the selected line to the clipboard. Data can be copied in two
different ways:
1) A single line is selected: in this case, this line as well as the lines of details will be copied.
2) Several lines are selected: in this case, only these lines will be copied to the clipboard.
2.1.5.2.3.3
Contextual menu in the help zone
Right-clicking against a help zone will bring you to the contextual menu that will allow you to:
Copy: Allows copying the help text in order to retrieve it later.
Copy the link: Allows copying the hypertext link.
Select all: Allows selecting all the help text.
In the Application tab, 2 contextual menus can be opened:
When right-clicking against a line detailing an application
When right-clicking against a line detailing a host
2.1.5.2.3.4
Contextual menu for a line containing an application
Right-clicking against a line containing an application will bring you to the contextual menu that will allow you
to:
Filter by these criteria: This option allows restricting the list of results to the selected field. For
example, if the data is filtered by the priority “Major”, the administrator will get all the lines containing “Major”.
Copy to the clipboard: Copies the selected line to the clipboard. Data can be copied in two
different ways:
1) A single line is selected: in this case, this line as well as the lines of details will be copied.
Copyright NETASQ 2009
engde_nrmonitor-v8.0.3engde_nrmonitor-v8.0.3
Page 24 / 104
USER GUIDE: 2. GETTING FAMILIAR
2) Several lines are selected: in this case, only these lines will be copied to the clipboard.
2.1.5.2.3.5
Contextual menu for a line containing a host
Filter by these criteria: This option allows restricting the list of results to the selected field. For
example, if the data is filtered by the priority “Major”, the administrator will get all the lines containing “Major”.
Caution: this is a new filter system…
View the host: The Hosts menu directory will open to display additional information on the detected
host. During “pre-filtering”, the host concerned will be selected. The data will be filtered according to the
hostname if available, or by its address.
In the Information tab, 3 contextual menus can be opened:
When right-clicking against a line containing information
When right-clicking against a line detailing a host
When right-clicking against the help zone
2.1.5.2.3.6
Contextual menu for a line containing information
Filter by these criteria: This option allows restricting the list of results to the selected field. For
example, if the data is filtered by the priority “Major”, the administrator will get all the lines containing “Major”.
Copy to the clipboard: Copies the selected line to the clipboard. Data can be copied in two
different ways:
1) A single line is selected: in this case, this line as well as the lines of details will be copied.
2) Several lines are selected: in this case, only these lines will be copied to the clipboard.
2.1.5.2.3.7
Contextual menu for a line containing an event
Right-clicking against a line containing an event will bring you to the contextual menu that will allow you to:
Filter by these criteria: This option allows restricting the list of results to the selected field. For
example, if the data is filtered by the priority “Major”, the administrator will get all the lines containing “Major”.
View the host: The Hosts menu directory will open to display additional information on the detected
host. During “pre-filtering”, the host concerned will be selected. The data will be filtered according to the
hostname if available, or by its address.
Copy to the clipboard: Copies the selected line to the clipboard. Data can be copied in two
different ways:
1) A single line is selected: in this case, this line as well as the lines of details will be copied.
2) Several lines are selected: in this case, only these lines will be copied to the clipboard.
2.1.5.2.3.8
Contextual menu in the help zone
Right-clicking against a help zone will bring you to the contextual menu that will allow you to:
Copy: Allows copying the help text in order to retrieve it later.
Copy the link: Allows copying the hypertext link.
Select all: Allows selecting all the help text.
Copyright NETASQ 2009
engde_nrmonitor-v8.0.3engde_nrmonitor-v8.0.3
Page 25 / 104
USER GUIDE: 2. GETTING FAMILIAR
2.1.5.2.4
Hosts
Many contextual menus can be opened in this window:
When right-clicking against a host
When right-clicking against the “Vulnerabilities” tab
When right-clicking against the “Applications” tab
When right-clicking against the “Information” tab
When right-clicking against the “Connections” tab
When right-clicking against the “Alarms” tab
When right-clicking against the help zone
2.1.5.2.4.1
Contextual menu relating to a host
Filter by these criteria: This option allows restricting the list of results to the selected field. For
example, if the data is filtered by the priority “Major”, the administrator will get all the lines containing “Major”.
Delete the host from ASQ…: Enables deleting the host’s ASQ information. This may be useful
especially if a host has been hacked. The “Monitor modify” privilege is necessary. A message will appear,
asking you to confirm this action.
Reset SEISMO information…: resets SEISMO data for the selected host. The “Monitor modify”
privilege is necessary. A message will appear, asking you to confirm this action. When you perform this
reset, the host will be deleted from the SEISMO database and as well as from data counters (detected
vulnerabilities, software…).
Send to quarantine: the quarantined host will be dynamically blocked for a duration to be specified.
(This duration can either be 1 minute, 5 minutes, 30 minutes or 3 hours). The “Monitor modify” privilege is
necessary. You will not be asked to confirm this action.
Copy to the clipboard: Copies the selected line to the clipboard. Data can be copied in two
different ways:
1) A single line is selected: in this case, this line as well as the lines of details will be copied.
2) Several lines are selected: in this case, only these lines will be copied to the clipboard.
2.1.5.2.4.2
Contextual menu in the “Vulnerabilities” tab
Filter by these criteria: This option allows restricting the list of results to the selected field. For
example, if the data is filtered by the priority “Major”, the administrator will get all the lines containing “Major”.
View hosts with the same vulnerability.
Copy to the clipboard: Copies the selected line to the clipboard. Data can be copied in two
different ways:
1) A single line is selected: in this case, this line as well as the lines of details will be copied.
2) Several lines are selected: in this case, only these lines will be copied to the clipboard.
2.1.5.2.4.3
Contextual menu in the “Applications” tab
Filter by these criteria: This option allows restricting the list of results to the selected field. For
example, if the data is filtered by the priority “Major”, the administrator will get all the lines containing “Major”.
List all hosts that use this application: The SEISMO menu will display the name of the
software program concerned in pre-filtering.
List the vulnerabilities of this application: The “Vulnerabilities” detail tab will be
selected, with the name of the software program concerned displayed in pre-filtering.
Copyright NETASQ 2009
engde_nrmonitor-v8.0.3engde_nrmonitor-v8.0.3
Page 26 / 104
USER GUIDE: 2. GETTING FAMILIAR
Impose a server application: The “Monitor modify” privilege is necessary. Only server software
applications can be modified.
Copy to the clipboard: Copies the selected line to the clipboard. All the elements as well as the
root element will be added to the clipboard.
2.1.5.2.4.4
Contextual menu in the “Information” tab
Right-clicking against a line containing data will bring you to the contextual menu that will display the
following information:
Filter by these criteria: This option allows restricting the list of results to the selected field. For
example, if the data is filtered by the priority “Major”, the administrator will get all the lines containing “Major”.
List the hosts that present the same information: Allows filtering on hosts that have
similar events.
Copy to the clipboard: Copies the selected line to the clipboard. Data can be copied in two
different ways:
1) A single line is selected: in this case, this line as well as the lines of details will be copied.
2) Several lines are selected: in this case, only these lines will be copied to the clipboard.
2.1.5.2.4.5
Contextual menu in the “Connections” tab
Right-clicking against a line containing a connection will bring you to the contextual menu that will display the
following information:
Filter by these criteria: This option allows restricting the list of results to the selected field. For
example, if the data is filtered by the priority “Major”, the administrator will get all the lines containing “Major”.
Copy to the clipboard: Copies the selected line to the clipboard. Data can be copied in two
different ways:
1) A single line is selected: in this case, this line as well as the lines of details will be copied.
2) Several lines are selected: in this case, only these lines will be copied to the clipboard.
2.1.5.2.4.6
Contextual menu dans l’onglet « Alarmes »
Right-clicking against a line containing an alarm will bring you to the contextual menu that will display the
following information:
Filter by these criteria: This option allows restricting the list of results to the selected field. For
example, if the data is filtered by the priority “Major”, the administrator will get all the lines containing “Major”.
View the packet that raised the alarm: This will open the tool that will allow you to view
malicious packets.
Copy to the clipboard: Copies the selected line to the clipboard. Data can be copied in two
different ways:
1) A single line is selected: in this case, this line as well as the lines of details will be copied.
2) Several lines are selected: in this case, only these lines will be copied to the clipboard.
2.1.5.2.4.7
Contextual menu in the help zone
Right-clicking against a help zone will bring you to the contextual menu that will allow you to:
Copy: Allows copying the help text in order to retrieve it later.
Copyright NETASQ 2009
engde_nrmonitor-v8.0.3engde_nrmonitor-v8.0.3
Page 27 / 104
USER GUIDE: 2. GETTING FAMILIAR
Copy the link: Allows copying the hypertext link.
Select all: Allows selecting all the help text.
2.1.5.2.5
Interfaces
Right-clicking against a line containing an interface will bring you to the contextual menu that will allow you
to:
Filter by these criteria: This option allows restricting the list of results to the selected field. For
example, if the data is filtered by the priority “Major”, the administrator will get all the lines containing “Major”.
Display the hosts associated with this interface: This option allows displaying the list of
hosts that have the same interface.
2.1.5.2.6
Users
2 contextual menus can be opened in this window:
When right-clicking against the “users” zone
When right-clicking against an “administration sessions” zone
2.1.5.2.6.1
Contextual menu from right-clicking against the “users” zone
Filter by these criteria: This option allows restricting the list of results to the selected field. For
example, if the data is filtered by the priority “Major”, the administrator will get all the lines containing “Major”.
Delete the user from ASQ: Enables deleting the user’s ASQ information. This may be useful
especially if a user has been affected by an attack. The “Monitor modify” privilege is necessary. A message
will appear, asking you to confirm this action.
Copy to the clipboard: Copies the selected line to the clipboard. Data can be copied in two
different ways:
1) A single line is selected: in this case, this line as well as the lines of details will be copied.
2) Several lines are selected: in this case, only these lines will be copied to the clipboard.
2.1.5.2.6.2
Contextual menu from right-clicking against the “administration sessions” zone
Copy to the clipboard: Copies the selected line to the clipboard. Data can be copied in two
different ways:
1) A single line is selected: in this case, this line as well as the lines of details will be copied.
2) Several lines are selected: in this case, only these lines will be copied to the clipboard.
2.1.5.2.7
ASQ Bypass Quarantine
2 contextual menus can be opened in this window:
When right-clicking against the “Quarantine” zone
When right-clicking against an “ASQ Bypass” zone
Copyright NETASQ 2009
engde_nrmonitor-v8.0.3engde_nrmonitor-v8.0.3
Page 28 / 104
USER GUIDE: 2. GETTING FAMILIAR
2.1.5.2.7.1
Contextual menu from right-clicking against the “Quarantine” zone
Right-clicking against a line containing a quarantined host will bring you to the contextual menu that will allow
you to:
Filter by these criteria: This option allows restricting the list of results to the selected field.
For example, if the data is filtered by the priority “Major”, the administrator will get all the lines containing
“Major”.
Copy to the clipboard: Copies the selected line to the clipboard.
2.1.5.2.7.2
Contextual menu from right-clicking against the “ASQ Bypass” zone
Right-clicking against a line containing a quarantined host will bring you to the contextual menu that will allow
you to:
Filter by these criteria: This option allows restricting the list of results to the selected field.
For example, if the data is filtered by the priority “Major”, the administrator will get all the lines containing
“Major”.
Copy to the clipboard: Copies the selected line to the clipboard.
2.1.5.2.8
VPN Tunnels
Right-clicking against a line containing a VPN tunnel will bring you to the contextual menu that will allow you
to:
Filter by these criteria: This option allows restricting the list of results to the selected field.
For example, if the data is filtered by the priority “Major”, the administrator will get all the lines containing
“Major”.
View logs of outgoing SPIs: this option will allow displaying the SPIs of the negotiated outgoing
SA.
View logs of incoming SPIs: this option will allow displaying the SPIs of the negotiated incoming
SA.
View the outgoing policy…
View the incoming policy…
Reset this tunnel: the selected tunnel will be deleted, but the configuration on the firewalls will still be
active. The SAs matching the selected tunnel will be cleared; new SAs will have to be renegotiated so that
the tunnel can be used again.
Reset all tunnels: all tunnels will be deleted.
2.1.5.2.9
Active Update
Right-clicking against a line in the Active Update section will bring you to the contextual menu that will allow
you to:
Copy to the clipboard: Copies the selected line to the clipboard. Data can be copied in two
different ways:
1) A single line is selected: in this case, this line as well as the lines of details will be copied.
2) Several lines are selected: in this case, only these lines will be copied to the clipboard.
Copyright NETASQ 2009
engde_nrmonitor-v8.0.3engde_nrmonitor-v8.0.3
Page 29 / 104
USER GUIDE: 2. GETTING FAMILIAR
2.1.5.2.10 Services
Right-clicking against a line containing a service will bring you to the contextual menu that will allow you to:
Filter by these criteria: This option allows restricting the list of results to the selected field.
For example, if the data is filtered by the priority “Major”, the administrator will get all the lines containing
“Major”.
Copy to the clipboard: Copies the selected line to the clipboard. Data can be copied in two
different ways:
1) A single line is selected: in this case, this line as well as the lines of details will be copied.
2) Several lines are selected: in this case, only these lines will be copied to the clipboard.
2.1.5.2.11 VPN Policy
Right-clicking against a line containing a VPN policy will bring you to the contextual menu that will allow you
to:
Filter by these criteria: This option allows restricting the list of results to the selected field.
For example, if the data is filtered by the priority “Major”, the administrator will get all the lines containing
“Major”.
View corresponding tunnels: this will open the VPN Tunnels menu with a filter.
2.1.5.2.12 Traffic
Right-clicking against a line containing traffic will bring you to the contextual menu that will allow you to:
Filter by these criteria: This option allows restricting the list of results to the selected field.
For example, if the data is filtered by the priority “Major”, the administrator will get all the lines containing
“Major”.
Copy to the clipboard: Copies the selected line to the clipboard.
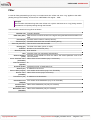
2.1.5.2.13 Filter
Right-clicking against a line containing a filter will bring you to the contextual menu that will allow you to:
Filter by these criteria: This option allows restricting the list of results to the selected field.
For example, if the data is filtered by the priority “Major”, the administrator will get all the lines containing
“Major”.
Copy to the clipboard: Copies the selected line to the clipboard.
2.1.5.2.14 VPN
Right-clicking against a line containing a VPN policy will bring you to the contextual menu that will allow you
to:
Filter by these criteria: This option allows restricting the list of results to the selected field.
For example, if the data is filtered by the priority “Major”, the administrator will get all the lines containing
“Major”.
Copy to the clipboard: Copies the selected line to the clipboard.
Copyright NETASQ 2009
engde_nrmonitor-v8.0.3engde_nrmonitor-v8.0.3
Page 30 / 104
USER GUIDE: 2. GETTING FAMILIAR
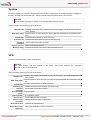
2.1.5.2.15 System
Right-clicking against a line in the System section will bring you to the contextual menu that will allow you to:
Filter by these criteria: This option allows restricting the list of results to the selected field.
For example, if the data is filtered by the priority “Major”, the administrator will get all the lines containing
“Major”.
Copy to the clipboard: Copies the selected line to the clipboard.
2.1.6 Status bar
Figure 9: Status bar
The status bar contains menus from the menu directory that may have been opened during a session. Being
able to do so is particularly useful when you are monitoring several firewalls at a time. You will be able to get
back the same information window for each firewall and thus make simultaneous comparisons.
2.1.7 Button bar
Figure 10: Button bar
This bar appears in most menus in Monitor.
2.1.7.1 Refresh
This button allows you to reinitialize the list displayed (Alarms, SEISMO, Hosts, Interfaces, Quality of
Service, Users, Quarantine, VPN Tunnels, Active Update, Services, Hardware, Filter Policy, VPN, Logs).
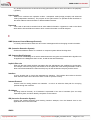
2.1.7.2 Show/Hide help
This button allows you to show or hide a help screen. Subsequently, you only need to click on the selected
line to get help when necessary.
2.1.7.3 Firewall
This drop-down menu allows you to filter the list of alarms on a selected firewall.
2.1.7.4 Duplicate
The window can be duplicated using the button found in it. This comes in handy especially when you wish to
change the target (firewall or <all>) and view.
Copyright NETASQ 2009
engde_nrmonitor-v8.0.3engde_nrmonitor-v8.0.3
Page 31 / 104
USER GUIDE: 2. GETTING FAMILIAR
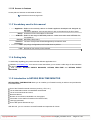
2.1.8 Search engine
Figure 11: Search engine
2.1.8.1 Search
In this zone, you will be able to conduct searches through elements in the list. Elements are filtered at the
same time search criteria are being entered.
2.1.8.2 Column
This drop-down menu presents several options that enable filtering the list. Options vary according to the
menu.
Example
The drop-down menu of the Users menu directory contains:
<All>;
Name;
Group;
Address;
Timeout.
Search criteria can be combined:
Example
In the Users menu directory, select Name in the Columns field then enter the first few letters of the
user’s name in the Search field.
For further information on sort criteria, please refer to Appendix F: Sort criteria.
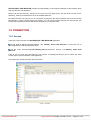
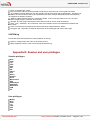
2.1.8.3 Advanced
The administrator can filter data according to several criteria. By clicking on the Advanced button, the
following advanced filter appears:
Figure 12: Advanced filter
When the option Filter by all of the following conditions, the search type will be “condition 1 AND
condition 2 AND…condition N”.
Copyright NETASQ 2009
engde_nrmonitor-v8.0.3engde_nrmonitor-v8.0.3
Page 32 / 104
USER GUIDE: 2. GETTING FAMILIAR
If the option Filter by at least one of the following conditions is selected, the search type will be
“condition 1 OR condition 2 OR…condition N”.
The first drop-down menu is linked to the Column field (seen earlier).
The second drop-down menu enables filtering according to the following criteria: “contains”, “begins with”,
“ends with”.
Search criteria can be entered in the blank field.
Several lines can be added to the criteria by clicking on the + button. Clicking on the – button removes these
lines from the criteria.
NOTE
Any condition may be deleted at any moment EXCEPT the last remaining condition. The condition
field therefore cannot be empty.
2.2 INTRODUCTION TO MENUS
2.2.1 File
The File menu concerns connections to the firewall and the application’s general options.
Address book…
Direct
connection…
Application
settings…
Default
monitoring
parameters…
Quit
Configures the firewalls’ address books.
Opens a new Firewall connection window. Enter the IP address of the Firewall
and the user password.
Determines the behavior that Monitor should adopt at startup, enables getting a
packet analyzer, defining a destination folder for reports, and the language used
in the graphical interface.
Configures memory, connection timeout and the frequency with which different
parameters will be refreshed.
Disconnects monitors and shuts down the application.
2.2.2 Windows
The Windows menu enables managing the display windows of the different connected firewalls:
Maximize
Cascade
Title
Duplicate
current
window
Overview
Copyright NETASQ 2009
Opens the selected window.
Arranges the various connection windows in cascade.
Gives a global view of the main services offered by Monitor.
Duplicates the current window according to the firewall that you had selected earlier.
IP address of connected firewall(s).
engde_nrmonitor-v8.0.3engde_nrmonitor-v8.0.3
Page 33 / 104
USER GUIDE: 2. GETTING FAMILIAR
2.2.3 Applications
The Applications menu enables connecting to other applications in the NETASQ Administration Suite.
Using the two shortcuts provided the added advantage of not having to reauthenticate on both applications.
Launch NETASQ
UNIFIED MANAGER
Launch NETASQ
EVENT REPORTER
Enables opening the NETASQ firewall configuration software.
Enables opening the NETASQ EVENT REPORTER module from the
Administration Suite.
2.2.4 ? (Help)
Help
About…
Opens a page that accesses your secure-access area, to allow you to obtain
documentation.
Provides information on the monitor in use (version number, credits).
2.3 APPLICATION SETTINGS
Certain parameters can be configured in the NETASQ REAL-TIME MONITOR application.
Select the menu File\Application settings...: the parameters window will appear.
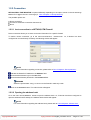
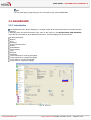
2.3.1 Startup behavior
This tab offers the different options that enable configuring the application’s behavior at startup.
Copyright NETASQ 2009
engde_nrmonitor-v8.0.3engde_nrmonitor-v8.0.3
Page 34 / 104
USER GUIDE: 2. GETTING FAMILIAR
Figure 13: Behavior at startup
Direct connection
Connect
automatically to
data sources
None
If this option is selected, the direct connection window will open when Monitor starts
up. It will enable you to enter the IP address of the desired firewall and the user
password.
If this option is selected, the connection will be established automatically on
different firewalls in the address book.
The Overview window will open but Monitor will not connect to any firewall.
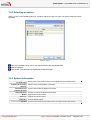
2.3.2 External tools
Figure 14: Parameters – External tools
Copyright NETASQ 2009
engde_nrmonitor-v8.0.3engde_nrmonitor-v8.0.3
Page 35 / 104
USER GUIDE: 2. GETTING FAMILIAR
Packet analyzer
Path
Parameters
When an alarm is triggered on a NETASQ Firewall, the packet responsible for
setting off the alarm can be viewed. In order to do this, you need a packet viewing
tool like Ethereal or Packetyzer. Specify the selected tool in the field “Packet
analyzer”, which the Monitor will use to display malicious packets.
Indicates the location of the directory containing the application that allows
analyzing packets.
The parameter “$packet_file$” can be added to the packet analyzer.
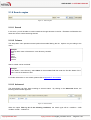
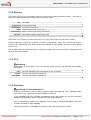
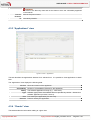
2.3.3 Report
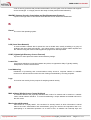
Figure 15: Parameters – Report
Export directory
Enables selecting the destination folder for the report.
The Reset button allows you to reset the directory for storing reports.
REMARK
The report can be generated by right-clicking on a line in the Overview menu and by selecting the
option Generate a web report...
The report contains the following information:
Copyright NETASQ 2009
engde_nrmonitor-v8.0.3engde_nrmonitor-v8.0.3
Page 36 / 104
USER GUIDE: 2. GETTING FAMILIAR
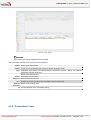
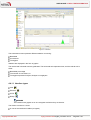
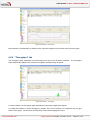
Figure 16: Synthesis report
It displays information regarding the firewall for which you intended to generate a report. By clicking on a link
in the list, the information will be displayed in table or graph form.
In the example below, information on memory is displayed.
Figure 17: Memory information
Copyright NETASQ 2009
engde_nrmonitor-v8.0.3engde_nrmonitor-v8.0.3
Page 37 / 104
USER GUIDE: 2. GETTING FAMILIAR
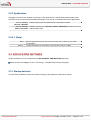
2.3.4 Address book
Figure 18: Parameters – Address book
The NETASQ UNIFIED MANAGER, NETASQ REAL-TIME MONITOR and NETASQ EVENT REPORTER
applications use the same address book and therefore the same address book file.
To retrieve a .gap file (NETASQ project file), simply click on “Browse”.
2.3.5 Miscellaneous
Figure 19: Parameters – Miscellaneous
Copyright NETASQ 2009
engde_nrmonitor-v8.0.3engde_nrmonitor-v8.0.3
Page 38 / 104
USER GUIDE: 2. GETTING FAMILIAR
Language
Splash screen
Console
Minimize in
systray instead of
closing
application
You can select a language for the interface's menus. The automatic selection will
choose the language installed on the PC's Windows OS. After a language selection,
the Firewall Monitor must be restarted in order to apply the change.
If you select this option, the first window that appears on startup will contain the
name, logo, version and loading status of the software. If it is not selected, the start
screen will no longer be displayed.
If the option Enable is selected, you will be able to access appliances in console
mode (CLI commands). When this window is validated, a Console menu will be
added under the Overview menu directory.
If this option is selected, the application will be minimized in Systray instead of
being shut down.
2.4 DEFAULT MONITORING SETTINGS
This menu enables configuring when all information contained in Monitor will be refreshed. You can define
how long the different logs (in number of lines) and datagrams (in minutes) will be displayed
The default parameters for monitoring can be accessed from the menu File\Default monitoring
settings.
2.4.1 Updates
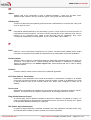
Figure 20: Monitor – Updates
Alarm update period
Graph data update period
Copyright NETASQ 2009
Specifies in seconds when the list of detected alarms will be refreshed.
Specifies in seconds when graphs (Statistics, Interfaces, QoS and VPN
engde_nrmonitor-v8.0.3engde_nrmonitor-v8.0.3
Page 39 / 104
USER GUIDE: 2. GETTING FAMILIAR
SA) will be refreshed.
Activity data update
period
System data update
period
Log data update period
Configuration data
update period
Specifies in minutes when activity data (hosts, authenticated users and
Seismo) will be refreshed.
Specifies in minutes when system data (session data, high availability,
RAID, cryptography card, quarantine, services and Active Update) will be
refreshed.
Specifies in minutes when log data (Log space, filters, VPN, system, traffic
and filter logs) will be refreshed.
Specifies in minutes when configuration data (Anti spam, anti-virus,
proxies, SPD and system properties) will be refreshed.
REMARK
The Default button allows you to reset the parameters to their default values.
2.4.2 Memory
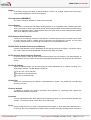
Figure 21: Monitor – Memory
Number of log lines to be
downloaded
Graph period
Maximum displayed
alarms
Copyright NETASQ 2009
Configures the number of log lines you wish to display in the Traffic
menu.
Indicates how long graphs will be displayed (Statistics from the
Interfaces menu).
Configures the number of alarm lines that you wish to display in the
Alarms menu.
engde_nrmonitor-v8.0.3engde_nrmonitor-v8.0.3
Page 40 / 104
USER GUIDE: 2. GETTING FAMILIAR
2.4.3 Miscellaneous
Figure 22: Monitor – Miscellaneous
Connection timeout
Copyright NETASQ 2009
When the firewall does not respond, the connection will be shut down at
the end of the period determined in this field.
engde_nrmonitor-v8.0.3engde_nrmonitor-v8.0.3
Page 41 / 104
USER GUIDE: 3. INFORMATION ON FIREWALLS
3. INFORMATION ON FIREWALLS
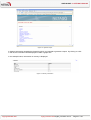
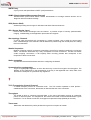
3.1 OVERVIEW
3.1.1 Introduction
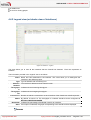
The Overview menu allows you to display several types of information regarding your firewalls. Once the
connection with the firewall is established, this information will be available.
The Overview menu consists of five zones:
The menu directory
An overview of information on vulnerabilities found on your network. (Corresponds to the Part 4/Chapter2:
SEISMO menu)
A search and icon bar
A list of your firewalls
A view of connection logs
Figure 23: Overview
Copyright NETASQ 2009
engde_nrmonitor-v8.0.3engde_nrmonitor-v8.0.3
Page 42 / 104
USER GUIDE: 3. INFORMATION ON FIREWALLS
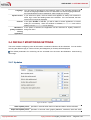
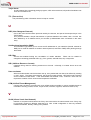
3.1.2 Overview of information on vulnerabilities
This view indicates the number of vulnerabilities found, the number of critical vulnerabilities and the number
of vulnerabilities that are remotely accessible on your networks. These indications represent links that
allowing access to these vulnerabilities (Part 4/Chapter 2: Seismo menu).
Figure 24: Overview of the network
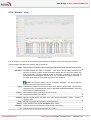
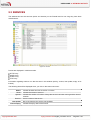
3.1.3 List of firewalls
This view provides the following information on your product(s):
Automatic connection
Read-only
Status
Name
Address
Copyright NETASQ 2009
Selecting this option allows you to activate automatic reconnection of
NETASQ REAL-TIME MONITOR in the event of a disconnection.
Select this option to activate read-only mode.
Indicates
the
product’s
connection
status.
Options:
Connected/Disconnected.
Product’s name or IP address if the name has not been indicated.
Firewall’s IP address.
Login
Login of the connected administrator account.
Model
Product model: U250, U6000…
engde_nrmonitor-v8.0.3engde_nrmonitor-v8.0.3
Page 43 / 104
USER GUIDE: 3. INFORMATION ON FIREWALLS
Firmware
Active Update
Antivirus
Backup version
Latest alarms
Vulnerabilities
Global filter
Filters
Version of the firmware monitored in Firewall Monitor’s "Firmware".
Indicates the update status of the Active Update module. Options: OK or x
failure (s).
Indicates the status of the antivirus. Options: OK/Disabled.
Version number of the backup module or of the firmware in the passive
partition.
Indicates the number of major and minor alarms for the latest alarms.
Indicates the number of vulnerabilities.
Indicates whether a global filter rule has been activated.
policy” will be indicated.
Indicates the name of the active filter slot.
VPN
Indicates the name of the active VPN slot.
URL
Indicates the name of the active URL slot.
NAT
Indicates the name of the active NAT slot.
If so, “Global
Up time
Amount of time that the firewall has been running since the last startup.
Session
Indicates the number of sessions opened on the firewall.
Comments
Comments or descriptions of the firewall.
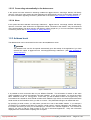
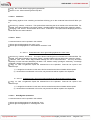
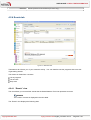
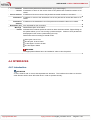
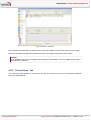
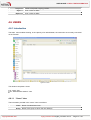
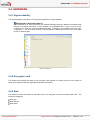
3.1.4 Connection logs
This window indicates logs of connections between NETASQ REAL-TIME MONITOR and the firewall.
Figure 25: Connection logs
Copyright NETASQ 2009
engde_nrmonitor-v8.0.3engde_nrmonitor-v8.0.3
Page 44 / 104
USER GUIDE: 3. INFORMATION ON FIREWALLS
TIP
You can erase logs by right-clicking on the “Connection logs” view DASHBOARD
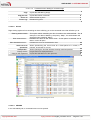
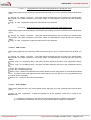
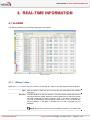
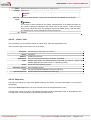
3.2 DASHBOARD
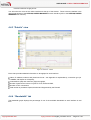
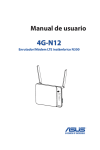
3.2.1 Introduction
The Dashboard menu allows displaying on a single screen all the useful information concerning real-time
monitoring.
It basically picks out useful information from some of the menus in the NETASQ REAL-TIME MONITOR
menu directory and adds on other additional information. The data displayed in this window are:
System information
Memory
CPU
Hardware
Active network policies
Alarms
Vulnerabilities
Active Update
Logs
Services
Interfaces
Top 5 interfaces for incoming throughput
Top 5 interfaces for outgoing throughput
Top 5 hosts for incoming throughput
Top 5 hosts for outgoing throughput
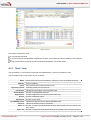
Figure 26 : Dashboard
Copyright NETASQ 2009
engde_nrmonitor-v8.0.3engde_nrmonitor-v8.0.3
Page 45 / 104
USER GUIDE: 3. INFORMATION ON FIREWALLS
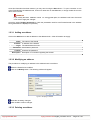
3.2.2 Selecting a product
When you click on the Dashboard menu, a product selector window may open if several firewalls have been
registered.
Figure 27: Search
If the list of firewalls is long, look for the desired firewall using the Search field.
Select the firewall.
Click on OK. The Dashboard of the desired firewall will appear.
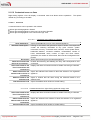
3.2.3 System information
Firewall name
Firmware of the active
partition
Firmware of the
passive partition
Active Partition
Model
Version of the active partition’s firmware.
Version of the passive partition’s firmware.
Partition on which the firewall was booted.
Appliance’s model number.
Serial no.
Appliance’s serial number.
Date-time
Current date and time.
Up time
Copyright NETASQ 2009
Name given to the product when it was registered in the address book.
Amount of time that the firewall has been running since the last startup.
engde_nrmonitor-v8.0.3engde_nrmonitor-v8.0.3
Page 46 / 104
USER GUIDE: 3. INFORMATION ON FIREWALLS
3.2.4 Memory
This refers to the use (in percentage) of memory reserved for storing information (buffer). The buffer is
linked to the stateful module and corresponds to saving the context.
Host
Fragmented
Connections
ICMP
Datatracking
Dynamic
Host stack
Fragmented packets
All TCP/IP connections.
ICMP requests (Ping, trace route...).
Memory used for monitoring connections.
Percentage of ASQ memory being used.
Buffer sizes vary according to product type (U30, U70, U120, U250, U450, etc) and product version.
Cleaning algorithms optimize the operation of “Hosts”, “Fragmented”, “ICMP” and “Connections” buffers.
Entries in the “Fragmented” and “ICMP” buffers are initialized at fixed intervals (each entry has a limited
lifetime: TTL).
This illustrates part of the Firewall’s activity. A high percentage may mean the Firewall is overloaded or that
an attack has been launched.
3.2.5 CPU
DEFINITION
Better known as a “processor”, this is the internal firewall resource that performs the necessary
calculations.
User:
Kernel:
Interruption:
CPU time allocated to the management of user processes.
CPU time that the kernel consumes
CPU time allocated for interruptions.
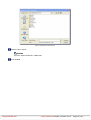
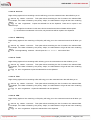
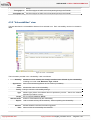
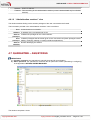
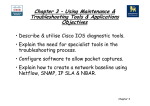
3.2.6 Hardware
DEFINITION OF “HIGH AVAILABILITY”
A specific architecture in which a backup appliance takes over when the “main” appliance breaks
down while in use. This switch is totally transparent to the user.
If high availability has been activated, an additional section will provide you with the information
regarding high availability (status of firewalls, licenses, synchronization).
Click on the descriptive phrase in the “Hardware” zone in order to display the Hardware menu and
to obtain information on high availability.
If the backup firewall is not available, information on the active firewall can be viewed.
Copyright NETASQ 2009
engde_nrmonitor-v8.0.3engde_nrmonitor-v8.0.3
Page 47 / 104
USER GUIDE: 3. INFORMATION ON FIREWALLS
Figure 28: Hardware
3.2.7 Active network policies
This view indicates whether slots are active. If so, the label of the activated rule is indicated. The rules
mentioned here are:
Global filter rules
Filter rule:
VPN rule
Translation rule
URL filter rule
Name of the activated global filter policy.
Name of the activated filter policy.
Name of the activated VPN rule.
Name of the activated translation policy.
Name of the activated URL filter rule.
REMARK
<None> means that no policy has been activated for the rule that contains this indication.
3.2.8 Alarms
This view indicates the number of major and minor alarms during the past 15 minutes that the product has
been connected.
To view the alarms, click on either link of your choice – the Alarms menu will appear and will set out the list
of alarms according to the selected criticality.
Copyright NETASQ 2009
engde_nrmonitor-v8.0.3engde_nrmonitor-v8.0.3
Page 48 / 104
USER GUIDE: 3. INFORMATION ON FIREWALLS
3.2.9 Vulnerabilities
This view indicates the number of vulnerabilities in a specific level, of which there are 4: "Critical" ; "High" ;
"Moderate" ; "Low".
To view a list of vulnerabilities, click on one of the levels – the SEISMO menu will appear (Cf. Part 4/Chapter
2: Seismo).
3.2.10
VPN Tunnels
This view indicates the number of configured VPN tunnels. To view a list of configured VPN tunnels, click on
the link – the VPN Tunnels menu will appear.
3.2.11
Active Update
This view indicates the status of updates that have been performed (success or failure) as well as the last
time the Active Update module had been launched (date and time). To view a list of updates and their
status, click on the link – the Active Update menu will appear.
3.2.12
Logs
This window indicates whether there are problems with the logs. To view a graph that represents the current
size of the log file in real time (Alarms, Authentication, Connections, Filters, Monitor, Plugins, POP3,
SEISMO, Administration, SMTP, System, IPSec VPN, Web, SSL VPN) in relation to the space allocated to
each log type on the firewall, click on the link. The Logs menu will appear.
3.2.13
Services
This zone indicates whether there are problems with the services. To view a list of services and their status
(Enabled/Disabled), click on the link – the Services menu will appear.
3.2.14
Interfaces
This zone indicates whether there are problems with the interfaces. To view information on bandwidth,
connections and throughput, click on the link. The Interfaces menu will appear.
3.2.15
Top 5 interfaces for incoming throughput
This zone displays the list of the 5 interfaces that have registered the most incoming throughput. Click on
any one of the interfaces to display the Throughput tab graph in the Interfaces menu.
Copyright NETASQ 2009
engde_nrmonitor-v8.0.3engde_nrmonitor-v8.0.3
Page 49 / 104
USER GUIDE: 3. INFORMATION ON FIREWALLS
3.2.16
Top 5 interfaces for outgoing throughput
This zone displays the list of the 5 interfaces that have registered the most incoming throughput. Click on
any one of the interfaces to display the Throughput tab graph in the Interfaces menu.
3.2.17
Top 5 hosts for incoming throughput
This zone displays the list of the 5 hosts that have registered the most incoming throughput. Click on any
one of the interfaces to display the throughput tab graph in the Interfaces menu.
3.2.18
Top 5 hosts for outgoing throughput
This zone displays the list of the 5 hosts that have registered the most outgoing throughput. Click on any one
of the interfaces to display the throughput tab graph in the Interfaces menu.
Copyright NETASQ 2009
engde_nrmonitor-v8.0.3engde_nrmonitor-v8.0.3
Page 50 / 104
USER GUIDE: 4. REAL-TIME INFORMATION
4. REAL-TIME INFORMATION
4.1 ALARMS
The alarms generated by the Firewall will appear in this window.
Figure 29: Alarms
4.1.1 “Alarms” view
When the Alarms menu in the menu directory is selected, the “Alarms” view will display the following data:
Date
Sensitive
Date and time on which the line in the log file was generated at the firewall’s
local time.
Indicates whether an alarm is sensitive. This alarm will be raised whenever the
intrusion prevention system detects a sensitive packet and for which the system
has been configured in intrusion detection mode. If the alarm is sensitive, an
icon with an exclamation mark will appear, followed by a “Yes”, otherwise “No”
will be indicated. If the alarm is blocked, the icon will be grayed out (it is
disabled)
.
NOTE: Only protocol alarms can be considered “sensitive”. For alarms that
Copyright NETASQ 2009
engde_nrmonitor-v8.0.3engde_nrmonitor-v8.0.3
Page 51 / 104
USER GUIDE: 4. REAL-TIME INFORMATION
are not in this class, the column will be empty.
Copy
Priority
ID
Content
Rule
Action
Interface
IP
Protocol
Source
Source address
Destination
Destination address
Destination port
Message
Packet
Indicates the number of occurrences of an alarm within a given period. The
period is configured in the "Logs/Advanced" menu in NETASQ UNIFIED
MANAGER, under the option "Write log duplicates every * ".
Determines the level of the alarm (minor or major).
Indicates the number of the alarm.
Category under which the alarm has been placed (Examples: “Filter”,
“Protocol”, “System”, etc)
Number of the filter rule involved in raising the alarm.
Action applied on the packet. (Example: Block, Pass).
Interface name of the firewall on which he alarm was raised.
Internet protocol
Protocol of the packet that raised the alarm.
IP address or the corresponding object name of the source host of the packet
that caused the alarm to be raised.
IP address of the source host of the packet that caused the alarm to be raised.
IP address or the corresponding object name of the destination host of the
packet that caused the alarm to be raised.
IP address of the destination host of the packet that caused the alarm to be
raised.
Port requested for this connection.
Detailed description of the alarm.
Indicates the IP network packet for which an alarm has been raised. Rightclicking on this packet allows you to view it using a packet analyzer. Values of
IPv4 packets will be displayed in this column (value starting from 45).
Packet size varies according to firewall model.
S 64 bytes: U30 to U70.
M 128 bytes: U120 to U450
L 1500 bytes: U1100 to U1500
XL 1500 bytes: U6000
WARNING
The appropriate software has to be installed in order to view the packet.
4.2 SEISMO
4.2.1 Introduction
NETASQ SEISMO is a module that allows network administrators to gather information in real time and to
analyze it in order to spot possible vulnerabilities that may compromise the security of their networks.
Among other things, it also allows raising alarms generated by ASQ and thus to maintain an optimal security
policy.
NETASQ SEISMO collects and archives in particular, information relating to the operating system, to various
active services as well as to the different applications that have been installed. As a result, descriptive
profiles can be made of network elements.
Copyright NETASQ 2009
engde_nrmonitor-v8.0.3engde_nrmonitor-v8.0.3
Page 52 / 104
USER GUIDE: 4. REAL-TIME INFORMATION
The following are NETASQ SEISMO’s aims:
To configure your company network’s security policy
To analyze the status of the risk
To optimize the level of security
To report security events
The procedure is as follows:
NETASQ’s intrusion prevention engine (ASQ) extracts data in real time using network protocols that it
knows.
SEISMO then combines and weights these data.
The vulnerability found can then be treated using databases that have been indexed dynamically. Once
all this information has been collected, they will be used in Monitor so that flaws on the network can be
corrected, or prohibited software can be detected, or the real risk relating to the attack can be identified in
real time.
The profile is therefore complete.
One or several solutions can thus be considered.
Example
A company has a public website that it updates twice a month via FTP. At a specific date and time, a
vulnerability that affects FTP servers is raised and Monitor immediately takes it into account, enabling the
network administrator to detect it at practically the same time.
This vulnerability is represented by a line that indicates the number of affected hosts and whether a
solution is available.
By deploying this line, details of the hosts concerned will appear, as well as the service that has been
affected by the vulnerability. Help, in the form of links, may be suggested to correct the detected flaw.
Once the network administrator becomes aware of the vulnerability, he can correct it at any moment,
quarantine the affected host(s) and generate a report.
SEISMO can also perform weekly, monthly or yearly analyses, using the application NETASQ EVENT
REPORTER (Autoreport). (See the NETASQ EVENT REPORTER user guide.)
When you click on the SEISMO menu in the menu directory, the scan window will consist of the following
A Vulnerabilities tab
An Applications tab
An Events tab
Copyright NETASQ 2009
engde_nrmonitor-v8.0.3engde_nrmonitor-v8.0.3
Page 53 / 104
USER GUIDE: 4. REAL-TIME INFORMATION
4.2.2 Vulnerabilities tab
Figure 30: SEISMO
The window has 3 views:
A view of the list of vulnerabilities
A view of the list of hosts affected by this vulnerability
A view allowing the resolution of the selected vulnerability if a solution exists
4.2.2.1 “Vulnerability” view
This view allows you to view all the vulnerabilities that the firewall has detected. Each line represents a
vulnerability.
REMARK
The number of vulnerabilities is displayed in the tab’s label.
The information provided in the “vulnerability” view is as follows:
Severity
Name
Affected
hosts
Family
Copyright NETASQ 2009
Indicates the how severely the host(s) have/has been affected by the vulnerability,
according to 4 levels: Low, Moderate, High, Critical.
Indicates the name of the vulnerability.
Number of hosts affected by the vulnerability.
Family to which the vulnerability belongs. (See Appendix D: Sessions and user privileges).
engde_nrmonitor-v8.0.3engde_nrmonitor-v8.0.3
Page 54 / 104
USER GUIDE: 4. REAL-TIME INFORMATION
Target
One of 2 targets: Client or Server.
Exploit
Local or remote access (via the network). Allows exploiting the vulnerability.
Solution
Indicates whether a solution has been suggested.
Release
Date on which the vulnerability was discovered.
WARNING
This refers to the date on which the vulnerability was discovered and not the date on which
it appeared on the network.
ID
Allows a unique identification of the vulnerability.
4.2.2.2 “Hosts” view
This view allows you to view all the vulnerabilities for a given host. Each line represents a host.
The information provided in the “Hosts” view is as follows:
Affected
Name
Address
Date on which the host was affected.
Name of the host affected by the attack (if it exists).
IP address of the host affected by the attack.
Application
Name and version of the application (if available).
Type
Application type (Client/Server/Operating system).
Detail
Operating system
Port
Internet Protocol
Details of the application type
OS used.
Number of the port on which the vulnerability had been detected.
Name of the protocol used.
4.2.2.3 Help zone
The help zone allows you to get more details relating to the attack. Thus the administrator can correct the
vulnerability.
Click on the Show help button to show or hide the help zone associated with a vulnerability.
Typically, help comes in the form of a descriptive file that contains explanations, links to the publisher’s site
or to bug fixes, and the possibility of quarantining the affected host.
Copyright NETASQ 2009
engde_nrmonitor-v8.0.3engde_nrmonitor-v8.0.3
Page 55 / 104
USER GUIDE: 4. REAL-TIME INFORMATION
Figure 31: Help
4.2.3 Application tab
Figure 32: SEISMO - Application
The Applications tab provides information on the application detected within the enterprise.
Copyright NETASQ 2009
engde_nrmonitor-v8.0.3engde_nrmonitor-v8.0.3
Page 56 / 104
USER GUIDE: 4. REAL-TIME INFORMATION
Two types of application may be detected:
Products: these are client applications installed on the host (e.g.: Firefox 1.5).
Services: these are server applications that are attached to a port (e.g.: OpenSSH 3.5).
Using information detected by the ASQ engine, NETASQ SEISMO generates information about the detected
applications. The addition of this feature allows grouping applications by family, so by pairing such
information with the vulnerability database, NETASQ SEISMO also suggests probable security loopholes
linked to these applications.
This tab offers features that include filtering, optional column display, resizing to fit contents and copying of
data to the clipboard. It displays information on the detected applications through the columns that can be
seen in the window above.
The window comprises 2 views:
A view that lists the applications
A detailed view that lists the hosts
4.2.3.1 “Application(s)” view
This view allows you to see the applications that the firewall detects. Each line represents an application.
REMARK
The number of applications is displayed in the tab’s label.
The Applications tab displays the following data:
Name
Family
Type
Instance
Name of the software application. The version is not specified except for the
operating systems.
The software application’s family (e.g.: “web client”).
Software type (Client: the software does not provide any service – Server: the
software application provides a service – Operating system).
Number of software applications detected in the monitored networks. For a server,
the same service may be suggested on several ports. E.g.: an Apache http server
which provides its services on port 80 and port 8080 (web proxy) would appear
twice.
4.2.3.2 “Hosts” view
This view allows you to see all the applications for a given host. Each line represents a host.
The information seen in the “Hosts” view is as follows:
Name
IP address
Application
Type
Operating system
Port
Copyright NETASQ 2009
Host name
IP address of the host
Name of the software as well as its version, if available.
Software type (Client: the software does not provide any service – Server: the
software application provides a service – Operating system).
Host’s operating system.
Port that the software application uses (if it uses any).
engde_nrmonitor-v8.0.3engde_nrmonitor-v8.0.3
Page 57 / 104
USER GUIDE: 4. REAL-TIME INFORMATION
Protocol
Internet protocol of the software (if it uses any).
4.2.4 Events tab
Figure 33: SEISMO-Events
The Events tab informs you of your network’s activity. You can therefore see the programs that are at risk
of generating attacks.
The window is divided into 3 sections:
List of programs
List of hosts
Help zone
4.2.4.1 “Events” view
This view allows you to see all the events that the firewall detects. Each line represents an event.
REMARK
The number of events is displayed in the tab’s label.
The “Events” view displays the following data:
Copyright NETASQ 2009
engde_nrmonitor-v8.0.3engde_nrmonitor-v8.0.3
Page 58 / 104
USER GUIDE: 4. REAL-TIME INFORMATION
Name
Family
Name of the detected OS or a server (e.g.: SSH server).
Host family.
Example
SSH
Affected
hosts
ID
Number of hosts affected. These hosts are identified in the Hosts view in this tab.
REMARK
The number of hosts indicated in the column "Affected hosts" is not always the same as
the number of elements indicated in the "Hosts" zone in this window. In fact, the same
service may use several ports. For example, the service thhtpd_server_2.25b can listen
to 2 different ports, thus increasing the number of elements.
Identifier.
4.2.4.2 “Hosts” view
This view allows you to see all the events for a given host. Each line represents a host.
The information seen in the “Hosts” view is as follows:
Assigned
Name
Address
Application
Type
Detail
Operating system
Port
Internet Protocol
Date and time of the event’s occurrence.
Host name.
IP address of the host
Name of the software as well as its version, if available.
Software type (Client: the software does not provide any service – Server: the
software application provides a service – Operating system).
Details about the operating system.
Host’s operating system.
Port that the software application uses (if it uses any).
Internet protocol of the software (if it uses any).
4.2.4.3 Help zone
The help zone allows you to get more details relating to the attack. Thus the administrator can correct the
vulnerability.
Click on the Show help button to show or hide the help zone associated with an event.
Typically, help comes in the form of a descriptive file that contains explanations, links to the publisher’s site
or to bug fixes, and the possibility of quarantining the affected host.
Copyright NETASQ 2009
engde_nrmonitor-v8.0.3engde_nrmonitor-v8.0.3
Page 59 / 104
USER GUIDE: 4. REAL-TIME INFORMATION
Figure 34: Help
REMARK
Refer to the user guide NETASQ UNIFIED MANAGER to configure SEISMO.
4.3 HOSTS
This window lists the connected hosts (these hosts had been created earlier as objects in NETASQ UNIFIED
MANAGER).
Copyright NETASQ 2009
engde_nrmonitor-v8.0.3engde_nrmonitor-v8.0.3
Page 60 / 104
USER GUIDE: 4. REAL-TIME INFORMATION
Figure 35: Hosts
The window comprises 3 views:
A view that lists the hosts
A view that lists the Vulnerabilities, Applications, Events, Connections and Alarms relating to the selected
host
A help view that allows working around the selected vulnerability, if a solution exists
4.3.1 “Host” view
This view allows you to see all the hosts that the firewall detects. Each line represents a host.
The information seen in the “Hosts” view is as follows:
Name
Address
Users
Operating system
Information
Vulnerabilities
Applications
Events
Open ports
Last SEISMO event
Host’s IP address
User connected to the host (if there is one).
Operating system used on the host.
Indicates the information in the Information tab.
Number of vulnerabilities detected.
Number of applications on the host (if there are any).
Number of detected events
Number of open ports.
Indicates the date and time of the last SEISMO event.
Interface
Interface on which the host is connected.
Bytes in
Number of bytes that have passed through the Firewall from the source host
since startup.
Number of bytes that have passed through the Firewall to the source host since
Bytes out
Copyright NETASQ 2009
Name of the source host (if declared in objects) or host’s IP address otherwise.
engde_nrmonitor-v8.0.3engde_nrmonitor-v8.0.3
Page 61 / 104
USER GUIDE: 4. REAL-TIME INFORMATION
startup.
Throughput in
Actual throughput of traffic to this host passing through the Firewall.
Throughput out
Actual throughput of traffic to this host passing through the Firewall.
4.3.2 “Vulnerabilities” view
This tab describes the vulnerabilities detected for a selected host. Each vulnerability can then be viewed in
detail.
Figure 36: Hosts – Vulnerabilities
The information provided in the “vulnerability” view is as follows:
Severity
Application
name
Name
Family
Type
Target
Affected hosts
Exploit
Solution
Date
Copyright NETASQ 2009
Indicates the how severely the host(s) have/has been affected by the vulnerability,
according to 4 levels: Low, Moderate, High, Critical.
Name of the software application and its version (if available).
Indicates the name of the vulnerability.
Family to which the vulnerability belongs.
Software type (Client: the software does not provide any service – Server: the software
application provides a service).
One of 2 targets: Client or Server.
Number of hosts affected by the vulnerability.
Local or remote access (via the network). Allows exploiting the vulnerability.
Indicates whether a solution has been suggested.
Date on which the vulnerability was detected.
engde_nrmonitor-v8.0.3engde_nrmonitor-v8.0.3
Page 62 / 104
USER GUIDE: 4. REAL-TIME INFORMATION
Internet
Protocol
Id
WARNING
This refers to the discovery date and not the date on which the vulnerability appeared
on the network.
Name of the protocol used.
Vulnerability identifier.
4.3.3 “Applications” view
Figure 37: Hosts – Applications
This tab describes the applications detected for a selected host. It is possible to view applications in detail
later.
The “Applications” view displays the following data:
Version
Vulnerability
Family
Type
Port
Protocol
Name and version of the application.
Number of vulnerabilities detected on the application.
The software application’s family (e.g.: “web client”).
Software type (Client: the software does not provide any service – Server: the
software application provides a service).
Port used by the application (if it uses one).
Protocol used by the application
4.3.4 “Events” view
This tab describes the information relating to a given host
Copyright NETASQ 2009
engde_nrmonitor-v8.0.3engde_nrmonitor-v8.0.3
Page 63 / 104
USER GUIDE: 4. REAL-TIME INFORMATION
.
Figure 38: Hosts - Events
REMARK
The number of events is displayed in the tab’s label.
The information provided in the “events” view is as follows:
Name
Family
Type
Detail
Detected
Port
Internet
Protocol
Id
Name of the detected OS.
Family of the vulnerability that is likely to appear (Example: SSH).
Application type (Client: the software does not provide any service – Server: the software
application provides a service).
Name of the detected OS.
Description of information.
Date and time of detection.
Number of the port on which the vulnerability had been detected.
Name of the protocol used.
Unique identifier of the vulnerability family.
4.3.5 “Connections” view
Copyright NETASQ 2009
engde_nrmonitor-v8.0.3engde_nrmonitor-v8.0.3
Page 64 / 104
USER GUIDE: 4. REAL-TIME INFORMATION
Figure 39: Hosts - Connections
This view allows you to see the connections that the firewall detects. Each line represents a connection.
The “Connections” view displays the following data:
Time
Protocol
Source
Indicates the date and time of the object’s connection.
Communication protocol used for the connection.
Name of the object that connected to the selected host.
Source port
Indicates the number of the source port used for the connection.
Destination
Name of the object for which a connection has been established.
Destination
port
Sent
Indicates the number of the destination port used for the connection.
Number of KB sent during the connection.
Received
Number of KB received during the connection
Duration
Connection duration.
Operation
Identified command of the protocol.
Parameter
Operation parameter.
Copyright NETASQ 2009
engde_nrmonitor-v8.0.3engde_nrmonitor-v8.0.3
Page 65 / 104
USER GUIDE: 4. REAL-TIME INFORMATION
4.3.6 “Alarms” view
Figure 40: Hosts - Alarms
This view allows you to view all the alarms that the firewall has detected. Each line represents an alarm.
The information provided in the “alarms” view is as follows:
Date
Date and time on which the line in the log file was generated at the firewall’s local time.
Sensitive
Indicates whether an alarm is sensitive. This alarm will be raised whenever the
intrusion prevention system detects a sensitive packet and for which the system has
been configured in intrusion detection mode. If the alarm is sensitive, an icon with an
exclamation mark will appear, followed by a “Yes”, otherwise “No” will be indicated. If
the alarm is blocked, the icon will be grayed out (it is disabled)
.
Copy
Priority
ID
Content
Rule
Action
Interface
IP
Copyright NETASQ 2009
NOTE: Only protocol alarms can be considered “sensitive”. For alarms that are
not in this class, the column will be empty.
Indicates the number of occurrences of an alarm within a given period. The period is
configured in the "Logs/Advanced" menu in NETASQ UNIFIED MANAGER, under the
option "Write log duplicates every * ".
Determines the level of the alarm (minor or major).
Indicates the number of the alarm.
Category under which the alarm has been placed (Examples: “Filter”, “Protocol”,
“System”, etc)
Number of the filter rule involved in raising the alarm.
Action applied on the packet. (Example: Block, Pass).
Interface name of the firewall on which he alarm was raised.
Internet protocol that raised the alarm (e.g.: UDP)
engde_nrmonitor-v8.0.3engde_nrmonitor-v8.0.3
Page 66 / 104
USER GUIDE: 4. REAL-TIME INFORMATION
Protocol
Source
Source address
Destination
Destination
address
Destination port
Message
Packet
Protocol of the packet that raised the alarm. (e.g.: netbios.dgm)
IP address or name of the source host of the packet that caused the alarm to be
raised.
IP address of the source host of the packet that caused the alarm to be raised.
IP address or name of the destination host of the packet that caused the alarm to be
raised.
IP address of the destination host of the packet that caused the alarm to be raised.
Port requested for this connection.
Detailed description of the alarm.
Indicates the IP network packet for which an alarm has been raised. Right-clicking on
this packet allows you to view it using a packet analyzer. Values of IPv4 packets will
be displayed in this column (value starting from 45).
Packet size varies according to firewall model.
S 64 bytes: U30 to U70.
M 128 bytes: U120 to U450
L 1500 bytes: U1100 to U1500
XL 1500 bytes: U6000
WARNING
The appropriate software has to be installed in order to view the packet.
4.4 INTERFACES
4.4.1 Introduction
DEFINITION
A zone, whether real or virtual, that separates two elements. The interface thus refers to what the
other element need to know about the other in order to operate correctly.
Copyright NETASQ 2009
engde_nrmonitor-v8.0.3engde_nrmonitor-v8.0.3
Page 67 / 104
USER GUIDE: 4. REAL-TIME INFORMATION
Figure 41: Interfaces
The Interfaces menu presents different statistics concerning:
Bandwidth
Connections
Throughput
Statistics are displayed in the form of graphs.
The vertical and horizontal axes are graduated. The horizontal axis represents time, and the vertical axis is
either:
Bandwidth percentage
The number of connections, or
Throughput expressed in bytes, kilobytes or megabytes.
4.4.1.1 Interface types
Vlan.
Ethernet.
PPTP.
Dialup.
REMARK
The interfaces are grayed out or do not appear at all when they are inactive.
The window consists of 3 views:
A view of the interfaces in tables (or legend)
Copyright NETASQ 2009
engde_nrmonitor-v8.0.3engde_nrmonitor-v8.0.3
Page 68 / 104
USER GUIDE: 4. REAL-TIME INFORMATION
A details zone
A zone for viewing graphs
4.4.2 Legend view (or tabular view of interfaces)
Figure 42: Interfaces – Legend
This view allows you to view all the interfaces that the firewall has detected. Each line represents an
interface.
The information provided in the “legend” view is as follows:
Name
Type
Address/
Network
Throughput
in
Throughput
out
Connections
Media
Bandwidth
Stats
Name and color attributed to the interface. The colors allow you to distinguish the
interface in the different graphs.
Type of interface with a matching icon.
The interface’s address and sub-network mask.
Indicates the real incoming throughput.
Indicates the real outgoing throughput.
Number of real-time connections on each interface of the firewall over a defined period.
By default, its value is 0. The throughput of a network interface can be configured via
NETASQ UNIFIED MANAGER.
Indicates the percentage of bandwidth used for an interface.
If this option is selected, the graph corresponding to this interface will be displayed.
REMARK
Copyright NETASQ 2009
engde_nrmonitor-v8.0.3engde_nrmonitor-v8.0.3
Page 69 / 104
USER GUIDE: 4. REAL-TIME INFORMATION
Inactive interfaces are grayed out.
You will notice the colors of the visible interfaces at the top of the window. These colors are defined in the
network parameters of the NETASQ UNIFIED MANAGER for each interface (refer to the NETASQ UNIFIED
MANAGER user manual).
4.4.3 “Details” view
Figure 43: Interfaces - Details
Each chart provides statistical information on throughput for each interface:
Name, IP address, subnet mask (American format – see Appendix for explanations), connection type (10
or 100Mbits, half duplex or full duplex),
Instantaneous (left) and maximum (right) throughput,
Number of packets and volume in bytes for TCP, UDP and ICMP,
Number of TCP connections,
Total number of packets accepted, blocked and fragmented by the Firewall.
4.4.4 “Bandwidth” tab
The bandwidth graph displays the percentage of use of the available bandwidth on each interface in real
time.
Copyright NETASQ 2009
engde_nrmonitor-v8.0.3engde_nrmonitor-v8.0.3
Page 70 / 104
USER GUIDE: 4. REAL-TIME INFORMATION
Figure 44: Interfaces - Bandwidth
Each interface is represented by a different color of which the legend may be found at the top of the graph.
Maximum bandwidth represents the theoretical maximum throughput supported by the interface.
Example
For a 100Mbits/s line used in full duplex, this maximum is 200 Mbits/s, and for a 10Mbits/s line used in
half duplex it is 10 Mbits/s.
4.4.5 “Connections” tab
The connection graph displays in real time the number of connections on each of the Firewall’s interfaces
during the defined period.
Copyright NETASQ 2009
engde_nrmonitor-v8.0.3engde_nrmonitor-v8.0.3
Page 71 / 104
USER GUIDE: 4. REAL-TIME INFORMATION
Figure 45: Interfaces - Connections
Each interface is represented by a different color of which the legend may be found at the top of the graph.
4.4.6 “Throughput” tab
The throughput graph represents the real throughput on each of the Firewall’s interfaces. The throughput
scale automatically adapts to the maximum throughput recorded during the period.
Figure 46: Interfaces - Throughput
For each interface, the throughput graph indicates the ingoing and outgoing throughput.
To modify the interface on which throughput is viewed, click on this interface in the legend at the top right
section of the graph. The interface currently being viewed will be highlighted in blue.
Copyright NETASQ 2009
engde_nrmonitor-v8.0.3engde_nrmonitor-v8.0.3
Page 72 / 104
USER GUIDE: 4. REAL-TIME INFORMATION
4.5 QUALITY OF SERVICE (QoS)
REMARKS
1) Quality of Service, which has a high level of abstraction, refers to the ability to provide a network
service according to parameters defined in a Service Level Agreement (SLA). The “quality” of the
service is therefore gauged by its availability, latency rate, fluctuations, throughput and rate of lost
packets.
2) Where network resources are concerned, the “Quality of service” refers to a network element’s ability
to provide traffic prioritization services and bandwidth and latency time control.
Figure 47: Quality of service
This window consists of 2 views:
A table view
A graph view
This view shows the incoming and outgoing throughput associated with the different QIDs defined on the
firewall’s QoS policy.
The following data is displayed when you click on the Quality of service menu:
QID
Throughput in
Throughput out
Packets in
Packets out
Drops in
Copyright NETASQ 2009
Name of the policy defined for accepting or rejecting packets.
Indicates in real time the incoming throughput that the QID manages.
Indicates in real time the outgoing throughput that the QID manages
Number of incoming packets in real time over a defined period.
Number of outgoing packets in real time over a defined period
Number of rejected incoming packets on the network.
engde_nrmonitor-v8.0.3engde_nrmonitor-v8.0.3
Page 73 / 104
USER GUIDE: 4. REAL-TIME INFORMATION
Drops out
Number of rejected outgoing packets.
Bytes in
Value in Kbits or Mbits.
Bytes out
Value in Kbits or Mbits.
4.6 USERS
4.6.1 Introduction
The User menu enables viewing, in the capacity of an administrator, the users who are currently connected
on the Firewall.
Figure 48: Users
This window comprises 2 views:
A “users” view.
An “administration session” view.
4.6.1.1 “Users” view
The information provided in the “users” view is as follows:
Name
Name of authenticated user.
Group
Name of the group to which the user belongs.
Copyright NETASQ 2009
engde_nrmonitor-v8.0.3engde_nrmonitor-v8.0.3
Page 74 / 104
USER GUIDE: 4. REAL-TIME INFORMATION
Address
User’s IP address.
Timeout
Time remaining for this authentication session (a user is authenticated only for a limited
duration).
4.6.1.2 “Administration sessions” view
This window enables finding out the session privileges of the user connected to the firewall.
The information provided in the “administration sessions” view is as follows:
User
Address
Session
privileges
User
privileges
Session
identifier
Authenticated user’s identifier.
IP address of the connected user’s host.
Indicates the privileges for the current session.
Indicates privileges that have been given to the connected user (these privileges include
adding, modifying, deleting or reading in different applications).
Number identifying the session.
4.7 QUARANTINE – ASQ BYPASS
DEFINITIONS
1) Dynamic quarantine: the quarantine is manually done and for a set duration.
2) Static quarantine: the quarantine is automatic and for permanent. Static quarantining is configuring
in the application NETASQ UNIFIED MANAGER.
Figure 49: Quarantine
This window comprises 2 views:
Copyright NETASQ 2009
engde_nrmonitor-v8.0.3engde_nrmonitor-v8.0.3
Page 75 / 104
USER GUIDE: 4. REAL-TIME INFORMATION
A “Quarantine” view
An “ASQ Bypass” view.
4.7.1 “Quarantine” view
This window shows the hosts that have been dynamically quarantined. Hosts in static quarantine are not
reflected in this list.
The information provided in the “Quarantine” view is as follows:
Addresses
Type
Expiry
IP address of the host(s) affected by the quarantine.
2 options are possible: Host to host and Host to all.
Time at which the quarantine will expire.
4.7.2 “ASQ Bypass” view
The information provided in the “ASQ Bypass” view is as follows:
Addresses
IP address of the host(s) affected by the ASQ Bypass.
Type
2 options area possible: Host to host and Host to all.
Expiry
Copyright NETASQ 2009
Time at which the ASQ Bypass will expire.
engde_nrmonitor-v8.0.3engde_nrmonitor-v8.0.3
Page 76 / 104
USER GUIDE: 5. NETWORK ACTIVITY
5. NETWORK ACTIVITY
5.1 VPN TUNNELS
The following window appears when you click on the VPN Tunnels menu:
Figure 50: VPN tunnels
Here, you will see statistical information on the tunnel’s operation.
The data displayed in this window are as follows:
Source
Source address
Bytes
IP address or name of the tunnel initiator
IP address of the tunnel initiator
Indicates incoming and outgoing throughput.
Destination
Destination IP address
Destination
address
Status
IP address or name of the destination host of the packet that caused the alarm to be
raised.
Indicates the tunnel’s status. (Example: Mature).
Lifetime
The SA’s (Security Association) lifetime in a graphical representation of the position in
this lifetime as well as the value (expressed in hours, minutes and seconds)
The authentication algorithm
Authentication
Encryption
Copyright NETASQ 2009
Name of the encryption algorithm
engde_nrmonitor-v8.0.3engde_nrmonitor-v8.0.3
Page 77 / 104
USER GUIDE: 5. NETWORK ACTIVITY
Spi Out
SPI number of the negotiated outgoing SA.
Spi In
SPI number of the negotiated incoming SA (in hexadecimal).
Reqid Out
Sequence number, indicator used for the anti-replay service.
Reqid In
Sequence number, indicator used for the anti-replay service.
The tunnel is made up of two sub-tunnels, one for each direction of the datagram transmission.
REMARK
The algorithms and limits have been configured in the NETASQ UNIFIED MANAGER (refer to the
Manager user and configuration guide help for further details).
TIP
You will find other information on the parameters in this window in the RFC.
Further information may be found in RFC 2401 IPSEC:
http://www.ietf.org/rfc/rfc2401.txt
or on sites such as: http://www.guill.net/reseaux/Ipsec.html
This status is color-coded. The line containing VPN information will use the color corresponding to the
tunnel’s status.
Undetermined.
Larval: the SA is in the process of being negotiated or has not been completely
negotiated.
Mature: the SA has been established and is available; the VPN tunnel has been
correctly set up.
Dying: the SA will soon expire; a new SA is in the progress of being negotiated.
Dead: the SA has expired and cannot be used; the tunnel has not been set up and is
therefore no longer active.
Orphan: a problem has arisen, in general this status means that the tunnel has been
set up in only one direction.
5.2 ACTIVE UPDATE
DEFINITION: ACTIVE UPDATE
Enables updating the antivirus database, ASQ contextual signatures, the list of antispam servers and
the URLs used for dynamic URL filtering.
This window displays the status of Active Update on the firewall for each type of update available (Antispam,
Antivirus, Contextual signatures, Dynamic URL).
Copyright NETASQ 2009
engde_nrmonitor-v8.0.3engde_nrmonitor-v8.0.3
Page 78 / 104
USER GUIDE: 5. NETWORK ACTIVITY
Figure 51: Active Update
Active Update is used for automatically keeping URL databases up to date by downloading them on servers
such as updateX.netasq.com.
The Monitor screen indicates the result of the last update (successful or failed) and the date of the last
update.
The following data will be displayed when you click on the Active Update menu:
Status
Name
Last update
Update
license expiry
Copyright NETASQ 2009
Indicates the status of the Active Update. 2 options are possible: The last update failed
/ Updated.
Indicates the update data categories.
Indicates the date and time of the last update.
Indicates the expiry date of the license option for this category.
engde_nrmonitor-v8.0.3engde_nrmonitor-v8.0.3
Page 79 / 104
USER GUIDE: 5. NETWORK ACTIVITY
5.3 SERVICES
This window sets out the services (active and inactive) on the Firewall and for how long they have been
active/inactive.
Figure 52: Services
Proxies are displayed in 4 distinct entries:
HTTP Proxy
SMTP Proxy
POP3 Proxy
FTP Proxy
Information regarding antivirus can also be seen in this window (activity, version, last update, expiry of its
license).
The following data will be displayed when you click on the Services menu:
Status
Name
Uptime
Version
Last update
License expiry
Copyright NETASQ 2009
Indicates whether services are active or inactive
Indicates the names of services
Indicates the number of number of days the service has been running and the time of
activation.
Version number of the service
Date of the last time the service was updated.
Indicates the expiry date of the license.
engde_nrmonitor-v8.0.3engde_nrmonitor-v8.0.3
Page 80 / 104
USER GUIDE: 5. NETWORK ACTIVITY
5.4 HARDWARE
5.4.1 High availability
This window displays information concerning the initialization of high availability.
DEFINITION OF HIGH AVAILABILITY
High availability is an option that allows two firewalls (identified through a MasterHA and BackupHA
license) to exchange information on their statuses, via a dedicated link in order to ensure service
continuity in the event one of the firewalls breaks down. Firewalls in high availability have the same
configuration – only their serial numbers, licenses (Master or Backup) and most of all, their status
(active or passive) differ.
Figure 53: Hardware
5.4.2 Encryption card
This window also displays the status of the encryption card (whether it is active) as well as the number of
bytes of the algorithms that the negotiated proposal has accepted.
5.4.3 Raid
This window provides information on the RAID and on the way data is stored on multiple hard disks. The
following is displayed:
Disk type
Disk address
Disk status
Copyright NETASQ 2009
engde_nrmonitor-v8.0.3engde_nrmonitor-v8.0.3
Page 81 / 104
USER GUIDE: 6. POLICIES
6. POLICIES
6.1 FILTER POLICIES
The Filter Policy menu in Monitor recaps the active filter policy by grouping together implicit rules,
global filter rules and local filter rules.
Figure 54: Filter policy
Each row displayed is set out as follows:
<identifier for the rule type >: <identifier for the rule in the slot>:
<filter rule>
Where
<identifier for the rule type > can be “0” for implicit rules, “1” for global filters and “2” for local filters.
<identifier for the rule in the slot>: this identifier is always “0” for implicit rules.
<filter rule>: filter rule created by NETASQ.
Copyright NETASQ 2009
engde_nrmonitor-v8.0.3engde_nrmonitor-v8.0.3
Page 82 / 104
USER GUIDE: 6. POLICIES
6.2 VPN POLICY
Definition VPN (Virtual Private Network)
The interconnection of networks in a secure and transparent manner for participating applications
and protocols – generally used to link private networks to each other through the internet.
Figure 55: VPN policy
The VPN section allows viewing the configuration of different VPN tunnel policies defined in the active VPN
slot. These VPN policies do not necessarily have to be used in order to be displayed. The VPN slot only
needs to be activated.
The following information is displayed in this window:
Source
Traffic endpoint. Indicates the source network.
Source address
Indicates the address of the source network.
Source gateway
Sending endpoint of the gateway that forms the VPN tunnel.
Source router
address
Direction
Protocol
Destination
gateway
Copyright NETASQ 2009
Indicates the address of the source gateway.
Indicates the direction of the traffic represented by the following icons:
Indicates the protocol(s) allowed to pass through the tunnel.
Receiving endpoint of the gateway that forms the VPN tunnel.
engde_nrmonitor-v8.0.3engde_nrmonitor-v8.0.3
Page 83 / 104
USER GUIDE: 6. POLICIES
Destination
router address
Destination
Level
Max lifetime
Negotiated SAs
Copyright NETASQ 2009
Indicates the address of the destination address.
Traffic endpoint. Indicates the destination network.
Level of security associated with the tunnel.
REMARK
This level is defined when creating the VPN tunnel according to the encryption and
authentication algorithm).
Maximum lifespan of the configured VPN policy.
Negotiated security association.
engde_nrmonitor-v8.0.3engde_nrmonitor-v8.0.3
Page 84 / 104
USER GUIDE: 7. LOGS
7. LOGS
7.1 STATUS OF USE
A graph represents the current size of the log file in real time (“Alarms”, “Authentication”, ”Connections”,
“Filters”, “Monitor”, “Plugins”, “POP3”, “SEISMO”, “Administration”, “SMTP”, “System”, “IPSec VPN”, “Web”,
“SSL VPN”) in relation to the size allocated on the Firewall for each log type.
DEFINITION OF LOGS
Chronological record of a computer’s activity, which makes up a journal of events that took place in
programs and systems over a given period.
Figure 56: Logs
Copyright NETASQ 2009
engde_nrmonitor-v8.0.3engde_nrmonitor-v8.0.3
Page 85 / 104
USER GUIDE: 7. LOGS
7.2 LOG TYPES
7.2.1 Traffic
NETASQ REAL-TIME MONITOR in NETASQ’s Administration Suite is a real time NETASQ Firewall
monitoring tool. Therefore it does not allow long-term log tracking but nonetheless allows you to view a
substantial amount of the most recent logs. You may configure the number of log lines you wish to view in
the monitor’s options. (See Part 2/Chapter 4: Default monitoring parameters).
Figure 57: Traffic
By clicking on the Traffic menu, the following data is displayed:
Rule
Number of the rule that corresponds to this rule’s identifier in a filter slot.
Time
Date and time log line was generated
Source
Source IP address or resolved name
Source address
Source port
Source interface
Destination
Destination address
Destination port
User
Data sent
Data received
Copyright NETASQ 2009
IP address or name of the source host
Source port number
Source interface
Destination IP address or resolved name
IP address of the destination host of the packet that caused the alarm to be
raised.
Destination port number
Identifier of the authenticated user.
Amount of data sent
Amount of data received
engde_nrmonitor-v8.0.3engde_nrmonitor-v8.0.3
Page 86 / 104
USER GUIDE: 7. LOGS
Duration
IP
Protocol
Connection duration
Indicates the name of the internet protocol.
Connection protocol
Operation
Protocol’s identified command
Parameter
Operation parameter
7.2.2 Filters
Figure 58: Filter
By clicking on the Filters menu, the following data is displayed:
Rule
Number of the rule that corresponds to this rule’s identifier in a filter slot.
Date
Date and time the entry was generated
Action
Protocol
Source
Action applied to the packet. (Examples: "Pass", "Block")
Action "Deleg": delegates a global policy that authorizes the writing of a local rule
(within the limit of this global rule).
Indicates the name of the IP
Source IP address or name
Source address
IP address of the packet’s source host.
Source port
Source port number (only if TCP/UDP).
Source interface
Destination
Source interface.
Destination IP address
Destination address
IP address of the packet’s destination host.
Destination port
Destination port number (only if TCP/UDP).
User
Copyright NETASQ 2009
Identifier of the authenticated user.
engde_nrmonitor-v8.0.3engde_nrmonitor-v8.0.3
Page 87 / 104
USER GUIDE: 7. LOGS
Message
Description of the alarm.
7.2.3 VPN
Figure 59: VPN
The following data is displayed when you click on the VPN menu:
Date
Error level
Phase
Source
Source address
Date and time the entry was generated
Error message
SA negotiation phase
Connection source address (tunnel initiator).
IP address or name of the source
Destination
Destination IP address or name
Destination
address
Message
IP address of the destination host of the packet that caused the alarm to be raised.
Message informing of an attempt to set up a tunnel.
Incoming SPI
Identity of the peer indicated in pre-shared key configuration where “IP address”
has not been specified as the identity type.
SPI number of the negotiated incoming SA (in hexadecimal).
Outgoing SPI
SPI number of the negotiated outgoing SA.
Peer identity
Cookie
(incoming
outgoing)
Copyright NETASQ 2009
Temporary identity markers for the initiator and recipient of the negotiation.
engde_nrmonitor-v8.0.3engde_nrmonitor-v8.0.3
Page 88 / 104
USER GUIDE: 7. LOGS
7.2.4 System
Figure 60: System
The following data is displayed when you click on the System menu:
Date
Service
Message
Copyright NETASQ 2009
Date and time entry was generated
Name of the service
Indicates the action applied.
engde_nrmonitor-v8.0.3engde_nrmonitor-v8.0.3
Page 89 / 104
USER GUIDE: APPENDICES
APPENDICES
Appendix A: FAQ
1). what is the meaning of the message “Impossible to locate the machine on x.x.x.x”?
2). How can I check the IP address (es) really assigned to the Firewall?
3). what is the meaning of the message ‘You lost the MODIFY privilege’?
4). what is the meaning of the message ‘The operation has exceeded the allotted time’?
5). How do I stop the major alarm warning indicator on the Firewall?
6). How do I know if there has been an attempted intrusion?
7). what happens when the Firewall sets off an alarm?
8). It is possible to allow protocols other than IP?
1) What is the meaning of the message “Impossible to locate the machine on
x.x.x.x”?
This message means that the host on which you are connected cannot reach the Firewall by the IP address
you have specified in the connection window. This may be for one of several reasons.
Check:
That the IP address which you have specified in the connection window is that of the Firewall (that of the
internal interface in advanced mode),
That your host has indeed a different IP address from the Firewall but is on the same sub-network,
That the connections are properly in place (use a crossover cable only if you are connecting the Firewall
directly to a host or a router. Type "arp -a" in a DOS window under Windows to see if the PC recognizes the
NETASQ Firewall’s physical address (Ethernet). If it doesn’t, check your cables and the physical
connections to your hub…
That you have not changed the Firewall’s operating mode (transparent or advanced),
That the Firewall recognizes the IP address (see “How can I check the IP address (es) really assigned to
the Firewall?”).
That the access provider for the graphical interface has not been deactivated on the Firewall.
2) How can I check the IP address (es) really assigned to the Firewall?
If you wish to check the IP address (es) or the operating mode (transparent or advanced) you need only
connect to the Firewall in console mode. To do so you can either conduct an SSH session on the Firewall (if
SSH is active and authorized) or connect directly to the appliance by the serial port or by connecting a
screen and a keyboard to the appliance.
Once connected in console mode (with the admin login) type the command ifinfo. This will give you the
network adapter configuration and the present operating mode.
3) What is the meaning of the message ‘You lost the MODIFY privilege’?
Copyright NETASQ 2009
engde_nrmonitor-v8.0.3engde_nrmonitor-v8.0.3
Page 90 / 104
USER GUIDE: APPENDICES
Only one user can be connected to the Firewall with the MODIFY privilege. This message means that a user
has already opened a session with this privilege. In order to force this session to close, you need only
connect, adding an exclamation mark before the user’s name (!admin).
WARNING
If an administrator session is open on another machine with the MODIFY right, it will be closed.
4) What is the meaning of the message ‘The operation has exceeded the
allotted time’?
As a security measure any connection between the Firewall and the graphic interface is disconnected after a
given time whether finished or not. In particular, this prevents an indefinite wait for a connection if the
Firewall cannot be reached via the network.
5) How do I stop the major alarm warning indicator on the Firewall?
The major alarm LED lights up as soon as a major alarm is received and it remains alight as long as no one
validates the alarm display.
To stop the LED, validate the option Switch off LEDs in the firewall menu in NETASQ UNIFIED MANAGER.
6) How do I know if there has been an attempted intrusion?
Each attempted intrusion triggers a major or minor alarm, depending on its gravity and configuration. You
are informed of these alarms in four ways:
Firstly the LEDs on the front panel of the appliance light up (red) or flicker (yellow) to alert you.
Then the alarms are logged in a specific file which you can consult from the graphical interface (NETASQ
REAL-TIME MONITOR or NETASQ EVENT REPORTER),
You can receive an alarm report at regular intervals (see Receiving alarms) via the NETASQ UNIFIED
MANAGER application, which can be configured so that whenever an alarm is raised, an e-mail is sent.
When several alarms are raised in a short period, they will be sent in a collective e-mail
Finally NETASQ REAL-TIME MONITOR displays on the screen the alarms received in real time.
7) What happens when the firewall raises an alarm?
All intrusion attempts or detected attacks are automatically thwarted. Depending on the configuration, the
packet that caused the alarm to be raised will either be blocked, or the connection will be reset. Moreover,
an action can be added: sending an e-mail to the administrator or quarantining the packet behind the alarm.
Quarantining involves blocking all packets originating from the host in question.
In the case of open hacking, you should closely monitor incoming connections with the NETASQ REALTIME MONITOR or NETASQ EVENT REPORTER or other network analysis tools.
8) It is possible to allow protocols other than IP?
The NETASQ Firewall can only analyze IP-based protocols. All protocols that the Firewall does not analyze
are regarded as suspicious and are blocked.
However, in transparent mode, Novell’s IPX, IPv6, PPPoE, AppleTalk and NetBIOS protocols may be
allowed through even though they are not analyzed.
Copyright NETASQ 2009
engde_nrmonitor-v8.0.3engde_nrmonitor-v8.0.3
Page 91 / 104
USER GUIDE: APPENDICES
Appendix C: NETASQ log files
The treatment of traffic passing through Firewalls requires the generation of logs containing descriptions of
all events that arose. Depending on the type of event encountered, these logs will be recorded in specific
NETASQ log files.
There are 17 types of log files available on NETASQ firewalls: "Alarm", "Auth", "Connection", "Count",
"Filter", "Monitor", "Natstat", "Plugin", "Filterstat", "Pop3", "Pvm", "Server", "Smtp", "System", "Vpn", "Web",
"Xvpn".
The names used for these log files are rather self-explanatory:
Alarm
Is used for alarms generated by ASQ in Firewalls (filter rules and “System” events which have a “minor” or
“major” attribute are logged in this file), and its source is NETASQ’s IPS engine – ASQ,
Example
The Firewall’s ASQ logs an attempted FTP bounce on a server protected by the Firewall (this
traffic is blocked by default and raises a minor alarm).
The information saved in this log file is as follows:
Date Time (time)
Priority (pri)
Class (class)
Rule
Action (action)
Source interface
(srcif)
Protocol (proto)
Source (src)
Date and time on which the line in the log file was generated at the firewall’s local
time. . (Example: Fri. March 9 15:46:04 2007)
The level of the alarm (minor or major).
Detailed category in which the alarm is found (Examples: Filters, Protocol,
System, Pattern…)
Rule number. All the rules are numbered, so this number allows identifying the
rule uniquely in a filter slot. (Example: 24).
Filter rule action. (Example: Block, Pass).
Source interface.
Analyzed protocol or Destination Port.
IP address of the source.
Destination (dst)
IP address of the destination
Destination Port
(dstport)
Message (msg)
Port number of the destination (only if it is TCP/UDP)
(Pktlen)
(Pktdump)
Copyright NETASQ 2009
Detailed description about the alarm
Length of the captured network packet.
Available network packet.
engde_nrmonitor-v8.0.3engde_nrmonitor-v8.0.3
Page 92 / 104
USER GUIDE: APPENDICES
Connection
Is used for connections made to and from the Firewall, and its source is NETASQ’s IPS engine – ASQ,
Example
The Firewall’s ASQ kernel logs the connection from the host 192.168.0.2 and from port 1672 to the
host 192.168.1.2 to port 1840.
The information saved in this log file is as follows:
Identifier (Id)
Firewall’s identifier.
Date Time (time)
Firewall (fw)
Date and time on which the line in the log file was generated at the firewall’s local
time.
Firewall’s serial number or name (if known).
Timezone (tz)
Firewall’s timezone at the moment of writing the log
Saved at
(startime)
Time at which event was recorded
Priority (pri)
The level of the alarm (minor or major).
Slotlevel
Number of the filter policy.
Rule ID (ruleid)
Rule identifier.
User
Identifier of the user requesting authentication
Source interface
(srcif)
Source interface
name (srcifname)
Internet Protocol
(ipproto)
Dst Interface
(dstif)
Dst Interface
name (dstifname)
Network card of the source interface.
Protocol (proto)
Analyzed protocol or Destination Port
Source (src)
Source address of the connection.
Source Port
(srcport)
Port number of the source (only if it is TCP/UDP)
Source name
(srcname)
Destination (dst)
User’s hostname.
Destination Port
(dstport)
Destination name
(dstname)
Sent
Port number of the destination (only if it is TCP/UDP)
Received (rcvd)
Number of bytes received.
Duration
Duration of the connection.
Copyright NETASQ 2009
Name of the source interface (only if it is known).
IP
Network card of the destination interface
Name of the destination interface (only if it is known)
IP address of the destination
Name of the destination (only if it is known)
Number of bytes sent.
engde_nrmonitor-v8.0.3engde_nrmonitor-v8.0.3
Page 93 / 104
USER GUIDE: APPENDICES
Filter
Is used for filter-generated logs (an entry is recorded each time a filter rule set to “Log” applies to the traffic
passing through the Firewall), and its source is NETASQ’s IPS engine – ASQ:
Example
The Firewall’s ASQ kernel logs the event of filter rule 3 (which has been set to “Log”) being used for
the treatment of a packet passing through the Firewall.
The information saved in this log file is as follows:
Identifier (Id)
Date Time (time)
Firewall (fw)
Timezone (tz)
Saved at (startime)
Priority (pri)
Slotlevel
Rule ID (ruleid)
User
Source interface
(srcif)
Source interface name
(srcifname)
Internet Protocol
(ipproto)
Protocol (proto)
Source (src)
Source Port (srcport)
Source name
(srcname)
Destination (dst)
Destination Port
(dstport)
Dst Port name
(dstportname)
Destination name
(dstname)
Copyright NETASQ 2009
Firewall’s identifier.
Date and time on which the line in the log file was generated at the firewall’s local
time.
Firewall’s serial number or name (if known).
Firewall’s timezone at the moment of writing the log
Time at which event was recorded
The level of the alarm (minor or major).
Number of the active filter policy.
Rule identifier.
Identifier of the user requesting authentication
Interface of the firewall on which the alarm was raised (Network card of the
source interface.
Name of the source interface (only if it is known).
IP
Analyzed protocol or Destination Port.
IP address of the source.
Port number of the source (only if it is TCP/UDP)
Name of the source (only if it is known).
IP address of the destination
Port number of the destination (only if it is TCP/UDP)
Name of the destination port (only if it is known)
Name of the destination (only if it is known)
engde_nrmonitor-v8.0.3engde_nrmonitor-v8.0.3
Page 94 / 104
USER GUIDE: APPENDICES
System
Is used for operations (“System” events which have not been configured to be raised as alarms are logged in
this file). This file has several sources – various Firewall processes (DNS, DHCP, etc services).
Example
The NETASQ UTM logs the startup of the Firewall authentication module.
The information saved in this log file is as follows:
Identifier (Id)
Date Time (time)
Firewall (fw)
Timezone (tz)
Saved at
(startime)
Service (service)
Message (msg)
Identifier of the entity that caused the entry to be logged. This field always has the
value “firewall”.
Date and time on which the line in the log file was generated at the firewall’s local
time.
Firewall’s serial number or name (if known).
Firewall’s timezone at the moment of writing the log
Time at which event was recorded
Name of the writing service.
Explains the action of the service that generated this log.
VPN
Is used for events related to IPSec VPN policies.
Example
The VPN module logs the creation of an IPSec VPN tunnel between the gateways
192.168.12.35 and 47.89.69.215.
The information saved in this log file is as follows:
Identifier (Id)
Date Time (time)
Firewall (fw)
Timezone (tz)
Saved at
(startime)
Error message
(error)
Phase (phase)
Source (src)
Source name
(srcname)
Destination (dst)
Destination name
(dstname)
Copyright NETASQ 2009
Identifier of the entity that caused the entry to be logged. This field always has the
value “firewall”.
Date and time on which the line in the log file was generated at the firewall’s local
time.
Firewall’s serial number or name (if known).
Firewall’s timezone at the moment of writing the log
Time at which event was recorded
Error message.
SA negotiation phase
Source address of the connection
Name of the source (only if it is known).
IP address of the destination
Name of the destination (only if it is known)
engde_nrmonitor-v8.0.3engde_nrmonitor-v8.0.3
Page 95 / 104
USER GUIDE: APPENDICES
(cookie_i)
Initiator’s temporary identity marker.
(cookie_r)
Responder’s temporary identity marker
(spi_in)
(spi_out)
Message (msg)
SPI number of the negotiated incoming SA (in hexadecimal).
SPI number of the negotiated outgoing SA
Description of the negotiation phase (Example: "Phase established”).
As indicated above, ASQ, the central process of all NETASQ Firewalls, supplies the four main log files with
the relevant data. Of all these files, the one that seems most important is without a doubt the “alarm” file
which takes into account illegal events (not related to filters), which constitute attacks against the system.
WARNING
The classification of logs here is from a “System” point of view, although certain changes are made
via the NETASQ Administration Suite for the display of logs.
Example
For example, logs corresponding to web traffic are displayed in Reporter under the section “File” –
“Web”. These logs correspond to the “web” file and to the logs associated with the HTTP plugin in
the “plugin” file.
Format of log files
Log files are text files. A log corresponds to a line ending with the characters CR (Carriage Return, or OD in
hexadecimal) and LF (Line Feed, or 0A in hexadecimal).
The lines are in WELF format.
Blocked packets and allowed packets
In each log line, it is important to locate the “Action” token, as it enables identifying packets which have been
allowed (by the filter policy or because they had not been blocked by the ASQ analyses) when the “Action”
has been set to “Pass”, and packets which have been blocked (which are either uneventfully deleted by the
Firewall or deleted after a reinitialization has been sent to the packet’s source host – this information is not
available to Firewall administrators) when the “Action” has been set to “Block”.
Logs regarding the change of time on firewalls
When the Firewall’s time is reset, a special line will be written in all log files, according to the example below:
id=firewall time="2003-12-29 16:35:32"fw="U700XXA0Z0899020"tz=+0100
startime="2003-12-29 16:30:10"datechange=1 duration=322
The “datechange=1” token means that the time was reset and “duration” refers to the lag in seconds.
Exceptions on tokens
Certain log files do not exactly follow the WELF format. These exceptions will be listed in the following
section.
Exceptions that are common to all logs
Copyright NETASQ 2009
engde_nrmonitor-v8.0.3engde_nrmonitor-v8.0.3
Page 96 / 104
USER GUIDE: APPENDICES
“Rule” is replaced with “ruleid”,
The “time” token refers to the time (firewall’s local time) at which the line in the log file was saved,
“Tz” indicates the time difference from the firewall’s time at the moment the log was written. Therefore it is
possible to find out the time of the log in international time and to analyze attacks launched simultaneously
on equipment in different countries,
“Startime” states the time at which a connection started. If the connection lasts for an hour, the “time”
would be roughly equal to “startime” plus one hour,
“Groupid” The FTP plugin indicates a number that is found for all FTP child connections,
“Dstif”, “srcif”, “dstifname”, and “srcifname” refer to the firewall’s source and destination interfaces with
their names,
“User” in several logs corresponds the names of persons authenticated via “authd”,
“Icmptype” and “icmpcode” correspond respectively to the ICMP type and code in alarm logs.
SYSTEM log
Proxies also write events particular to their operation in this log.
"Service" corresponds to the name of the writing service.
"Msg" explains the action of the service that generated this log.
Appendix D: Session and user privileges
Session privileges:
Base
Other
Log
Filter
VPN
URL
PKI
Object
User
Admin
Network
Route
Maintenance
ASQ
Globalobject
Globalfilter
Globalother
PVM
HA
User privileges:
Modify
Base
Other
Log
Filter
VPN
URL
Copyright NETASQ 2009
engde_nrmonitor-v8.0.3engde_nrmonitor-v8.0.3
Page 97 / 104
USER GUIDE: APPENDICES
PKI
Object
User
Admin
Network
Route
Maintenance
ASQ
Globalobject
Globalfilter
Globalother
PVM
HA
Network
RO for "Read Only"
W for "Write" – modification privileges
M for "Mon_Write" – modification privileges on Monitor only
Appendix E: SA states
-
Undetermined
Larval
The SA is in the process of being negotiated or has not been completely negotiated.
Mature
The SA has been established and is available; the VPN tunnel has been correctly set
up.
The SA will soon expire; A new SA is in the progress of being negotiated.
Dying
Dead
Orphan
The SA has expired and cannot be used; The tunnel has not been set up and is
therefore no longer active.
A problem has arisen, in general this status means that the tunnel has been set up in
only one direction.
Appendix F: Sort criteria
For each menu in NETASQ REAL-TIME MONITOR, a “Column” field will enable sorting. The sorting criteria
vary according to the menu
Overview
<All>
Auto connection
Read only
Status
Name
Address
User
Model
Firmware
Active Update
SEISMO
Antivirus
Backup version
Latest alarms
Vulnerabilities
Copyright NETASQ 2009
engde_nrmonitor-v8.0.3engde_nrmonitor-v8.0.3
Page 98 / 104
USER GUIDE: APPENDICES
Global filter
Filter
VPN
URL
NAT
Uptime
Session
Comments
Alarms
<All>
Date
Sensitive
Copy
Priority
ID
Content
Rule
Action
Interface
IP
Protocol
Source
Source address
Destination
Destination address
Destination port
Message
Packet
SEISMO
<All>
Severity
Name
Affected hosts
Family
Target
Exploit
Solution
Release
ID
Machines
<All>
Name
Address
Users
OS version
Vulnerabilities
Software
Events
Open ports
Last SEISMO event
Interface
Incoming bytes
Outgoing bytes
Copyright NETASQ 2009
engde_nrmonitor-v8.0.3engde_nrmonitor-v8.0.3
Page 99 / 104
USER GUIDE: APPENDICES
Incoming throughput
Outgoing throughput
Interfaces
<All>
Name
Type
Address/Mask
Incoming throughput
Outgoing throughput
Connections
Media
Bandwidth
Stats
Quality of service
<All>
QID
Incoming throughput
Outgoing throughput
Incoming packets
Outgoing packets
Rejected incoming packets
Rejected outgoing packets
Incoming bytes
Outgoing bytes
Users
<All>
Name
Group
Address
Expiry
Dynamic address lists
<All>
Elements
Type
Expiry
VPN Tunnels
<All>
Source
Source address
Bytes
Destination
Destination address
Status
Lifetime
Authentication
Encryption
Spi Out
Copyright NETASQ 2009
engde_nrmonitor-v8.0.3engde_nrmonitor-v8.0.3
Page 100 / 104
USER GUIDE: APPENDICES
Spi In
Reqid Out
Reqid In
Services
<All>
Status
Name
Uptime
Version
Last update
License expiry
VPN Policy
<All>
Source
Source address
Source router
Src. Gateway addr.
Direction
Protocol
Destination router
Dest. Gateway addr.
Destination
Destination address
Level
Max. lifetime
Negotiated SAs
Traffic
<All>
Rule
Time
Source
Source address
Source port
Source interface
Destination
Destination address
Destination port
User
Sent data
Received data
Duration
IP
Protocol
Operation
Parameters
Filterse
<All>
Rule
Date
Action
Copyright NETASQ 2009
engde_nrmonitor-v8.0.3engde_nrmonitor-v8.0.3
Page 101 / 104
USER GUIDE: APPENDICES
Protocol
Source
Source address
Source port
Source interface
Destination
Destination address
Destination port
User
Message
VPN
<All>
Date
Error level
Phase
Source
Source address
Destination
Destination address
Message
Identity of remote peer
Spi Out
Spi In
Cookie (incoming/outgoing)
Role
Remote network
Local network
System
<All>
Date
Service
Message
Copyright NETASQ 2009
engde_nrmonitor-v8.0.3engde_nrmonitor-v8.0.3
Page 102 / 104
USER GUIDE: GLOSSARY
GLOSSARY
100BaseT
Also known as "Fast Ethernet," 100BaseT is Ethernet in 100 Mbps instead of the standard 10 Mbps.
Like regular Ethernet, Fast Ethernet is a shared media network in which all nodes share the 100
Mbps bandwidth.
A
Active Update
The Active Update module on NETASQ firewalls enables updating antivirus and ASQ contextual
signature databases as well as the list of antispam servers and the URLs used in dynamic URL
filtering.
Address book
A centralized tool for several NETASQ applications. This address book can contain all the
necessary information for connecting to a list of firewalls, simplifying the administrator’s access as he
no longer has to remember all the different passwords this entails.
Address translation
Changing an address into another. For example, assemblers and compilers translate symbolic
addresses into machine addresses. Virtual memory systems translate a virtual address into a real
address (address resolution)
Advanced mode (Router)
Configuration mode in which the firewall acts as a router between its different interfaces. This
involves changes in IP addresses on routers or servers when you move them to a different network
(behind an interface on a different network)
AES (Advanced Encryption Standard)
A secret key cryptography method that uses keys ranging from 128 to 256 bits. AES is more
powerful and secure than Triple DES, until recently the de facto standard.
Alias IP
A supplementary address associated with an interface.
Antispam
System that allows the reduction of the number of unsolicited and occasionally malicious electronic
messages that flood mail systems and attempt to abuse users.
Antispyware
System that enables detecting and/or blocking the spread of spy software (which gathers personal
information about the user in order to transmit it to a third party) on client workstations.
Copyright NETASQ 2009
engde_nrmonitor-v8.0.3engde_nrmonitor-v8.0.3
Page 103 / 104
USER GUIDE: GLOSSARY
Antivirus
System that detects and/or eradicates viruses and worms.
Antivirus (Kaspersky)
An integrated antivirus program developed by Kaspersky Labs which detects and eradicates viruses
in real time. As new viruses are discovered, the signature database has to be updated in order for
the antivirus program to be effective
Appliance
Hardware that embeds the software as well as its operating system.
Asic (Application-Specific Integrated Circuit)
Specially-designed technology for a handful of specific features. These features are directly
managed by the circuit instead of the software. ASICs cannot be reprogrammed.
ASQ (Active Security Qualification)
Technology which offers NETASQ Firewalls not only a very high security level but also powerful
configuration help and administration tools. This intrusion prevention and detection engine integrates
an IPS which detects and gets rid of any malicious activity in real time.
Asymmetrical cryptography
A type of cryptographic algorithm that uses different keys for encryption and decryption.
Asymmetrical cryptography is often slower than symmetrical cryptography and is used for key
exchange and digital signatures. RSA and Diffie-Hellman are examples of asymmetrical algorithms.
Authentication
The process of verifying a user's identity or origin of a transmitted message, providing the assurance
that the entity (user, host, etc.) requesting access is really the entity it claims to be. Authentication
can also refer to the procedure of ensuring that a transaction has not been tampered with.
Authentication header (AH)
Set of data allowing verification that contents of a packet have not been modified and also to validate
the identity of a sender.
B
Backup appliance
Formerly known as a "slave", a backup appliance is used in high availability. It transparently takes
over the master appliance's operations when the former breaks down, thereby ensuring the system
to continue functioning with minimum inconvenience to the network's users.
Bandwidth
The transmission capacity of an electronic pathway (e.g. communications lines). It is measured in
bits per second or bytes per second in a digital line and in an analog line, it is measured in Hertz
(cycles per second).
Blowfish
A secret key cryptography method that uses keys ranging from 32 to 448 bits as a free replacement
for DES or IDEA.
Copyright NETASQ 2009
engde_nrmonitor-v8.0.3engde_nrmonitor-v8.0.3
Page 104 / 104
USER GUIDE: GLOSSARY
Bridge
Device connecting 2 LAN segments together, which may be of similar or dissimilar types (eg,
Ethernet and Token Ring). The bridge is inserted into a network to segment it and keep traffic
contained within segments to improve performance. Bridges learn from experience and build and
maintain address tables of the nodes on the network. By keeping track of which station
acknowledged receipt of the address, they learn which nodes belong to the segment.
Bridge or transparent mode
The transparent mode, also know as "bridge", allows keeping the same address range between
interfaces. It behaves like a filtering bridge, meaning that all the network traffic passes through it.
However, it is possible to subsequently filter traffic that passes through it according to your needs
and to therefore protect certain portions of the network
Brute force attack
An exhaustive and determined method of testing all possible combinations, one by one, to find out a
password or secret key by trial and error. This method only works when the sought after password
contains very few characters.
This attack can be thwarted simply by choosing longer passwords or keys, which the intruder will
take longer to find out.
Buffer
Temporary storage zone.
Buffering
Temporary storage of information for the purpose of processing it at one go, instead of as and when
it is received.
Buffer overflow
An attack which usually works by sending more data than a buffer can contain so as to make a
program crash (a buffer is a temporary memory zone used by an application). The aim of this attack
is to exploit the crash and overwrite part of the application's code and insert malicious code, which
will be run after it has entered memory.
C
CA Certificate (or Certification)
Authority - A trusted third-party company or organization which issues digital certificates. Its role is to
guarantee that the holder of the certificate is indeed who he claims to be. CAs are critical in data
security and electronic commerce because they guarantee that parties exchanging information are
really who they claim to be.
Certificate
(See digital certificate)
Copyright NETASQ 2009
engde_nrmonitor-v8.0.3engde_nrmonitor-v8.0.3
Page 105 / 105
USER GUIDE: GLOSSARY
Certificate Revocation List (CRL)
A list of expired (revoked) certificates or of those that are no longer considered trustworthy. It is
published and regularly maintained by a CA to ensure the validity of existing certificates.
Challenge/response
An authentication method for verifying the legitimacy of users logging onto the network wherein a
user is prompted (the challenge) to provide some private information (the response). When a user
logs on, the server uses account information to send a "challenge" number back to the user. The
user enters the number into a credit-card sized token card that generates a response which is sent
back to the server.
Chassis
Also called a case, it is a physical structure that serves as a support for electronic components. At
least one chassis is required in every computer system in order to house circuit boards and wiring.
Context
The current status, condition or mode of a system.
Common criteria
The common criteria, an international standard, evaluate (on an Evaluation Assurance Level or EAL
scale of 1 to 7) a product’s capacity to provide security functions for which it had been designed, as
well as the quality of its life cycle (development, production, delivery, putting into service, update).
Contextual signature
An attack signature, i.e., the form that an attack takes. ASQ relies on a database of contextual
signatures to detect known attacks in a short time.
CPU (Central Processing Unit)
Better known as a processor, this is an internal firewall resource that performs the necessary
calculations.
Cryptography
The practice of encrypting and decrypting data.
D
Daemon
An application that runs permanently in the background on an operating system.
Datagram
An information block sent over a communication line within a network.
Data Encryption Standard (DES)
Cryptographic algorithm for the encryption of data. In particular, it allows encrypting data by blocks.
Data evasion
Copyright NETASQ 2009
engde_nrmonitor-v8.0.3engde_nrmonitor-v8.0.3
Page 106 / 106
USER GUIDE: GLOSSARY
Also known as IDS evasion, it is a hacker's method of tricking an intrusion detection system by
presenting to it packets formed from similar headers but which contain data different from what the
client host will receive.
Denial of service (DoS) attack
An attack which floods a network with so many requests that regular traffic is slowed down or
completely interrupted, preventing legitimate requests from being processed.
DHCP (Dynamic Host Configuration Protocol)
Protocol that allows a connected host to dynamically obtain its configuration (mainly its network
configuration). DHCP finds its own IP address. The aim of this protocol is to simplify network
administration.
Dialup
Interface on which the modem is connected.
Diffie-Hellmann key exchange algorithm
An algorithm that enables parties to exchange public keys securely in order to arrive at a shared
secret key at both ends, without ever having to transmit the secret key, thereby avoiding the risk of
the secret key being intercepted. It does not carry out data encryption, and can even be used over
entrusted channels.
Digital certificate
The digital equivalent of an identity card for use in a public key encryption system, these are mainly
used to verify that a user sending a message is who he claims to be, and to provide the receiver of a
message with a way to encrypt his reply. The X.509 format is most typically used and contains
information regarding the user and the certification authority.
Digital signature
Method of verifying identities on a network based on public key encryption.
DMZ (Demilitarized Zone)
Buffer zone of an enterprise's network, situated between the local network and the internet, behind
the firewall. It corresponds to an intermediary network grouping together public servers (HTTP,
SMTP, FTP, etc.) and whose aim is to avoid any direct connection with the internal network in order
to warn it of any external attack from the web.
DNS (Domain Name System)
Distributed database and server system which ensures the translation of domain names used by
internet users into IP addresses to be used by computers, in order for messages to be sent from one
site to another on the network.
Dynamic quarantine
An imposed quarantine following a specific event, e.g., when a particular alarm is raised.
Dynamic routing
Routing that adapts automatically to changes that arise on a network so that packets can be
transported via the best route possible.
Copyright NETASQ 2009
engde_nrmonitor-v8.0.3engde_nrmonitor-v8.0.3
Page 107 / 107
USER GUIDE: GLOSSARY
E
Encapsulation
A method of transmitting multiple protocols within the same network. The frames of one type of
protocol are carried within the frames of another.
Encryption
The process of translating raw data (known as plaintext) into a seemingly meaningless version
(ciphertext) to protect the confidentiality, integrity and authenticity of the original data. A secret key is
usually needed to unscramble (decrypt) the ciphertext.
Ethernet
Packet switching information network protocol, a technology that allows all hosts on a local network
to connect to the same communication line.
Ethernet port
(See Ethernet).
F
Filtering router
Router which implements packet filters.
Filter policy
One of the more important aspects in the security of the resources that the firewall protects – the
creation of filter rules that allow avoiding network flaws.
Filter rule
A rule created to perform several possible actions on incoming or outgoing packets. Possible actions
include blocking, letting through or disregarding a packet. Rules may also be configured to generate
alarms which will inform the administrator of a certain type of packet passing through.
Firewall
A basic feature in peripheral information security, a firewall can be a hardware or software that
allows filtering access to and from the company network.
Firmware
Software that allows a component to run before the drivers.
FTP (File Transfer protocol)
Common internet protocol used for exchanging files between systems. Unlike other TCP/IP
protocols, FTP uses two connections – one for exchanging parameters and another for the actual
data.
Full duplex
Copyright NETASQ 2009
engde_nrmonitor-v8.0.3engde_nrmonitor-v8.0.3
Page 108 / 108
USER GUIDE: GLOSSARY
Two-way communication in which sending and receiving can be simultaneous.
G
Gateway
Host which acts as an entrance or connection point between two networks (such as an internal
network and the internet) which use the same protocols.
Gigabit Ethernet
An Ethernet technology that raises transmission speed to 1 Gbps (1000Mbps).
H
Half-duplex
One-way communication mode in which data can only be sent in one direction at a time.
Hash function
An algorithm that converts text of a variable length to an output of fixed size. The hash function is
often used in creating digital signatures.
Header
A temporary set of information that is added to the beginning of the text in order to transfer it over the
network. A header usually contains source and destination addresses as well as data that describe
the contents of the message.
High availability
A solution based on a group of two identical Firewalls which monitor each other. If there is a
malfunction in the Firewall software or hardware during use, the second Firewall takes over. This
switch from one Firewall to the other is wholly transparent to the user.
Hot swap
The ability to pull out a device from a system and plug in a new one while the power is still on and
the unit is still running, all while having the operating system recognize the change automatically.
HTTP
Protocol used for transferring hypertext documents between a web server and a web client.
HTTP Proxy
A proxy server that specializes in HTML (Web page) transactions.
Hub
A central connection point in a network that links segments of a LAN.
Hub and spoke
Copyright NETASQ 2009
engde_nrmonitor-v8.0.3engde_nrmonitor-v8.0.3
Page 109 / 109
USER GUIDE: GLOSSARY
Any architecture that uses a central connecting point that is able to reach all nodes on the periphery
(“spokes”).
Hybrid mode
Mode which combines two operation modes - transparent mode (bridge principle) and advanced
mode (independent interfaces). The purpose of the hybrid mode is to operate several interfaces in
the same address class and others in different address classes.
Hypertext
Term used for text which contains links to other related information. Hypertext is used on the World
Wide Web to link two different locations which contain information on similar subjects.
I
ICMP (Internet Control Message Protocol)
A TCP/IP protocol used to send error and control messages and for exchanging control information.
IDS (Intrusion Detection System)
Software that detects attacks on a network or computer system without blocking them.
IKE (Internet Key Exchange)
A method for establishing an SA which authenticates the encryption and authentication algorithms to
be applied on the datagrams that it covers, as well as the associated keys.
Implicit filter rule
Filter rule that the firewall implicitly generates after the administrator has modified its configuration.
For example, when the http proxy is activated, a set of implicit filter rules will be generated in order to
allow connections between the client and the proxy as well as between the proxy and the server.
Interface
A zone, whether real or virtual, that separates two elements. The interface thus refers to what the
other element need to know about the other in order to operate correctly.
Internet Protocol
Protocol used for routing packets over networks. Its role is to select the best path for conveying
packets through the networks.
IP Address
(IP being Internet Protocol). An IP address is expressed in four sets of numbers (from 0 to 255)
separated by dots, and which identify computers on the internet
IPS (Intrusion Prevention System)
System that enables detecting and blocking intrusion attempts, from the Network level to the
Application level in the OSI model.
IPSEC
Copyright NETASQ 2009
engde_nrmonitor-v8.0.3engde_nrmonitor-v8.0.3
Page 110 / 110
USER GUIDE: GLOSSARY
A set of security protocols that provides authentication and encryption over the internet and supports
secure exchanges. It is largely used for the setup of VPNs (Virtual Private Networks).
ISAKMP (Internet Security Association and Key Management Protocol)
A protocol through which trusted transactions between TCP/IP entities are established.
K
Kernel
The core of the operating system.
L
LAN (Local Area Network)
A communications network that is spread out over a limited area, usually a building or a group of
buildings and uses clients and servers - the "clients" being a user's PC which makes requests and
the "servers" being the machine that supplies the programs or data requested.
LDAP (Lightweight Directory Access Protocol)
A protocol or set of protocols used to access directory listings.
Leased line
A permanent telephone connection between two points, as opposed to dialup. Typically used by
enterprises to connect remote offices.
Load balancing
Distribution of processing and communications activity across a computer network to available
resources so that servers do not face the risk of being overwhelmed by incoming requests.
Logs
A record of user activity for the purpose of analyzing network activity.
M
MAC address (Media Access Control Address)
A hardware address that physically identifies each node of a network and is stored on a network
card or similar network interface. It is used for attributing a unique address at the data link level in
the OSI model.
Man-in-the-middle attack
Also known as a "replay attack", this consists of a security breach in which information is stored
without the user's authorization and retransmitted, giving the receiver the impression that he is
participating in an authorized operation. As a result of this, an attacker can intercept keys and
Copyright NETASQ 2009
engde_nrmonitor-v8.0.3engde_nrmonitor-v8.0.3
Page 111 / 111
USER GUIDE: GLOSSARY
replace them with his own without the legitimate parties' knowledge that they are communicating
with an attacker in the middle.
MAP
This translation type allows converting an IP address (or n IP addresses) into another (or n IP
addresses) when going through the firewall, regardless of the connection source.
Modularity
Term describing a system that has been divided into smaller subsystems which interact with each
other.
MSS (Maximum Segment Size)
MSS value represents the largest amount of data (in bytes) that a host or any other communication
device van contain in a single unfragmented frame. To get the best yield possible, the size of the
data segment and the header have to be lower than the MTU.
N
NAT (Network address Translation)
Mechanism situated on a router that allows matching internal IP addresses (which are not unique
and are often unroutable) from one domain to a set of unique and routable external addresses. This
helps to deal with the shortage of IPv4 addresses on the internet as the IPv6 protocol has a larger
addressing capacity.
NETASQ EVENT REPORTER
Module in NETASQ’s Administration Suite that allows viewing log information generated by firewalls.
NETASQ REAL-TIME MONITOR
Module in NETASQ’s Administration Suite that allows viewing the firewall’s activity in real time.
NETASQ Shield
Security agent that protects Microsoft Windows® workstations and servers by integrating NETASQ’s
ASQ technology.
NETASQ UNIFIED MANAGER
Module in NETASQ’s Administration Suite that allows configuring firewalls.
Non-repudiation
The capacity of parties involved in a transaction to attest to the participation of the other person in
the said transaction.
NTP (Network Time Protocol)
Protocol that allows synchronizing clocks on an information system using a network of packets of
variable latency.
Copyright NETASQ 2009
engde_nrmonitor-v8.0.3engde_nrmonitor-v8.0.3
Page 112 / 112
USER GUIDE: GLOSSARY
O
Object
Objects used in the configuration of filter or address translation. These may be hosts, users,
address ranges, networks, service, protocols, groups, user groups and network groups.
OS detection
A method of determining the operating system and other characteristics of a remote host, using tools
such as queso or nmap.
OSI
International standard defined by ISO describing a generic 7-layer model for the interconnection of
heterogeneous network systems. The most commonly-used layers are the “Network” layer, which is
linked to IP, the “Transport” layer, linked to TCP and UDP and the “Application” layer, which
corresponds to application protocols (SMTP, HTTP, HTTPS, IMAP, Telnet, NNTP…).
P
Pack
Refers to a unit of information transported over a network. Packets contain headers (which contain
information on the packet and its data) and useful data to be transmitted to a particular destination.
Packet analyzer
When an alarm is raised on a NETASQ Firewall, the packet that caused this alarm to be raised can
be viewed. To be able to do so, a packet viewing tool like “Ethereal” or “Packetyzer” is necessary.
Specify the selected tool in the Packet analyzer field, which Reporter will use in order to display
malicious packets.
Partition
A section of disk or memory that is reserved for a particular application.
PAT (Port Address Translation)
Modification of the addresses of the sender and recipient on data packets. Changes in IP address
involve the PAT device's external IP address, and port numbers, instead of IP addresses, are used
to identify different hosts on the internal network. PAT allows many computers to share one IP
address.
Peer-to-peer
Workstation-to-workstation link enabling easy exchange of files and information through a specific
software. This system does not require a central server, thus making it difficult to monitor.
Ping (Packet Internet Groper)
An internet utility used to determine whether a particular IP address is accessible (or online). It is
used to test and debug a network and to troubleshoot internet connections by sending out a packet
to the specified address and waiting for a response.
PKI (Public Key Infrastructure)
A system of digital certificates, Certificate Authorities and other registration authorities which verify
and authenticate the validity of parties involved in an internet transaction.
Copyright NETASQ 2009
engde_nrmonitor-v8.0.3engde_nrmonitor-v8.0.3
Page 113 / 113
USER GUIDE: GLOSSARY
Plugin
An auxiliary program that adds a specific feature or service to a larger system and works with a
major software package to enhance its capacity.
Port redirection (REDIRECT)
The use of a single IP address to contact several servers.
Port scanning
A port scan is a technique that allows sending packets to an IP address with a different port each
time, in the hopes of finding open ports through which malicious data can be passed and discovering
flaws in the targeted system. Administrators use it to monitor hosts on their networks while hackers
use it in an attempt to compromise it.
PPP (Point-to-Point Protocol)
A method of connecting a computer to the internet. It provides point-to-point connections from router
to router and from host to network above synchronous and asynchronous circuits. It is the most
commonly used protocol for connecting to the internet on normal telephone lines.
PPPoE (Point-to-Point Protocol over Ethernet)
A protocol that benefits from the advantages of PPP (security through encryption, connection control,
etc). Often used on internet broadband connections via ADSL and cable.
PPTP (Point-to-Point Tunneling Protocol)
A protocol used to create a virtual private network (VPN) over the Internet. The internet being an
open network, PPTP is used to ensure that messages transmitted from one VPN node to another are
secure.
Private IP Address
Some IP address ranges can be used freely as private addresses on an Intranet, meaning, on a
local TCP/IP network. Private address ranges are
172.16.0.0 to 172.31.255.255
192.168.0.0 to 192.168.255.255
10.0.0.0 to 10.255.255.255
Private Key
One of two necessary keys in a public or asymmetrical key system. The private key is usually kept
secret by its owner.
Protocol analysis
A method of analysis and intrusion prevention that operates by comparing traffic against the
standards that define the protocols.
Protocols
A set of standardized rules which defines the format and manner of a communication between two
systems. Protocols are used in each layer of the OSI model.
Proxy
System whose function is to relay connections that it intercepts, or which have been addressed to it.
In this way, the proxy substitutes the initiator of the connection and fully recreates a new connection
Copyright NETASQ 2009
engde_nrmonitor-v8.0.3engde_nrmonitor-v8.0.3
Page 114 / 114
USER GUIDE: GLOSSARY
to the initial destination. Proxy systems can in particular be used to carry out cache or connection
filter operations.
Proxy server
(See Proxy).
Public key
One of two necessary keys in a public or asymmetrical key cryptography. The public key is usually
made known to the public.
PVM (Parallel Virtual Machine)
Software that enables using a set of UNIX workstations linked to a network much like a parallel
workstation.
Q
QID
QoS queue identifier.
QoS (Quality of Service)
A guaranteed throughput level in an information system that allows transporting a given type of traffic
in the right condition, i.e., in terms of availability and throughput. Network resources are as such
optimized and performance is guaranteed on critical applications.
R
RADIUS (Remote Authentication Dial-In User Service)
An access control protocol that uses a client-server method for centralizing authentication data. User
information is forwarded to a RADIUS server, which verifies the information, then authorizes or
prohibits access.
RAID (Redundant array of independent disks)
Hardware architecture that allows accelerating and securing access to data stored on hard disks
and/or making such access reliable. This method is based on the multiplication of hard disks.
Replay
Anti-replay protection means a hacker will not be able to re-send data that have already been
transmitted.
RFC (Request for Comments)
A series of documents which communicates information about the internet. Anyone can submit a
comment, but only the Internet Engineering Task Force (IETF) decides whether the comment should
become an RFC. A number is assigned to each RFC, and it does not change after it is published.
Any amendments to an original RFC are given a new number.
Copyright NETASQ 2009
engde_nrmonitor-v8.0.3engde_nrmonitor-v8.0.3
Page 115 / 115
USER GUIDE: GLOSSARY
Router
A network communication device that enables restricting domains and determining the next network
node to which the packet should be sent so that it reaches its destination fastest possible.
Routing protocol
A formula used by routers to determine the appropriate path onto which data should be forwarded.
With a routing protocol, a network can respond dynamically to changing conditions, otherwise all
routing decisions have to be predefined.
S
SA (Security Association)
VPN tunnel endpoint.
SCSI (Small computer system interface)
Standard that defines an interface between a computer and it(s) storage peripherals, known for its
reliability and performance.
Security policy
An organization's rules and regulations governing the properties and implementation of a network
security architecture.
SEISMO
Module that allows the network administrator to collect information in real time and to analyze it in
order to weed out possible vulnerabilities that may degrade the network. Some of its functions
include raising ASQ alarms and maintaining an optimal security policy.
Session key
A cryptographic key which is good for only one use and for a limited period. Upon the expiry of this
period, the key is destroyed, so that if the key is intercepted, data will not be compromised.
Signature
A code that can be attached to a message, uniquely identifying the sender. Like a written signature,
the purpose of a digital signature is to guarantee that the individual sending the message really is
who he claims to be.
Single-use password
A secure authentication method which deters the misuse of passwords by issuing a different
password for each new session.
Slot
Configuration files in the NETASQ UNIFIED MANAGER application, numbered from 01 to 10 and
which allow generating filter and NAT policies, for example.
SMTP (Simple Mail Transfer Protocol)
TCP/IP communication protocol used for electronic mail exchange over the internet.
Copyright NETASQ 2009
engde_nrmonitor-v8.0.3engde_nrmonitor-v8.0.3
Page 116 / 116
USER GUIDE: GLOSSARY
SMTP Proxy
A proxy server that specializes in SMTP (mail) transactions.
SNMP (Simple Network Management Protocol)
Communication protocol that allows network administrators to manage network devices and to
diagnose network incidents remotely.
SSH (Secure Shell)
Software providing secure logon for Windows and UNIX clients and servers.
SSL (Secure Socket Layer)
Protocol that secures exchanges over the internet. It provides a layer of security (authentication,
integrity, confidentiality) to the application protocols that it supports.
Star topology / Network
A LAN in which all terminals are connected to a central computer, hub or switch by point-to-point
links. A disadvantage of this method is that all data has to pass through the central point, thus raising
the risk of saturation.
Stateful Inspection
Method of filtering network connections invented by Check Point, based on keeping the connection
status. Packets are authorized only if they correspond to normal connections. If a filter rule allows
certain outgoing connections, it will implicitly allow incoming packets that correspond to the
responses of these connections.
Static quarantine
A quarantine that the administrator sets when configuring the firewall.
Symmetrical key cryptography
A type of cryptographic algorithm in which the same key is used for encryption and decryption. The
difficulty of this method lies in the transmission of the key to the legitimate user. DES, IDEA, RC2
and RC4 are examples of symmetrical key algorithms.
T
TCP (Transmission Control Protocol)
A reliable transport protocol in connected mode. The TCP session operates in three phases –
establishment of the connection, the transfer of data and the end of the connection.
Throughput
The speed at which a computer processes data, or the rate of information arriving at a particular
point in a network system. For a digital link, this means the number of bits transferred within a given
timeframe. For an internet connection, throughput is expressed in kbps (kilobits per second).
Trace route
Mechanism that detects the path a packet took to get from one point to another.
Copyright NETASQ 2009
engde_nrmonitor-v8.0.3engde_nrmonitor-v8.0.3
Page 117 / 117
USER GUIDE: GLOSSARY
Trojan horse
A code inserted into a seemingly benign program, which when executed, will perform fraudulent acts
such as information theft.
TTL (Time-to-Live)
The period during which information has to be kept or cached.
U
UDP (User Datagram Protocol)
One of the main communication protocols used by the internet, and part of the transport layer in the
TCP/IP stack.
This protocol enables a simple transmission of packets between two entities, each of which has
been defined by an IP address and a port number (to differentiate users connected on the same
host).
Unidirectional translation (MAP)
This translation type allows you to convert real IP addresses on your networks (internal, external or
DMZ) into a virtual IP address on another network (internal, external or DMZ) when passing through
the firewall.
URL filter
Service that enables limiting the consultation of certain websites. Filters can be created in
categories containing prohibited URLs (e.g. Porn, games, webmail sites, etc) or keywords.
URL (Uniform Resource Locator)
Character string used for reaching resources on the web. Informally, it is better known as a web
address.
User enrolment
When an authentication service has been set up, every authorized user has to be defined by creating
a “user” object. The larger the enterprise, the longer this task will take. NETASQ’s web enrolment
service makes this task easier. If the administrator has defined a PKI, “unknown” users will now
request the creation of their accounts and respective certificates.
UTM (Unified Threat Management)
Concept that consists of providing the most unified solution possible to counter multiple threats to
information security (viruses, worms, Trojan horses, intrusions, spyware, denials de service, etc).
V
VLAN (Virtual Local Area Network)
Network of computers which behave as if they are connected to the same network even if they may
be physically located on different segments of a LAN. VLAN configuration is done by software
instead of hardware, thereby making it very flexible.
Copyright NETASQ 2009
engde_nrmonitor-v8.0.3engde_nrmonitor-v8.0.3
Page 118 / 118
USER GUIDE: GLOSSARY
VPN (Virtual Private Network)
The interconnection of networks in a secure and transparent manner for participating applications
and protocols – generally used to link private networks to each other through the internet.
VPN keep alive
The artificial creation of traffic in order to remove the latency time which arises when a tunnel is
being set up and also to avoid certain problems in NAT.
VPN Tunnel
Virtual link which uses an insecure infrastructure such as the internet to enable secure
communications (authentication, integrity & confidentiality) between different network equipment.
W
WAN (Wireless Area Network)
Local wireless network.
Wi-Fi (Wireless Fidelity)
Technology allowing wireless access to a network.
Copyright NETASQ 2009
engde_nrmonitor-v8.0.3engde_nrmonitor-v8.0.3
Page 119 / 119