1
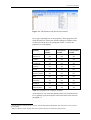
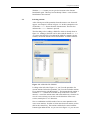
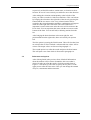
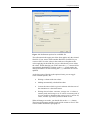
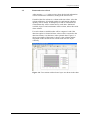
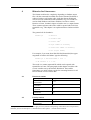
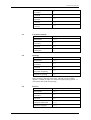
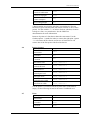
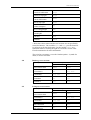
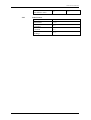
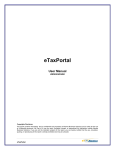
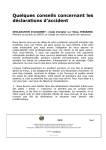
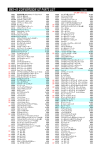
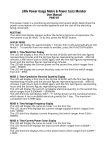
User’s Guide
Simona Workbook
SIMONA report number 08-01
User's Guide
Simona Workbook
A tool for easily importing histories in Excel.
Version
Maintenance
Copyright
:
:
:
1.4, November 2013
www.helpdeskwater.nl/waqua
Rijkswaterstaat
User’s Guide Simona Workbook
Log-sheet
document
version
date
Changes with respect to the previous version
1.0
22-01-2008
First version.
1.1
16-09-2008
Derived values added (with screenshots)
1.2
16-07-2010
Barrier Control added
1.3
11-10-2012
Simona-3835: if it is not possible to determine averages (derived values) print a minus sign in stead
of zero
1.4
27-11-2013
Compatible with Excel2010
User’s Guide Simona Workbook
Contents
1 General directions for use of the Simona Workbook .................. 2
2 Environment ............................................................................... 3
2.1 Requirements .......................................................................... 3
2.2 Installation .............................................................................. 3
2.3 Security and permissions ......................................................... 3
3 Using Simona Workbook ............................................................ 4
3.1 Starting the first time ............................................................... 4
3.2 The Simona menu ................................................................... 4
3.3 Selecting stations .................................................................... 6
3.4 Refinement and options ........................................................... 7
3.5 Finish and write to Excel ......................................................... 9
4 Histories for Linux-users ...........................................................10
4.1 Waterlevel stations .................................................................10
4.2 Velocity stations ....................................................................10
4.3 Constituent stations ................................................................11
4.4 Openings ...............................................................................11
4.5 Barriers..................................................................................11
4.6 Barrier Control.......................................................................12
4.7 Weirs.....................................................................................12
4.8 Discharge cross-sections.........................................................13
4.9 Transport cross-sections .........................................................13
4.10
Sinks/Sources..................................................................14
General directions for use of the Simona Workbook
1
General directions for use of the Simona
Workbook
The Simona Workbook is an Excel template which is providing an
easy way for importing time series in Excel. It’s most likely you even
get significant results within ten mouse clicks. The Simona
Workbook can be opened with Excel.
The workbook adds an extra button and menu to Excel (Excel2003).
In Excel2010 the menu can be found in the “Add-Ins” tab of Excel.
From the menu you can easily import all kinds of quantities, like:
waterlevels, currents, barriers, discharges at cross-sections, etc.
It’s made very easy to compare series of multiple SDS-files with
each other. The Simona Workbook gives you control over adjusting
the timescale of the series, layer selection. It’s also possible to
generate a default chart, add a column with time values and use
date/time instead of the time in minutes.
Version 1.4, November 2013
2
Environment
2
Environment
For the Simona Workbook it is not necessary to set environment
variables. The workbook is completely independent of any
environment variable. However there are still some issues which are
discussed in this chapter.
2.1
Requirements
Simona Workbook makes use of Getdata(.bat) from the Simona
installation. Therefore Simona must be installed including all
necessary third-party applications like Perl. Using the latest Simona
installation is recommended.
Because the Simona Workbook is packed in an Excel template,
Microsoft Office Excel is also required. The Simona Workbook is
tested with Excel 20001, Excel 2003 and Excel2010.
2.2
Installation
The installation of the Simona Workbook is quite simple; just use the
Simona Installer which comes with the CD. Make sure you enabled
the installation of the Simona Workbook.
When you are using Simona in a network environment and you can’t
make use of the installer, you could copy the Simona Workbook
manual. You have to copy the file simona_workbook.xlt from the
etc directory to the default Microsoft Office template location. In
most cases this is the following location:
“C:\Documents and Settings\<username>\Application
Data\Microsoft\Excel\XLSTART”
Be aware that the directory Application Data is default a hidden
directory. The easiest way going to this location is to open the start
menu, click on Run and then copy/paste the location.
2.3
Security and permissions
Because the use of Getdata, Simona Workbook needs the same
permissions which are necessary for Simona. Besides that, it needs
permission for writing to the registry. If the Simona Workbook can’t
write to the registry, it cannot store user settings, but it will still work
properly.
The security issue about running macro’s in Excel is discussed in
paragraph 3.1.
1
Microsoft Excel 2000 is another name for Microsoft Excel 9.0.
Version 1.4, November 2013
3
Using Simona Workbook
3
Using Simona Workbook
3.1
Starting the first time
In Excel2010 go to File --> Options --> Customize Ribbon and select
the ‘Developer’ option. In VB for Applications (Alt F11), switch off
Tools --> References "MISSING: RegistryWorx – Enables VB/VBA
Friendly ..".
To make use of the Simona Workbook, start Microsoft Excel as
usual. Then click at File and New in order to open a new workbook.
Office 2003 users and later should also click at the On my computer…
-link which appears at the right-hand side after creating a new
workbook. You should now be able to select and open the Simona
Workbook. If that isn’t the case take a close look at paragraph 2.2.
The non-Microsoft way of using the Simona Workbook is just to
double click the template from the simona\etc directory.
If you haven’t made use of the Simona Installer to install the Simona
workbook, the workbook doesn’t know the location of the Simona
Installation. So the first time opening the Simona Workbook it will
ask for that location. A new form will appear where the location to
the Simona Installation should be given, for example:
c:\simona\Simona2008_01. If the location to the Simona Installation
remains valid you will never be asked again; the value is stored in the
Windows registry. In order to change the location manually see
paragraph 3.2.
It may be, that nothing happens when you open the Simona
Workbook. Most likely the security level is very high. At this level,
Microsoft Excel denies every macro without asking. It’s completely
safe to decrease the security level to medium. Click on Tools, Macro
and Security. Then select the Security level Medium. Doing so,
Microsoft Excel will ask you to allow or deny potentially unsafe
macro’s. Of course the Simona Workbook is completely safe; so
when opening the workbook again you could safely enable the macro
inside the template.
3.2
The Simona menu
If the installation has gone well, you’ll see a new Simona button next
to the Help button, see figure 3-1. Clicking on the Simona button will
expand the menu. It’s a list with several quantities for stations and /
or cross-sections, it ends with the button Options.
Version 1.4, November 2013
4
Using Simona Workbook
Figure 3-1: The Simona menu (based on Excel2003)
Every type of quantity has its one properties. These properties will
affect the behavior of the forms and the callings to Getdata, which
are discussed in the next two paragraphs. Table 3-1 shows the
properties for each quantity.
Quantity
Layers
possible
Constituents
possible
Cross-sections
possible
Waterlevel
No
No
No
Current
Yes
No
No
Constituent
Yes
Yes
No
Opening
Yes
No
No
Barrier
No
No
No2
Barrier Control
No
No
No3
Weir
No
No
No
Discharge
No
No
Yes
Transport
No
Yes
Yes
Sinks/Sources
Yes
No
No
Table 3-1: Properties for each type of station
At the menu you can select the quantity which you are interested in.
Every quantity opens basically the same form which is discussed in
paragraph 3.3.
2
Actually barriers could be given at a cross-sections. But Simona Workbook will convert the cross-section to
several points.
3
Barrier Control is a mix of point- and cross-sections but they are treated as point-barriers.
Version 1.4, November 2013
5
Using Simona Workbook
With the Option button you can give the location to the Simona
Installation again. This may become handy if there’s a new Simona
Installation in the network.
3.3
Selecting stations
After clicking one of the quantities from the menu a new form will
appear. An example is shown in figure 3-2. In this example the user
clicked the Current button from the Simona menu. The title also
indicates the current buttons is pressed.
The first thing to do is adding a SDS-file, which is already done in
figure 3-2. Adding a SDS-file can be done with the button Add file.
As soon as the SDS-file is loaded and de SDS-file contains current
stations, all current stations will be listed under ‘Available stations’.
Figure 3-2: Added the file SDS-001
Looking at the left side of figure 3-2, you’ll see the quantities for
current stations. Below the quantities you’ll see the available stations.
Every station begins with the numeric 1. This means that de station is
related to sds 1, which can be found on top of the form. After the
numeric 1 comes the station-name and at the end the m,n-location. In
case of cross-sections you can also see the direction of the crosssection, namely the U or V-direction.
Now a combination could be made of one or more quantities with
one or more stations. In order to select more than one station, use the
shift or the control-key. The stations could also be sorted with the
buttons right under the list. As you can see in figure 3-2, you can sort
Version 1.4, November 2013
6
Using Simona Workbook
respectively at SDS-file number, station-name, m-location or the nlocation. In case of cross-sections you could also sort at the direction.
After making the selection station/quantity at the left side of the
form, you’ll have to make it a little more definitive. This can be done
by bringing the selection to the right side of the form by pressing the
button with the two arrows. Now every selected station will be
coupled to the selected quantities and these combinations will appear
in the list at the right side of the form. The order of that list is
important, because in the same order the series will be written to the
Excel sheet. You can reposition the items with the two arrows at the
bottom of the form. You can still add, or deleting stations from the
list.
After bringing the desired stations to the most right list, and
positioned them in the right order, there are basically two options
left:
The first option is pressing the Finish button. This will close the form
en write the data to Excel. Default a column with time values will be
written. The output values are discussed in paragraph 3.5.
The second option is to refine the results and press the Next button.
This will open a new form which is discussed in paragraph 3.4.
3.4
Refinement and options
After clicking finish in the previous form, default all information
about the stations will be written. Sometimes this is not what is
desired. In order to refine the results, click Next and the form of
Figure 3-3 will show up. The form is split up in two parts. Use the
upper part to refine the time-series. Here you can change the amount
of layers, constituents and the timescale.
Version 1.4, November 2013
7
Using Simona Workbook
Figure 3-3: Refinement options for each SDS file.
The refinement in the upper part of the form applies only the selected
SDS-file. If you want to refine another SDS-files click the file you
want to refine. Now the values in the textboxes will update to the
values applying for the SDS-file you just clicked and you can refine
the values. While changing one of the values the Apply button will be
automatically highlighted. Clicking on the Apply button makes the
changes definitive. So after clicking the Apply button the list will be
updated.
At the lower part of the form (the options-frame) you can toggle
some extended options, like:
·
Writing a column with time-values.
·
Making automatically a default line-chart
·
Convert the times which is given in minutes after the start of
the simulation to a data/time format.
·
Writing derived values: extremes, average over 13 values at
extreme peaks and average over 25 values at extreme peak. If
it is not possible to determine the average over 13 (and or 25)
values, a minus sign will be printed in stead of zero.
When all changes are made, you should click at the Finish button.
The form will disappear and the results will be written to Excel. This
will be further described in paragraph 3.5.
Version 1.4, November 2013
8
Using Simona Workbook
3.5
Finish and write to Excel
After pressing Finish in the previous form, the desired information
will be written in the worksheet, starting at the selected cell.
If enabled, the first column is a column with time-values. After the
column with times, all selected stations in combination with their
quantity will be written. If multiple layers and/or constituents are
selected then they will be written next to each other. Default all
available layers or/and constituents will be written, unless the results
where refined.
For each column a suitable header will be composed. And if the
date/time option is selected all time-values will be converted to the
date/time format, even the times in the optional chart. Figure 3-4
shows an example of the output. It shows a time column and the
magnitude of the current for two stations with each two layers
vertically.
Figure 3-4: Two stations with each two layers are shown in the chart
Version 1.4, November 2013
9
Histories for Linux-users
4
Histories for Linux-users
The Simona workbook is completely depending on Getdata output
files. All data extracted from SDS-files for the Simona Workbook is
achieved with several Getdata calls. Sadly the Simona Workbook
can’t be used in combination with OpenOffice.org so it couldn’t be
used on both Windows and Linux machines. In order to extract
histories at Linux, Getdata is improved with a new csv-output format.
These comma-separate-values-files could be opened with Calc from
OpenOffice.org. This chapter is an explanation how Getdata could be
use.
The general call for Getdata is:
Getdata.pl
–f SDS-file
–v variable name
-s station name
4
-k layer number if necessary
-l constituent number is necessary
-o csv (output format)
For example; if you want from SDS-file SDS-kustzuid3d, the upper
magnitude of station “M Juliana” type the following:
Getdata.pl –f SDS-kustzuid3d –v zcur
\\
–s “M Juliana” –l 1 –o csv
The result is a comma separated file which can be opened with
OpenOffice at Linux. The paragraphs in this chapter list tables with
several variables use by the Simona Workbook. These tables
functionate as a quick reference guide for extracting histories for all
kind of station or cross-section data.
4.1
4.2
Waterlevel stations
Quantity
Array name
station name
namwl
m-location
mwl
n-location
nwl
waterlevels
zwl
Velocity stations
Quantity
station name
Array name
namc
4
De option –s for station names doesn’t apply for weirs, barriers and openings. These don’t have unique names,
therefore you can use the option –i, that stands for index. Option –i 1 means the first station.
Version 1.4, November 2013
10
Histories for Linux-users
4.3
4.4
m-location
mwc
n-location
nwc
magnitude
zcur
u-velocity
zcuru
v-velocity
zcurv
Constituent stations
Quantity
Array name
station name
nampol
m-location
mpol
n-location
npol
constituents
gro
Openings
Quantity
Array name
station name
namope
m-location
kb1m
n-location
kb1n
start point of opening
tid1
end point of opening
tid2
Many openings share the same name. Therefor use the Getdata
options –i (stands for index) to extract the right opening. Option –i 1
will extract data of the first opening.
4.5
Barriers
Quantity
Array name
station name
nambar*
m-location
mbar
n-location
nbar
waterlevel left/bottom
basepa
waterlevel top/right
basepb
Version 1.4, November 2013
11
Histories for Linux-users
waterlevel left/bottom
bavela
waterlevel top/right
bavelb
volume transports
barq
loss of energyheight
cbuv
* Barrier-names are given for each line- or point-barrier. The m,n
location are given for each point (line-barrier consists of one or more
points). Use the variable ibuv in order to find out which m,n location
belongs to a line- or a point-barrier. See the LDS-Flow
documentation for more information.
Because all points of a line-barrier share the same name. Use the
Getdata options –i (stands for index) to extract the right point. Option
–i 1 will extract the first barrier and in case of line barrier it will
extract data of the first point of the first line-barrier.
4.6
Barrier Control
Quantity
Array name
station name
nambar
m-location
mbar
n-location
nbar
time barrier state
rrsbah, dimension 1
prefered sill level
rrsbah, dimension 2
actual sill level
rrsbah, dimension 3
prefered gate level
rrsbah, dimension 4
actual gate level
rrsbah, dimension 5
prefered barrier width
rrsbah, dimension 6
actual barrier width
rrsbah, dimension 7
Use the option –s to retrieve barriers by their name. If the name is
empty, use the following format for the name: NAMBAR-xxxx.
4.7
Weirs
Quantity
Array name
station name
*
m-location
mweir*
n-location
nweir*
Version 1.4, November 2013
12
Histories for Linux-users
waterlevel left/bottom
whsepa
waterlevel top/right
whsepb
velocity left/bottom
whvela
velocity top/right
whvelb
volume transports
whq
loss of energyheight
whde
waterheights
whh
velocities
whvel
condition
kwhcnd
* Weirs don’t have names and the m,n locations are not specifically
stored for histories. The variables mweir and nweir provide locations
for all weirs as for the whole map. Use the variable idxwei as a
translation table for locating the right m,n locations. See the LDSFlow documentation for more information.
The weirs have no names, so use the Getdata options –i (stands for
index) to extract weir data.
4.8
4.9
Discharge cross-sections
Quantity
Array name in the
u-direction
v-direction
cross-section name
namtra
namtrv
m-location(s)
mit
mit1, mit2
n-location(s)
nit1, nit2
nit1
momentum
ctr
ctrv
cumalative
fltr
fltrv
Transport cross-sections
Quantity
Array name in the
u-direction
v-direction
cross-section name
namtra
namtrv
m-location(s)
mit
mit1, mit2
n-location(s)
nit1, nit2
nit1
total constituent
adtr
adtrv
total advective
atr
atrv
Version 1.4, November 2013
13
Histories for Linux-users
total diffusive mass
4.10
Sinks/Sources
Quantity
dtr
Array name
station name
namdis
m-location
mdis
n-location
ndis
discharge
disch
Version 1.4, November 2013
dtrv
14