1
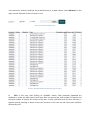
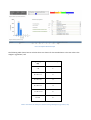
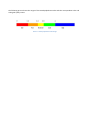
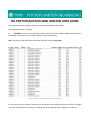
ISS PHYTOPLANCTON WEB VERSION USER GUIDE
This application allows registered users to calculate ISS value for their data.
The elaboration goes on 3 steps:
1.
UPLOAD: the user has to upload their data, that have to be in .xls or .xlsx format file that is
formatted in columns as shown below (data are only an example).
N.B. The name of the Data Sheet inside the Excel file has to be ISS_Data.
Picture 1: Data Input Model Example (Input Type ‘Weight’)
On this step user also choose if he wants to take directly the weight data from the Excel or weight
has to be calculated from volume by checking the corresponding choose (Weight or Volume).
If he checks the ‘Volume’ field user has to add a binary (0, 1) data column, called isDiatom, on the
right in which indicates if taxa is Diatom or not.
Picture 2: Detail on File Upload Step
Picture 3: Data Input Model Example (Input type 'Volume')
2.
TEST: in this step, after clicking on ‘FORMAT’ button, data previously uploaded are
validated to check the data type of each input field. At the end the total number of stations and
the total number of species are shown to the user. If some replicates have less than 20 items, a
specific warning message is shown to the user, because in this case the ISS value result could be
affected by error.
Picture 4: Detail on data validation step
3.
ACQUISITION: clicking on ‘RUN’ button user starts the data elaboration to calculate the ISS
value and the size class distribution for each Station. At the end the user can view the results in
table format by clicking on ‘ISS’ button. For each replicate are shown the six size classes with the
contribute to ISS. The sum of the six values is the ISS value, shown on ISS column. The ecological
quality status is a standard evaluation that depends on ISS value.
Picture 5:ISS Summary results with contribute to ISS for each size class
If user selects a specific row of the grid he can view detailed information on Replicate or Station, Ecosystem
or a group of Replicates inside the Station selected, respectively clicking on the correspondent button of
the selected row.
As in the example below user can view detailed information on the selected replicate, such as the total
population, the size class distribution (num. of individuals for each size class), the number of different taxa
found into the station and the number of individuals for each taxa (in the scrolling list on the right).
Picture 6: Replicate Details Example
The following table shows how to calculate the 6 size classes for the ISS Calculation. The start value is the
weight in pg Carbon / Cell
Log2 Weight
(w)
Class for ISS Phyto
<0
1
0 < w <= 3
2
3 < w <= 6
3
6 < w <= 9
4
9 < w <= 12
5
w > 12
6
Table 1: Size Classes for ISS Phyto in relation with log2 of Weight (in pg carbon / cell)
The following picture shows the ranges of the ISS Phytoplankton Index with the correspondent color and
ecological quality status.
Picture 7: ISS Phytoplankton Index Ranges