1
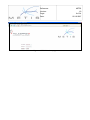
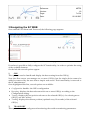
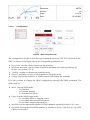
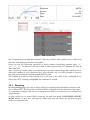
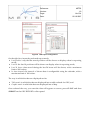
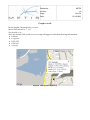
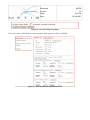
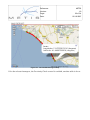
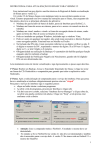
Reference: Version: METIS 1.0 Page: 1 of 24 Date: 02.10.2007 METIS Service Center WEB user manual Reference: Version: METIS 1.0 Page: 2 of 24 Date: 02.10.2007 Content of document 1 LIST OF ACRONYMS................................................................................................4 2 INTRODUCTION........................................................................................................5 2.1 Service Centre access ........................................................................................................................................... 5 3 NAVIGATING THE SC WEB............................................................................................7 3.1 OBU ............................................................................................................................................................................. 8 3.2.1 Configuration ........................................................................................................................................................... 8 3.2.1.1 State ........................................................................................................................................................... 9 3.2.1.2 Configuration .................................................................................................................................... 11 3.2.1.3 Messages .................................................................................................................................................. 12 3.2.1.4 Commands ............................................................................................................................................... 12 3.2.2 Reporting................................................................................................................................................. 13 3.2.3 Tracing .............................................................................................................................................................. 17 3.2.3 Tracking .................................................................................................................................................. 18 3.4.1 Configuration .................................................................................................................................................... 19 3.4.2 Monitoring......................................................................................................................................................... 22 Reference: Version: METIS 1.0 Page: 3 of 24 Date: 02.10.2007 List of Figures Figure 1 METIS Web front page.....................................................................................................6 Figure 2 METIS Web main page ...................................................................................................7 Figure 3 OBU configuration page.................................................................................................8 Figure 4 OBU state tab....................................................................................................................9 Figure 5 OBU configuration tab..................................................................................................11 Figure 6 OBU messages tab .........................................................................................................12 Figure 7 OBU command tab ........................................................................................................13 Figure 8 OBU report configuration ............................................................................................14 Figure 9 OBU graphic reporting .................................................................................................15 Figure 10 OBU table reporting ....................................................................................................16 Figure 11 OBU data in Excel format...........................................................................................17 Figure 12 OBU Tracing mode......................................................................................................17 Figure 13 OBU Tracking mode....................................................................................................18 Figure 14 New transport insertion .............................................................................................20 Figure 15 New transport leg........................................................................................................20 Figure 16 Corridor monitoring status ........................................................................................21 Figure 17 Corridor Monitoring information set .......................................................................21 Figure 18 Corridor Monitoring status........................................................................................22 Figure 19 Corridor Monitoring on map.....................................................................................23 Figure 20 Proximity check control ..............................................................................................24 List of Tables Table 1 OBU operating modes ....................................................................................................10 Reference: Version: 4 of 24 Date: 02.10.2007 E EGNOS European Geostationary Overlay System GPS Global Positioning System G GEOstationary N NMEA National Marine Electronics Association O OBU On Board Unit P PNR Pseudo Random Number S SBAS Space Based Augmentation System SC Service Centre T TPZ W Telespazio 1.0 Page: 1 List of acronyms GEO METIS Reference: Version: 2 METIS 1.0 Page: 5 of 24 Date: 02.10.2007 Introduction This manual is devoted to the using explanation of METIS Service Centre (SC), in order to handle the Tracking and Tracing features that will be available during the METIS Wide Demo. The SC has been developed and tested with the following version of Internet browsers: Explorer version 6.0.2800.1106, SP2 (Windows XP) Mozilla – Firefox (www.mozilla.org) version 2.0.0.7 If any problem occurs, please be sure that the browsers version you use is equal or higher that the ones above reported. 2.1 Service Centre access To access the SC main page, type the following link in your browsers: http://nat.newapplication.it/metisweb then fill the user name and password field with the following: User Name: metiswad3 Password: metiswad3 The SC performs a control over the logged user on the base of login used; different level of users are foreseen (i.e. Simple User, Advanced User and Administrator). The above cited User Name and Password are relevant with simple user profile, that does not allow any modification to the OBU(s) parameters. Once entered the User Name and Password, the following page should appear: Reference: Version: METIS 1.0 Page: 6 of 24 Date: 02.10.2007 Figure 1 METIS Web front page Reference: METIS Version: 1.0 Page: 7 of 24 Date: 02.10.2007 3 Navigating the SC WEB Once entered User Name and Password, the following page appears: Figure 2 METIS Web main page From here is possible to fully configure the SC functionality, in order to optimise the using of the available features. On the left side several options appear: 1) OBU This option is used to handle and display the data coming from the OBU(s). Note that fleet owner can manage one or more OUB(s), but the single device cannot be added or removed by the user from a simple web access. This functionality is reserved to the SC administrator. Once highlighted this line, several options are available: Configuration: handles the OBUs configuration Reporting: displays the data relevant with one or more OBU(s) according to the Configuration setting; Tracing: displays the last position relevant to the selected OBU(s)– for selecting more OBU(s), use the Ctrl key; Tracking: displays the current position (updated every 10 seconds) of the selected OBU(s). 2) TRANSPORT This option is used to configure and monitoring the corridor monitoring parameters. Reference: METIS Version: 1.0 Page: 8 of 24 Date: 02.10.2007 Once highlighted this line, several options are available: Configuration: to edit and display the transports characteristics; Monitoring: summary information about the different transport legs is displayed. 3.1 OBU From this menu, the user is able to handle the information coming from one or more OBU in a fully configurable way in terms of data display. 3.2.1 Configuration Once entered in this page the user can view the configuration for each OBU terminal simply clicking on the relevant name: Figure 3 OBU configuration page As shown in the figure above, the window is divided in four tab panels that, when clicked, display different as explained hereafter: State: show the current configuration of selected OBU ; Configuration: handle the OBU configuration through command sent to it; Messages: show terminal messages sent to TPZ Server; Commands: show commands sent from TPZ TCP/IP Server to OBU. The content of each tab panel is explained in the following sections. Note that during the METIS Wide Demo, only one OBU will be available; the other two currently shown in the image above are only for test purpose. Reference: Version: METIS 1.0 Page: 9 of 24 Date: 02.10.2007 3.2.1.1 State Figure 4 OBU state tab State page appears as soon the OBU has been chosen from the available list. In the first row (red backlight) is shown the name of the selected OBU. Several numerical fields are show (these fields are not editable by the user): Current report rate: shows the period (in minutes) of the data transmission; Position minimum movement: shows the maximum threshold allowed for OBU position change before issuing a new position report; Tracking: shows the current state of the tracking. The possible output are On (Running) or OFF (Idle Tracking). Mode: describes the way the terminal transmits data as a function of the values set in the Report rate and Position Movement fields. The mode code is hereafter explained: Reference: METIS Version: Mode 0 1 2 Report rate value X X=0 X>0 X=0 1.0 Page: 10 of 24 Date: 02.10.2007 Position movement value Y Behaviour Y=0 The terminal calls the server every 24 hours sending the position and in order to receive commands. (Low power mode) Y=0 The terminal connect to the server every X minutes and send a single sentences sequence, then wait for commands or drop the connection after timeout (20 sec) Y>0 If ext power is available the terminal connects and sends position only when the terminal moved more than Y meters. If no ext power is available X is set to 60 and terminal operates in mode 3 Every X minutes the terminal compares position acquired at time t0-x with time t0 and if position difference is greater than Y connects to the server and sends a single sentence sequence, then waits for commands or drops the connection after timeout (20 sec). 3 X>0 Y>0 If the difference is lower or equal than Y the terminal skips the transmission and waits for the next schedule. This is done for a maximum of 5 times after that the terminal starts a transmission. So, if the terminal is stationary, it will send data every X*5 minutes Table 1 OBU operating modes Battery level: shows the battery level of OBU ( in millivolt); External power level: shows if the terminal is externally powered and the value of power supply. The levels are expressed in millivolt. Reference: METIS Version: 3.2.1.2 1.0 Page: 11 of 24 Date: 02.10.2007 Configuration Figure 5 OBU configuration tab The configuration of OBU is done through command sent from TPZ TCP/IP Server to the OBU. As shown in the figure above, the configurable parameters are: Report rate: sets the current report rate (in minutes); Minimum movement: sets the value of position minimum movement parameter (in meters - see section 3.2.1.1); Tracking: enables or disables the tracking mode; Pollstat: performs a request to the terminal to check the status; Pollseq: requests the sequence of NMEA sentence filtered by the terminal. It is also possible to change the SBAS configuration through the SBAS command. The fields used are: Mode: sets the SBAS mode: 0= Disabled 1= Enabled Integrity 3 = Enabled Test mode; Usage: sets the SBAS usage mode: 0 = use SBAS GEOs as ranging source 1 = use SBAS Differential Corrections 2 = use SBAS Integrity Information; MaxSbas: sets the maximum number of SBAS channels searched (from 0 to 3) to use; ScanMode: scan mode SBAS PRN numbers to search for, if zero, auto-scan (i.e. all valid PRNs) are searched. Reference: Version: METIS 1.0 Page: 12 of 24 Date: 02.10.2007 Note: the using of this tab is available only for Advances Users and Administrator. 3.2.1.3 Messages The messages sent from the OBU, formatted as NMEA proprietary sentence, are stored in the SC database. They will be available via web in Message report table, in the following format: Figure 6 OBU messages tab 3.2.1.4 Commands The commands sent to the OBU, formatted as NMEA proprietary sentence, are stored in the SC database. They will be available via web in the Command report table, in the following format: Reference: Version: METIS 1.0 Page: 13 of 24 Date: 02.10.2007 Figure 7 OBU command tab The Command report table has a feature “filter by column” that enables users to filter and limit the data displayed within a long table. Users can use the following operators to filter columns containing numeric data: “<”, “<=”, “>”, “>=”. In that case, the user is able to filter data in base of Command ID, Date & Time and Sent. Also, at the top of table, there is another drop-down lists, named Page, that enable users to select the number of rows displayed in a page (default -10). It is also possible to remove the grid, just clicking the button named Remove grid. The column Sent shows if the command is or no sent to the OBU. If the command is not sent to the OBU, clicking on DELETE the command is erased. 3.2.2 Reporting In the Reporting page, the user is able to check (on request) the information relevant with one or more OBU. The list of the available OBU(s) is displayed in the left side of the page. To completely configure the reports coming from OBU(s), it is necessary to configure the output mode: At first, select one or more OBU(s) from the list and then push CONFIGURE OUTPUT MODE button. A new box will appear, where the user can insert the preferred report mode (see figure below): Reference: METIS Version: 1.0 Page: 14 of 24 Date: 02.10.2007 Figure 8 OBU report configuration On the right box, insert the preferred report mode: Last position: only the last stored position will be shown on display when in reporting mode; Last 10: the last 10 positions will be shown on display when in reporting mode; Last 24 hours: data stored during the last 24 hours will be shown, with a maximum limit of 100 values; In time interval: the interval of shown data is configurable using the calendar, with a maximum limit of 100 values. The way in which the data are displayed can be: Table mode: in which the data are displayed into a table ordered for OBU, and Graphic mode: in which the data are displayed into a Map. Once selected the way you want the data will appear on screen, press CLOSE and then SUBMIT on the OBU REPORT toolbox panel. Reference: METIS Version: 1.0 Page: 15 of 24 Date: 02.10.2007 Graphic mode In the graphic output mode, you can: Move with arrows (←↑→↓) Zoom with + or – Also, by double click on the icon a tool tip will appear with the following information: Latitude Longitude HPL/VPL GPS time Velocity Figure 9 OBU graphic reporting Reference: Version: METIS 1.0 Page: 16 of 24 Date: 02.10.2007 Table mode In table output mode you can benefit of the following Figure 10 OBU table reporting The meaning of the columns is hereafter reported: GPS status: 0 = No fix/Invalid, 1 = Standard GPS(2D/3D), 2 = Differential GPS, 3 = Estimated (DR) fix SISNET availability: 0= No SISNET, no DGPS 1= SISNET, no DGPS 2= Both SISNET and DGPS Note: for the METIS demonstration purposes this filed is not applicable. When in Table mode, the user is also able to download (on request) the information relevant with one or more OBU(s) in Excel spreadsheet format, just clicking in the OBU REPORT Toolbox the DOWNLOAD button (see figure below). Reference: METIS Version: 1.0 Page: 17 of 24 Date: 02.10.2007 Figure 11 OBU data in Excel format 3.2.3 Tracing In the Tracing page, the user is able to display on map the last position of the selected OBU(s): Figure 12 OBU Tracing mode Also, by double click on the icon a tool tip will appear with the following information: Latitude Longitude HPL/VPL GPS time Velocity Reference: Version: 3.2.3 METIS 1.0 Page: 18 of 24 Date: 02.10.2007 Tracking In the Tracking page, the user is able to monitor the OBU position (tracking) in real time. The current position of the selected OBU(s) is shown (on map display) until a new position data is available (differently from tracing mode, in which the data display is not automatically updated). To use the tracking mode, the user has to select the relevant OBU(s) and then presses submit to confirm the choice. The graphical layout is very similar to the one shown in the figure above, apart of a clock counter that highlight the current time and the time of the last update. Figure 13 OBU Tracking mode Reference: Version: METIS 1.0 Page: 19 of 24 Date: 02.10.2007 3.2 Transport This menu is primarily devoted for the transport operators. In fact, from here is possible to: Configure a transport; Monitor a transport, with or without the Proximity Check feature. A transport could be defined as the collection of different legs, each of them being a route with two nodes (a start marker and an end marker). Each marker is normally associated with a transport stop and can have a load/unload time. Each transport is defined as an association of: One OBU; A start time and duration; A route which is a collection of transport legs. The definition of different legs in a transport will permit to perform the so called Corridor Monitoring function. 3.4.1 Configuration The user can both display and create/modified a defined transport. Clicking on Insert new transport in the Transport toolbox, the user can create a transport with the following characteristics: - A description field; - Name of OBU (from the available ones); - Start time; - Thresholds range for time and space; - Enable Proximity Check control. Follow the necessary step to doing this: Clicking the INSERT NEW TRANSPORT button, the user is able to: insert a new transport leg from a drop-down list, assign it an load and an unload estimated time (express in minutes); enable proximity control and assign it an proximity threshold (express in kilometres). After that a new leg will appear on the transport leg list Reference: Version: METIS 1.0 Page: 20 of 24 Date: 02.10.2007 Figure 14 New transport insertion Figure 15 New transport leg From the list of the transport legs, the user will be able to update some parameters or remove one of that. After the insertion (if any) of new legs, to configure the Corridor Monitoring function the user can select the desired transport to use from the drop-down list of Transport Toolbox. Clicking the START/STOP button, the user is able to start, stop or end the Corridor Monitoring function for the specified transport. In addition, the text box named Corridor Monitor status will display the status of monitoring, as shown below: Reference: Version: METIS 1.0 Page: 21 of 24 Date: 02.10.2007 Figure 16 Corridor monitoring status For each route, a detailed set of information and options will be available: Figure 17 Corridor Monitoring information set Reference: Version: METIS 1.0 Page: 22 of 24 Date: 02.10.2007 3.4.2 Monitoring With the Transport monitoring console the user can check, the following information as regard the Corridor Monitoring: • • • • • Description: brief description of the route; Status: possible values are PLANNED, RUNNING or TERMINATED; ETA: Estimated Time of Arrival; Space offset /tolerance; Time offset /tolerance. Figure 18 Corridor Monitoring status By clicking TRACEONMAP link the user can directly see the selected route plan on map. Reference: Version: METIS 1.0 Page: 23 of 24 Date: 02.10.2007 Figure 19 Corridor Monitoring on map If for the selected transport, the Proximity Check control is enabled, another table is show. Reference: Version: METIS 1.0 Page: 24 of 24 Date: 02.10.2007 Figure 20 Proximity check control The Proximity Control table shows for each transport leg all proximity events: Leg Description: the transport leg description; Out From Planned Path: a Boolean field that describe if the transport doesn’t follow the planned path, for the selected transport leg; Date & Time IN / Marker: represents the date and time when the truck is into a planned warehouse for loading and consignment; Date & Time OUT / Marker: represents the date and time when the truck is out to a planned warehouse for loading and consignment; Date & Time /Proximity to Marker: represents the date and time when the truck is near to a planned warehouse for loading and consignment; Control Status: a Boolean field that describe if the Proximity Check is enabled for the selected transport leg.