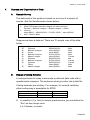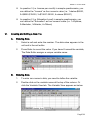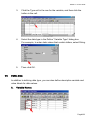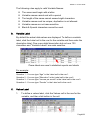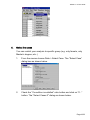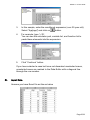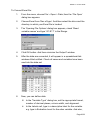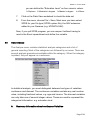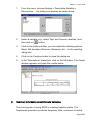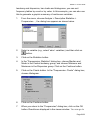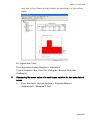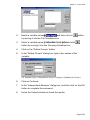
1
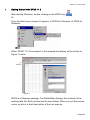
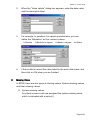
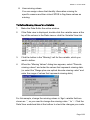
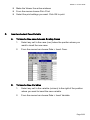
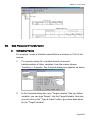
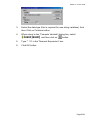
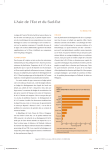
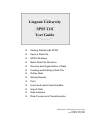
Lingnan University SPSS 11.0 User Guide Getting Started with SPSS Open a Data File SPSS Windows Basic Data File Structure Sources and Organization of Data Creating and Editing a Data File Define Data Saving Results Print Insert and select Case/Variable Import Data Data Analysis Data Process and Transformation Information Technology Services Centre Lingnan University Last Updated: Aug 2002 SPSS 11.0 User Guide I. Getting Started with SPSS 11.0 After starting Windows, double clicking on the SPSS icon Or . From the Start menu choose: Programs Æ SPSS for Windows Æ SPSS for Windows. When “SPSS 11.0 for windows” is first entered the display will be similar to Figure 1 below. Figure 1 SPSS is a Windows package. The Data Editor displays the contents of the working data file. Each window has its own toolbar. When you put the mouse cursor on a tool, a brief description of the tool pops up. Page2/23 SPSS 11.0 User Guide Main Menu SPSS for Windows is menu driven. Most of the features are accessed by selections from the menus. The main menu bar contains 10 menus are similar to other Windows applications, e.g. Microsoft Excel. File - To create a new SPSS file; open an existing file; or read in spreadsheet or database files created by other software program. Editor - To modify or copy text form the output or syntax windows. View - To define Toolbars, to change Fonts, Grid Lines, Value Labels. Data - To make global changes to SPSS data files, such as merging files, transposing variables and cases, or creating subsets of cases for analysis. Transform - To make changes to selected variables in the data file and to compute new variables based on the values of existing ones. These changes do not affect the permanent file unless you explicitly save the changes. Analyze - To select the various statistical procedures you want to use, such as crosstabs, analysis of variance, correlation, and linear regression. Graphs - Automatic Categories Plot displays information about how the terms in your automatically created categories relate to each other. Utilities - Display information on the contents of SPSS data files, define Variable Sets, Run Script. Window - To arrange, select, and control the attributes of various SPSS Windows. Help - Help window containing information on how to use the many features of SPSS. Context-sensitive help is also available through the dialog boxes. Page3/23 SPSS 11.0 User Guide II. Open a Data File From the Menus, Choose File Æ Open Æ Data Alternatively, you can use the Open File button File dialog box will appears. on the toolbar. The Open By default, SPSS-format data files (.sav extension) are displayed. You can display other file formats using the Files of Type drop-down list. Select a data file and click Open. The data file will display in the Data Editor III. SPSS Window A. The Data Editor Window The Data Editor provides a convenient, spreadsheet-like method for creating and editing data files. When you start a session, the Data Editor window opens automatically. The Data Editor provides two views of your data: Data view - Displays the actual data values or define value labels. Variable view. - Displays variable definition information, including defined variable and value labels, data type (for example, string, date, and numeric), measurement scale (nominal, ordinal, or scale), and user-defined missing values. In both views, you can add, change, and delete information contained in the data file. Note: Before you can analyze data, you need some data to analyze. Page4/23 SPSS 11.0 User Guide B. Output Window The Viewer window displays the tables, statistics, and charts. The Viewer opens automatically the first time you run a command that produces output. IV. Basic Data File Structure The Data Editor reflects the basic data file structure. Each row represents a case or an observations, each row corresponds to a unit to be analyzed. Each column represents a variable or characteristic being measured. And corresponds to type of recorded information. Each cell contains a single value of a variable for a case. You can enter and edit data in the Data Editor and use many different data types, i.e. Numeric, String (alphanumeric), Date, Dollar(currency). However, you can’t enter formulas or perform calculations in the Data Editor. Please use the Transform menu to calculations new values and variables and recode data. Page5/23 SPSS 11.0 User Guide V. Sources and Organization of Data A. Sample Survey The data used in this guide are based on a survey of a sample of income. And the Questionnaire shown below: 1. 2. 3. 4. Age? ____ What is the highest education degree you have received? Diploma / Bachelor’s degree / Master’s degree / Others Income? below $8000 / $8000-$15000 / $15001-25000 / above $25001 Sex? Female / Male Suppose we have a data set. There are 10 sample rows of the data below: Age 22 28 25 28 30 21 25 23 35 B. Education Diplomas Bachelor’s degree Others Bachelor’s degree Master’s degree Diplomas Bachelor’s degree Diplomas Others Master’s degree Income $8000-$15000 above $25001 below $8000 $15001-25000 above $25001 $8000-$15000 $15001-25000 $8000-$15000 below $8000 above $25001 Sex Male Male Male Male Female Mal Female Female Male Male Design a Coding Scheme A coding scheme is a way to associate a particular data code with a questionnaire response. The codes are what you enter into a data file. Coding schemes are arbitrary. For example, for nominal variables, either coding way is acceptable for SPSS. Numeric String (alphabetic) Female 0 “f” Male 1 “m” In question 4 (i.e. Sex) in sample questionnaire, you can define the “Sex” as two strings value (i.e. f=female, m=male). Page6/23 SPSS 11.0 User Guide VI. In question 3 (i.e. Income per month) in sample questionnaire, you can define the “Income” as four numeric value (i.e. 1=below $8000, 2=$8000-$15000, 3=$15001-25000, 4=above $25001) In question 2 (i.e. Education Level) in sample questionnaire, you can define the “Education” as four numeric value (i.e. 1=Diploma, 2=Bachelor, 3=Master, 4=Others) Creating and Editing a Data File A. B. Entering Data 1. Select a cell and enter the number. The data value appears in the cell and in the cell editor. 2. Press Enter to record the value. If you haven't named the variable, The Data Editor assigns a unique variable name. Entering Data 1. To enter non-numeric data, you need to define the variable. 2. Double-click on the variable name at the top of the column. Or click the Variable View tab. The Variable View appears as below. Page7/23 SPSS 11.0 User Guide VII. 3. Click the Type cell in the row for the variable, and then click the button in the cell. 4. Select the data type in the Define “Variable Type” dialog box. For example, to enter data values that contain letters, select String. 5. Then click OK. Define Data In addition to defining data type, you can also define descriptive variable and value labels for data values. A. Variable Names Page8/23 SPSS 11.0 User Guide The following rules apply to valid Variable Names: B. The name must begin with a letter. Variable names cannot end with a period The length of the name cannot exceed eight characters. Variable names must be unique; duplication is not allowed. Variable names are not case-sensitive. Blank & Special characters cannot be used. Variable Label By default the actual data values are displayed. To define a variable label, click the Label cell in the row for the variable and then enter the descriptive label. Give more detail description but not over 120 characters and “Variable Labels” are case sensitive. These labels are used in statistical reports and charts. For example: Question 1 - You can type “Age” in the Label cell in the row 1. Question 2 - You can type “Education” in the Label cell in the row 2. Question 3 - You can type “Income per month” in the Label cell in the row 3. Question 4 - You can type “Gender” in the Label cell in the row 4. C. Values Label 1. To define a values label, click the Values cell in the row for the variable, and then click button in the cell. Page9/23 SPSS 11.0 User Guide 2. When the “Value Labels” dialog box appears, enter the data value and the descriptive label. 3. For example, In question 2 in sample questionnaire, you can define the “Education” as four numeric values. 1=Diploma 4. D. 2=Bachelor’s degree 3=Master’s degree 4=Others Click on Add to record the value label for the each data value, and then click on OK when you are finished. Missing Value In SPSS, there are two types of missing values: System-missing values and User-missing values. System-missing values Any blank numeric cells are assigned the system-missing value, which is indicated with a period(.). Page10/23 SPSS 11.0 User Guide User-missing values. You can assign values that identify information missing for specific reasons and then intruct SPSS to flag these values as missing. To Define Missing Values for a Variable: 1. Make the Data Editor the active window. 2. If the Data view is displayed, double-click the variable name at the top of the column in the Data view or click the Variable View tab. 3. Click the button in the “Missing” cell for the variable, which you want to define. 4. When the “Missing Values” dialog box appears, select “Discrete missing values” and enter the values that represent missing data. (or select the “Range plus one optinal discrete missing value” and enter the range of values that represent missing data.) For this sample, change the missing values in ‘Age’ variable field are shown as ‘.’, so you need to change the missing value ‘.’ to ‘-’. Click the Data View worksheet tab at the bottom to check the changes you made. Page11/23 SPSS 11.0 User Guide All string values, including null or blank values, are considered valid values unless you explicitly define them as missing. To define null or blank values as missing for a string variable, enter a single space in one of the fields for Discrete missing values. VIII. Saving Results A. Data files You can save data file in SPSS, spreadsheet, database, or text format. When the data set has been correctly set up, save the data set as an SPSS system file. B. 1. From the menu, choose File > Save. 2. In the resulting dialog box, make sure that SPSS is selected by clicking on the radio-button next to it. 3. Choose the desired drive and directory by navigating through the list marked Directories. 4. In the box next to Name, type in the file name; add the SAV extension to the file name(e.g. income.sav). Output windows results Output window results – The output window contains the text-based results of your SPSS session. You can edit this output and save it in text files. To Save SPSS output file, make sure the output window is active. From the menu, choose File > Save. IX. Print You can print output file or selected portion. To Print output file and charts: Page12/23 SPSS 11.0 User Guide X. Make the Viewer the active windows From the menus choose File> Print Select the print settings you want. Click OK to print. Insert and select Case/Variable A. B. To Insert a New case between Existing Cases 1. Select any cell in the case (row) below the position where you want to insert the new case. 2. From the menus bar choose Data > Insert Case. To Insert a New Variables 1. Select any cell in the variable (column) to the right of the position where you want to insert the new variable. 2. From the menus bar choose Data > Insert Variable. Page13/23 SPSS 11.0 User Guide C. Select the cases You can restrict your analysis to specific group (e.g. only female, only Master’s degree, etc..) 1. From the menus choose Data > Select Case. The “Select Case” dialog box as shown below. 2. Check the “If condition is satisfied” ratio button and click on “If ..” button. The “Select Cases If” dialog as shown below. Page14/23 SPSS 11.0 User Guide 3. In this sample, enter the conditional expression (over 25 year old). Select “Age[age]” and click on button. 4. For example, type ‘> 25’. You can use the calculator pad, variable list, and function list to paste these elements into the expression. 5. Click “Continue” button. If you have selected a case but have not discarded unselected cases, unselected cases are marked in the Data Editor with a diagonal line through the row number. XI. Import Data Assume you have Excel file as like as below Page15/23 SPSS 11.0 User Guide To Convert Excel file: 1. From the menu, choose File > Open > Data, then the ‘File Open’ dialog box appears. 2. Choose Excel from ‘files of type’. And then select the drive and the directory in which your Excel file is located. 3. The ‘Opening File Options’ dialog box appears, check ‘Read variable names’ and type “A1:E11” in the Range. 4. Click OK button. And then minimize the Output1 window. 5. After the data are converted, it will appear in a spreadsheet-link windows titled untitled. Check all cases and variables have been read into the data set. 6. Now, you can define data In the “Variable Type” dialog box, set the appropriate format, number of decimal places, column width, and alignment. In the Labels cell, type in a descriptive label for the variable. e.g. type in Eudcation Level for the educ variable. And also, Page16/23 SPSS 11.0 User Guide you can define the “Education Level” as four numeric values. 1=Diploma 2=Bachelor’s degree 3=Master’s degree 4=Others 7. Click on the Data View worksheet to check the data set. 8. From the menu, choose File > Save. Mark sure you have select SPSS for your file type (SPSS system file), the SAV extension added to your filename (e.g. MYDATA.SAV). Now, if you quit SPSS program, you can reopen it without having to read in the Excel spreadsheet and define the variable. XII. Data Analysis The Analyze menu contains statistical analysis categories and a list of general reporting. Most of the categories are followed by an arrow. There are several analysis procedures available within the category. When the category is picked, they will appear on a submenu. In statistical analysis, you must distinguish between two types of variables: continuous and discreet. The continuous variables can take any real number value, including fractional values, e.g. age and income. The discreet variables can only take one of several integer values. These are used to represent the categorical information: e.g. education level. A. Summary information about continuous Variables Page17/23 SPSS 11.0 User Guide B. 1. From the menu, choose Analyze > Descriptive Statistics > Descriptives…, the dialog box appears as shown below. 2. Select a variable (e.g., select ‘Age’ and ‘Income’ variables.) and then click on button. 3. Click on the Options button, you can select the following options: Mean, Std deviation, Minimum, Maximum, etc…) in the resulting dialog box. 4. Click on the Continue button to close the dialog box. 5. In the “Descriptives” dialog box, click on the OK button. The Output window appears as shown the results below. Summary information about Discrete Variables The most popular of using SPSS is creating frequency table. The frequencies procedure produces frequency table, measures of central Page18/23 SPSS 11.0 User Guide tendency and dispersion, bar charts and histograms. you can sort frequency tables by count or by value. In this example, you can also use this to generate a graphic summary of continuous variables. 1. From the menu, choose Analyze > Descriptive Statistics > Frequencies…, the dialog box appears as shown below. 2. Select a variable (e.g., select ‘educ’ variables.) and then click on button. 3. Click on the Statistics button. 4. In the “Frequencies: Statistics” dialog box, choose Median and Mode in the Central tendency group, and choose Minimum and Maximum in the Dispersion group. Click on the Continue button. 5. Click on the Charts button. In the “Frequencies: Charts” dialog box, choose Histogram. 6. Click on the Continue button. 7. When you return to the “Frequencies” dialog box, click on the OK button. Results are displayed in the viewer window. You can go to Page19/23 SPSS 11.0 User Guide any item in the Viewer quickly simply by selecting it in the outline pane. For Interactive Chart: From the menu choose Graphics > Interactive … Type of Graphics: Bar, Line, Pie, Histogram, Boxplot, Error Bar, Scatterplot C. Comparing the mean value of a continuous variable for two sets data of cases 1. From the menu, choose Analyze > Compare Means > Independent – Samples T Test… Page20/23 SPSS 11.0 User Guide 2. Select a variable name and then click on by moving it into the Test Variables box. 3. Select a variable name and click button by moving it into the Grouping Variables box. 4. Click on the “Define Groups” button. 5. In the “Define Groups” dialog box, type in two values of the variable. button For example, type 1 (=Diploma) for Group 1 and type 3 (=Master) for Group 2. 6. Click on Continue. 7. In the “Independent-Samples” dialog box, and then click on the OK button to complete the command. 8. Active the Output window to check the results. Page21/23 SPSS 11.0 User Guide XIII. Data Process and Transformation A. Computing Values For example, create a Variable named Bonus and base on 15% of the income. 1. To compute values for a variable based on numeric transformations of other variables, from the menus choose Transform > Compute. The Compute dialog box appears as below. 2. In the Compute dialog box, give “Target variable” (like you define variable), you can type “Bonus” into the Target Variable. And also you can click on the “Type & Label” button, give more description for the “Target Variable”. Page22/23 SPSS 11.0 User Guide 3. Select the data type (this is required for new string variables). And then Click on Continue button. 4. When return to the “Compute Variable” dialog box, select and then click on button. 5. Type ‘* .15’ in the “Numeric Expression” box. 6. Click OK button. Page23/23