1
TMRPres2D – High quality
visual representation of
transmembrane protein
models
Version 0.91
User's manual
Ioannis C. Spyropoulos, Theodore D. Liakopoulos, Pantelis G. Bagos
and Stavros J. Hamodrakas
Department of Cell Biology and Biophysics, Faculty of Biology,
University of Athens, Panepistimiopolis, Athens 157 01, Greece
The Application Workspace
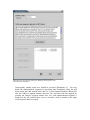
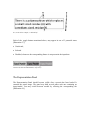
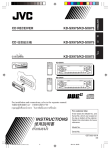
The Application Workspace is divided into 3 parts[Illustration 1]:
The Menu Bar, where the user can handle the basic input/export procedures.
The Tool Bar, where you can accomplish non-disfiguring scaling of the image and
adjust various appearance options.
The Representation Panel, where the actual image resides and all user interaction
takes place.
Illustration 1) The main application interface consists of 3 areas. Area 'A' is the Menu Bar, area 'B' is the
Tool Bar and area 'C' is the Representation Panel. This screenshot corresponds to printer-friendly output.
The Menu Bar
The Menu Bar is always visible and consists of three menus:
File
Export
About
'File' menu
The 'File' menu provides various available methods of data input to the application. The
'Input' submenu includes 4 options, corresponding to different data sources:
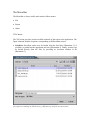
SwissProt: SwissProt entries may be loaded from the local disc [Illustration 2], if
available, or pasted into the appropriate text area [Illustration 4]. Finally, an entry can
be fetched directly from the web, by providing its Accession Number or ID
[Illustration 3].
Illustration 2) Window for loading a SwissProt entry from a local disc. The user has to locate and select a
file of plain text containing the desired entry(e.g 14kd_dauca.sp), and press the 'Open' button.
Illustration 3) Input form for downloading a SwissProt entry from the web. After providing the ID or the
Accession Number (eg ctr1_human) of the entry, the user can press 'OK' for download or 'Review entry'
in order to transfer the entry into the text area form [Illustration 4]
Illustration 4) Input form to paste an SwissProt entry in plain text. After pasting, the user should press the
'OK' button.
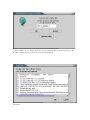
PIR: PIR entries may only be fetched from the web [Illustration 5], by providing the
appropriate ID.
Illustration 5) Input form for downloading a PIR entry from the WEB. After providing the id (eg A53663)
of the entry the user can press 'OK' for download.
PRED-TMR: Results from the PRED-TMR or PRED-TMR2 prediction algorithms
can be used to provide the application with the required information [Illustration 6]. A
valid way to provide a PRED-TMR or PRED-TMR2 result, would be to copy and
paste the whole webpage containing the output, as provided by the respective web
servers
(available
at
http://biophysics.biol.uoa.gr/PRED-TMR
and
http://biophysics.biol.uoa.gr/PRED-TMR2).
Illustration 6) Input form to paste the PRED-TMR output. Finally, 'OK' button has to be pressed.
HMMTOP: Results from the HMMTOP prediction algorithm can be used to feed the
data input process with the required information[Illustation 7]. A valid way to provide
an HMMTOP result, would be to copy and paste the whole webpage containing the
output,
as
provided
by
the
HMMTOP
2
web
server
at:
http://www.enzim.hu/hmmtop/index.html.
Illustration 7Input form for pasting the HMMTOP output. Finally, 'OK' button has to be pressed.
TMHMM: Results from the TMHMM prediction algorithm can be used to feed the
data input process with the required information[Illustation 8]. A valid way to provide
a TMHMM result, would be to copy and paste the whole webpage containing the
output,
as
provided
by
the
TMHMM
2.0
web
server
at:
http://www.cbs.dtu.dk/services/TMHMM/. Please note that the 'Extensive output form'
option should have has been selected.
Illustration 8)Input forms for pasting the TMHMM output and the actual sequence.
Finally, 'OK' button has to be pressed.
PRED-TMBB: Results from the PRED-TMBB prediction algorithm (transmembrane
topology predictions for beta-barrel outer membrane proteins) can be used to feed the
data input process with the required information[Illustation 9]. A valid way to provide
a PRED-TMBB result, would be to copy and paste the whole webpage containing a
prediction,
as
provided
by
the
PRED-TMBB
server
at:
http://bioinformatics.biol.uoa.gr/PRED-TMBB .
Illustration 9Input form for pasting the PRED-TMBB output. Finally, 'OK' button has to be pressed.
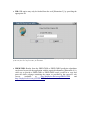
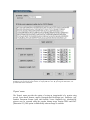
User defined: Input may be provided by manually filling a special input form
[Illustration 10]. The procedure consists of the following steps: You may optionally enter
a name for the sequence. The sequence (required) should be entered in the appropriate
text area, in plain text or FASTA format. When finished, you should press the 'Apply
sequence' button.
Illustration 10) Input form for filling user defined protein sequence and
transmembrane boundaries.
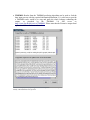
Consequently, another input area, should be activated [Illustration 11] You may
define the transmembrane segments by specifying their boundaries, using the pull
down menus provided, named 'From' and 'To'. A new segment should be added each
time the 'Add new segment' button is pressed. You can remove the last segment by
pressing the 'Remove segment' button once. For each transmembrane segment, a
number on the left (colored blue) serves as an index, while a number on the right
(colored green) shows its length.
Illustration 11) Input form for filling a user-defined protein sequence along with its transmembrane
boundaries. By pressing the 'Clear' button, all input fields are reset. By pressing the 'OK' button, the
provided data will be visualized.
'Export' menu
The 'Export' menu provides the option of saving an image/model of a protein using
several vector-based formats, namely Encapsulcated PostScript(.eps), PostScript (.ps),
Portable Document Format (.pdf) and Scalable Vector Graphics(.svg). Alternatively,
pictures may be exported using the popular bitmap image formats JPEG and PNG.
[Illustration 12]. This option is enabled only when an image is available.
Illustration 12) The export window, from the FreeHEP Java Library. From here one may select the
desirable format and name of the output file or set some advanced options..
'About' menu
The 'About' menu contains information about the authors and copyright of the
application.
The Tool Bar
The Tool Bar should appears after a protein has been loaded [Illustration 13]. It consists
of the following elements:
Illustration 13The Tool Bar consists of several toggle buttons and a slider, that control the appearance of
the output.
Scale slider: When you move the knob to the right, the scaling factor is increased, and
when you move it to the left, the scaling factor is reduced.
'Signal Peptide' toggle button: If signal peptide data are available, the Signal Peptide
toggle button appears enabled. When the button is activated, the signal peptide of the
protein appears as a magenta-colored chain.
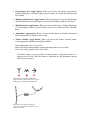
'Post-translational modifications' toggle button: When you activate this button,
special symbols [Illustration 14] should appear under residues for which posttranslational modification data are available.
'Glycosylation sites' toggle button: When you activate this button, glycosylation
symbols [Illustration 14] should appear above residues for which glycosylation data
are available.
'Binding of lipid moiety' toggle button: When this button is activated, lipid binding
symbols [Illustration 14] should appear at known lipid-binding residues in the chain.
'Disulfide bonds' toggle button: When you activate this button, a bridge [Illustration
15] would appear between any two residues known to be connected with a disulfide
bond.
'Annotation' toggle button: When you activate this button, any defined annotation
labels [Illustration 16] should become visible.
'Printer Friendly' toggle button: When you activate the Printer Friendly button,
several appearance parameters should be modified:
➔
➔
➔
the background color is set to white
the color of the transmembrane segment boundary indexes is set to black
the color of the peptide chain is set to black.
With these changes, you can produce an image capable to be printed exactly as it
appears on the screen. When the button is unpressed, the old appearance options
and colors are restored.
Illustration 14) Symbols for additional
sequenee data. A) Glycosylation site, Lipid
binding, Post-translational modification.
Illustration 15)A symbolic bridge for
representing a disulfide bond between two
residues of cystein.
Illustration 16)This text box contains an annotation for a residue. The direction of the text
box, in the above example, is 'bottom left'.
Each of the toggle buttons mentioned above, may appear in one of 3 potential states
[Illustration 17]:
Unselected,
Selected
Disabled, whenever the corresponding feature is not present in the input data.
Illustration 17) The 3 potential states of a toggle button.
Unselected, Selected and Disabled, respectively.
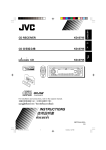
The Representation Panel
The Representation Panel should become visible after a protein has been loaded. It
contains the actual image. The panel may hold several panes each one containing an
image/model. You may switch between models by selecting the corresponding tab
[Illustration 18].
Illustration 18) A view of the Representation Panel. By selecting a tab (eg YREP_BUCTS) from area A, the
appropriate pane appears. The representation shown ('printer friendly' version), includes the most
common appearance elements: The cellular topology (B), lipid bilayer (C), transmembrane segment
boundaries (black numbers), sequence termini (D & E), transmembrane alpha-helices (F, G & H), nontransmembrane chains (loose loops).
Additional sequence features, namely signal peptides, post-translational modifications,
glycosylation sites and lipid bindings can be handled from the Tool Bar [Illustration 13]
and, whenever visible, are marked with special symbols [Illustration 14].
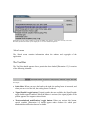
By pressing the pointer's right button while the representation area is focused, a pop-up
menu appears [Illustration 19]. Several appearance options may be configured using this
menu:
Illustration 19) Semi-expanded pop-up menu.
●
The 'Show/Hide Residue Names' radio buttons switch toggle the visibility of the
aminoacid type names, along the peptide chain. For example, output shown in
[Illustration 18] demonstrates the 'Show Residue Names' enabled.
●
The 'Coloring' submenu carries the coloring options, which may be applied to the
peptide chain. These are:
➔
➔
➔
coloring 'by Electrostatic Potential', according to the electrical charge
(assuming pH=7), by using blue for positive, red for negative and gray for
uncharged residues
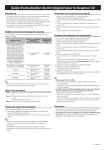
coloring 'by Hydrophobic Potential', based on an ad hoc hydrophobicity
scale [Illustration 20], by using a gradation from yellow to blue
applying a uniform user-defined color on the protein chain.
Illustration 20) Coloring by hydrophobic potential.
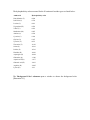
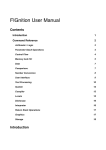
The hydrophobicity values assumed for the 20 aminoacid residue types are listed below:
Aminoacid
Hydrophobicity value
Phenylalanine (F)
0.804
Isoleucine (I)
0.734
Leucine (L)
0.612
Tryptophan (W)
0.582
Valine (V)
0.563
Methionine (M)
0.407
Alanine (A)
0.324
Cysteine (C)
0.184
Glycine (G)
0.147
Tyrosine (Y)
0.073
Threonine (T)
-0.129
Serine (S)
-0.216
Proline (P)
-0.516
Histidine (H)
-0.930
Asparagine (N)
-0.944
Glutamine (Q)
-1.300
Aspartic acid (D)
-1.877
Glutamic acid (E)
-2.033
Arginine (R)
-2.085
Lysine (K)
-2.23
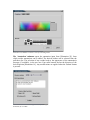
The 'Background Color' submenu opens a window to choose the background color
[Illustration 21].
Illustration 21) Window to choose a color for the background.
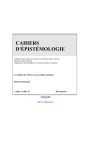
The 'Annotation' submenu opens the annotation input form [Illustration 22], from
which residue annotations can be added. The desired residue can be selected from the
pull-down list. The selection of any residue leads to the appearence of the annotation's
message (if available), in the text area. Four radio buttons declare the direction of the
box's depiction [Illustration 16]. Any modifications are applied when the 'Submit' button
is pressed.
Illustration 22)Window containing the details for adding
annotation for a residue.
The 'TransMembrane Region Style' submenu toggles between two styles of
visualizing transmembrane segments, that is, as alpha-helices or as beta-strands. The
default style, which is selected everytime a model is loaded, is the helix style.
The 'Alpha value' submenu adjusts the level of transparency of the depicted peptide
chain. 'High' alpha values correspond to low transparency, while 'Low' alpha values
correspond to high transparency.
By moving the pointer within the representation area while the pointer's left button is
pressed, the user can move the image towards a desired direction.