1
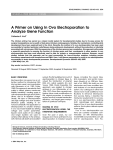
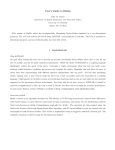
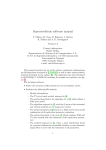
ZebIAT, Zebrafish Image Analysis Tool
User’s Manual
Contents
1.
Introduction .................................................................................................................................1
1.1
Uses of zebrafish image analysis tool ..................................................................................1
1.2
Contents of the zebratool program .....................................................................................1
2.
Running the tool in Matlab ..........................................................................................................1
3.
Getting started .............................................................................................................................1
4.
3.1
Material ................................................................................................................................1
3.2
Masks ...................................................................................................................................2
3.3
Folder structure and file names ...........................................................................................2
3.4
Alignment of reference fish and masks ...............................................................................3
3.5
Registration ..........................................................................................................................3
3.6
Caudal regions......................................................................................................................4
Results ..........................................................................................................................................5
4.1
Output ..................................................................................................................................5
4.2
Visualizing the results ..........................................................................................................6
1
1. Introduction
1.1
Uses of zebrafish image analysis tool
Zebrafish image analysis tool is intended to be used to register fluorescent microscopy images and
differential interference contrast microcopy images of zebrafish embryos. The tool also provides a
user interface for manual selection of landmarks.
1.2 Contents of the zebratool program
Zebratool contains several MATLAB functions for registration and data analysis. The main program
consists of following functions:
create_folder_structure;
align_ref_images;
registration(age,fish,pick_more_points,DIC);
pick_corners(age,back_label_lower,back_label_upper) (OPTIONAL);
data = get_data(age,fish,varargin);
There are also several functions for plotting different kind of information. Those functions are
presented in section 4.2.
2. Running the tool in Matlab
Zebrafish image analysis tool has been tested on MATLAB R2011b. In order for the Matlab version
to work, Image Processing Toolbox must be installed.
Extract the contents of the tool archive into a directory, e.g. C:\zebratool\. To run the tool, change
the MATLAB working directory to the directory where the files were extracted and then follow the
instructions.
3. Getting started
3.1 Material
Images should be acquired so that fish´s head is on left or they should be rotated so before using
the code.
2
3.2 Masks
For reference fish, relevant organs for a given study must be marked. This can be done with
numerous photo editing software, e.g. with the Paint.NET which is available at
http://www.getpaint.net/. Then, open the image to be masked in the editor and draw masks over
the organs. Borders of the organs should be drawn with a color where one or more components
are set to 255 (rest of the components is set to 0). Marking is then done by labeling the organs
with a green value 1…n, where n is number of the organs. This can be done, i.e. using the editor´s
paint bucket ability. Moreover, background should be black. The resulting mask image should be
then same size than the image to be masked and organs must locate in same places. File format
must be chosen so that MATLAB’s imread command supports it (e.g. tif, jpeg), but otherwise it is
not limited. Result is exemplified in Figure 3.1. If there is e.g. four development stages, each stage
should have a reference fish and mask.
Figure 3.1 Mask of the reference fish, organs have been circled with a color (value 255) and organs have been labeled
with a green color (1…n). Background is set to 0.
If back is drawn, it should be divided into two parts, namely into ventral somites and dorsal
somites regions like in Figure 3.1.
3.3 Folder structure and file names
Run create_folder_structure command in your working directory. It will create a following folder
structure shown in Figure 3.2 in your working directory.
3
Figure 3.2 Folder structure
First, all images should be copied into a folder called Images and reference masks should be
copied into a folder called Masks. After thin plate spline procedure, registered images are saved
into a folder Registered_images\Images. For visualization purposes registered images with masks
are saved into a folder Images_with_masks so that user can see the result of registration.
Landmarks used in a registration process will be saved into a folder called Points. Finally, results
and figures can be saved into a folder called Results.
Images (both fish and masks) should be named in the following way:
f(fish_no)_(development_stage)d.tif (file format of the image can be different if MATLAB’s imread
supports it). For example, if there are three development stages (namely, 0, 1 and 2 days after
injection) and for each stage there is four fish, images should have names:
-
f1_0d.tif, f2_0d.tif, f3_0d.tif, f4_0d.tif
f1_1d.tif, f2_1d.tif, f3_1d.tif, f4_1d.tif
f1_2d.tif, f2_2d.tif, f3_2d.tif, f4_2d.tif
Note that, the reference fish and masks should have a names f1_0d.tif, f1_1d.tif and f1_2d.tif.
3.4 Alignment of reference fish and masks
Reference fish and masks are aligned horizontally. This is done for visualization purposes as well as
minimizing the sizes of images. This can be done with a command align_ref_images. This function
will move the original files into a folder called Old and aligned images will be saved in their place. If
needed, user can then restore the original ones. If user does not want to align images horizontally,
this step is not needed.
3.5 Registration
Registration is performed by running a command registration.
registration(age,fish,pick_more_points,DIC);
4
Age defines development stages of the fish. With parameter fish, user can define specific fish for
registration. Manual selection of landmarks can be enabled by setting pick_more_points to true. If
user wants to register DIC-images, DIC must set to true.
For example, if user wants to register fluorescence images and specific development
stages (e.g. 1 and 3) with specific fish (e.g. 1, 2, 3 and 5) and with manual selection, command
would be registration( [1 3], [1:3 5], 1, 0). Figure 3.3 shows the user interface when manual
selection ability is turned on. For more help, check the registration.m file.
Figure 3.3 User Interface
When pressing the Match&save button, the thin plate spline registration is performed and
the result is displayed in a popup window. If the result is good enough, user can click the button
Next or Exit and the result will be saved into a folder described in section 3.3. Note, that the Exit
button will terminate the whole registration process while the Next button proceeds to next
image. More landmarks can be selected (Select) or landmarks can be removed (Remove). Selection
of landmarks is done by first selecting a landmark within the reference fish (top) and then
selecting a corresponding point in the moving image (bottom). By pressing the right mouse button,
program exits the selection/removing mode.
3.6 Caudal regions
If user wants to divide caudal regions into smaller sections, corners of the ventral and dorsal
regions must be selected manually. This can be done with the function:
pick_corners(age,back_label_lower,back_label_upper);
5
Parameters back_label_lower and back_label_upper are labels for the ventral and dorsal regions in
the marked image (e.g. label no 10 and 11). Result (.mat file containing the corners for the dorsal
and ventral regions) will then be saved into the folder where the masks are. This has to be done
only once and only for the reference masks.
4. Results
After registering procedure, images can be analyzed by running a command:
data = get_data(age,fish,varargin);
Age defines the development stage and fish defines what fish are included to analysis. Result of
the analysis (.mat file) is automatically saved into the Results folder.
4.1 Output
Result file will be an m x n struct, where m is number of fish and n is number of development
stages. Moreover, each fish contains following structure:
-
Organs, l x 1 struct containing information within each organ (l is number of organs)
Back, k x 1 struct containing information within each region (k is number of labeled
sections within caudal region)
Back_labeled, a label image where the caudal region has been divided into k number of
smaller regions.
Figure 4.1 E.g. fish number six at development stage 2 contains fields “Organs”, “Back” and “Back_labeled”.
Organs and back then contain following fields:
-
Measurements, s x 2 matrix of measurements where s is number of spots. First column is
the area and second column is the mean intensity of the spot.
6
-
Legend, tells the content of the measurements matrix, e.g. [“Area”, “Intensity”].
Area_organ, area of this particular organ/section.
PixelIdxList, coordinates for each spot
Centroid, centroid of the spot
4.2 Visualizing the results
Zebratool offers several functions to visualize the results of the analysis. The obtained data can be
visualized with the following commands:
plot_NumObjects_over_time(data,age,fish);
plot_area_over_time(data,age,fish);
plot_intensities(data,age,fish);
plot_NumObjects(data,age,fish);
plot_area(data,age,fish);
plot_heatmap_style_fish(data,age,fish,back_lower,back_upper);
The parameter data is the .mat file which was saved in the Results folder. With the parameters
age and fish user can define specific development stage and fish for visualization. The last function
is meant to visualize the situation when back is divided into smaller sections.