1
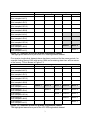
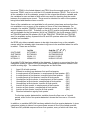
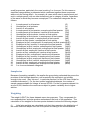
User Guide
Volume 11 - LFS TWO-QUARTER AND FIVE-QUARTER LONGITUDINAL
DATASETS
LFS LONGITUDINAL USER GUIDE
LFS TWO-QUARTER AND FIVE-QUARTER LONGITUDINAL DATASETS
Contents
Introduction ................................................................................................................ 2
Datasets ..................................................................................................................... 2
Coverage .................................................................................................................... 4
Linking procedure ....................................................................................................... 4
Variables .................................................................................................................... 4
Sample size ................................................................................................................ 6
Weighting ................................................................................................................... 6
Some points on longitudinal analysis, including the implications of response error
bias............................................................................................................................. 8
Contact details ........................................................................................................... 8
Reference................................................................................................................... 8
1
Introduction
The Labour Force Survey (LFS) is a household survey, gathering information on a
wide range of labour force characteristics and related topics. Since 1992 it has been
conducted on a quarterly basis, with each sample household retained for five
consecutive quarters, and a fifth of the sample replaced each quarter see volume 1
of the LFS user guide (http://www.ons.gov.uk/ons/guide-method/methodquality/specific/labour-market/labour-market-statistics/index.html) for more
information. The survey was designed to produce cross-sectional data, but in recent
years it has been recognised that linking together data on each individual across
quarters would produce a rich source of longitudinal data.
There are however methodological problems which could distort the data resulting
from this linking. They fall into two main groups: biases arising from non-response
and the sample attrition arising from it; and biases arising from response errors,
particularly their effects in producing spurious flows between economic activity
states. ONS undertook a joint research project with Southampton University to
address these methodological issues, which produced a satisfactory methodology for
compensating for the biasing effects of non-response, and a procedure has been
developed for applying it in longitudinal datasets linking two or five adjacent quarters.
This guide describes the two-quarter and five-quarter longitudinal LFS datasets and
how to use them. It describes briefly how they are produced, but does not give
details of the methodological development - this is covered in detail in paper 17 of
the GSS Methods and Quality series, entitled “Methodological Issues in the
Production and Analysis of Longitudinal Data from the Labour Force Survey” by Paul
Clarke and Pam Tate.
Datasets
The quarterly LFS started in spring 1992, but the rotational pattern of the sample
was not established until winter 92/93, therefore this is the first quarter available for
longitudinal linking. From May 2006, the LFS moved from seasonal quarters (e.g
Spring: March to May) to calendar quarters (April-June: Q2), the LFS user guide
volume 1 provides more details about this.
Two-quarter longitudinal datasets have been produced for all pairs of adjacent
quarters from winter 1992/93 onwards - for example, the winter 1992/93 dataset was
linked with the spring 1993 dataset. This is illustrated in Figure 1.1.
2
LFS two quarter longitudinal dataset (April-June 2015)
AJ14
JS14
OD14
JM15
AJ15
Wave 5
LFS cohort 1
(first sampled AJ13)
LFS cohort 2
Wave 4
Wave 5
(first sampled JS13)
LFS cohort 3
Wave 3
Wave 4
Wave 5
(first sampled OD13)
LFS cohort 4
Wave 2
Wave 3
Wave 4 Wave 5
(first sampled JM14)
LFS cohort 5
Wave 1
Wave 2
Wave 3 Wave 4
(first sampled AJ14)
LFS cohort 6
Wave 1
Wave 2 Wave 3
(first sampled JS14)
LFS cohort 7
Wave 1 Wave 2
(first sampled OD14)
LFS cohort 8
Wave 1
(first sampled JM15)
LFS cohort 9
(first sampled AJ15)
Figure 1.1: Structure of the two quarter longitudinal dataset.
The highlighted waves form part of the LFS 2Q longitudinal dataset.
Wave 5
Wave 4
Wave 3
Wave 2
Wave 1
Five-quarter longitudinal datasets have also been produced for the same periods, for
example linking spring 1993 with spring 1994 and containing data from all five waves
of the survey. This is shown in Figure 1.2
LFS five quarter longitudinal dataset (April-June 2015)
AJ14
JS14
OD14
JM15
AJ15
LFS cohort 1
Wave 5
(first sampled AJ13)
LFS cohort 2
Wave 4
Wave 5
(first sampled JS13)
LFS cohort 3
Wave 3
Wave 4
Wave 5
(first sampled OD13)
LFS cohort 4
Wave 2
Wave 3
Wave 4 Wave 5
(first sampled JM14)
LFS cohort 5
Wave 1
Wave 2
Wave 3 Wave 4 Wave 5
(first sampled AJ14)
LFS cohort 6
Wave 1
Wave 2 Wave 3 Wave 4
(first sampled JS14)
LFS cohort 7
Wave 1 Wave 2 Wave 3
(first sampled OD14)
LFS cohort 8
Wave 1 Wave 2
(first sampled JM15)
LFS cohort 9
Wave 1
(first sampled AJ15)
Figure 1.2: Structure of the five quarter longitudinal dataset
The highlighted waves form part of the LFS 5Q longitudinal dataset.
3
Coverage
The focus of analyses of these datasets is on the population of working age. The
dataset is restricted to those aged 15-69 in the first quarter. Before the 2010
reweighting, the working age was 15-59 for women and 15- 64 for men (which will be
the case for datasets before OD01).
The small proportion of people in the sample whose data, at any of the linked
quarters, had been imputed by rolling forward from the previous interview, were
excluded from the longitudinal datasets.
From spring 1996 onwards, with the introduction of the household matrix approach to
gathering data on the people present in the household, a small proportion of people
in the sample have no data available on economic activity. People with no data on
economic activity at one or more of the linked quarters have been excluded from the
longitudinal datasets.
For the period from winter 1995/6, the datasets cover the UK. The Northern Ireland
survey did not change from an annual to a quarterly survey until winter 1994/95, and
the rotation pattern of the sample was not fully established until winter 1995/96,
therefore the longitudinal datasets which include quarters before winter 1995/96
cover just Great Britain.
Linking procedure
The regular quarterly individual-level LFS dataset for the first of the quarters to be
linked is used to produce a reduced cross-sectional dataset confined to the age
range and variables to be used for the longitudinal dataset. A unique identification
variable (PERSID) is created. A similar procedure is followed for the other quarters.
The reduced cross-sectional datasets for the two or five quarters to be linked are
matched by the unique identification variable and checked to ensure that the cases
linked match also on sex and date of birth. All unmatched cases are dropped, as are
all cases where the data were rolled forward, or where there are no data on
economic activity, at any of the quarters.
Variables
Because of the resources involved in production and the size of the resultant
datasets, the longitudinal datasets include only a subset of the full LFS variable set.
This subset has been agreed in consultation with users and represents the most
important and commonly used variables covering the main areas of the survey. A full
variable list has been created which shows the content of each of the datasets.
When the linked datasets are created, all the variables relating to the first of the
linked quarters are renamed, with a suffix of 1 added to the original variable name,
and all the variables relating to the second of the linked quarters have a suffix of 2
added to the original variable name, and so on. For example, if we link together the
JM14 and AJ14 quarters, then the variable TEN1 from the first quarter, JM14,
4
becomes TEN11in the linked dataset, and TEN1 from the second quarter, AJ14,
becomes TEN12, and so on until the AJ15 variable becomes TEN15. This is true for
all the variables in all the datasets, except for the unique identification variable and
the variables for sex and date of birth which are used for checking that the match
between the quarters are correct. These must be identical for each of the quarters
being linked and therefore have no suffix.
Some of the variables are not available for all quarterly interviews and are therefore
not available in one or more of the quarters of some of the linked datasets. For
example, the variable TRNLEN (Length of training course) is only available for JM
and AJ quarters from 1997. Therefore on the AJ15 5 quarter longitudinal dataset it
will be available for the first quarter (AJ14) as TRNLEN1, the fourth quarter (JM15)
as TRNLEN4 and the fifth quarter (AJ15) as TRNLEN5, TRNLEN2 and TRLEN3
won’t be available as they represent the JS and OD quarters where the TRNLEN
variable isn’t available..
As SPSS only allows variable names to be eight characters long, a few variable
names which are already eight characters long have to be amended when the suffix
is added. These are as follows:
IOUTCOME
SHFTWK99
HIQUAL11
HITQUA11
2nd Qtr (3rd, 4th, 5th)
IOTCOME2/3/4/5
SHTWK992/3/4/5
HIUAL112/3/4/5
HIQUA112/3/4/5
1st Qtr
IOTCOME1
SHTWK991
HIUAL111
HIQUA111
A variable FLOW has been added to the datasets. It gives in a convenient form the
categories relating to labour force gross flows, distinguishing between states in and
outside working age. The codes and categories are as follows:
1
2
3
4
5
6
7
8
9
10
11
12
Aged 15 at both quarters
Entrant to working-age between first and final quarter
In employment at first quarter; in employment at final quarter
In employment at first quarter; unemployed at final quarter
In employment at first quarter; inactive at final quarter
Unemployed at first quarter; in employment at final quarter
Unemployed at first quarter; unemployed at final quarter
Unemployed at first quarter; inactive at final quarter
Inactive at first quarter; in employment at final quarter
Inactive at first quarter; unemployed at final quarter
Inactive at first quarter; inactive at final quarter
Reached retirement age by final quarter
(EE)
(EU)
(EN)
(UE)
(UU)
(UN)
(NE)
(NU)
(NN)
For the two-quarter datasets this variable shows the flow over a 3 month
period, while for the five-quarter datasets it shows the flow over a 12 month
period.
In addition, a variable ANFLOW has been added to the five-quarter datasets. It gives
categories relating to labour force gross flows across all five of the linked quarters.
There are 243 possible sequences over five quarters, many of which will have very
5
small frequencies, particularly the ones involving 3 or 4 moves. For this reason a
simplified categorisation is presented which combines together those sequences
where only the timing differs - for example, all cases which start in employment and
end in unemployment (with no other transitions) are in category 4 below, regardless
of the wave in which they became unemployed. The codes and categories are as
follows:
1
2
3
4
5
6
7
8
9
10
11
12
13
14
15
16
17
18
19
20
21
22
In employment in all quarters
(E)
Unemployed in all quarters
(U)
Inactive in all quarters
(N)
In employment at first quarter; unemployed at final quarter (EU)
In employment at first quarter; inactive at final quarter
(EN)
Unemployed at first quarter; inactive at final quarter
(UN)
Unemployed at first quarter; in employment at final quarter (UE)
Inactive at first quarter; in employment at final quarter
(NE)
Inactive at first quarter; unemployed at final quarter
(NU)
Employed at first; unemployed; in employment at final quarter(EUE)
Employed at first; inactive; in employment at final quarter
(ENE)
Unemployed at first; inactive; unemployed at final quarter
(UNU)
Unemployed at first; employed; unemployed at final quarter (UEU)
Inactive at first; employed; inactive at final quarter
(NEN)
Inactive at first; unemployed; inactive at last quarter
(NUN)
Employed at first; unemployed; inactive at final quarter
(EUN)
Employed at first; inactive; unemployed at final quarter
(ENU)
Unemployed at first; employed; inactive at final quarter
(UEN)
Unemployed at first; inactive; employed at final quarter
(UNE)
Inactive at first; employed; unemployed at final quarter
(NEU)
Inactive at first; unemployed; employed at final quarter
(NUE)
3 or 4 moves between categories
Sample size
Because of sampling variability, the smaller the group being estimated the poorer the
precision of the estimate becomes, until eventually the estimate is not reliable
enough to be used. (See Volume 1, in particular section 8 of the LFS User Guide for
a detailed discussion.) For the two-quarter longitudinal datasets, the number of
sample cases available for linkage is around 35,000. For the five-quarter dataset it is
around 5,000, therefore the results are subject to greater variability due to higher
attrition.
Weighting
The weight (LGWT) for these datasets serve two purposes. They compensate for
non-response bias, and also produce estimates at the level of the population. The
calculation of the weights for the two-quarter datasets involves the following stages:
(i)
Initial prior weights are calculated such that they reproduce the distribution of
the cross-sectional sample from the first quarter according to the tenure/landlord
6
categories: owned; rented from local authority/housing association; privately rented.
(ii)
These prior weights are then multiplied by a single grossing factor, (except for
Northern Ireland where this factor is again multiplied by an adjustment factor to
compensate for the different sampling fraction), such that the weighted sample cases
sum to the overall population control total (described below). This results in the prior
weights used in the calculation of the final weights (described below).
(iii)
A process of calibration weighting (also known as generalised raking) is then
applied to the sample, using CALMAR software (see Elliot 1997). This process
minimises the distance between the prior and final weights, while constraining the
final weights simultaneously to several marginal distributions or control totals. Four
sets of control totals are used:
(a) the population estimates used for weighting the second quarter's crosssectional LFS dataset, for the selected age range, classified by sex and age (in
single years to 24, then five-year age groups) - this produces estimates as
close as possible to the population available for sampling in both the linked
quarters;
(b) the population estimates used for weighting the second quarter's crosssectional LFS dataset, for the selected age range, classified by region;
(c) the weighted cross-sectional estimates from the second linked quarter for
the selected age range classified by broad economic activity categories: in
employment; unemployed; economically inactive;
(d) the weighted cross-sectional estimates from the first linked quarter for the
selected age range classified by broad economic activity categories: in
employment; unemployed; economically inactive, adjusted to the same total as
(a) to (c) by reducing the economically inactive category as necessary.
CALMAR is run using the logit method, with the ratio of the final to prior weights
constrained to the range 0.1 to 2.4.
The elements (iii) (a) and (b) in this process produce population-level estimates, and
also contribute to some extent to compensating for non-response bias; the other
elements complete the compensation for non-response bias.
The extension of this method to create five-quarter datasets consists of constraining
to the cross-sectional economic activity distribution at each of the five quarters. This
involves repeating the constraint in (iii)d for the second, third and fourth quarters as
well as the first, adjusting in the same way to achieve a total consistent with the fifth
quarter. When running CALMAR to create five-quarter datasets, wider limits have to
be set for the ratio of final to prior weights, typically 0.1 to 2.8.
7
Some points on longitudinal analysis, including the implications of
response error bias
All analyses should be run weighted by LGWT, otherwise the results will be distorted
by non-response bias, and possibly misleading.
Careful thought is needed about the precise coverage of any analysis – is it the
population of working age at the first quarter, the second quarter, or both quarters?
The variable FLOW can be used to select any of these groups: codes 3 to 12 give
working age at the first quarter, 2 to 11 at the second quarter, and 3 to 11 at both
quarters.
Most analyses of interest are likely to be cross-tabulations of a characteristic at the
first quarter with a characteristic at the second or fifth quarter, often restricted to a
subgroup. Some examples are: lone parents of working age at both quarters by sex
and age of youngest child and by economic activity at both quarters; young people
aged 18 to 24 unemployed at the first quarter by educational qualification and
economic activity at the last quarter; people reaching retirement age by the last
quarter by economic activity at both quarters and by reason for inactivity if inactive.
Doing analyses of this kind, the numbers of cases in some cells can very quickly
decrease.
Research so far on response error has been based on empirical analysis of
differences in levels of transitions between different economic activity categories and
of apparent internal inconsistencies. The initial investigations have provided
evidence supporting the suggestion that response error is likely to affect the
longitudinal datasets, probably in the direction of an upward bias in estimates of
gross flows between different broad economic activity categories. It has also
provided some tentative indications of transitions and subgroups particularly likely to
be affected. These are transitions between unemployment and inactivity, transitions
between part-time employment and either unemployment or inactivity, for women
any transitions involving unemployment, and for students transitions between
employment and unemployment. However, some of the apparent inconsistencies
may be caused by genuine volatility (repeated movements back and forth between
different economic activity states) rather than by response error.
Contact details
All enquiries about the longitudinal datasets should be directed to
[email protected].
Reference
Elliot, D (1997) Software to weight and gross survey data. GSS Methodology Series
No 1.
8


![LS5105 Document No 2 [PDF 1MB] - Australian Electoral Commission](http://vs1.manualzilla.com/store/data/005655823_1-2458abda02bbd8390d0ac9ba8bd86ac6-150x150.png)