1
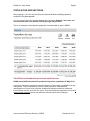
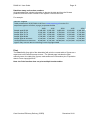
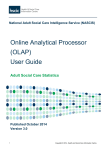
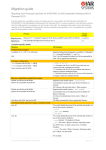
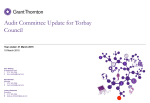
Care Services Efficiency Delivery
Demand Forecasting and Planning
PANSI 4.1 User Guide
PANSI stands for Projecting Adult Needs and Service Information. It gives easy
access to projections of the numbers, characteristics and care needs of people aged
18-64 in England at national, regional and council level.
With POPPI covering the over 65 age bands, POPPI and PANSI bring together
relevant information for council planners and commissioners of adult social care and
provide a consistent starting point for Joint Strategic Needs Assessment.
PANSI 3 introduced a new, wider screen, format showing:
‘Comparator’ authorities using the CIPFA model
A ‘Neighbours’ menu for adjoining councils
Government Office Region and other authorities in the GOR
Users own groups of up to 15 councils, regional and England totals
PANSI 4 gave users the ability to compare data across councils, regions and the new
menu groups to download data for many geographical locations.
PANSI 4.1 introduces:
an interactive map for navigation to councils, districts and regions
ONS population projections for the City of London and the Isles of Scilly
new prevalence data for Challenging Behaviour
a new mental health category of Psychiatric Co-morbidity
people receiving Disability Living Allowance in 2010
people subject to Guardianship in 2010
POPPI and PANSI use ONS forecasts based on current trends. They do not predict
‘expected’ outcomes. Often, the strategic direction will aim to avoid the outcomes
that PANSI projects through service transformation. [See ‘Using PANSI’ below]
POPPI and PANSI are developed and supported by the Department of Health CSED
Programme and the Institute of Public Care, Oxford Brookes University [IPC].
PANSI 4.1 User Guide
Page 2
REGISTERING WITH PANSI
POPPI users are already registered. They can access PANSI with their POPPI
registered e-mail address and password.
If you are not registered to use POPPI, go to www.pansi.org.uk, choose 'Click here
to register' and complete the on-line form with:
Name, job title and organisation
Office address and phone number
Email address
PANSI automatically sends a unique password to local and national government,
NHS or academic e-mail addresses.
For other e-mail addresses, please supply the additional information requested to
facilitate your registration:
Service providers: are you registered with CQC?
Charities: please give your registered charity number.
Others: please state why you wish to use PANSI and POPPI.
When your registration is accepted, a password is sent to your e-mail address. Once
logged-in, you can change your password using the ‘My account’ screen from the
menu top right. There is a forgotten password link on the login page.
Your password, with the registered e-mail address as your username, allows
you to access both POPPI and PANSI from any location.
In PANSI and POPPI, links allow you to switch between the sites where tables have
the same content. This makes it easy to view data for all adult age-bands and the
total population forecast.
The login page also has information on recent and planned updates to the data and
the system and a link to download the User Guide.
If you have any problems or queries, contact the Institute of Public Care:
Telephone 01225 484088 (9am to 5pm Mondays to Fridays) and ask for the
helpdesk
OR email [email protected]
Changes from PANSI Version 4.0 are highlighted in this User Guide.
Care Services Efficiency Delivery (CSED)
December 2010
PANSI 4.1 User Guide
Page 3
POPULATION PROJECTIONS
After logging in, you will see the Office for National Statistics [ONS] population
projections for your council.
For non-council users, the screen displays the results for England - but users can
now nominate their own default locality through ‘My account’.
This is an example of the baseline population forecast table by age in PANSI.
PANSI uses ONS Subnational Population Projections, published 27 May 2010.
Long-term population projections are an indication of the trends in population by age
and gender. They are based on 2008 mid year population estimates and
assumptions on future levels of births, deaths and migration based on observed
levels mainly over the previous five years. They show what the population would be if
recent trends continue and do not take into account future policy changes.
Care Services Efficiency Delivery (CSED)
December 2010
PANSI 4.1 User Guide
Page 4
Population figures
On the left hand side of the screen, menu options under Population figures lead to
tables for:
Population projections by age for 2010, 2015, 2020, 2025, 2030
Population by age and gender
2007 Population by ethnic group - numbers and percentages. [PANSI uses
the experimental ONS estimates by age band published in April 2009.]
Disability Living Allowance The final option in the ‘Population figures’ menu is a
table of actual Disability Living Allowance (DLA) cases in payment, by age-band.
The data is from DWP, Disability Living Allowance – Caseload by local authority
of claimant, by age and is now updated with data for May 2010.
The active menu button is marked with a blue dot.
Percentage change
Select ‘Show percentage change’ on the Population by age and Population by
gender and age pages to show the projected percentage change from the current
year [2010] to 2015, 2020, 2025, 2030. ‘Show numbers’ reverts to the projections.
Near-term population projections
Choose 'Show next five years' to display population projections for the next 5 years
– 2010, 2011, 2012, 2013, 2014.
Choose 'Show 2010 to 2030’ to return to 2010, 2015, 2020, 2025 and 2030.
The Notes on each page identify data sources with tables of the prevalence rates
used. The rates and source references are downloaded with the projections when the
Download facility is used.
Councils should make judgements about the relevance of the prevalence rates used
to their locality.
Care Services Efficiency Delivery (CSED)
December 2010
PANSI 4.1 User Guide
Page 5
NAVIGATION TO OTHER GEOGRAPHICAL LOCATIONS
With Menus
You can view information for any local authority, district, Government Office Region
(GOR) or for England as a whole. Councils with social services responsibilities are
listed in alphabetical order in the drop-down menu top right with England and the 9
GORs at the top.
To change location, on any page, use the drop down list [top right] to list locations;
highlight the required location and then click once to display the data.
To view district data, choose the relevant county council as above, then use the dropdown ‘Select a district’ menu immediately beneath, to select the district required.
In PANSI, menu groups make it easier to navigate to other relevant councils.
Choose ‘Go to a comparator’ for each authority’s closest fifteen comparators
using the CIPFA ‘Nearest Neighbour’ Model – useful for benchmarking.
Choose ‘Go to a neighbour’ to list councils adjoining the selected authority –
useful for coordinating strategy and potential cross-border impacts.
‘Region’ allows users to select authorities in their GOR and the regional total.
Users can also build up three of their own ‘Favourites’ groups of up to 15 localities
from local authorities, GORs and England. To add, remove and name selections use
the ‘Organise favourites’ menu on the right. [See Facilities section for more details.]
PANSI uses district data to provide a planning base for the four new unitary
authorities in Bedfordshire and Cheshire. District level detail is retained for the five
counties that have converted to unitary authorities.
PANSI 4.1 includes population projections for the City of London and the Isles
of Scilly with their neighbours and other authorities in the London and South
West Regions respectively. Data for Cornwall now excludes the Isles of Scilly.
CIPFA comparators are not yet available for the City and the Isles of Scilly.
With Maps
Users can navigate between geographical areas using a map covering
England, the regions, unitary authorities, counties and districts.
Choose ‘Show map’ below the drop down menu top right to display a map.
Click on the map to select a location. Use the map menus to move up from
districts to counties and up from authorities to regions.
Choose ‘Close map’ to close the map and view data for the selected
location.
Users can move across the country as well as focus in on areas where
authorities are densely packed, for example, in the Greater Manchester area.
Maps are supplied by the Information Centre for Health and Social Care.
Care Services Efficiency Delivery (CSED)
December 2010
PANSI 4.1 User Guide
Page 6
LEARNING DISABILITY
PANSI contains the following tables in the Learning Disability menu.
LD – Baseline estimates – with ‘all ages’ option
LD – Moderate or severe – with ‘all ages’ option
LD – Severe
LD – Moderate or severe living with a parent
Down’s syndrome
Down’s syndrome/dementia
Challenging behaviour – updated with new data source
Autistic spectrum – with ‘by gender’ option
Services provided
For LD, predictions are based on prevalence rates in a paper by Eric Emerson and
Chris Hatton of the Institute for Health Research, Lancaster University, entitled
Estimating Future Need/Demand for Supports for Adults with Learning Disabilities in
England, June 2004.
For Autism, PANSI 4.1 uses prevalence rates from the 2007 Adult Psychiatric
Morbidity in England Survey published by the Health and Social Care Information
Centre in 2009. The prevalence rate for men (1.8%) is significantly higher than for
women (0.2%). The prevalence rates are applied to ONS population projections by
gender to give numbers predicted to have autistic spectrum disorder to 2030 and a
‘Show by gender’ option shows this variation.
PANSI 4.1 includes revised source data for Challenging behaviour. The new
prevalence rate is taken from the study Challenging behaviours: Prevalence
and Topographies, by Lowe et al, published in the Journal of Intellectual
Disability Research, Volume 51, August 2007.
Care Services Efficiency Delivery (CSED)
December 2010
PANSI 4.1 User Guide
Page 7
PHYSICAL DISABILITY
Under the menu heading ‘Physical disability’, the following pages are available:
PD – Moderate or serious – with sub-totals for ‘moderate’ and ‘serious’
cases
Personal care
Stroke – with ‘all ages’ and by gender options
Diabetes – with ‘all ages’ and by gender options
Visual impairment
Hearing impairment – with ‘all ages’ option
Unable to work
Services provided
PANSI focuses on younger adults but some physical disability and learning disability
conditions apply to all ages.
To help strategy development for these conditions, users now have an option to
show all adult age-bands in a single table. This is available for Stroke, Diabetes,
Visual impairment, Hearing impairment and Learning Disability.
Care Services Efficiency Delivery (CSED)
December 2010
PANSI 4.1 User Guide
Page 8
MENTAL HEALTH
The menu headed ‘Mental health’ provides the following pages:
Mental health problem – new Psychiatric co-morbidity data added
Drugs/alcohol
Drugs - likely to be known to local authorities
Guardianship – updated to 31 March 2010
Suicide
Adult survivor of child abuse
Early onset dementia
Services provided
PANSI 3 introduced prevalence rates from the report ‘Adult psychiatric morbidity in
England, 2007: Results of a household survey’, published by the Health and Social
Care Information Centre in 2009.
For people aged 18-64 projected to have a mental health problem the categories now
used are:
Common mental disorders
Borderline personality disorder
Antisocial personality disorder
Psychotic disorder
Two or more psychiatric disorders
The report gives new prevalence rates for both alcohol and drug dependence but
a survey of the household population is likely to under-represent dependent adults,
who are more likely to be homeless or in an institutional setting. Problem drinkers
and drug users who live in private households may be less available, able or willing
to participate in surveys.
A new row for Psychiatric Co-morbidity has been added to the Mental Health
page, to show people aged 18-64 predicted to have two or more psychiatric
disorders. The prevalence rate is taken from ‘Adult psychiatric morbidity in
England, 2007: Results of a household survey, 2009.’
PANSI 4.1 includes the number of adults subject to Guardianship for the year
ended 31 March 2010.
Care Services Efficiency Delivery (CSED)
December 2010
PANSI 4.1 User Guide
Page 9
LOCAL SERVICES PROVIDED
PANSI 4.1 uses a subset of the latest Social Care Indicators from the National
Indicator Set 2008-09 final and RAP returns.
Data is now sourced from:
Social Care Indicators from the National Indicator Set 2008-09 final,
http://www.ic.nhs.uk/pubs/socmhi08-09
National Adult Social Care Intelligence Service (NASCIS), Referrals,
Assessments and Packages of Care data (Final 2008/09 data),
http://nascis.ic.nhs.uk/Default.aspx
National Adult Social Care Intelligence Service (NASCIS), Adult Social Care
Combined Activity Returns data (Final 2008/09 data),
http://nascis.ic.nhs.uk/Default.aspx
PANSI includes projections based on the latest 2008/09 returns of the numbers
receiving each service adjusted for the increase in population – if current rates as a
proportion of the population continue.
The figures represent the potential demand and not the expected demand or the
desired outcome.
In the PANSI ‘Services provided’ pages:
The ‘..helped to live at home’ row is renamed ‘..helped to live independently’
[NI136]
‘Direct payments’ projects the number of people receiving self-directed support
based on 2008-09 data sourced from the National Indicator Set [NI130]. Note that
the planned increase in direct payments is likely to be much greater than this
population-driven projection.
A new page ‘Drugs – treatment/services provided’ replaces ‘Drugs – triaged into
treatment’. This page contains two datasets:
People aged 18 or over with a drug problem in effective treatment
People aged 18-64 with a substance misuse problem helped to live
independently
A full description of the CQC, NIS and NASCIS performance indicators is given in the
table notes.
For the new councils, PANSI uses the predecessor county [Bedfordshire or Cheshire]
performance rates applied to the new authority population.
Services provided data is not available for District councils.
Care Services Efficiency Delivery (CSED)
December 2010
PANSI 4.1 User Guide
Page 10
FACILITIES
My Favourites
Users can build up three of their own Favourites groups of up to 15 localities from the
list of local authorities, GORs and England. To add, remove and name favourite
selections select the ‘Organise favourites’ menu option on the right, and then:
Use the dropdown menu to select a geographical location, then use the ‘Add to
group...’ buttons to add the location into the required group; repeat as required.
Give each group a name by clicking on ‘Enter a nickname for group...’, type a
name into the box, choose Save. Choose ‘Edit nickname’ to change the name.
To remove a location from a group click on
next to the location name.
To empty the contents of a group click on
at the top of the group.
To return to the tables, choose a data page using the menu on the left or choose the
‘Return to Population by age’ menu option on the right. Groups will be listed at the
end of the right hand panel, click on the group name to list the contents, click a
location name to display data.
Compare Data
The following datasets are available for comparison in PANSI:
Total population aged 18-64 for 2010 to 2030, next five years and percentage
growth
Percentage change in population by age band by 2020
Ethnic group percentage by age band: 18-24; 25-34; 35-44; 45-54; 55-64
Learning disability services provided
Physical disability services provided
Mental health services provided
On each page where the above datasets appear, the ‘Compare’ icon - a set of
unbalanced scales - appears.
Compare
A small ‘Compare’ icon indicates datasets - rows or columns - that can be compared.
Clicking on a Compare data icon will display a set of choices. Users can:
Choose the dataset required where there is more than one dataset available for
comparison on the page;
Choose the group of geographical locations to compare – including ‘My
favourites’ groups where these have been selected.
The results of a comparison are presented in a table format on screen, together with
the original Notes, with the ability to print or download as for standard tables.
Care Services Efficiency Delivery (CSED)
December 2010
PANSI 4.1 User Guide
Page 11
If you began at ‘Percentage change’ or ‘Next five years’ data, this choice is retained
on the comparison table.
If ‘Next five years’ or ‘Percentage change’ buttons are present when a comparison
table is shown, these buttons function for the data in the comparison table.
To return to the original datasets, users can choose:
the Stop comparing option;
the same page or a different page from the left hand menu;
a different geographical location from the right hand set of menus.
Download
With PANSI 4.1, users can download data from a standard page for more than
one geographical area into a single Excel spreadsheet.
Clicking the ‘Download’ icon above the data table opens a menu offering a choice of
localities for which the data can be downloaded:
The currently selected local authority only
The currently selected local authority plus its 15 comparators
The currently selected local authority and its geographical Neighbours
All authorities within a region plus the region itself
Any ‘My favourites’ group
All government office regions plus England
All districts within a County plus the County itself
The format for the data download, when opened in a spreadsheet, is:
The title information appears at the top.
Each component table appears one below the other.
Table column headings appear once, e.g. years.
Row labels are preceded by location name. Total rows remain.
The Notes appear once, after the last data table.
The naming convention for downloaded data identifies the geography covered.
For example:
pansi_Population_by_age_London_14-07-10.csv
pansi_Population_by_age_Gloucestershire_and_neighbours_14-07-10.csv
pansi_Population_by_age_Hampshire_and_districts_14-07-10.csv
Care Services Efficiency Delivery (CSED)
December 2010
PANSI 4.1 User Guide
Page 12
Date/time stamp and version numbers
All downloaded files include information to denote the date and time the file was
produced, and the version number of the system current at the time.
For example:
Data for: England
Table produced on 19/07/2010 10:05 from www.poppi.org.uk version 5.0
Population aged 65 and over, by age, projected to 2030
2009
2015
2020
2025
2030
People aged 65-69
2,349,200 2,952,500 2,695,900
2,945,600 3,364,100
People aged 70-74
2,032,300 2,248,600 2,753,800
2,527,400 2,771,600
People aged 75-79
1,657,700 1,821,000 2,018,500
2,490,100 2,300,100
People aged 80-84
1,232,800 1,342,000 1,518,800
1,711,600 2,129,000
People aged 85 and over
1,154,000 1,350,400 1,576,000
1,912,900 2,314,800
Total population 65 and over 8,426,000 9,714,500 10,563,000 11,587,600 12,879,600
Figures may not sum due to rounding. Crown copyright 2008
Print
The Print facility [top right of the data table] will print the current table of figures as a
report and not the whole browser screen. The printed page includes the local
authority name, the table title, figures, totals and source information plus "Population
data is Crown copyright 2010".
Note: the Print function does not print multiple location tables.
Care Services Efficiency Delivery (CSED)
December 2010
PANSI 4.1 User Guide
Page 13
User Questionnaire
The User Questionnaire facility in PANSI enables electronic surveys of user
requirements and preferences.
The survey questionnaire will appear in a new window on logging in to PANSI. Users
have the choice of delaying or declining the questionnaire and the window will remain
open until one of the options is selected, allowing the user to browse within PANSI
and return to the questionnaire later.
Useful Links
Useful links – on the top menu bar – opens a page of related sites, including links to
datasets with additional geographical detail [scroll down for the full list] and sources
used in POPPI and PANSI. Including:
Super Output Area - LSOA and MSOA - mid-year population estimates for
England and Wales for mid-2002 to mid-2008 (experimental)
Ward level population estimates for England and Wales for mid-2001 to mid-2007
(experimental)
Further measures of poverty, benefits and deprivation can be accessed from links to:
Department for Work and Pensions, Resource centre: Tabulation tool
Communities and Local Government, Indices of Deprivation 2007.
About, Help, Contact us, My Account and Logout
On the top menu bar, these links provide the following information and functions:
About – System description and version numbers
Help - How to use the system with PDF versions of the User Guides to both
POPPI and PANSI for downloading
Contact us – Telephone number and e-mail link to IPC Helpdesk
My account – Form for editing account details and password with full Terms and
Conditions of use
Logout – To exit the system
Care Services Efficiency Delivery (CSED)
December 2010
PANSI 4.1 User Guide
Page 14
USING PANSI
PANSI is designed to be flexible and easy to use. Whether the need is for a quick
check on population forecasts or detailed development of service strategy, the
information is readily available. Systems expertise and analytical skills are not
required to access key data.
Strategic Planning Applications
PANSI projects at the total population level – not just service users – and is ideally
suited to Joint Strategic Needs Assessment [JSNA]. If this is joint work, with a
coterminous PCT, NHS users can register and can access the common dataset.
Care services provided by councils are often a residual element in the care of adults
– after informal care and self-payers. Councils often have little information on
informal care and self-payers and PANSI can help with the Strategic Gap Analysis.
Understanding the total picture is an important element of JSNA and the interaction
between publicly funded care, informal care and self-payment will be critical to
managing future demand for care.
PANSI can help to generate the assumption base for operational planning and
demand monitoring – vital to detecting emerging trends in demand.
Service strategy development involves understanding the range and prevalence of
conditions and needs likely to be encountered in future. PANSI can provide an initial
quantification of these needs as a baseline scenario. The total population
perspective is essential for development of the Universal Services element of
Putting People First.
The Compare facility allows councils to view the characteristics of neighbours,
CIPFA comparators, regional and national averages to identify potential
benchmarking opportunities.
PANSI data can be downloaded to Excel for generating alternative scenarios,
varying assumptions or applying local knowledge. The downloaded spreadsheets
can be used for chart and graph creation or insertion into reports and presentations.
Downloading data for multiple locations into a single spreadsheet meets user
requests and significantly extends this capability.
Commissioning Applications
The capacity to understand and forecast future demand is increasingly seen as an
important component of proactive commissioning across health and social care.
PANSI offers Commissioners a practical and straightforward way to analyse
population data, identify key characteristics within that population, project numbers
into the future using census projections and compare future populations against
performance data.
Population based analysis forms a valuable backdrop for service planning, market
development and demand management.
Indicating the prevalence of conditions that may require a social care response.
Understanding strike rate, i.e. the numbers of people in particular circumstances
or with particular conditions encountered by social care/health care/housing
compared with their prevalence within the population.
Care Services Efficiency Delivery (CSED)
December 2010
PANSI 4.1 User Guide
Page 15
Exploring the relationship between population locations and service and
community facilities.
Helping to identify the numbers of people to contact, within particular target
populations, in moving from a reactive to a proactive service.
Future Applications
PANSI appears at a time of significant changes in the field of health and social care.
The system is intended to provide information for councils in a dynamic environment
with changing population profiles and innovations in commissioning and consumer
choice across the health economy.
Registration is open to service providers, charities and commercial organisations with
an interest in the field to make the information widely available. There are now 6,800
registered users spread across all county and unitary authorities and every PCT in
England as well as many other organisations.
The users of POPPI and PANSI have already provided valuable feedback on content
and functionality and many of the improvements highlighted in this user guide are a
direct result of this, much appreciated, support.
CSED and IPC will continue to seek user feedback to identify the priorities for future
development and opportunities for added-value enhancements.
CSED Contact:
Ray Beatty
0207 972 1017
[email protected]
IPC Support:
01225 484088
[email protected]
Care Services Efficiency Delivery (CSED)
December 2010