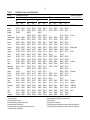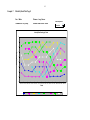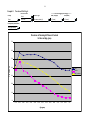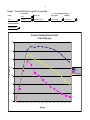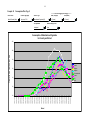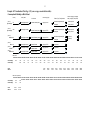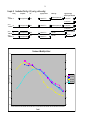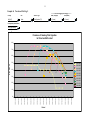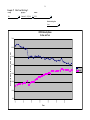
1
International Mortality And Smoking Statistics IMASS Version 4.12 User’s guide and Examples 5th March 2015 Barbara Forey, John Hamling and Peter Lee* *P.N.Lee Statistics and Computing Ltd 17 Cedar Road Sutton Surrey SM2 5DA UK Tel: 00 44 (0)20 8642 8265 Fax: 00 44 (0)20 8642 2135 E-mail: [email protected] File Ref: N:\IMASS\IMASSv4\docs\IMASSv4UserGuideAndExamples.doc INDEX 1. Description of the IMASS system .................................................................................................1 Introduction ...............................................................................................................................1 Data structure - Age, Period and Cohort ...................................................................................1 Countries included ....................................................................................................................2 Causes of death included...........................................................................................................2 Data sources ..............................................................................................................................3 Definitions of causes of death ...................................................................................................5 2. Using the IMASS system ...............................................................................................................8 2.1 Getting started ...........................................................................................................................8 2.2 Using the Mortality Plots sheet ..................................................................................................9 2.3 Using the Prevalence Plots sheet, and the Lagging or Averaging option .................................12 2.4 Using the Consumption Plots sheet .........................................................................................14 2.5 Using the Scatter Plots sheet ...................................................................................................15 2.6 Using the Combination Plots sheet ..........................................................................................15 2.7 Using alternative (retrospective) tobacco data ........................................................................16 2.8 Printing and saving results ......................................................................................................17 2.9 System requirements and configuration ..................................................................................18 2.10 Using the Year Plots sheets .....................................................................................................18 2.11 Customized analysis ................................................................................................................19 3. Acknowledgments ........................................................................................................................19 4. References .....................................................................................................................................20 Appendix: IMASS Revision History Summary ................................................................................21 Table 1 Availability of mortality data .....................................................................................27 Table 2 Availability of sales-based tobacco data ....................................................................28 Table 3 Availability of survey-based tobacco data .................................................................29 Table 4 Availability of data from retrospective survey-based tobacco data .......................30 Table 5 Definitions of causes of death .....................................................................................31 Example 1 Mortality Plots Page 1 .................................................................................................38 Example 1T Mortality Plots Page 1 (Associated Data Table) .......................................................39 Example 2 Mortality Plots Page 2 .................................................................................................40 Example 3 Mortality Plots Page 5 .................................................................................................41 Example 4 Mortality Plots Page 8 .................................................................................................42 Example 5 Mortality Plots Page 8 (Relative Scaling) ..................................................................43 Example 6 Mortality Plots Page 8 (Sex Ratio) .............................................................................44 Example 7 Mortality Rank Plots Page 8 .......................................................................................45 Example 8 Prevalence Plots Page 4 ...............................................................................................46 Example 9 Prevalence Plots Page 4 (Averaged 15 to 5 years previous) ....................................47 Example 10 Consumption Plots Page 8 ..........................................................................................48 Example 11 Consumption Plots Page 8 (Tar Adjusted) ................................................................49 Example 12 Scatter Plots Page 2 .....................................................................................................50 Example 13 Combination Plots Page 5 (10 year lag) .....................................................................51 Example 14 Combination Plots Page 3 (20 year average) ............................................................52 Example 14T Combination Plots Page 3 (20 year average, associated data table) .......................53 Example 15 Combination Plots Page 5 (10 year lag, relative scaling) .........................................54 Example 16 Prevalence Plots Page 3 ...............................................................................................55 Example 17 Mort Year Plots Page 2 ...............................................................................................56 1.1 1.2 1.3 1.4 1.5 1.6 File Ref: N:\IMASS\IMASSv4\docs\IMASSv4UserGuideAndExamples.doc 1 1. Description of the IMASS system 1.1 Introduction The system is designed to give ready access to international data on tobacco consumption, smoking prevalence, and mortality from the major smoking-related diseases. It consists of a set of linked Excel workbooks, containing nationally-based data for 30 countries on mortality from eighteen smoking-related diseases and on tobacco and smoking statistics. Facilities are provided to help the user explore the relationships in the data via a variety of standard plots and tabulations. 1.2 Data structure - Age, Period and Cohort In general, the data are organized in tables where the rows represent 5-year periods, and the columns 5-year age groups 0-4, 5-9, 10-14, 15-19, 20-24 .... 80-85, and 85+, for males and females separately. The diagonals of such a table can be interpreted as representing the lifetime experience of people born around the same time, e.g. people aged 0-4 in 1901-1905 would be aged 5-9 in 1906-1910 and aged 10-14 in 1911-1915 etc. Thus the diagonals of the table correspond approximately to the experience of a birth cohort. One of the main objectives of this system is to allow mortality from smoking-related diseases for a group of people to be related to their tobacco consumption history as recorded at various periods of their life. A cell in the mortality table relates to a group of people dying at a specified age and period. Their lifetime tobacco history can be found by starting at the equivalent cell in the corresponding tobacco table and working backwards up the diagonal of this table. Facilities for this type of analysis are provided. In general, and subject to availability, results are presented by 5-year periods, starting at 1851-1855 and continuing to 2006-2010, and in the 5-year age groups 15-19, 20-24 .... 80-84, and 85+. Some limitations to this birth cohort approach should be noted. First, people dying within a 5-year period and a 5-year age group actually include those born in a 10-year age range. For example, those dying at age 60-64 in 1961-65 include 64-year-olds ________________________________ ABBREVIATIONS A CB COPD CPP ICD IHD All tobacco products Chronic bronchitis Chronic obstructive pulmonary disease Cigarettes per person per day International Classification of Diseases Ischaemic heart disease IMASS International Mortality and Smoking Statistics ISS International Smoking Statistics (ISS2 second edition, ISS3 web edition) MC Manufactured cigarettes PNLSC P.N.Lee Statistics and Computing Ltd. TC Total cigarettes WHO World Health Organisation File Ref: N:\IMASS\IMASSv4\docs\IMASSv4UserGuideAndExamples.doc 2 dying in 1961, born in 1896, and 60-year-olds dying in 1965, born in 1905. A more rigorous method taking these overlapping cohorts into account has been used in some other work1,2 but is not attempted here. Second, the approach ignores the fact that the data in the different cells of a diagonal do not relate to the exact same people, as immigration, emigration and mortality are ignored. Differential mortality, with more smokers than non-smokers dying early, may be an important feature for the oldest age groups, but is not considered here. In addition to the data presented as 5-year periods, limited facilities are available to view certain types of data as single years. 1.3 Countries included 30 countries are included as shown below. Coverage is essentially complete for Europe, but elsewhere is restricted to some major developed countries. One limiting factor is the availability of sufficient smoking data for useful study, another is that mortality data submitted to WHO for some other countries are only regional, based on inadequate death registration and/or cover only a very limited period of time. Australia Austria Belgium Bulgaria Canada Czechoslovakia Denmark Finland France Germany Greece Hungary Iceland Ireland Israel Italy Japan Netherlands New Zealand Norway Poland Portugal Romania Spain Sweden Switzerland UK USA USSR Yugoslavia Between World War II and reunification, data for Germany relate to West Germany only. Data for Czechoslovakia, USSR and Yugoslavia are only included up to 1990. 1.4 Causes of death included The system currently contains mortality data for eighteen diseases:Bladder Cancer Breast Cancer Cervical Cancer Colorectal Cancer Larynx Cancer Liver Cancer Lung Cancer Oesophageal Cancer Oral Cancer File Ref: N:\IMASS\IMASSv4\docs\IMASSv4UserGuideAndExamples.doc 3 Pancreatic Cancer Stomach Cancer All Cancer Chronic Obstructive Pulmonary (COPD) Ischaemic Heart Disease (IHD) Peptic Ulcer Respiratory Diseases (non-acute) Stroke All Causes See section 1.6 and table 5 for details of how these diseases are defined. 1.5 Data sources Age-, sex- and cause-specific mortality data are made available on the Internet by WHO3 and commonly start in the 1950s. The WHO data are provided as numbers of deaths and populations for single years. For most analyses, these are converted to rates (per 100,000) for the 5-year periods. If data are not available for the full 5 years, the rate is calculated from the available years. Table 1 shows, for each country, the period of availability of mortality data (as at 1st Dec 2009). Note that the first and last periods for a country are commonly based on less than a full 5 years. Note also that on occasion, data are missing for one or more years within the period of availability for some combinations of country, disease and sex. This is particularly the situation for breast cancer for males where data are missing for one or more years for eight countries. Full listings of missing data are available in the release notes and also in the change history within the country details page of each workbook. For other sources of population data, see the web edition of “International Smoking Statistics” (ISS3)4 (except that, for data before 1950, the same method of estimation as for the updated chapters is used in IMASS for all countries). Smoking and tobacco data are of two types: sales-based and survey-based. Sales-based tobacco consumption data are mostly taken from ISS4,5. They have been arranged into 5-year periods matching those used for mortality, but starting earlier if available. They have been entered, so far as they are available, for three product categories: manufactured cigarettes (MC), total cigarettes (i.e. including hand-rolled) (TC), and all tobacco products (A). They are given as number (or grams, for all tobacco products) per adult per day. They commonly start around the 1920s, but go back much earlier for a few countries. Where original sales data are not available for all 5 years an average from the File Ref: N:\IMASS\IMASSv4\docs\IMASSv4UserGuideAndExamples.doc 4 available years is used. As with mortality data mentioned above, the first and last periods are commonly based on less than a full 5 years. Note that sales-based consumption data are not age- or sex-specific. Tar data (sales-weighted average machine yield, mg per cigarette) are also available for some countries from ISS4,5, commonly starting around the 1960s. Tar is assumed to be 35 mg/cigarette up to 1955 (except in the very few instances of actual data before that year), with simple linear interpolation used to fill in missing years. Tar data are also not age- or sex-specific. The availability of sales-based tobacco consumption and tar data is shown, for each country, in Table 2. The main survey-based data consist of: $ prevalence, for each of the three product categories, as a percentage, and $ consumption of manufactured cigarettes and of total cigarettes, as number per person per day adjusted to total sales. Both these types of data are taken from Supplement 16,7 to ISS, which made estimates from all the survey data presented in ISS for standardized age groups, and averaged them by sex × 5-year period × 5-year age group. These estimates assume that there were no smokers below the age of 15. Prevalence estimates commonly start around the 1950s, with consumption estimates commonly starting in the 1960s. Fuller details of the availability of the main survey-based tobacco data are shown, for each country, in Table 3. It should be noted that the original surveys on which these estimates are based were drawn from a wide variety of sources, as discussed in the Methods section of ISS, and some cautions regarding the estimation process are discussed in the supplement. The main survey-based data derive from studies in which subjects are asked about their current-smoking habits. For eleven countries, alternative survey-based data sets are also available. These are based on studies in which subjects are asked about their lifetime smoking history (see ISS2 Appendix V and Supplement 28 for a description of this retrospective method and a discussion of some of its advantages and disadvantages). These data commonly relate to birth cohorts born after about 1890 and do not involve the assumption of no smoking below age 15. They are taken from various published sources and are not derived on a consistent basis (see Table 4 for fuller details of the surveys). No attempt has been made to standardize these data. The database simply includes the data for the nearest relevant standard period and age group, either duplicating data or leaving gaps as appropriate to the individual case. For instance, many of the sources are based on 10-year birth cohorts, and these have been entered by repeating the data for the two relevant age groups. The user will need File Ref: N:\IMASS\IMASSv4\docs\IMASSv4UserGuideAndExamples.doc 5 to consider how to use these alternative data sets on an individual basis. Their advantage is that they often allow lifetime tobacco history to be estimated over a longer time period than is possible with the main survey-based data. 1.6 Definitions of causes of death Deaths are coded according to successive revisions of the International Classification of Diseases (ICD). Countries vary as to when (and if) they introduce the various revisions (see Table 1). In the 1950s the 6th revision was in use, and the latest 10th revision, published in 1992, is now in use by 26 of the countries. Except in the case of the 10th revision, which is used in full, data are provided to WHO according to various summary coding lists based on the ICD, and some countries use their own more limited versions. Changes between the ICD revisions reflect differences in the understanding of the disease process and changes in terminology. For instance, stroke was a disease of the nervous system up to the 7th revision and of the vascular system subsequently, while COPD is a term of only relatively recent origin. These changes can make it difficult to extract consistently defined series of mortality data. The actual definitions used for the eighteen disease groupings are detailed in Table 5. As can be seen from Table 5, there is no real difficulty in obtaining a comparable disease definition from the data available for the various ICD revisions for many of the cancers. Indeed the definitions are essentially identical throughout for breast cancer, cervical cancer, larynx cancer, lung cancer, oesophageal cancer, nasal cancer, pancreatic cancer and stomach cancer, while changes in definitions for other cancers would have little effect on the trend in rates. Here we have: Bladder cancer: The 6th and 7th revisions include, but later revisions, exclude malignant neoplasms of other urinary organs, including urethra. Colorectal cancer: While the 9th and 10th revisions include cancers of the anus and rectosigmoid junction, the 6th and 7th revisions omit both these cancers, while the 8th revision omits cancer of the anus. Liver cancer: The 9th revision excludes, but other revisions include, cancer of intrahepatic bile ducts. The definition of peptic ulcer is also comparable in successive revisions. That for stroke also seems quite comparable, though it should be noted that in the 6th and 7th revisions, stroke was a subset of “diseases of the nervous system and sense organs”, entitled “vascular lesions affecting central nervous system”, while in later revisions it was a subset of “disease of the circulatory system” entitled “cerebrovascular disease”. File Ref: N:\IMASS\IMASSv4\docs\IMASSv4UserGuideAndExamples.doc 6 For IHD, the definitions used in the 8th, 9th and 10th revisions are also quite comparable. However, the definitions used in the 6th and 7th revisions are somewhat broader. It has been suggested9 that comparability might be obtained by using codes 420 + 422.1 in the 6th and 7th revisions, but data are not available from WHO for such detailed codes. Examination of 1965 data for England and Wales showed that deaths for summary code A081 (as used in the database) were about 11% higher for men and 25% higher for women than deaths for 420 + 422.1, so the discontinuity is not a minor one. Given that the alternative was not to have any IHD data before about 1968 (when the ICD 8th revision came in), it seemed better to include earlier data using a somewhat different definition, but making it clear that there was a problem of non-comparability when studying time trends. For COPD the problem is more complex. Ideally, for comparison with smoking data, one would have liked a disease definition which included the terms chronic bronchitis (CB), emphysema and COPD. However, there were a number of problems: (i) (ii) (iii) (iv) asthma, as well as bronchitis unqualified as to whether it is acute or chronic, is combined with CB and emphysema in the same WHO broad summary code in the 8th and 9th revisions, COPD, a term only commonly used in the last 20 years or so, is classified with “other respiratory disease” in the 6th, 7th and 8th revisions, emphysema is classified with “other respiratory disease” in the 6th and 7th revisions, and asthma is included under allergic disorders (and not as a respiratory disease at all) in the 6th and 7th revisions and cannot be separately identified from the available data. After studying the coding systems at some length it became clear that there was no entirely satisfactory solution. The definition of COPD finally selected (as detailed in Table 5) is comparable enough for the 9th and 10th revisions, but will lead to some discontinuities earlier, which may vary by country. As an alternative, data for respiratory diseases (non-acute) are also included. This broader disease grouping has fewer continuity problems, but includes various diseases that are not associated with smoking. It should also be noted that there are numerous ‘rules’ used when carrying out the coding, and that these may vary between countries and from time to time. For instance, the death coded is the underlying cause, but between 1985 and 1992 England and Wales adopted its own version of the rule to determine the underlying cause, resulting in a substantial drop in the death rate from pneumonia in that period10. A similar rule was adopted with the 10th revision of ICD, and a bridge- File Ref: N:\IMASS\IMASSv4\docs\IMASSv4UserGuideAndExamples.doc 7 coding study11 showed that the change in the ICD resulted in a rise of 3% in chronic lower respiratory disease* deaths compared with the 9th revision. A discussion of other aspects of the validity of mortality data is given by Alderson12. Tables 1-5 are provided for quick reference to the time span for which the different types of data are available. This information is also given in the Country Details sheet of each workbook. * ICD-9 490-494,496; ICD-10 J40-J47, i.e. the same as our definitions of COPD except for ICD-9 495 and ICD-10 J67 File Ref: N:\IMASS\IMASSv4\docs\IMASSv4UserGuideAndExamples.doc 8 2. Using the IMASS system 2.1 Getting started The system works in Excel 2000 or later. Macros must be enabled (some systems default to disallowing macros for virus protection). Depending on your screen resolution and ratio, it may be preferable to use View then Full screen (or alternatively Zoom 75%) for the best effect. See also section 2.9, System Requirements. When the CD is inserted, the install program should auto-run. If it does not, run IMASSv4-05install.exe from the CD. Generally files are installed with Aread-only@ status to prevent accidental corruption of the data although the main file (imass.xls) is installed with read/write status, so that settings for particular analyses can be saved. IMASS Version 4.05 installation will be identified by menu entries e.g. IMASS v4 Excel database. The default installation directory is C:\IMASSv4. It will not overwrite any IMASS versions prior to v4.00, but will update existing v4.xx versions. Previous IMASS versions (e.g. v3) can still be used to allow continuity of data in existing projects. The additions and changes are detailed in the IMASS Release Notes. The program can then be started from the Windows Start / Programs menu. Alternatively start Excel and then open the workbook C:\IMASSv4\IMASS.xls. Although this workbook contains many sheets, the user will carry out the majority of operations using just the first few sheets. These are: Index Mortality Plots Prevalence Plots Consumption (CPP) Plots, including both sales and survey-based consumption Scatter Plots, comparison of mortality vs prevalence/consumption Combination Plots, simultaneous plotting of mortality and either consumption (sales and/or survey based) or prevalence Each of the plot sheets holds a succession of pages, each page containing a single plot. These are reached directly by simply clicking on the relevant button in the Index sheet, or by scrolling down through the plot sheet. The user may also want to look at the first sheet, Country Details, of the country workbooks, where information on the exact range of available years of data is shown. These too can be reached from the Country Settings section of the Index sheet. Limited facilities to display the data by single years rather than 5-year periods are accessed from the Year buttons at the foot of the Mortality or Consumption Plot sections of the File Ref: N:\IMASS\IMASSv4\docs\IMASSv4UserGuideAndExamples.doc 9 Index sheet – see section 2.10. The ‘raw data’ can be found in the country workbooks if the user wishes to create their own analyses beyond those provided in IMASS – see section 2.11. 2.2 Using the Mortality Plots sheet On this sheet, the user can plot (or tabulate) mortality data according to a number of factors. The mortality data commonly start in the 1950s. In all plots on this sheet, the mortality rate forms the y-axis. First decide which factor is to form the x-axis of the plot, choosing from age group, period and birth cohort. Then decide which factor is to be represented by lines on the plot, choosing from age group, period, birth cohort, sex and country. Then click on the button labelled with the two chosen factors on the Index sheet to move there directly, or scroll down within the sheet to the relevant page. The pages are: 1 Period and Age group 2 Age group and Birth cohort 3 Period and Birth cohort 4 Sex and Age group 5 Sex and Period 6 Sex and Birth cohort 7 Country and Age group 8 Country and Period 9 Country and Birth cohort Looking at the first page, Period and Age group, with the default settings, Example 1 will be displayed. The content and appearance of the plot can be varied in several ways. By clicking on the X Axis options buttons: These buttons allow the two factors in the plot to be swapped. In this Example, if you click on Periods, the appropriate labels will appear on the x-axis (bottom) and the age group will appear in the legend (side-right). By using the drop-down menus: Data will be for a single country, chosen from the Country menu, with the Country Ratio (denominator) set to None (Single Country). Or, for a ratio of two countries, choose the numerator country with the Country menu and the denominator in the Country Ratio (denominator) menu. The relevant workbook(s) will open automatically. Sex can be set to Males, Females, Males & Females (combined) or Male/Female Ratio. Disease can be set to Lung Cancer, Ischaemic Heart Disease, COPD or Respiratory File Ref: N:\IMASS\IMASSv4\docs\IMASSv4UserGuideAndExamples.doc 10 Disease (non-acute). Definitions of these diseases have been discussed in section 1.6, as has the importance of ICD revision changes – the timing of these can be seen in Table 1 and in the Country Details sheet of each country workbook. By clicking on the Plot Settings button: By default, the x-axis is scaled to fit all the standard age groups. Use Plot Settings, then Age groups to show a restricted range, or to choose, e.g. alternate age groups. Either just click in the individual tick-boxes, or highlight all the ones you want to add (e.g. by using ctrl click), then click on the Show Selected Age Groups button. Note that you cannot combine age groups at this point in the program. By default all the standard periods are selected. All the selected periods are shown in the legend (subject to available space), and all that have data available appear as lines on the plot. Use Plot Settings, then Periods to change the periods selected. The colours/symbols will not be altered*. Click on Mortality Plots to get back to your plot. Note that Plot Settings apply to the whole of the Mortality Plots sheet. However, as we are working in the Age and Period page of the spreadsheet, only those settings will affect our current plot. By normal Excel facilities: Text can be typed into any of the blank cells outside the chart area. To edit the labels on the plot itself, scroll across to the right to column AB, where the automatically generated labels will be found. Edit as required, then press F9. For other changes to the plot, first right-click on the plot and choose Edit Chart Object. Some of the many possibilities are: To vary the range of the y-axis, right-click on an axis value and select Format Axis. Choosing the Scale tab, the default settings for the y-axis are seen as minimum = 0, maximum = automatic, crosses at 0. These can be changed e.g. if you want to create a series of plots all using the same fixed range. To set a logarithmic scale on the y-axis, right-click on an axis value, choose Format axis, then the Scale tab and tick Logarithmic scale. You must make sure to avoid having a minimum of zero, the easiest way to do this is to fix the Minimum at a low value (e.g. 0.1) and setting Crosses at to the same value. This is shown later in Example 2. To change the appearance of the axis labels, for instance to change the number of decimal places on the y-axis labels, use Format Axis then choose the Number tab, and alter as required. On the x-axis, you can choose the Alignment tab to change the angle at which the labels are displayed. * There is an Excel problem that if more than 16 colour/symbol definitions are in use (as is the case for periods and cohorts, but not for age groups) and if lines are hidden and then the axes are swapped, then the colours will change. To avoid this, have all periods/cohorts showing when swapping axes. File Ref: N:\IMASS\IMASSv4\docs\IMASSv4UserGuideAndExamples.doc 11 To change the colours or symbols, right-click on a line and choose Format Data Series, Pattern. To display the line label at each point, choose Format Data Series, Data Labels, and tick Series Name. Do not use these methods to change the range of the x-axis, or to edit its labels. Use Plot Settings, or edit column AB as described above. Then click outside the chart area to de-select the plot. Click on the Print Plots button to print this plot and its settings. Other options for printing and saving the results are discussed below (section 2.8). Click on the Data Table button to display the equivalent data table. The columns correspond to the x-axis factor and the rows to the lines from the plot. Normal Excel facilities can be used here (e.g. to change the number of decimal places displayed). Those settings which are controlled by the drop-down menus can be changed here too, in which case the plot will also be updated. The Print Table button prints the table (see Example 1T). When finished, click on Go to Mortality Plots which takes you back to the original position in the plot sheet. The next few pages of the Mortality Plots sheet, for single country or country ratio plots, share many of the features already described. Example 2 shows a plot generated on page 2, Age group and Birth cohort. A restricted age range has been chosen (via Plot Settings) and a Log Scale set on the y-axis (via Edit Chart Settings). Example 3, generated on page 5, Sex and Period, illustrates some features relevant to pages 4-6. The x-axis factor is already fixed, since the other factor (i.e. sex) cannot be used on the x-axis and so must appear as the lines. Although the available lines include the M/F ratio, it is unlikely that this will be required alongside the other (Male, Female and Combined) lines, since the scale will be inappropriate. It can be hidden via Plot Settings. (See also Example 6 below). Since age, period and birth cohort are interdependent, and since one of these must be chosen as the x-axis factor, a single drop-down menu is provided to allow one only of the other two to be chosen. The third is thus implicitly fixed. On page 5, Sex and Period, a facility is available to allow an age-group to be defined as a combination of standard age groups. This can be weighted either to the actual population (i.e. unweighted), or to a standard population (WHO-World or European standard populations13, or a Custom standard population can be defined as any country/year). Click on Combined Age Group Settings to define the combined group and then choose it from the bottom of the Cohort or Age group drop-down menu. File Ref: N:\IMASS\IMASSv4\docs\IMASSv4UserGuideAndExamples.doc 12 Also on page 5, a facility is available to allow the data in all lines to be scaled relative to a chosen period. This has the effect of forcing all the lines to pass through a single point at value 1, and the relative changes in the statistic may be more clearly seen. This is demonstrated later in Example 5. The final pages 7-9 of the Mortality Plots sheets offer plots for multiple countries. Here, unlike the earlier pages, any changes to the drop down menus (including changes to the Combined Age Group Settings and Relative Scaling Period on page 8 only) are not immediately implemented in the plot. Instead, an Update Country Plots button appears. When this is clicked the relevant country workbooks are each opened in turn and the plot is built up. See Example 4 generated on page 8. (Notice that the Plot Settings were used to restrict the periods on the x-axis in Example 3, and this remained set for Example 4). This is a good page on which to demonstrate two features already mentioned. The Relative Scaling Period is shown in Example 5. Note that any line with missing data at the chosen period will disappear, as happened with Czechoslovakia in the Example. Choosing a period in the centre of the range would avoid this. This page is also appropriate for plotting the sex ratio – see Example 6. Once a country plot has been updated, a further option becomes available, to convert the mortality rates into country rankings (1 = highest, 2 = next highest, and so on). These can be either unadjusted or normalised*. See Example 7, which is a rank version of Example 4. By default, the rank plots are presented in Portrait orientation to allow all 30 countries to be displayed, but as only a few countries are included in the example, this has be altered by changing the y-axis limits (as described above, and changing the maximum to the number of countries plus one – the ‘crosses at’ value will update automatically) and dragging the chart area. 2.3 Using the Prevalence Plots sheet, and the Lagging or Averaging option Prevalence data represent the percentage of the population who smoke. The data are taken from Supplement 16,7 to ISS and are estimates based on all the sex-specific surveys in ISS standardized to 5-year age groups and 5-year periods. They are structured in the same way as the mortality data and commonly start around the 1950s. * If X countries are selected, but at a particular point data are available for only Y countries, normalised ranks are plotted where: Normalised rank = Rank * (X+1)/(Y+1) This adjustment ensures that the country in the middle stays in the middle, and the countries with the highest and lowest ranks stay symmetrically near the top and bottom of the figure. File Ref: N:\IMASS\IMASSv4\docs\IMASSv4UserGuideAndExamples.doc 13 This sheet is arranged into the same 9 pages as the Mortality plots sheet, and all the features described above apply. Two extra options are available here. Firstly, the Tobacco Type is chosen as Manufactured cigarettes, Total cigarettes (i.e. including hand rolled) or All tobacco products. The second special facility added here is Lagging or Averaging. In Example 8, the Lag or Average Start and End settings (top-right) are both set to the default values of 0 (Current), so the data relate directly to the period shown, exactly as for mortality plots. As described in section 1.2, a simple approximation to the lifetime tobacco history relevant to a particular cell in the mortality table can be found by starting at the equivalent current cell in the tobacco table and working backwards up the diagonal of the table. The Lag or Average Start and End drop-down menus (top-right) allow this to be carried out. If both are set to the same time, then the tobacco statistic is lagged, e.g. if both are set to 10 years previous, then the value used is taken from two steps up the diagonal from the current cell. If set to different times, then the value is calculated as a simple average, e.g. if the start is set to 15 years previous and the end to rd nd st 5 years previous, then the value is the average of the 3 , 2 and 1 steps up the diagonal. See Example 9. Some points to note: The result will be set as missing, unless all the values in the range are available, i.e. are not themselves missing and fall within the subjects= lifetime, e.g. consumption 20 years ago will automatically be missing for 15-19 year olds. For the standard ISS survey-based data, it is implicitly assumed that prevalence and consumption were zero below age 15. So if a lag of 10 years is set, data for age groups 15-19 and 20-24 will automatically be zero. This assumption is made even for periods with no data available, so that these zeros are available for lag/average calculations. Consumption during lifetime or adulthood can be calculated by setting the Start point to Age 0-4 or Age 15-19 respectively, and End to 0 (Current). If creating a Combined age-group, or using Sexes-combined, then the simple average/lag is calculated first on the original single sex/5-year age group, then the population weighted average is calculated. In other words, only the population at the current time-point is used. Some limitations on the validity of this process have been described in section 1.2. Note also that the 85+ age group is clearly wider than 5 years, so its use in lagged or averaged calculations is not recommended. File Ref: N:\IMASS\IMASSv4\docs\IMASSv4UserGuideAndExamples.doc 14 2.4 Using the Consumption Plots sheet Consumption data are of two types. Sales data are taken from ISS4,5 and are given as number of cigarettes (or grams, for all tobacco products) per adult per day. They start commonly around the 1920s, but much earlier for a few countries. Tar data (mg per cigarette) are also available for some countries, commonly starting around the 1960s. Where original sales data are not available for all 5 years an average from the available years is used, and for tar data, a value of 35 mg is assumed up to 1955, with a simple linear interpolate used across any missing period. Survey data are taken from Supplement 16,7 to ISS, and have been estimated similarly to the prevalence data. They are given as number of cigarettes (or grams, for all tobacco products) per person per day. This sheet is very similar to the Prevalence Plots sheet, with some additional options: Either sales-based or survey-based consumption data can be chosen. Since salesbased data are not sex-specific, whereas survey-based data are, this is combined with the choice of sex (on a single drop-down menu for pages 1-3 and 7-9, and in Plot Settings for pages 4-6. In Example 10, Males & Females, (Sales) has been chosen. Sales data are also not age-specific, and so when current or lagged data have been chosen (i.e. if Start and End are set the same) the choice of Age group does not affect the results. However if an average (e.g. Start = Age 15-19, End = 0 (Current)) has been set, then the Age group setting will affect the result. Setting a lag for sales data simply shifts the data. It is possible to choose sales data for e.g. a Sex and Age group plot, but this is not particularly appropriate as the data will all be the same. Tar Adjustment is chosen as None, Standard or Sq=root Standard. In Standard adjustment, consumption is expressed in “constant tar cigarettes” estimated as number of cigarettes tar / 35 where 35mg is the standard tar yield per cigarette assumed before 1955. Sq=root Standard (i.e. square root of Standard), involves an adjustment proposed to model “compensation” by smokers when smoking lower tar cigarettes14,15. Tar adjustment can be applied to any tobacco type, although its relevance is primarily to manufactured cigarettes. See Example 11. Note that tar adjustment is only possible where tar data are available or have been estimated (see section 1.5 and Table 2). Thus in Example 11, many of the lines stop earlier than in Example 10. Notice that in Examples 10 and 11, a wider range of periods has been set (via Plot Settings) than in Examples 3-5, because sales data are available earlier than mortality data. Notice also that there may be a gap in the data series (e.g. Bulgaria has no sales data for the 1940s or 1950s – Example 10). File Ref: N:\IMASS\IMASSv4\docs\IMASSv4UserGuideAndExamples.doc 15 2.5 Using the Scatter Plots sheet In this sheet, there are two pages, with page 1 – Consumption and page 2 – Prevalence respectively set on the x-axis, and mortality set on the y-axis. The countries are shown in the legend and as single points in the plot. The Age and Period or Cohort settings apply to both the tobacco statistic and mortality. Sex is chosen separately – in most cases one will want to choose the same setting for both. However if having chosen sales-based consumption, one might wish to choose a particular sex for the mortality. The other settings, including the Lagging or Averaging, apply only to the tobacco statistic. Like multi country plots on the previous sheets any changes to the drop down menus are not immediately implemented in the scatter plots. Instead, an Update Scatter Plots button appears. When this is clicked the relevant country workbooks are each opened in turn and the plot is built up. See Example 12. Each point in the scatter plot can be labelled with the country name – from Edit Chart Object, right click and choose Chart Options, Data labels, Series name. Unfortunately, the font sizes must either be changed individually (right click and Format data label, Font), or globally for the whole plot including headings (Format Chart Area, Font). 2.6 Using the Combination Plots sheet This sheet allows plots to be constructed showing lines for both mortality and tobacco statistics, with each line individually defined. The first three pages have Age, Period and Cohort on the x-axis respectively. Both Consumption and Mortality are available on the y-axis, with the scale relevant to the tobacco statistics shown on the left, and the scale relevant to the mortality statistics on the right. The next three pages repeat the sequence with Prevalence and Mortality. On each plot, up to 3 tobacco lines and 3 mortality lines can be drawn. If less than the full 6 lines are required, use Plot Settings to hide unwanted ones. See Example 13, generated on page 5, where the third mortality line has been hidden by unticking the Mort 3 box in the Prev & Mort for Period section.. Then for each line in turn, use the drop-down menus to choose: Age (including combined age group), Period or Cohort (except for the one in use on the x-axis) Sex (including combined and ratio) and Country (including country ratio). Other options applicable to the tobacco lines are: Tobacco type, Tar adjustment (not available for prevalence) and Lagging / averaging, and to the mortality lines: Disease. Note that in the consumption plots, the choice between Sales and Survey based data is made by the Sex & Source drop-down, since sales data are not sex-specific. File Ref: N:\IMASS\IMASSv4\docs\IMASSv4UserGuideAndExamples.doc 16 Changes to the drop-down menus are not immediately reflected in the plot. Instead, a marker (Update Req’) is shown alongside the line in question and an Update Required button is displayed over the plot. When all the line definitions are ready, click on the Update Required button and all the changes to the plot are implemented. If you make any changes to the drop-down menus from the Data Table part of the sheet, then you will be transferred back to the plot in order to carry out the update. In the legend, the lines are simply labelled as Mort1, Mort2 etc, but these can be replaced by more meaningful labels by using Plot Settings, then editing in the relevant sections of column K or N. If you require a long label split over 2 lines as in Example 14, use the keystroke combination <Alt>+<Ret> to insert a hard return in the cell text, like this US sales <Alt>+<Ret> (20 year average) or use the following formula format :="US sales"&CHAR(10)&"(20 year average)" If a long label causes the legend to overlap with the axis labels, use Edit Chart Object, right-click in the legend, and choose Format Legend, Placement, Right. On pages 2 and 5 with Period on the x-axis, there is also a scaling option. This applies to all the lines, causing the data to be scaled relative to a chosen period. In this case, it will probably be desirable to change the y-axis settings so that both tobacco and mortality have the same maximum value (using Edit Chart Object, then Format Axis, Scale as previously described). See Example 15. Note in this case the plot axes are not automatically labelled as relative. In the example the labels have been edited manually. Note that when two y-axis scales are in use, it is not possible to have grid lines. If all mortality lines are hidden, the mortality scale is hidden. However if all the tobacco lines are hidden, then the plot border, the background shading and x-axis scale get hidden as well as the tobacco scale – this appears to be a deficiency in Excel, which can be got round by first right-clicking on each mortality line and choosing Format Data Series, Axis, Primary Axis, before deselecting the tobacco lines. Then edit the y-axis label to Mortality. 2.7 Using alternative (retrospective) tobacco data As described in section 1.5, alternative survey-based data sets are available for 11 countries. To choose an alternative data set, go to Country Settings from the Index. Information on the available sources can be displayed by choosing a country, then clicking the Display … Survey Sources … button. The data sets can be chosen from the Survey Source drop-down menus. Any country, scatter or combination plots already using tobacco data for the country in question will immediately be marked as needing update. Thereafter, whenever the country in question is displayed, either in a Country File Ref: N:\IMASS\IMASSv4\docs\IMASSv4UserGuideAndExamples.doc 17 menu or in a legend, the abbreviated name of the data set will also be shown. (Note that the generic labels Source 2 or Source 3 are used in Plot Setting and are initially displayed until a plot is updated. The country name is not altered on the Mortality Plots sheets). See Example 16, using UK [HALS]. Because this data set relates to 10year birth cohorts, it is appropriate to show only alternate cohorts. 2.8 Printing and saving results As mentioned earlier, the Print Plots button prints out the current plot with its settings. Use the normal Excel print facilities to change the printer properties. When working on drafts for a report, a quick way of saving a sequence of plots and their settings is to select and copy the relevant area (including one column to the right of the plot), and then in Word, set the page to Landscape and use Paste Special, Picture (Enhanced Metafile). Each plot will fill naturally one page. The Worked example was generated by this method. Alternatively, Alt PrintScreen in Excel and a simple paste in Word will give a screen image. By these methods, the drop-down settings are stored as part of a graphic, so the format and wording cannot be edited. Data tables can be copied by the same methods. For plots in a more polished report, it may be better to type the headings directly into Word and copy just the plot – right-click on the plot and select ‘Edit Chart Object’ then right-click in the plot area (i.e. the white area of the plot) and select Copy, then in Word use Paste Special, Picture (Enhanced Metafile). The plot can be dragged to size either in Excel or in Word, but any changes to the labels must be done while still in Excel. Another possibility is to create a second copy of a plot within Excel, just using simple copy and paste, then right-click on the new copy of the plot and choose Location, As a new sheet. This has two purposes: You can create customized labels directly on the second copy, rather than by editing in column AB. When a change is made to a drop-down menu, the data will be updated in both copies but labels will be updated only in the original. Thus the customized labels will not be destroyed in the second copy. Note that you must be careful not to leave erroneous labels. The size of the second copy can be controlled precisely by using Page Setup, Margins. This will give more accurate sizing than dragging, and will avoid the fonts becoming distorted. A data table can be transferred to a Word table by using Paste Special, Formatted text (RTF). (This is preferable to Paste Cells which also includes any hidden data.) When transferring results to another Excel file, a simple copy and paste will usually create links to the original IMASS files. If a stand-alone file containing results only is required, a data table can be copied using Paste Special, Values and Paste Special, File Ref: N:\IMASS\IMASSv4\docs\IMASSv4UserGuideAndExamples.doc 18 Formats. Any hidden rows or columns will also be copied. To copy a plot, the following method can be used: Right-click on the plot area, choose Edit Chart Object, then Source Data and looking at the Data Range tab, make a note of the data range (e.g. sheet = Prev Plot Data, cells = A9:P43), then cancel. Copy the chart to the new file. Also copy the data from the data range to another sheet in the new file, starting at the same start cell (e.g. A9), and using Paste Special, Values. Hide any rows and/or columns that are not required. On the new chart, go to the Data Range tab (as before) and change IMASS and the sheet name to the names of the new file and the new data sheet respectively. 2.9 System requirements and configuration The preferred minimum system requirement is a 1200 MHz PC with 512 MB RAM running Microsoft Excel 2002 or later. Macros must be enabled within Excel for IMASS to function correctly. In Excel 2000 this is done from menu option Tools, Macros, Security, select the Security Level tab and set to Low. If you see the message requesting virus scan each time Excel opens a workbook, it probably means that the Microsoft Office plug-in is enabled in your antivirus software. The opening of work books can be speeded up by disabling that plug-in. Consult your antivirus documentation, but for example in Norton Internet Security 2003 select menu item Options, Norton AntiVirus and the plug-in option can be found in the Miscellaneous section. 2.10 Using the Year Plots sheets All analyses described thus far are based on 5-year periods. For mortality data and for sales-based tobacco consumption data, simple plots (or tables) based on single year data can be generated. In each case, a drop-down menu is used to select a country, and the range of years to be displayed on the x-axis is set via Plot Settings. For mortality, there are Year and Age group and Sex and Year pages, directly equivalent to pages 1 and 5 of the standard Mortality Plots sheet, with the same facilities and settings for disease, sex and age groups (except that country ratios are not available, and only year can be displayed on the x-axis) See Example 17. In the Year and Sales sheet, the various tobacco statistics (total sales, sales per adult, and tar) can be displayed. The statistics are chosen on the Plot Settings page, and tar adjustment via a drop-down menu. The single year facility is not available for survey-based data because the estimates taken from the ISS Supplement relate intrinsically to 5-year periods. File Ref: N:\IMASS\IMASSv4\docs\IMASSv4UserGuideAndExamples.doc 19 2.11 Customized analysis The files provide full Excel functionality, so that users can create their own customized analyses or add extra data. Note that background calculations are switched off, so that pressing key F9 (Calculate Now) is required (or change to automatic by Tools, Options, Calculation, Automatic). The ‘raw data’, i.e. for single years rather than 5-year periods as used in most provided analyses, can be found in the country workbooks: Data type Numbers of deaths Population (in hundreds) Sales and tar Sheet Deaths Male, Deaths Female Pop Male, Pop Female Tobacco Data Start row 143 43 43 Prevalence and survey-based consumption are not available for single years. If changes are to be made to a country workbook, remove the ‘Read only’ attribute from the file properties. You should always open the main IMASS workbook first before opening the country workbook, and save changes to the country workbook before returning to IMASS. Additional tobacco data sources can be added to a country workbook, by adding the source description to rows 59 or 60 of the Country Details sheet, and entering the data in the appropriate Retro or Retro 2 sheet (e.g. Prev MC Male Retro). 3. Acknowledgments We thank the tobacco industry for providing generous financial support towards the development of IMASS. We are grateful to WHO for making publicly available the mortality data used in IMASS. The authors are responsible for the accuracy of transferring the data into IMASS and the implementation of the software. File Ref: N:\IMASS\IMASSv4\docs\IMASSv4UserGuideAndExamples.doc 20 4. References 1. Lee PN, Fry JS, Forey BA. Estimating age, sex and period specific constant tar cigarette consumption in the UK [Letter]. Thorax 1993;48:679. 2. Forey BA, Lee PN, Fry JS. Updating UK estimates of age, sex and period specific cumulative constant tar cigarette consumption per adult. Thorax 1998;53:875-8. 3. World Health Organization. WHO Mortality Database. http://www3.who.int/whosis 4. Forey B, Hamling J, Hamling J, Lee P, editors. International Smoking Statistics. A collection of historical data from 30 economically developed countries, Web edition. Sutton, UK: P N Lee Statistics & Computing Ltd; 2006-2007. www.pnlee.co.uk/iss.htm 5. Forey B, Hamling J, Lee P, Wald N, editors. International Smoking Statistics. A collection of historical data from 30 economically developed countries, 2nd edition. London and Oxford: Wolfson Institute of Preventive Medicine and Oxford University Press; 2002. Errata available at www.pnlee.co.uk/ISS2.htm. 6. Forey B, Lee P. Estimation of sex-specific smoking statistics by standardized age groups and time periods. Supplement 1 to International Smoking Statistics, a collection of historical data from 30 economically developed countries (2nd edition). Sutton, Surrey: P N Lee Statistics and Computing Ltd; 2002. www.pnlee.co.uk/reflist.htm [Download ISS2suppl1 FOREY2002C] 7. Forey B, Hamling J, Hamling J, Lee P. Estimation of sex-specific smoking statistics by standardized age groups and time periods. Supplement 1 to International Smoking Statistics, a collection of historical data from 30 economically developed countries (web edition). Update notes. Sutton, Surrey: P N Lee Statistics and Computing Ltd; 2007. www.pnlee.co.uk/iss.htm 8. Forey B, Lee P. Estimating past smoking habits by an indirect method. An investigation into a method based on recall, with application to Great Britain. Supplement 2 to International Smoking Statistics, a collection of historical data from 30 economically developed countries (2nd edition). Sutton, Surrey: P N Lee Statistics and Computing Ltd; 2002. www.pnlee.co.uk/reflist.htm [Download ISS2suppl2 FOREY2002D] 9. Darby SC, Doll R, Stratton IM. Trends in mortality from smoking-related diseases in England and Wales. In: Wald N, Froggatt P, editors. Nicotine, smoking, and the low tar programme, Proceedings of a symposium 'Nicotine, smoking, and the low tar programme'. London, 18-20 November 1986. Oxford, New York, Tokyo: Oxford University Press, 1989;70-82. 10. Rooney C, Devis T. Mortality trends by cause of death in England and Wales 1980-94: the impact of introducing automatic coding and related changes in 1993. Popul Trends 1996;86:29-35. 11. Brock A, Griffiths C, Rooney C. The impact of introducing ICD-10 on analysis of respiratory mortality trends in England and Wales. Health Stat Q 2006;29:9-17. 12. Alderson M. International Mortality Statistics. London: The Macmillan Press; 1981. 13. International Agency for Research on Cancer. Waterhouse J, Muir C, Correa P, Powell J, editors. Cancer incidence in five continents, Volume III. Lyon, France: IARC; 1976. 14. Stephen A, Frost C, Thompson S, Wald N. Estimating the extent of compensatory smoking. In: Wald N, Froggatt P, editors. Nicotine, smoking and the low tar programme, Proceedings of a symposium 'Nicotine, smoking, and the low tar programme'. London, 18-20 November 1986. Oxford, New York, Tokyo: Oxford University Press, 1989;100-15. 15. Adlkofer F, Scherer G, Biber A, Heller W-D, Lee PN, Schievelbein H. Consistency of nicotine intake in smokers of cigarettes with varying nicotine yields. In: Wald N, Froggatt P, editors. Nicotine, smoking, and the low tar programme, Proceedings of a symposium 'Nicotine, smoking, and the low tar programme'. London, 18-20 November 1986. Oxford, New York, Tokyo: Oxford University Press, 1989;116-30. File Ref: N:\IMASS\IMASSv4\docs\IMASSv4UserGuideAndExamples.doc 21 Appendix: IMASS Revision History Summary IMASS v4.12 05.03.2015 1. Updated smoking statistics and sales data from the following ISS3 (Web edition) chapters and the ISS3 Supplement 1 update:ISS3 chapter IMASSv4.11 workbooks Netherlands Netherlands.xls Poland Poland.xls Portugal Portugal.xls (See release notes and country workbooks for detailed change history) 2. Removed deaths for Czechoslovakia.xls 1991 to comply with our statement that we would not use WHO data past 1990 for countries that split around that time. (See release notes and country workbooks for detailed change history) 3. Minor change to Belgium, Hungary & Ireland [Country Details] to show source as ISS Web edition (Rather than ISS2). IMASS v4.11 14.11.2013 1. Population and Mortality data updated from the World Health Organization (WHO) as of 1st May 2013. 2. Updated smoking statistics and sales data from the following ISS3 (Web edition) chapters and the ISS3 Supplement 1 update:ISS3 chapter IMASSv4.11 workbooks Belgium Belgium.xls Hungary Hungary.xls Ireland Ireland.xls (See release notes and country workbooks for detailed change history) 3. Excel 2010 compatibility: Previous versions of IMASS had only been tested on versions of Excel up to Excel 2007 for this version (IMASSv4.11) testing was extended to include Excel 2010. During this testing it was noted that Excel 2010 would regularly crash. The problem was traced to a bug in Excel 2010 which sometimes crashes when attempting to calculate an entire worksheet. The problem appears to be confined to Excel 2010 as no problems have been seen on earlier versions of Excel. A work around for this Excel 2010 bug has been implemented in this release of IMASSv4.11. IMASS v4.10 14.01.2013 1. Norway: Population and Mortality data updated from the World Health Organization (WHO) as of 9th July 2012. 2. Updated smoking statistics and sales data from the following ISS3 (Web edition) chapters and the ISS3 Supplement 1 update:ISS3 chapter IMASSv4.10 workbooks Norway Norway.xls (See release notes and country workbooks for detailed change history) File Ref: N:\IMASS\IMASSv4\docs\IMASSv4UserGuideAndExamples.doc 22 IMASS v4.09 30.01.2012 1. Adult population was extended (using a copy of the most recent year available) to allow consumption (per adult per day) for 2006-2010 to be calculated using the latest tobacco sales:Canada Canada.xls Updated 26th Jan 2012 Consumption (per adult per day) for 2006-2010 are based on population from 2005 USA USA.xls Updated 26th Jan 2012 Consumption (per adult per day) for 2006-2010 are based on population from 2005 2. Updated smoking statistics and sales data from the following ISS3 (Web edition) chapters and the ISS3 Supplement 1 update:ISS3 chapter IMASSv4.09 workbooks Australia Australia.xls Canada Canada.xls United Kingdom UK.xls USA USA.xls (See release notes and country workbooks for detailed change history) IMASS v4.08 30.11.2011 1. Minor correction to population for Italy. 2. Updated smoking statistics and sales data from the following ISS3 (Web edition) chapters and the ISS3 Supplement 1 update:ISS3 chapter IMASSv4.08 workbooks Denmark Denmark.xls Finland Finland.xls France France.xls Germany Germany.xls Italy Italy.xls Japan Japan.xls New Zealand New Zealand.xls Spain Spain.xls Switzerland Switzerland.xls (See release notes and country workbooks for detailed change history) IMASS v4.07 21.07.2011 1. Population and Mortality data updated from the World Health Organization (WHO) as of 25th March 2011. 2. Updated smoking statistics and sales data from the following ISS3 (Web edition) chapters and the ISS3 Supplement 1 update:ISS3 chapter IMASSv4.07 workbooks Finland Finland.xls Italy Italy.xls (See release notes and country workbooks for detailed change history) File Ref: N:\IMASS\IMASSv4\docs\IMASSv4UserGuideAndExamples.doc 23 IMASS v4.06 23.11.2010 1. Mortality data added for new diseases updated from the World Health Organization (WHO) as of 1st December 2009. The following diseases are available:Bladder Cancer Breast Cancer Cervical Cancer Colorectal Cancer Larynx Cancer Liver Cancer * Lung Cancer Oesophageal Cancer Oral Cancer Pancreatic Cancer Stomach Cancer All Cancer * COPD * Ischaemic Heart Disease Peptic Ulcer * Respiratory Disease Stroke All Causes *Existing IMASSv4.05 diseases (See release notes and country workbooks for detailed change history) IMASS v4.05 08.02.2010 1. Population and mortality data updated from the World Health Organization (WHO) as of 1st December 2009. (See release notes and country workbooks for detailed change history) 2. Updated smoking statistics and sales data from the following ISS3 (Web edition) chapters and the ISS3 Supplement 1 update:ISS3 chapter IMASSv4.05 workbooks France France.xls Sweden Sweden.xls (See release notes and country workbooks for detailed change history) IMASS v4.04 18.3.2009 1. Facility added for displaying single year data (mortality and sales) in plots. Changes to method for setting up tables of single year data. 2. Updated smoking statistics and sales data from the New Zealand chapter of ISS3 (Web edition) File Ref: N:\IMASS\IMASSv4\docs\IMASSv4UserGuideAndExamples.doc 24 IMASS v4.03 26.1.2009 1. Population and mortality data updated from the World Health Organization (WHO) as of 14th April 2008. 2. Updated smoking statistics and sales data from the following ISS3 (Web edition) chapters and the ISS3 Supplement 1 update:Austria Denmark Germany Switzerland 3. Facility added to allow display of single year tables of mortality and sales for all countries. 4. Minor changes in handling of missing population data. (See release notes and country workbooks for detailed change history) IMASS v4.02 15.11.2007 1. Fixed bug in Prevalence plot settings for Birth cohort and Sex not correctly selecting lines on associated plots 2. Fixed bug in Prevalence plot settings for Country not correctly selecting lines on associated country Rank plots IMASS v4.01 5.11.2007 1. IMASS v4.01 contains updated smoking statistics and sales data from the following ISS3 (Web edition) chapters and the ISS3 Supplement 1 update:ISS3 chapter IMASSv4.01 workbooks Australia Australia.xls Canada Canada.xls Japan Japan.xls United Kingdom UK.xls USA USA.xls (See release notes and country workbooks for detailed change history) IMASS v4.00 27.9.2007 1. IMASS v4.00 contains updated population and mortality data from The World Health Organisation (WHO) as of 17 Nov 2006. There have also been some minor changes to pre-1950 population in some countries to bring IMASSv4.00 in line with the population data used in the International Smoking Statistics publication (ISS). The updated population data will be used for ISS3 (Web Edition). (See release notes and country workbooks for detailed change history) File Ref: N:\IMASS\IMASSv4\docs\IMASSv4UserGuideAndExamples.doc 25 IMASS v3.02 31.01.2007 1. Excel 2003 compatibility issues fixed. IMASS v3.01 23.05.2006 1. Dropdown menu corrections in main IMASS workbook Note. The specific source of the standardizing populations (World Standard and European Standard) was mistakenly not included in the documentation of Version 3. It is given here for information only, and will be included in a future release of the documentation. International Agency for Research on Cancer. Waterhouse J, Muir C, Correa P, Powell J, editors. Cancer incidence in five continents, Volume III. Lyon, France: IARC; 1976. IMASS v3.00 8.3.2004 1. Country workbooks are now opened automatically when required, and Excel background calculations are ‘off’. This gives a considerable improvement in performance and ease of use. 2. There is no longer a limit on the number of countries that can be included in a country plot or scatter plot. These plots now operate with an ‘Update’ button, which triggers the automatic opening of each relevant country workbook in turn. 3. An Index button available throughout to return to the Index sheet. 4. Within the mortality, prevalence and consumption sheets, data settings made through drop-down menus are now shared between pages 1-6, and between pages 7-9, rather than throughout the whole sheet. None are shared between sheets. 5. Ranking is now available on country plots. 6. Colours and symbols have been improved. 7. There is improved consistency in the method of selecting Source (sales or survey) and Sex for consumption data. 8. Plot labels and title are now in worksheet cells (in column AB) to allow for easy editing. Previously this had to be done as a chart edit. 9. In multi country and combination plots, any gap in a data series now shows as a gap on the plot, rather than being bridged by a straight line. 10. Selection of alternative tobacco data sources is now done in the main workbook, accessed via the Index page. Alternative data source added for Spain. 11. Mortality and population data have been updated using WHO data as at 2nd September 2003. File Ref: N:\IMASS\IMASSv4\docs\IMASSv4UserGuideAndExamples.doc 26 a. Although WHO has added provision for the 85+ age group to be split into 85-89, 90-94 and 95+, such data are available only for very recent years, and they remain combined in IMASS. Population data are now available as single persons rather than hundreds, but they remain as hundreds in IMASS. b. This update has provided one more recent year of mortality data for several countries and 2 more years for Switzerland, but removed 1951 data for France. c. Data for Switzerland for the 10th revision (1995-1997) were previously coded with special “G” codes; these remain for 1995-1996, but 1997 has been recoded and now uses the “ICD 10 Tabulation List 1”, as do the new years 1998-1999. This involved minor changes to the definition of COPD, but more major problems with continuity in respiratory diseases (non-acute). Consequently, data for this disease definition are not now included for Switzerland after 1994. d. WHO data codes no longer distinguish between the 6th and 7th ICD revisions, but the data are unchanged and the start dates for the 7th revision are still shown in Table 5 and in the ‘Country Details’ worksheet of each country workbook. File Ref: N:\IMASS\IMASSv4\docs\IMASSv4UserGuideAndExamples.doc 27 Table 1 Country Australia Austria Belgium Bulgaria Canada d Czechoslovakia Denmark Finland France e Germany f Greece Hungary Iceland Ireland g Israel Italy Japan Netherlands New Zealand Norway Poland Portugal Romania Spain Sweden h Switzerland UK USA k USSR f Yugoslavia Availability of mortality data a Deaths Single years Start 1950 1955 1954 1964 1950 1953 1951 1952 1950 1952 1961 1955 1951 1950 1950 1951 1950 1950 1950 1951 1959 1955 1959 1951 1951 1951 1950 1950 1982 1960 End 2011 2011 2009 2011 2009 1990 2011 2011 2008 2011 2010 2011 2009 2010 2010 2010 2011 2011 2009 2011 2011 2011 2011 2011 2010 2010 2010 2010 1990 1990 Periods Start b 1946-1950 b 1951-1955 b 1951-1955 b 1961-1965 b 1946-1950 b 1951-1955 1951-1955 b 1951-1955 b 1946-1950 b 1951-1955 1961-1965 b 1951-1955 1951-1955 b 1946-1950 b 1946-1950 1951-1955 b 1946-1950 b 1946-1950 b 1946-1950 1951-1955 b 1956-1960 b 1951-1955 b 1956-1960 1951-1955 1951-1955 1951-1955 b 1946-1950 b 1946-1950 b 1981-1985 b 1956-1960 End c 2011-2015 c 2011-2015 c 2006-2010 c 2011-2015 c 2006-2010 c 1991-1995 c 2011-2015 c 2011-2015 c 2006-2010 c 2011-2015 2006-2010 c 2011-2015 c 2006-2010 2006-2010 2006-2010 2006-2010 c 2011-2015 c 2011-2015 c 2006-2010 c 2011-2015 c 2011-2015 c 2011-2015 c 2011-2015 c 2011-2015 2006-2010 2006-2010 2006-2010 2006-2010 1986-1990 1986-1990 - Not used a Start and end years are as shown for most diseases. Some diseases have missing years, see release notes or change history in individual country workbooks for more detail. b First period based on less than 5 years’ data – see ‘Single years, Start’ column c Final period based on less than 5 years’ data – see ‘Single years, End’ column d Data for Czechoslovakia for 1991, for Czech Republic from 1985, and for Slovakia from 1992 are available but have not been entered e W Germany (former Federal Republic) to 1990, unified Germany from 1991 ICD revision – year first used 6 7 8 9 10 1950 1955 1954 1950 1953 1951 1952 1950 1952 1955 1951 1950 1950 1951 1950 1950 1950 1951 1955 1951 1951 1951 1950 1950 - 1979 1980 1979 1980 1979 1979 1987 1979 1979 1979 1979 1981 1979 1979 1979 1979 1979 1979 1986 1980 1980 1980 1980 1987 1979 1979 k 1982 1979 1998 2002 1998 2005 2000 1994 1996 2000 1998 1996 1996 2007 1998 2003 1995 1996 2000 1996 1999 2002 1999 1999 1997 h 1995 j 2001 1999 - 1958 1958 1958 1964 1958 1958 1958 1958 1958 1958 1961 1958 1958 1958 1958 1958 1958 1958 1958 1958 1959 1958 1959 1958 1958 1958 1958 1958 1961 1968 1969 1968 1968 1969 1968 1969 1969 1968 1968 1968 1969 1971 1968 1969 1968 1968 1969 1968 1969 1969 1971 1969 1968 1969 1969 1968 1968 1968 f Earlier data are available but with insufficient detail g Jewish population only to 1974, then total population. h Data for Switzerland under the 10th revision are available in less detail than for other countries. See Table 5 j 2000 in Scotland k Data for USSR under the 9th revision are available in less detail than for other countries, and it is not possible to extract data for an equivalent definition of COPD. See Table 5 28 Table 2 Country Australia Austria Belgium Bulgaria Canada Czechoslovakia Denmark Finland France g Germany Greece Hungary Iceland Ireland Israel Italy Japan Netherlands New Zealand Norway Poland Portugal Romania Spain Sweden Switzerland UK USA USSR Yugoslavia Availability of sales-based tobacco data Sales data MC Start 1920 1923 1921 d,e 1913 1920 d,f 1923 1920 1920 d 1861 d,h 1906 1920 d,j 1920 1932 1920 1967 c 1921 1920 d,f 1923 1920 1927 c,f 1922 d 1935 d,e 1920 d 1920 1920 c 1934 c 1880 c 1900 1960 d,e 1922 a Tar data End 2010 2004 2011 1997 2010 1992 2010 2009 2010 2010 1995 2012 1995 2011 1995 2010 2007 2010 2009 2011 2012 2012 1995 2010 2006 2009 2009 2010 1994 1993 TC Start c 1925 1923 1921 × 1955 × 1950 1950 1950 d,i 1906 × d,k 1940 × 1920 × c 1951 × 1960 1950 d,f 1939 2006 d 1950 × d 1957 1950 d 1993 d,f 1931 1927 × × End 2010 2004 2011 2010 2010 2009 2010 2010 2011 2011 2008 2010 2009 2011 2012 2011 2010 2006 2008 2009 2010 × No data a This table shows start and end of single year data. Missing intermediate years are indicated by footnotes c or d. Data are presented by 5-year periods, using an average of the available years when the full 5 years are not available, and intermediate missing periods are indicated by other footnotes. ISS2 presented data up to 1995 and ISS3 up to date of publication of individual chapters. Later data have been entered occasionally for other countries, but no consistent attempt was made to collect later data. b This table shows start and end of single year data. Missing intermediate years are indicated by footnote d. Data are used for tar-adjustment as 5-year averages, using, for years with no data available, an estimate of 35 mg/cigarette up to 1955 and linear interpolation between available data points thereafter, and, if applicable, an average based A Start 1920 1923 1921 d,e 1913 1920 1923 1920 1920 d 1861 d,f 1925 1920 d,k 1920 c 1862 1920 c 1970 c 1921 1920 d,f 1923 1920 1927 c,f 1922 d 1940 d,e 1920 d 1920 1920 cd 1934 c 1880 1920 1960 1922 End 2010 2004 2011 1997 2010 1934 2010 2009 2010 2010 1995 2001 1995 2011 1989 2008 1998 2010 2009 2011 1995 2011 1995 2010 2006 2008 2009 2010 1994 1935 Start d 1969 1960 d 1973 × 1968 × 1964 d 1970 d 1861 d 1966 × × × × × d 1984 1969 × d 1990 d 1970 d 1983 × × × 1964 1970 c 1921 1954 × × b End 1994 1984 1998 1999 1990 1992 2003 1985 2003 2005 2006 1993 2000 1980 1978 2002 1999 on less than 5 years data in the final period. So there are no intermediate missing periods. c Early data only available at 3 or 5 yearly intervals. d Data missing for some intermediate years, for details see the lower part of the Tobacco Data worksheet for the relevant country. (Also Tables 1-2 of the relevant chapter in ISS) e Periods 1936-…-1955 Missing f Period 1941-45 Missing g Unified up to 1938 and from 1991, otherwise West h Periods 1916-20, 1941-45 Missing i Periods 1916-…-1930, 1941-45 Missing j Periods 1941-…-1950 Missing k Periods 1941-…-1985 and TC 1990-91, A 1990-…-2000 Missing 29 Table 3 Country Australia Austria Belgium Bulgaria Canada Czechoslovakia Denmark Finland France Germany Greece Hungary Iceland Ireland Israel Italy Japan Netherlands New Zealand Norway Poland Portugal Romania Spain Sweden Switzerland UK USA USSR Yugoslavia Availability of survey-based tobacco data Contemporary surveys (ISS) Prevalence MC TC Start End Start 1976-80 2001-05 1971-75 1951-55 2006-10 1951-55 1971-75 2006-10 1961-65 a a 1986-90 1986-90 b × 1956-60 d d 1961-65 1986-90 1961-65 1976-80 2001-05 1951-55 g g 1956-60 2006-10 1956-60 h 1956-60 2001-05 1956-60 1956-60 2001-05 1946-50 h h 1956-60 1991-95 1956-60 d d 1961-65 2011-15 1961-65 1981-85 1991-95 1981-85 c c 1956-60 2011-15 1956-60 h h 1961-65 1991-95 1961-65 1946-50 2006-10 1946-50 1946-50 2006-10 1946-50 1966-70 2011-15 1956-60 c 2006-10 1956-60 1991-95 1951-55 1956-60 2011-15 1956-60 1971-75 2011-15 1971-75 1966-70 1991-95 1966-70 1966-70 2006-10 1966-70 h h 1951-55 2006-10 1951-55 h h 1956-60 1991-95 1956-60 c 1946-50 2001-05 1956-60 1931-35 2001-05 1931-35 1971-75 1986-90 1971-75 d d 1956-60 1986-90 1956-60 End 2001-05 2006-10 2006-10 2001-05 1986-90 2006-10 2006-10 2001-05 2001-05 1991-95 2011-15 1991-95 2011-15 1991-95 2006-10 2006-10 2011-15 2006-10 2011-15 2011-15 2011-15 1991-95 2006-10 2006-10 1991-95 2001-05 2001-05 1986-90 1986-90 × No data - Data for single period a Restricted age range for females b Restricted age range for initial period(s) for females c Restricted age range for initial period(s) d Restricted age range for initial period(s) for males, females start later e Restricted age range for final period(s) A Start 1941-45 1951-55 1951-55 a 1986-90 c 1966-70 d 1961-65 1951-55 1946-50 1951-55 1946-50 h 1956-60 d 1961-65 h 1966-70 1961-65 h 1961-65 1961-65 1946-50 h 1946-50 c 1956-60 1951-55 1956-60 1971-75 1966-70 1966-70 1946-50 1956-60 1926-30 1946-50 1971-75 d 1956-60 End 2001-05 2006-10 2011-15 2001-05 1986-90 2006-10 2006-10 2006-10 2001-05 1991-95 2011-15 1991-95 2011-15 1991-95 2006-10 2006-10 2011-15 2006-10 2011-15 2011-15 2011-15 1991-95 2006-10 2006-10 2006-10 2001-05 2001-05 1986-90 1986-90 CPP MC Start 1976-80 1971-75 1976-80 × × 1981-85 1971-75 d 1956-60 1956-60 1966-70 h 1956-60 1966-70 1981-85 d 1956-60 h 1961-65 1946-50 d 1956-60 1976-80 × × 1956-60 1986-90 1966-70 h 1966-70 h 1951-55 h 1956-60 1946-50 1946-50 1971-75 g 1956-60 Alternative (retrospective) surveys (see also Table 4) End 1991-95 2006-10 I 2006-10 1986-90 2001-05 2006-10 I 2001-05 f 2001-05 1986-90 2011-15 2006-10 e 1991-95 2006-10 2001-05 ej 2011-15 2011-15 2006-10 2006-10 2001-05 2006-10 1986-90 2001-05 1986-90 1986-90 TC Start 1971-75 1971-75 1976-80 × 1961-65 1981-85 1951-55 d 1956-60 1961-65 g 1966-70 h 1956-60 1966-70 1981-85 d 1956-60 h 1961-65 1946-50 d 1956-60 1956-60 c 1956-60 1956-60 1956-60 1986-90 1966-70 h 1966-70 h 1951-55 h 1956-60 1971-75 1946-50 1971-75 g 1956-60 End 2001-05 2006-10 2006-10 2001-05 1986-90 2006-10 2006-10 2001-05 2001-05 1986-90 2011-15 2006-10 e 1991-95 2006-10 2001-05 2011-15 2006-10 2006-10 2011-15 2006-10 2006-10 2001-05 2006-10 2001-05 2001-05 1986-90 1986-90 ABS-NHS, Hyndman × × × Ferrence × × × × Brenner, Heuer × HPGS × × × LaVecchia × × × Ronneberg × × × Fernandez Nordlund SOMIPOPS HALS, AHIP Harris × × f 1986-2000 interpolated, not shown in Supplement (reference 7) g Restricted age range for initial period(s), females start later h Females start later See references 6,7 for further detail I 1981-2000 missing and not interpolated as more than 3 consecutive missing periods j 1981-2010 missing and not interpolated as more than 3 consecutive missing periods 30 Table 4 Availability of data from retrospective survey-based tobacco data Country Name Source Periods Australia ABS-NHS Australia Hyndman Canada Ferrence Germany Brenner Germany Heuer Hungary Italy HGPS LaVecchia Norway Ronneberg Spain Fernandez Sweden Nordlund Switzerland SOMIPOPS UK UK USA HALS AHIP Harris Australian Bureau of Statistics (personal communication). Based on 1989-90 National Health Survey. Hyndman J, Hobbs M, Jamrozik K, Hockey R, Parsons R. A retrospective cohort study of smoking habits in Australia. In: Durston B, Jamrozik K, editors. Tobacco and health 1990. The global war, Proceedings of the 7th world conference on tobacco and health, Perth, Western Australia, 1st-5th April 1990. 189 Royal Street, East Perth, Western Australia 6004: Organising committee of the Seventh World Conference on Tobacco and Health, 1990;264-7. Ferrence RG. Sex differences in cigarette smoking in Canada, 1900-1978: a reconstructed cohort study. Can J Public Health 1988;79:160-5. Brenner H. A birth cohort analysis of the smoking epidemic in West Germany. J Epidemiol Community Health 1993;47:54-8. Heuer C, Becker N. Smoking prevalence and lung cancer mortality in Germany. J Epidemiol Biostat 1999;4:45-52. Estimates derived at PNLSC from Hungarian General Practitioners Study La Vecchia C, Decarli A, Pagano R. Prevalence of cigarette smoking among subsequent cohorts of Italian males and females. Prev Med 1986;15:606-13. Ronneberg A, Lund KE, Hafstad A. Lifetime smoking habits among Norwegian men and women born between 1890 and 1974. Int J Epidemiol 1994;23:267-76. Fernandez E, Schiaffino A, Borràs JM, Shafey O, Villalbi JR, La Vecchia C. Prevalence of cigarette smoking by birth cohort among males and females in Spain, 1910-1990. Eur J Cancer Prev 2003;12:57-62 Nordlund LA. Trends in smoking habits and lung cancer in Sweden. Eur J Cancer Prev 1998;7:109-16. Estimates derived at PNLSC from SOMIPOPS (Swiss National Health Survey) 1981-83. These estimates should be regarded with caution due to some problems in the data set ISS2 Appendix V – Health and Lifestyle Study ISS2 Appendix V – Alderson Hospital In Patient Study Harris JE. Cigarette smoking among successive birth cohorts of men and women in the United States during 1900-80. J Natl Cancer Inst 1983;71:473-9. Product Start a All data are prevalence, except AHIP, which has both prevalence and consumption per person data b Females start later c Data relate to a single year d Data given at 10-yearly intervals, so alternate periods missing e Based on 10 year cohorts so pairs of adjacent age groups have duplicate data f Retrospective data a Notes End 1906-1910 b 1986-1990 1906-1910 b 1976-1980 1911-1915 1976-1980 1926-1930 MC c,d,e,f g A f,h,i g TC e,f,h,i 1981-1985 TC e,f,h,i,j 1921-1925 1991-1995 TC j,k,l 1936-1940 1906-1910 1991-1995 1976-1980 MC,TC TC e,f,h c,d,e,f,j 1906-1910 1986-1990 A k 1916-1920 1986-1990 TC b,c,d,e,f,j 1916-1920 1986-1990 A c,k,m 1916-1920 1981-1985 A e,f 1916-1920 1916-1920 1901-1905 1981-1985 1976-1980 1976-1980 MC,A MC,A TC c,e,f c,e,f e,f,h,i g g Final period based on less than 5 years h Single year data have been averaged to give period i Data extracted from graph j Corrected for differential mortality k Early data retrospective, combined with later contemporary surveys l Data as given for periods 1920-24 have been entered for 1921-25 etc m Data published as graph, table supplied in personal communication from author 31 Table 5 Definitions of causes of death 6th and 7th Lung Cancer Summary A050 8th A051 Full 162 = malignant neoplasm of bronchus and trachea, and of lung specified as primary 163 = malignant neoplasm of lung, unspecified 162 = malignant neoplasm of trachea, lung and bronchus 9th B101 162 = malignant neoplasm of trachea, lung and bronchus 10th (except Switzerland) C33 = malignant neoplasm of trachea C34 = malignant neoplasm of bronchus and lung ICD Revision 10th 1034 Same as other countries (Switzerland ) AMI acute myocardial infarction IHD ischaemic heart disease MI myocardial infarction IHD Summary A081 A083 Full 420 = arteriosclerotic heart disease, including coronary disease 421 = chronic endocarditis, not specified as rheumatic 422 = other myocardial degeneration 410 = AMI 411 = other acute and subacute IHD 412 = chronic IHD 413 = angina pectoris 414 = asymptomatic IHD B27 410 = AMI 411 = other acute and subacute IHD 412 = old MI 413 = angina pectoris 414 = other forms of chronic IHD I20 = angina pectoris I21 = AMI I22 = subsequent MI I23 = certain current complications following acute MI I24 = other acute IHD I25 = chronic IHD 1067 Same as other countries 32 Table 5 ICD Revision 6th and 7th Definitions of causes of death (continued -1) COPD Summary A093 A097 8th A093 A096 Full 501 = bronchitis unqualified 502 = CB 511 = peritonsillar abscess 512 = chronic pharyngitis and nasopharyngitis 513 = chronic sinusitis 514 = deflected nasal septum 515 = nasal polyp 516 = chronic laryngitis 517 = other diseases of URT 520 = spontaneous pneumothorax 522 = pulmonary congestion and hypostasis 523 = pneumoconiosis due to silica and silicates (occupational) 524 = other specified pneumoconiosis and pulmonary fibrosis of occupational origin 525 = other chronic interstitial pneumonia 526 = bronchiectasis 527 = other diseases of lung and pleural cavity (including emphysema) 490 = bronchitis, unqualified 491 = CB 492 = emphysema 493 = asthma 501 = peritonsillar abscess 502 = chronic pharyngitis and nasopharyngitis 503 = chronic sinusitis 504 = deflected nasal septum 505 = nasal polyp 506 = chronic laryngitis 507 = hay fever 508 = other diseases of URT 511 = pleurisy 512 = spontaneous pneumothorax 514 = pulmonary congestion and hypostasis 515 = pneumoconiosis due to silica and silicates 516 = other pneumoconiosis and related diseases 517 = other chronic interstitial pneumonia 518 = bronchiectasis 519 = other diseases of respiratory system (including COPD) CB chronic bronchitis COPD chronic obstructive pulmonary disease URT upper respiratory tract Respiratory Diseases (non-acute) Summary Full As COPD + A094 510 = hypertrophy of tonsils and adenoids A095 518, 521 = empyema and absess of lung A096 519 = pleurisy As COPD + A094 A095 500 = hypertrophy of tonsils and adenoids 510 = empyema 513 = abscess of lung 33 Table 5 ICD Revision 9th (except USSR) Definitions of causes of death (continued - 2) COPD (continued) Summary Full B323 490 = bronchitis, not specified as acute or chronic 491 = CB 492 = emphysema 493 = asthma B324 494 = bronchiectasis B325 495 = extrinsic allergic alveolitis 496 = chronic airways obstruction NEC (including COPD) 9th (USSR) 10th (except Switzerland) not possible J40 = bronchitis, not specified as acute or chronic J41 = simple and mucopurulent CB J42 = unspecified CB J43 = emphysema J44 = other COPD J45 = asthma J46 = status asthmaticus J47 = bronchiectasis J67 = hypersensitivity pneumonitis due to organic dust (farmer’s lung etc) 10th (Switzerland) 1076 J40-J47, i.e. same as other countries except excludes J67 = hypersensitivity pneumonitis due to organic dust (farmer’s lung etc) CB chronic bronchitis COPD chronic obstructive pulmonary disease DCE diseases classified elsewhere NEC not elsewhere classified Respiratory Diseases (non-acute) continued Summary Full As COPD + B313 470,471 = deflected nasal septum and nasal polyps B314 472,473 = chronic pharyngitis, nasopharyngitis and sinusitis B315 474 = chronic diseases of tonsils and adenoids B319 475-478 = peritonsillar abscess, chronic laryngitis, laryngotracheitis, allergic rhinitis, other diseases of URT B326 500-508 = pneumoconiosis and other lung disease due to external agents B327 511 = Pleurisy B329 510, 512-519 = empyema; pneumothorax; absess of lung and mediastinum; pulmonary congestions and hypostasis; post inflammatory pulmonary fibrosis; other alveolar and parietoalveolar pneumopathy; lung involvement in conditions classified elsewhere; other diseases of lung; other diseases of respiratory system S329, B323 Same as other countries As COPD + J30-J39 = vasomotor and allergic rhinitis; chronic rhinitis, nasopharyngitis and pharyngitis; chronic sinusitis; nasal polyp; other disorders of nose and nasal sinuses; chronic disease of tonsils and adenoids; peritonsillar abscess; chronic laryngitis and laryngotracheitis; diseases of vocal chords and larynx NEC; other diseases of URT J60-J66 = pneumoconiosis (coalworker’s; due to asbestos and other mineral fibres; due to dust containing silica; due to other inorganic dust; unspecified; associated with tuberculosis) J68-J70 = RC due to inhalation of chemicals, gases etc; pneumonitis due to solids and liquids; RC due to other external agents J80-J82 = adult respiratory distress syndrome; pulmonary oedema; pulmonary eosinophilis NEC J84-J86 = other interstitial pulmonary diseases; abscess of lung and mediastinum; pyothorax J90-J94 = other disease of pleura J95-J96 = postprocedural RD NEC; respiratory failure NEC J98-J99 = other RD; RD in DCE not possible RC respiratory conditions RD respiratory disorders URT upper respiratory tract 34 Table 5 ICD Revision 6th and 7th 8th 9th Definitions of causes of death (continued - 3) Bladder Cancer Summary Full 181 = malignant neoplasm of bladder and other urinary organs 188 = malignant neoplasm of bladder B126 188 = malignant neoplasm of bladder 10th (except C67 = malignant neoplasm of bladder Switzerland) 10th 1041 Same as other countries (Switzerland ) 6th and 7th Cervical Cancer Summary Full A052 171 = malignant neoplasm of cervix uteri 8th A055 180 = malignant neoplasm of cervix uteri 9th B120 180 = malignant neoplasm of cervix uteri 10th (except Switzerland) C53 = malignant neoplasm of cervix uteri ICD Revision 10th 1037 (Switzerland ) Same as other countries 6th and 7th Larynx Cancer Summary Full A049 161 = malignant neoplasm of larynx 8th A050 161 = malignant neoplasm of larynx 9th B100 161 = malignant neoplasm of larynx ICD Revision 10th (except C32 = malignant neoplasm of larynx Switzerland) 10th 1033 Same as other countries (Switzerland ) Breast Cancer Summary A051 Full 170 = malignant neoplasm of breast A054 B113 174 = malignant neoplasm of breast 174 = malignant neoplasm of female breast 175 = malignant neoplasm of male breast C50 = malignant neoplasm of breast 1036 Same as other countries Colorectal Cancer Summary Full A047 152 = Malignant neoplasm of small intestine, including duodenum 153 = Malignant neoplasm of large intestine, excluding rectum A048 154 = Malignant neoplasm of rectum A048 152 = Malignant neoplasm of small intestine, including duodenum 153 = Malignant neoplasm of large intestine, excluding rectum A049 154 = Malignant neoplasm of rectum and rectosigmoid junction B092 152 = Malignant neoplasm of small intestine, including duodenum B093 153 = Malignant neoplasm of colon B094 154 = Malignant neoplasm of rectum, rectosigmoid junction, anus C17 = malignant neoplasm of small intestine C18 = malignant neoplasm of colon C19 = malignant neoplasm of rectosigmoid junction C20 = malignant neoplasm of rectum C21 = malignant neoplasm of anus and anal canal 1030 Same as other countries but excluding C17 small intestine Liver Cancer Summary Full 155 = malignant neoplasm of biliary passages and of liver (stated to be primary site) 155 = malignant neoplasm of liver and intrahepatic bile ducts, specified as primary B095 155.0 = Malignant neoplasm of liver primary site (excludes 155.1 intrahepatic bile ducts) C22 = malignant neoplasm of liver and intrahepatic bile ducts 1031 Same as other countries 35 Table 5 Definitions of causes of death (continued - 4) 6th and 7th Oesophageal Cancer Summary Full A045 150 = malignant neoplasm of oesophagus 8th A046 150 = malignant neoplasm of oesophagus 9th B090 150 = malignant neoplasm of oesophagus 10th (except Switzerland) C15 = malignant neoplasm of oesophagus ICD Revision 10th 1028 (Switzerland ) O&U other and unspecified ICD Revision Same as other countries Pancreatic Cancer Summary Full 157 = malignant neoplasm of pancreas 157 = malignant neoplasm of pancreas B096 157 = malignant neoplasm of pancreas C25 = malignant neoplasm of pancreas 6th and 7th 8th 9th 10th (except Switzerland) 10th 1032 (Switzerland ) Same as other countries Oral Cancer Summary A044 Full 140 to 148 = malignant neoplasm of (respectively) lip, tongue, salivary gland, floor of mouth, O&U parts of mouth, oral mesopharynx, nasopharynx, hypopharynx, and pharynx unspecified A045 140 to 149 = malignant neoplasm of (respectively) lip, tongue, salivary gland, gum, floor of mouth, O&U parts of mouth, oropharynx, nasopharynx, hypopharynx, and pharynx unspecified. B08 140 to 149 = malignant neoplasm of (respectively) lip, tongue, major salivary glands, gum, floor of mouth, O&U parts of mouth, oropharynx, nasopharynx, hypopharynx, and other illdefined sites (within the lip, oral cavity & pharynx) C00 to C14 = malignant neoplasm of (respectively) lip, base of tongue, O&U parts of tongue, gum, floor of mouth, palate, O&U parts of mouth, parotid gland, O&U major salivary glands, tonsil, oropharynx, nasopharynx, pyriform sinus, hypopharynx, and other ill-defined sites (of the lip, oral cavity & pharynx) 1027 Same as other countries Stomach Cancer Summary Full A046 151= malignant neoplasm of stomach A047 151= malignant neoplasm of stomach B091 151= malignant neoplasm of stomach C16 = malignant neoplasm of stomach 1029 Same as other countries 36 Table 5 ICD Revision 6th and 7th Definitions of causes of death (continued - 5) Peptic Ulcer Summary A099 A100 Full 540 = ulcer of stomach 541 = ulcer of duodenum 8th A098 531 = ulcer of stomach 532 = ulcer of duodenum 533 = peptic ulcer, site unspecified 9th B341 531 = gastric ulcer 532 = duodenal ulcer 533 = peptic ulcer, site unspecified 10th (except Switzerland) K25 = gastric ulcer K26 = duodenal ulcer K27 = peptic ulcer, site unspecified 10th 1079 (Switzerland ) Same as other countries Stroke Summary A070 Full 330 = subarachnoid haemorrhage 331 = cerebral haemorrhage 332 = cerebral embolism & thrombosis 333 = spasm of cerebral arteries 334 = other and ill-defined vascular lesions affecting central nervous system A085 430 = subarachnoid haemorrhage 431 = cerebral haemorrhage 432 = occlusion of pre-cerebral arteries 433 = cerebral thrombosis 434 = cerebral embolism 435 = transient cerebral ischaemia 436 = acute but ill-defined cerebrovascular disease 437 = generalized ischaemic cerebrovascular disease 438 = other and ill-defined cerebrovascular disease B29 430 = subarachnoid haemorrhage, 431 = intracerebral haemorrhage, 432 = other & unspecified intracranial haemorrhage 433 = occlusion and stenosis of pre-cerebral arteries 434 = occlusion of cerebral arteries 435 = transient cerebral ischaemia 436 = acute but ill-defined cerebrovascular disease, 437 = other and ill-defined cerebrovascular disease 438 = late effects of cerebrovascular disease I60 = Subarachnoid haemorrhage I61 = Intracerebral haemorrhage I62 = Other non-traumatic intracranial haemorrhage I63 = Cerebral infarction I64 = Stroke, not specified as haemorrhage or infarction I65 = Occlusion and stenosis of precerebral arteries I66 = Occlusion and stenosis of cerebral arteries I67 = Other cerebrovascular diseases I69 = Sequelae of cerebrovascular disease 1069 I60 to I69 37 Table 5 ICD Revision 6th and 7th Definitions of causes of death (continued - 6) All Cancer Summary A044 to A059 (B18) Full 140-148, 150-165, 170-181 & 190-205 All Malignant neoplasms, including neoplasms of lymphatic and haemotopietic system 8th A045 to A060 (B19) 9th B08 to B14 140-165 170-175 & 179-208 (except USSR) All Malignant neoplasms including Hodgkin’s disease and leukaemia S08 (USSR) Same as other countries (B08 – B14) C00 to C97 = All Malignant neoplasms, including non-Hodgkin’s lymphoma and leukaemia 1027 to1046 Same as other countries (C00 – C97) 10th (except Switzerland) 10th (Switzerland ) 140-163, 171-174 &180-207 All Malignant neoplasms, including other neoplasms of lymphatic and haemotopietic tissue All Causes Summary A000 Full All Causes A000 All Causes B00 All Causes AAA All Causes 1000 All Causes 38 Example 1 Mortality Plots Page 1 Country Sex Disease UK Males Lung Cancer Country Ratio (denominator) None (Single Country) 1 1851-1855 Lung Cancer Mortality Rates for Period and Age group 1856-1860 1861-1865 1866-1870 900.0 1871-1875 1876-1880 1881-1885 800.0 1886-1890 Mortality Rate (per 100,000 per year) 1891-1895 1896-1900 700.0 1901-1905 1906-1910 600.0 1911-1915 1916-1920 1921-1925 500.0 1926-1930 1931-1935 400.0 1936-1940 1941-1945 1946-1950 300.0 1951-1955 1956-1960 1961-1965 200.0 1966-1970 1971-1975 100.0 1976-1980 1981-1985 1986-1990 0.0 15-19 20-24 25-29 30-34 35-39 40-44 45-49 50-54 55-59 60-64 65-69 70-74 75-79 80-84 85+ 1991-1995 1996-2000 Age group 2001-2005 2006-2010 39 Example 1T Mortality Plots Page 1 (Associated Data Table) Country Sex Disease UK Males Lung Cancer Country Ratio (denominator) None (Single Country) 1851-1855 1856-1860 1861-1865 1866-1870 1871-1875 1876-1880 1881-1885 1886-1890 1891-1895 1896-1900 1901-1905 1906-1910 1911-1915 1916-1920 1921-1925 1926-1930 1931-1935 1936-1940 1941-1945 1946-1950 1951-1955 1956-1960 1961-1965 1966-1970 1971-1975 1976-1980 1981-1985 1986-1990 1991-1995 1996-2000 2001-2005 2006-2010 15-19 20-24 25-29 30-34 35-39 40-44 45-49 50-54 55-59 60-64 65-69 70-74 75-79 80-84 85+ 0.38 0.17 0.17 0.16 0.22 0.07 0.04 0.01 0.02 0.02 0.02 0.01 0.02 0.41 0.72 0.40 0.48 0.47 0.35 0.16 0.11 0.13 0.09 0.09 0.05 0.10 2.03 1.35 1.34 1.17 1.04 0.91 0.53 0.43 0.16 0.22 0.17 0.10 0.15 3.94 3.67 3.56 3.30 2.49 2.33 1.77 1.28 0.83 0.74 0.51 0.47 0.51 8.60 10.14 9.49 9.44 7.50 5.97 5.49 4.23 3.43 2.69 1.79 1.52 1.37 25.49 24.99 25.59 22.66 22.13 17.96 14.05 12.01 10.41 8.63 6.62 5.20 4.98 58.36 58.68 59.43 56.77 53.45 50.83 39.92 32.11 27.62 22.79 17.88 15.23 12.90 111.73 123.17 125.27 123.57 115.11 107.90 100.98 77.89 60.00 56.12 42.26 36.87 33.64 160.98 200.22 230.74 231.58 222.71 208.53 190.55 171.98 135.29 108.15 92.45 74.59 69.76 207.86 253.19 333.30 369.36 373.28 354.53 334.61 300.40 268.09 207.11 161.84 147.04 133.24 208.26 287.30 389.91 484.46 529.66 519.89 498.48 455.34 411.44 365.31 278.54 228.10 217.67 177.70 253.70 381.86 494.34 621.39 682.12 674.41 629.73 581.87 504.73 428.53 342.73 303.08 136.35 198.64 324.17 450.27 597.39 722.75 804.57 770.32 710.91 627.40 546.16 483.12 445.28 98.90 139.08 217.75 332.44 473.07 606.68 769.55 833.88 793.77 715.85 607.32 544.06 534.82 52.49 88.13 140.24 200.81 335.95 433.31 570.43 688.45 711.88 674.27 574.66 548.11 549.44 40 Example 2 Mortality Plots Page 2 Country Sex Disease UK Males Ischaemic Heart Disease Country Ratio (denominator) None (Single Country) 1 Ischaemic Heart Disease Mortality Rates for Age group and Birth cohort 1000.0 30-34 35-39 40-44 45-49 100.0 50-54 55-59 60-64 65-69 10.0 70-74 75-79 80-84 1.0 Birth cohort 1991-1995 1986-1990 1981-1985 1976-1980 1971-1975 1966-1970 1961-1965 1956-1960 1951-1955 1946-1950 1941-1945 1936-1940 1931-1935 1926-1930 1921-1925 1916-1920 1911-1915 1906-1910 1901-1905 1896-1900 1891-1895 1886-1890 1881-1885 1876-1880 1871-1875 0.1 1866-1870 Mortality Rate (per 100,000 per year) 10000.0 41 Example 3 Mortality Plots Page 5 Country Cohort or Age group Disease UK Combined 35 - 74 Lung Cancer Country Ratio (denominator) Relative Scaling Period None (Single Country) None Lung Cancer Mortality Rates for Sex and Period 250.0 Mortality Rate (per 100,000 per year) 200.0 150.0 Male Female M&F Combined M/F Ratio 100.0 50.0 0.0 1951-1955 1956-1960 1961-1965 1966-1970 1971-1975 1976-1980 1981-1985 1986-1990 1991-1995 1996-2000 2001-2005 2006-2010 Period 42 Example 4 Mortality Plots Page 8 Sex Cohort or Age group Disease Males Combined 40 - 69 [E Std] Lung Cancer Relative Scaling Period None Lung Cancer Mortality Rates for Country and Period Mortality Rate (per 100,000 per year) 250.0 200.0 0 150.0 Australia Austria Belgium Bulgaria Czechoslovakia 100.0 France UK USA 50.0 0.0 1946-1950 1951-1955 1956-1960 1961-1965 1966-1970 1971-1975 1976-1980 1981-1985 1986-1990 1991-1995 1996-2000 2001-2005 2006-2010 Period 43 Example 5 Mortality Plots Page 8 (Relative Scaling) Sex Cohort or Age group Disease Males Combined 40 - 69 [E Std] Lung Cancer Relative Scaling Period 2001-2005 Lung Cancer Mortality Rates for Country and Period 3.0 2.5 Mortality Rate (Relative) 0 2.0 Australia Austria Belgium 1.5 Bulgaria Czechoslovakia France UK 1.0 USA 0.5 0.0 1946-1950 1951-1955 1956-1960 1961-1965 1966-1970 1971-1975 1976-1980 1981-1985 1986-1990 1991-1995 1996-2000 2001-2005 2006-2010 Period 44 Example 6 Mortality Plots Page 8 (Sex Ratio) Sex Cohort or Age group Disease M / F Sex Ratio Combined 40 - 69 [E Std] Lung Cancer Relative Scaling Period None Lung Cancer Mortality Rates for Country and Period 16.0 14.0 0 Mortality Rate Sex Ratio 12.0 10.0 Australia Austria Belgium 8.0 Bulgaria Czechoslovakia France 6.0 UK USA 4.0 2.0 0.0 1946-1950 1951-1955 1956-1960 1961-1965 1966-1970 1971-1975 1976-1980 1981-1985 1986-1990 1991-1995 1996-2000 2001-2005 2006-2010 Period 45 Mortality Rank Plots Page 8 Sex : Males Disease : Lung Cancer Combined 40 - 69 [E Std] Relative Scale Period : None Rank Adjustment Normalised Mortality Rate Ranking by Period 0 1 2 3 Country Ranking Example 7 4 5 6 7 8 9 1946-1950 1951-1955 1956-1960 1961-1965 1966-1970 1971-1975 1976-1980 1981-1985 1986-1990 1991-1995 1996-2000 2001-2005 2006-2010 Period Australia Austria Belgium Bulgaria Czechoslovakia France UK USA 46 Example 8 Prevalence Plots Page 4 Country Period or Cohort Period Tobacco Type ------------ Period for Lagging or Averaging -----------Start (Youngest) End (Oldest) France 1976-1980 All tobacco products (A) 0 (Current) 0 (Current) Country Ratio (denominator) None (Single Country) Prevalence of Smoking All Tobacco Products for Sex and Age group 70.0 60.0 Prevalence 50.0 40.0 Male Female M&F Combined 30.0 20.0 10.0 0.0 15-19 20-24 25-29 30-34 35-39 40-44 45-49 50-54 Age group 55-59 60-64 65-69 70-74 75-79 80-84 85+ 47 Example 9 Prevalence Plots Page 4 (Averaged 15 to 5 years previous) Country Period or Cohort Period Tobacco Type ------------ Period for Lagging or Averaging -----------Start (Youngest) End (Oldest) France 1976-1980 All tobacco products (A) 15 Years previous 5 Years previous Country Ratio (denominator) None (Single Country) Prevalence of Smoking All Tobacco Products for Sex and Age group 70.0 60.0 Prevalence 50.0 40.0 Male Female M&F Combined 30.0 20.0 10.0 0.0 15-19 20-24 25-29 30-34 35-39 40-44 45-49 50-54 Age group 55-59 60-64 65-69 70-74 75-79 80-84 85+ 48 Example 10 Consumption Plots Page 8 Sex & Source Cohort or Age group Tobacco Type ------------ Period for Lagging or Averaging -----------Start (Youngest) End (Oldest) Males & Females (Sales) Age group 70-74 Manufactured Cigarettes (MC) 0 (Current) 0 (Current) Tar Adjustment Relative Scaling Period Unadjusted None Consumption of Manufactured Cigarettes for Country and Period 12.0 0 8.0 Australia Austria Belgium 6.0 Bulgaria Czechoslovakia France 4.0 UK USA 2.0 Period 2006-2010 2001-2005 1996-2000 1991-1995 1986-1990 1981-1985 1976-1980 1971-1975 1966-1970 1961-1965 1956-1960 1951-1955 1946-1950 1941-1945 1936-1940 1931-1935 1926-1930 1921-1925 1916-1920 1911-1915 1906-1910 1901-1905 1896-1900 1891-1895 1886-1890 1881-1885 1876-1880 1871-1875 1866-1870 1861-1865 1856-1860 0.0 1851-1855 Cigarettes per person per day 10.0 49 Example 11 Consumption Plots Page 8 (Tar Adjusted) Sex & Source Cohort or Age group Tobacco Type ------------ Period for Lagging or Averaging -----------Start (Youngest) End (Oldest) Males & Females (Sales) Age group 70-74 Manufactured Cigarettes (MC) 0 (Current) 0 (Current) Tar Adjustment Relative Scaling Period Standard None Consumption of Manufactured Cigarettes for Country and Period 12.0 0 8.0 Australia Austria Belgium 6.0 Bulgaria Czechoslovakia France 4.0 UK USA 2.0 Period 2006-2010 2001-2005 1996-2000 1991-1995 1986-1990 1981-1985 1976-1980 1971-1975 1966-1970 1961-1965 1956-1960 1951-1955 1946-1950 1941-1945 1936-1940 1931-1935 1926-1930 1921-1925 1916-1920 1911-1915 1906-1910 1901-1905 1896-1900 1891-1895 1886-1890 1881-1885 1876-1880 1871-1875 1866-1870 1861-1865 1856-1860 0.0 1851-1855 Cigarettes per person per day 10.0 50 Example 12 Scatter Plots Page 2 Sex (Prevalence) Period or Cohort Period Tobacco Type (Prevalence) ------- Period for Lagging or Averaging (Prevalence) ------Start (Youngest) End (Oldest) Females 1986-1990 All tobacco products (A) 10 Years previous Sex (Mortality) Age Group Disease (Mortality) Females Age group 40-44 Lung Cancer 10 Years previous Australia Prevalence vs Mortality Austria Belgium 12 Bulgaria Canada Czechoslovakia Denmark Mortality Rate (per 100,000 per year) 10 Finland 0 France Germany Greece 8 Hungary Iceland Ireland Israel 6 Italy Japan Netherlands 4 NewZealand Norway Poland Portugal 2 Romania Spain Sweden Switzerland 0 0 10 20 30 40 50 60 UK USA Prevalence USSR Yugoslavia 51 Example 13 Combination Plots Page 5 (10 year lag) (Prev 1) MC Country Country Ratio Sex Age group or Cohort Tobacco Type Lagging or Averaging Start (Youngest) / End (Oldest) UK None (Single Country) Males Age group 60-64 Manufactured Cigarettes (MC) 10 Years previous 10 Years previous (Prev 2) TC UK None (Single Country) Males Age group 60-64 Total Cigarettes (TC) 10 Years previous 10 Years previous (Prev 3) UK All Tob None (Single Country) Males Age group 60-64 All tobacco products (A) 10 Years previous 10 Years previous (Mort 1) UK None (Single Country) Males Age group 60-64 Lung Cancer (Mort 2) COPD UK None (Single Country) Males Age group 60-64 COPD LC Relative Scaling Period None Prevalence & Mortality for Period 120 400 350 100 300 80 60 200 150 40 100 20 50 0 0 1941-1945 1946-1950 1951-1955 1956-1960 1961-1965 1966-1970 1971-1975 1976-1980 1981-1985 1986-1990 1991-1995 1996-2000 2001-2005 Period MC Mortality Prevalence 250 TC All Tob LC COPD 52 Example 14 Combination Plots Page 3 (20 year average) (CPP 1) UK sales(20 year average) (CPP 2) US sales(20 year average) Country Country Ratio Sex & Source Period or Age group Tobacco Type / Tar Adjustment Lagging or Averaging Start (Youngest) / End (Oldest) UK None (Single Country) Males & Females (Sales) Age group 75-79 Manufactured Cigarettes (MC) 20 Years previous Unadjusted 5 Years previous Manufactured Cigarettes (MC) 20 Years previous Unadjusted 5 Years previous USA (Mort 1) UK UK LC (Mort 2) USA USA LC None (Single Country) Males & Females (Sales) Age group 75-79 None (Single Country) Males & Females Age group 75-79 Lung Cancer None (Single Country) Males & Females Age group 75-79 Lung Cancer Consumption & Mortality for Birth cohort 12 450 400 10 8 300 250 6 200 4 150 100 2 50 0 0 1836- 1841- 1846- 1851- 1856- 18611840 1845 1850 1855 1860 1865 1866- 1871- 1876- 1881- 1886- 1891- 18961870 1875 1880 1885 1890 1895 1900 Birth Cohort 1901- 1906- 1911- 1916- 1921- 19261905 1910 1915 1920 1925 1930 UK sales (20 year average) Mortality Consumption (CPP) 350 US sales (20 year average) UK LC USA LC 53 Example 14T Combination Plots Page 3 (20 year average, associated data table) Consumption & Mortality vs Birth Cohort Country Country Ratio Sex & Source Period or Age group (CPP 1) UK sales(20 year average) UK None (Single Country) Males & Females (Sales) Age group 75-79 (CPP 2) US sales(20 year average) USA None (Single Country) (CPP 3) Not Used UK None (Single Country) (Mort 1) UK LC UK (Mort 2) USA LC USA (Mort 3) Not Used UK Males & Females (Sales) Tobacco Type / Tar Adjustment Age group 75-79 Males & Females (Survey) Age group 70-74 Period for Lagging or Averaging Start (Youngest) / End (Oldest) Manufactured Cigarettes (MC) 20 Years previous Unadjusted 5 Years previous Manufactured Cigarettes (MC) 20 Years previous Unadjusted 5 Years previous Manufactured Cigarettes (MC) 0 (Current) Unadjusted 0 (Current) None (Single Country) Males & Females Age group 75-79 Lung Cancer None (Single Country) Males & Females Age group 75-79 Lung Cancer None (Single Country) Males & Females Age group 70-74 Lung Cancer Birth Cohort 1836-1840 1841-1845 1846-1850 1851-1855 1856-1860 1861-1865 1866-1870 1871-1875 1876-1880 1881-1885 1886-1890 1891-1895 1896-1900 1901-1905 1906-1910 1911-1915 1916-1920 UK sales(20 year average) 0.63 US sales(20 year average) 1.06 0.28 UK LC USA LC 1.61 0.63 2.12 1.16 2.66 1.95 3.22 2.70 3.86 3.50 4.80 4.57 5.50 5.90 6.12 7.32 6.64 8.60 6.88 9.61 7.31 9.97 7.80 10.21 7.96 10.24 7.63 9.91 7.09 9.34 79.55 58.21 105.20 69.48 153.08 88.19 199.17 113.90 255.32 152.48 307.19 196.95 359.31 229.50 379.15 274.74 381.68 321.95 369.06 354.55 Birth Cohort (continued) 1921-1925 1926-1930 1931-1935 1936-1940 1941-1945 1946-1950 1951-1955 1956-1960 1961-1965 1966-1970 1971-1975 1976-1980 1981-1985 1986-1990 1991-1995 1996-2000 2001-2005 Not Used Not Used Not Used Not Used Not Used Not Used Not Used Not Used Not Used Not Used Not Used Not Used Not Used Not Used Not Used UK sales(20 year average) 6.30 5.53 US sales(20 year average) 8.47 7.45 UK LC USA LC 356.11 364.43 346.79 374.25 54 Example 15 Combination Plots Page 5 (10 year lag, relative scaling) Country (Prev 1) UK Prev 35-54 Country Ratio Sex Age group or Cohort Tobacco Type Lagging or Averaging Start (Youngest) / End (Oldest) None (Single Country) Males Combined 35 - 54 Manufactured Cigarettes (MC) 10 Years previous 10 Years previous (Prev 2) UK Prev 55-74 None (Single Country) Males Combined 55 - 74 Manufactured Cigarettes (MC) 10 Years previous 10 Years previous (Mort 1) UK Mort 35-54 (Mort 2) UK Mort 55-74 None (Single Country) Males Combined 35 - 54 Lung Cancer None (Single Country) Males Combined 55 - 74 Lung Cancer Relative Scaling Period 1971-1975 Prevalence & Mortality for Period 1.2 1.2 1.0 1.0 0.8 0.8 0.6 0.6 0.4 0.4 0.2 0.2 0.0 0.0 1941-1945 1946-1950 1951-1955 1956-1960 1961-1965 1966-1970 1971-1975 1976-1980 1981-1985 1986-1990 1991-1995 1996-2000 2001-2005 2006-2010 Period Prev 35-54 Mortality 1.4 Prevalence 1.4 Prev 55-74 Mort 35-54 Mort 55-74 55 Example 16 Prevalence Plots Page 3 Country Sex Tobacco Type ------------ Period for Lagging or Averaging -----------Start (Youngest) End (Oldest) UK [HALS] Males Total Cigarettes (TC) 0 (Current) 0 (Current) Country Ratio (denominator) None (Single Country) 2 Prevalence of Smoking Total Cigarettes for Period and Birth cohort 80.0 70.0 60.0 1891-1895 1901-1905 1911-1915 40.0 1921-1925 1931-1935 1941-1945 30.0 1951-1955 1961-1965 20.0 1971-1975 1981-1985 10.0 Period 1991-1995 1986-1990 1981-1985 1976-1980 1971-1975 1966-1970 1961-1965 1956-1960 1951-1955 1946-1950 1941-1945 1936-1940 1931-1935 1926-1930 1921-1925 1916-1920 1911-1915 1906-1910 0.0 1901-1905 Prevalence 50.0 56 Example 17 Mort Year Plots Page 2 Country Age group Disease USA Combined 35 - 74 [E Std] COPD Relative Scaling Year None COPD Mortality Rates for Sex and Year 70.00 50.00 40.00 Male Female 30.00 20.00 Year 2001 1996 1991 1986 1981 0.00 1976 10.00 1971 Mortality Rate (per 100,000 per year) 60.00