1
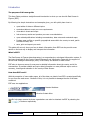
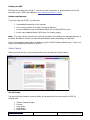
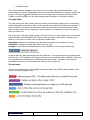
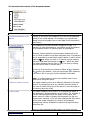
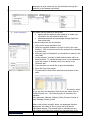
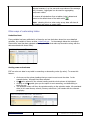
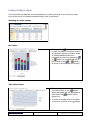
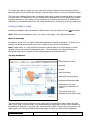
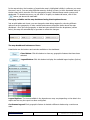
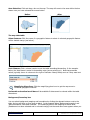
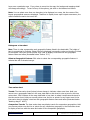
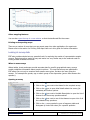
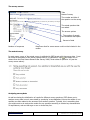
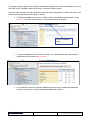
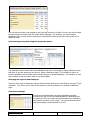
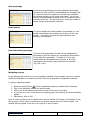
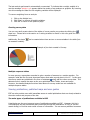
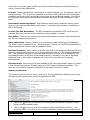
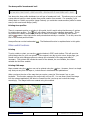
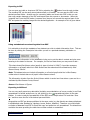
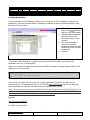
ESiF User Guide
Version 2.0 – September 2008
Table of contents
Introduction .....................................................................................................................3
The purpose of this user guide ...............................................................................................3
What is ESiF? ........................................................................................................................3
How does ESiF work? ............................................................................................................3
Getting into ESiF ...................................................................................................................4
System requirements .............................................................................................................4
Screen layout ....................................................................................................................4
The left frame .......................................................................................................................4
The right frame .....................................................................................................................5
The top frame .......................................................................................................................5
Opening data in tables......................................................................................................6
When to use tables................................................................................................................6
How Tables, charts and maps are organised ...........................................................................6
Table titles ............................................................................................................................6
Opening a dataset (table) ................................................................................................7
Viewing metadata..................................................................................................................7
The default view for a table ...................................................................................................7
Customising tables ................................................................................................................7
Dropdown boxes ...................................................................................................................8
The ‘Measure’ dropdown box..................................................................................................8
Working with the dropdown boxes..........................................................................................8
The structure and content of the dropdown boxes...................................................................9
Other ways of customising tables ..................................................................................11
Underlined text ................................................................................................................... 11
Sorting rows and columns .................................................................................................... 11
Looking at data in charts................................................................................................12
Selecting the chart options................................................................................................... 12
Bar charts ........................................................................................................................... 12
Time series charts ............................................................................................................... 12
Looking at data in maps .................................................................................................13
When to use maps .............................................................................................................. 13
The map dashboard............................................................................................................. 13
Changing variables on the map dashboard using the dropdown boxes .................................... 14
The map dashboard buttons and icons ................................................................................. 14
Other mapping features ....................................................................................................... 18
Back to contents
Page 1 of 32
ESiF User Guide : Released
Version 2.0 – September 2008
Printing and exporting maps ................................................................................................ 18
Looking at survey data ...................................................................................................18
When to use surveys ........................................................................................................... 18
Opening a survey ................................................................................................................ 18
The survey screen ............................................................................................................... 19
The actual survey ................................................................................................................ 19
Analysing survey data ..........................................................................................................19
Customising survey data using the dropdown menus ............................................................. 21
Changing the type of data displayed ..................................................................................... 21
Weighting surveys ............................................................................................................... 22
Charting survey data ........................................................................................................... 23
Multiple response tables.......................................................................................................23
Viewing publications, published maps and user guides.................................................23
The main types of publications available in ESiF .................................................................... 23
Opening a publication ..........................................................................................................24
Opening ESiF help guides..................................................................................................... 25
Area profiles ...................................................................................................................25
When to use Area profiles .................................................................................................... 25
Opening an Area profile ....................................................................................................... 26
The Area profile ‘breadcrumb’ trail........................................................................................ 27
Printing Area profiles ........................................................................................................... 27
Other useful functions ....................................................................................................27
Printing............................................................................................................................... 27
Printing SVG maps............................................................................................................... 27
Exporting to PDF ................................................................................................................. 28
Using metadata when extracting data from ESiF.................................................................... 28
Exporting to MS Excel ..........................................................................................................28
Creating bookmarks.............................................................................................................29
Searching............................................................................................................................ 30
Search Results .................................................................................................................... 30
Copyright ............................................................................................................................ 30
The main icons in ESiF and what they do .......................................................................31
More information ............................................................................................................32
Back to contents
Page 2 of 32
ESiF User Guide : Released
Version 2.0 – September 2008
Introduction
The purpose of this user guide
This User Guide provides a straightforward introduction to what you can do with East Sussex in
Figures (ESiF).
By following the simple instructions and examples given, you will quickly learn how to:
•
open tables of data on different topics
•
customise tables to meet your own requirements
•
view data in charts and maps
•
look at survey results and produce your own cross-tabulations
•
open related publications including commentaries, data notes and contextual maps
•
Produce area profiles on specific geographical areas within the county to ward, parish
and district level; and
•
save, print and export your work
This guide will not only show you how to obtain information from ESiF but also provide some
advice on the best way to display and interpret the information.
What is ESiF?
The East Sussex in Figures data observatory is a comprehensive, web-based information system. It
has been developed by the County Council’s Research and Information Team with the support of
all the Local Strategic Partnerships (LSPs) in the county and districts of East Sussex.
ESiF aims to improve access for everyone to detailed information about the county and all its
communities. It provides reliable and up-to-date information on many different topics such as
economy, housing and education in the county of East Sussex.
How does ESiF work?
With the exception of some static pages, all of the data you obtain from ESiF is created specifically
for you from the web server. Because of this, it is not possible to damage the site of the data
contained.
ESiF uses two applications
Nesstar Webview
Geowise Instant Atlas
Specific help pages created by these organisations can also be obtained via ESiF by selecting the
or buttons respectively
Back to contents
Page 3 of 32
ESiF User Guide : Released
Version 2.0 – September 2008
Getting into ESiF
ESiF does not require users to log in. You do not need a username or password and it is free for
everyone to use. ESiF’s web address is www.eastsussexinfigures.org.uk
System requirements
To get the most out of ESiF, you will need:
•
a broadband connection to the internet;
•
to be running Version 6 (or later) of Internet Explorer;
•
to have installed a copy of the Adobe Reader (for viewing PDF files); and
•
to also have installed Adobe SVG Viewer (for viewing maps).
Note: If you are using a networked pc that has restrictions on installing non standard software, it
would be advisable to contact you network administrator before attempting to install SVG.
Links for downloading all the above software are given on ESiF’s Getting started page. There is no
charge for installing this software on your PC.
Screen layout
When you enter the site, you will see that the screen is made up of three frames:
The left frame
The grey left frame contains a search facility and presents the four main sections in ESiF for
working with:
•
•
•
•
•
Tables, charts and maps
Surveys
User guides
Publications
Area profiles
Back to contents
Page 4 of 32
ESiF User Guide : Released
Version 2.0 – September 2008
•
Published maps
The frame presents a ‘navigation tree’ that works in a similar way to Windows Explorer – you
select options by clicking on/expanding the tree to reveal the information or data you might want
to open. Clicking the symbol will take you into the next level or theme and clicking the title
(Tables, charts and maps etc.) will return background information on the theme selected.
The right frame
The right frame is the main viewing pane for looking at and analysing data (and for customising
exactly what data you choose to view). At the top and to the right of this frame are a number of
context-specific icon buttons for performing certain key functions like switching between table,
chart and map views, and for exporting or printing data etc. A description of each icon pops up
when you hover of it.
Also at the top of this main viewing frame, in the left corner, you will see either two or three tabs,
either Description and Tabulation with Tables, charts and maps or Description, Tabulation and
Analysis, in the case of surveys, click on the tab to make active.
Description: Displays the metadata (the data about the data) for the dataset or survey
Tabulation: Displays the actual data, table, survey or map
Analysis: Is an advanced statistical function only available for surveys (see Nesstar help)
An active tab has a dark blue background and white font. An inactive tab has a grey background
and black font. The Tabulation and Analysis sections are only available when a dataset is open and
are not displayed in the sections for Publications and User guides. Generally, if any option is
unavailable at any time, the associated icon button will be ‘greyed out’.
The top frame
The top frame allows the user to navigate through the Home, About ESiF, Getting started, Links,
contact us and Help pages in ESiF.
Back to contents
Page 5 of 32
ESiF User Guide : Released
Version 2.0 – September 2008
Opening data in tables
When to use tables
Tables are the simplest way of displaying and ordering data, they provide concise and structured
data. ESiF tables are pre-formatted for ease of use but the data in the tables can be exported if
required (see the section on exporting data to MS Excel). There are over three hundred datasets
on ESiF containing very detailed information on all aspects of the county.
When available, comparative information is published. This allows the user to compare trends and
performance between East Sussex and its component geographies and other areas in the rest of
country. Once you have created a table, you can graph or map the information.
How Tables, charts and maps are organised
Available datasets are currently organised under eleven headings (or themes). These themes are:
access to services; community satisfaction; crime and community safety; deprivation; economy;
education, learning and skills; environment; health; housing; population and households;
transport.
Under these eleven main themes, the available datasets are organised under a number of more
detailed sub-themes to make it easier for users to find the information that they are particularly
interested in.
Table titles
Our naming convention for the titles of tables provides important information about what time
period(s) the dataset covers and, most importantly, the different (administrative) geographies that
the data is available for.
Generally, our aim is to publish information at the lowest geographic scale that is appropriate
(given confidentiality constraints etc.) and the data that is available. The last part of each table’s
title always indicates the lowest level of geography that the particular dataset covers.
Typically, lower levels of geography nest within the next level up in a hierarchy that, as far as ESiF
is concerned, extends upwards from:
•
super output areas ► wards ► districts ► county ► region ► nation; or from
•
parishes ► districts ► county ► region ► nation.
Because there is not a consistent relationship or perfect fit between the borders of parishes and
super output areas and wards, we cannot publish data for all these geographies in the same table
or hierarchy. This means that there are often two versions of the same dataset presenting the
same data in the two hierarchies outlined above.
Comparative data is sometimes published for statistical neighbours (i.e. areas that have a similar
area or demography to East Sussex for this particular dataset)
Back to contents
Page 6 of 32
ESiF User Guide : Released
Version 2.0 – September 2008
Opening a dataset (table)
1. Click on the
box next to Tables, charts and maps.
2. Click on the box next to one of the eleven themes to
open a list of more detailed sub-themes.
3. Click on the box next a particular topic to reveal the
available datasets under this sub-theme.
4. Click on the box to open the default view of the
published table for any of the listed datasets. This will
appear in the main screen
5. You can click on the Description tab to view information
about the dataset (the metadata).
Once you have clicked on a box to reveal the themes or sub themes beneath, the expanded box
turns orange. Clicking on any orange box has the opposite effect – closing all the layers beneath
it. This can be helpful to stop the navigation tree getting too cluttered.
The ‘NEW’ symbol
The
symbol indicates a dataset, publication or survey that has been added to ESiF or edited
and re-published over the last 30 days.
Viewing metadata
Metadata means ‘information about the data’ and we have published comprehensive metadata
with every dataset, survey and publication in East Sussex in Figures. This provides important
background information about our published resources so that users know what data you’re
looking at.
You can view the metadata for any dataset, survey or publication at any time by clicking on the
description tab (shown above). To go back to the data, click on the ‘Tabulation’ tab. There is
more information and guidance on how to use metadata later on in this guide.
The default view for a table
When publishing information to ESiF, we decide the content and dimensions of each table that
users see when first clicking on the icon. This is known as the default view.
The default view may includes data for the county and each of its districts, together with
comparative information for the South East region and the country as a whole (when comparative
data is available). The title of the table will tell you whether more detailed information is also
available for the same dataset at sub-district level.
Customising tables
ESiF allows you to change the content of the table that you are looking at – for example, you can:
•
view data for specific areas or levels of geography;
Back to contents
Page 7 of 32
ESiF User Guide : Released
Version 2.0 – September 2008
•
look at information for specific time periods;
•
explore different measures for the same data – such as percentage figures rather than
absolute numbers; and
•
Insert your own calculations and create your own geographies
Dropdown boxes
The screen example below shows that there are a number of dropdown boxes directly above each
table. You can use these to make different choices about what data you want to view and how you
want this presented.
The structure and content of these dropdown boxes between datasets is very similar, and you
should get the hang of working with them quite quickly once you have gained experience with
what they do. Click on the down arrow next to the title in the box to view the options.
The title and number of any other variable boxes (like the ‘occupations’ box in the example above)
will vary from one dataset to another according to the data contained. For example, if data is also
available for a number of months or years rather than just one point in time, there will also be a
box for the user to select relevant time periods of interest.
All dropdown boxes all work in the same way. You simply open a drop-down list of options and
then select one of those options by clicking on it.
The ‘Measure’ dropdown box
The values displayed in any table represent the currently selected measure for the dataset.
Measures allow you to compare data from different geographies and may include percentage, rate
per population or rank. To change the measure you are viewing, just click in the box to open the
full list of available measures, and select one by clicking again. Some tables only contain one
measure.
Working with the dropdown boxes
Apart from the measure box, all the other dropdown boxes are structured in the same way, with
different types of option being separated in the dropdown list by a dashed line.
Details of the different elements contained in the drop-down boxes are given in the table below.
You can return to the original default view of any table at any time by just clicking on its button
again or (the recycle icon in the top button bar). You can also use your web browser’s back and
forward buttons to undo or redo actions.
Back to contents
Page 8 of 32
ESiF User Guide : Released
Version 2.0 – September 2008
The structure and content of the dropdown boxes
1
2
3
4
5
6
1. Title of the variable box
For example, ‘Geography’ or ‘Year group’.
2. Different elements of the
dataset
Clicking on an option here enables you to look at one particular
subset of the overall dataset. For example, you could choose
‘Ward’ from the Geography box to view data for all the wards in
East Sussex.
3. Custom selection
This enables you to select different categories of data. For
example, to view information for one district and all its wards or
for a complete mixture of different types of geographies.
Selecting ‘Custom selection’ opens another window with a list
tree in it that is similar to the main navigation pane. If a category
can be expanded to reveal further options below, it will be shown
against a sign which you click on to expand; once a category
has been expanded this changes to a sign. Within this view,
you select elements that you may or may not want by clicking
the tick boxes to add or remove items.
or Deselect
At the top of the window are options to Select all
all
items in the dataset. Once you have made your selections,
you click on ‘OK’ to see your choices reflected in the table.
Note: it is often better to revert to the default view for any
table before using this option.
4. Move to column (or row)
This option enables you to move different elements of the table
around. The dropdown list for any variable currently shown in
the rows of a table will give you the option to move this data to
its columns (and vice versa).
5. Use as filter
This option enables you to focus in on one particular aspect of
the dataset as it already appears on your screen. For example, if
you are looking at data for all the wards in the county, this
option works as a filter to display the information for just one
single ward if required. Once you have selected this filter option,
all the other single categories (or wards in this example)
subsequently become available for selection through the same
drop-down list.
Once you have selected the filter option, you hover over the
Back to contents
Page 9 of 32
ESiF User Guide : Released
Version 2.0 – September 2008
geography or layer name and you can drill down through the
hierarchy of the dataset (see below)
6. Insert calculation
This option can be used to do things like:
• adding data for different areas together to create new
information for the combined area; and
• calculating absolute and percentage change figures for
time-series data.
To add the data from the five districts
1. Click on the ‘Insert calculation’ box
2. Select the required variables you wish to add (in this case
districts). Click on the box next to the names of the variables
to tick the box
3. Select the ‘type of calculation’ you would like to make (in this
case ‘Add’)
4. In this example, ‘constant’ is blank and the there will be no
decimal points. To include decimal points in your calculation
enter the number of decimal points you require in the
‘Decimals’ box
5. Type the name you would like to give the calculation
6. Press ‘OK’ (top right button)
7. The calculation result will be returned at the bottom of the
table
This is a simple example to demonstrate how this function works.
As you can see, the calculation field returns the same value as
the East Sussex row. The following types of calculation are
available:
Add, Aggregate, Subtract, Multiply, Divide, Percent, Percent of
total, Average, Percent growth
Where cells contain 'average' values, the aggregate function
'aggregates' the values of two or more cells to create an
aggregated average. The formula used to calculate the new
aggregated value takes into account the characteristics of the
Back to contents
Page 10 of 32
ESiF User Guide : Released
Version 2.0 – September 2008
selected measure (e.g. the sum and count values of the average
cell). However, 'Aggregate' can be used for aggregating
sum/count values.
To remove all calculations from a tabular (cube) dataset and
return to the default view of the table select
.
Note: selecting this icon when using survey data will clear all
information and return an empty table.
Other ways of customising tables
Underlined text
If any variable has been published in a hierarchy and can be broken down into more detailed
variables, the variable is shown as blue, underlined text . In the example below the underlined
‘Devonshire’ ward has been selected returning the SOAs that make up Devonshire along with the
data associated with these SOAs).
Sorting rows and columns
ESiF can also sort data in any table in ascending or descending order (by value). To access this
feature:
•
•
•
•
click once on the column heading that you want to use to sort the data. In the
example below, ‘All pupils’ has been selected.
the option appears in the column heading and the whole column is highlighted
clicking on the symbol gives you the option to sort ascending, sort descending or
apply no sort
The selected column will then be sorted according to the selection made. All associated
data (in this case Nursery schools, Primary schools etc.) will remain with the relevant
geography
Back to contents
Page 11 of 32
ESiF User Guide : Released
Version 2.0 – September 2008
Looking at data in charts
You can present the data that you have selected as a chart by clicking on one of the two chart
icons in the row of icon buttons towards the top, right of the screen.
Selecting the chart options
Bar charts
• Clicking on the
button enables you
to chart the data for one point in time –
and presents options to produce single
or multiple dataset charts for a
horizontal bar chart (by clicking the
or
button) or a vertical bar chart
(by clicking on the
or
button)
as shown in the example to the right).
Time series charts
• To produce a chart of time series data,
you need to click on the
button.
When data tables are not published as
time series, the
symbol will be
greyed out.
• To return to a table view of your data
button.
at any time, just click on the
Back to contents
Page 12 of 32
ESiF User Guide : Released
Version 2.0 – September 2008
To change the scale of a graph, you can enter your preferred minimum and maximum values in
the boxes below the chart and click ‘Change’. Use the ‘Reset’ button to revert to automatic scaling.
The drop-down variable boxes used to customise table views of data are retained when you switch
to a chart view. This means that you can customise the data that the chart is displaying in exactly
the same way as you do for tables. Any changes that you make to the chart will be retained and
(table icon).
reflected in the associated table which can easily returned to by just clicking on the
Looking at data in maps
Producing a thematic map of a dataset for East Sussex is done by clicking on the
map button.
Note: SVG must be installed on your pc in order to view maps. See system requirements
When to use maps
As maps are visual, they can make complicated datasets a lot easier to interpret. It allows you to
identify concentrations and where they are in relation to the county of East Sussex.
Note: Unlike charts, it is only possible to produce a themed map for a single category of each
variable (such as the overall unemployment rate). The initial map view opened presents a
dashboard made up of a number of inter-related elements as illustrated below
The map dashboard
ESiF dropdown menus
Map title
Legend
Map of the data
Data table showing values
Background/boundary table
Histogram or bar chart
showing the distribution of
values
Time series chart (only
available for time series data)
The map elements are inter-related in such a way that if you select any area in either the data
table, or the map, or the bar chart, it will automatically be highlighted in all the other elements of
the dashboard. Similarly, if you place your mouse pointer so that it hovers over one interval in the
map’s legend, all of the areas falling within that range of values (or class) will be highlighted.
Back to contents
Page 13 of 32
ESiF User Guide : Released
Version 2.0 – September 2008
In the map window, the boundary of a particular area is highlighted initially in yellow as you move
the cursor over it. You can select different areas by clicking on them (or their associated values in
the bar chart) which turns the fill of the geography orange. Selected areas remain orange until
deselected. To deselect any area, you just click on it again; to deselect all areas, click on the
button just above the data table.
Changing variables on the map dashboard using the dropdown boxes
Just as with tables and charts, you can change the data being mapped by choosing different
options from the geography or other variable and measure dropdown boxes above the map
dashboard. Once the new geography or data has been selected from the dropdowns (shown
below) the map will automatically re-generate to reflect the changes.
The map dashboard buttons and icons
Listed below are the buttons and controls available on the dashboard
Clear Button: Click this button to clear any geographic features that have been
selected.
Legend Button: Click this button to display the available legend options (below).
Legend Options: The items available in the legend menu may vary depending on the data in the
report and the way the report has been configured.
Continuous Legend: Each geographic feature is shaded a different shade using a continuous
scale.
Back to contents
Page 14 of 32
ESiF User Guide : Released
Version 2.0 – September 2008
Quantile Legend: Each class in the legend contains an approximately equal number of
geographic features. Class breaks are calculated and will update if you change the number of
classes. Geographic features in the same class are given the same shade.
Equal Interval Legend: The intervals between class breaks are equal. Class breaks are
calculated and will update if you change the number of classes. Geographic features in the same
class are given the same shade. The administrator may have configured the report so that the
class breaks are the same across all indicators in the report.
Standard Deviation Legend: Class breaks reflect the number of standard deviations from the
data average (or mean). Geographic features are classified according to how many standard
deviations above or below the average their indicator value falls. Geographic features in the same
class are given the same shade. You cannot change the number of classes for this legend type.
Number of Classes: You can increase or decrease the number of classes by clicking the Increase
or Decrease options in the legend menu.
Change Shading: You can change the shades used to shade geographic features in the map by
clicking on a new palette.
Highlighting and Selecting: Hold your mouse pointer over a class in the legend to highlight the
geographic features that fall into that class. Click a class to select the geographic features that fall
within that class.
Takes you to the help page for
mapping software for ESiF.
The Company that provides the
Zoom in: Click on this icon to (fixed) zoom into the map
Zoom out: Click on this icon to (fixed) zoom out of the map
Reset: Zoom to original map extent (reset map)
Resize: Open the map in a larger window; press again to toggle back
Move map: North east, north west, south east, south west etc.
Back to contents
Page 15 of 32
ESiF User Guide : Released
Version 2.0 – September 2008
Area Selection: Click and drag a box on the map. The map will zoom to the area within the box
drawn once you have released the mouse button.
Before
After
The map data table
Select features: Click the name of a geographic feature to select. A selected geographic feature
will be shaded orange (see below).
Sort Columns: Click a column header to sort the table ascending/descending. In the example
below, the Area Name is sorted in descending order (arrow pointing up). Note that associate
values (typically shown in columns to the right of indicator values) always sort as if they were text.
Magnifying Glass Icon: Click the magnifying glass icons to get the map zoom to
individual geographic features.
Horizontal and vertical scroll bars will be available if data cannot be viewed within the table
dimensions.
Background/boundary box
You can select background mapping and boundaries by clicking the relevant buttons next to the
titles, the box will then go from clear to black. In the example below ‘Background mapping’ and
‘Ward boundaries’ have been selected. The underlying data is still mapping at district level
(Eastbourne has been selected and is coloured orange) but the ward name now appears when you
Back to contents
Page 16 of 32
ESiF User Guide : Released
Version 2.0 – September 2008
hover over a particular area. If you chose to zoom into the map, the background mapping detail
will change accordingly. To turn off any of the options, just click on the blacked out button.
Note: You can select more than one boundary to be displayed on a map, but the names of the
largest geographical areas are displayed. Therefore to display lower super output area names, the
ward boundaries need to be turned off.
Histogram or bar chart
Bars: There is a bar representing each geographic feature listed in the data table. The height of
bars is proportional to indicator values. Bars are displayed in ascending order and shading is linked
to the legend. Hold your mouse pointer over a bar to display a text box with the geographic
feature name and value (illustrated below “Rother 713”)
Select a Geographic Feature: Click a bar to select the corresponding geographic feature. A
selected bar will be shaded orange.
Time series chart
Trends: The time series chart (below) shows change in indicator values over time. Hold your
mouse over a geographic feature in the map, data table or bar chart to view a trend in the time
series chart. Click a feature in the map, data table or bar chart to select it and freeze the trend in
the time series chart. Hold your mouse pointer over the line or points for any frozen trend in the
time series chart to display a text box with geographic feature name and value (illustrated below
“Hastings Aug-07 1692”).
Comparison Trends: The time series chart may display trends for comparison geographies. Hold
your mouse pointer over the line or points for any comparison geography in the time series chart
to display a text box with the name and value for the comparison geography.
Back to contents
Page 17 of 32
ESiF User Guide : Released
Version 2.0 – September 2008
Other mapping features
You can also open the map in a new window so that the dashboard fills the screen.
Printing and exporting maps
There are a number of ways that you can export maps into other applications for reports etc.
Please refer to the section on ‘Printing SVG maps’ later on in this guide for further information.
Looking at survey data
ESiF also provides simple but very powerful tools for exploring the results of representative sample
surveys. Exploring survey results is easy and works in a very similar way to the methods used for
looking at data in tables and charts.
When to use surveys
Where tables, charts and maps provide accurate data for specific geographical areas, surveys
contain subjective information about people’s opinions. The way that surveys are published in
ESiF allows you not only to examine what answers were given, but also who was giving the
answer. For example the gender, age or ethnic group of the respondee (person who answers the
question).
Opening a survey
1. Click on the
box next to Surveys.
2. Click on the
box next to the theme for the required survey.
3. Click on the box to open brief details about the survey (its
metadata) and further options.
4. Click on the box next to Variable Description to open the list of
themes for all the survey questions asked.
5. Click on the box next to one of the themes to open a list of all
the related survey questions.
6. Click on the arrow symbol to open a frequency table and
histogram (a kind of bar chart) for a specific question.
Back to contents
Page 18 of 32
ESiF User Guide : Released
Version 2.0 – September 2008
The survey screen
Tabs
Name of survey
The number and title of
the question on the survey
The actual question that
was asked
The answer options
The number of people
who answered that option
Percent of total
Number of responses
Responses that for some reason could not be included in the
results
The actual survey
In most cases, a copy of the actual survey is published in PDF format with the survey data. It can
be found at the bottom of the survey options next to a ‘Publications’ logo . See below for an
extract from the East Sussex General User Survey 2006/7 that relates to question 16 (see the
survey screen above).
Analysing survey data
As well as viewing the distribution of results for different survey questions, ESiF allows you to
analyse survey data in much more detail by producing ‘cross-tabulations’ where the results of one
question are also related to the answers from another question. Typically, this is something that
you might want to do analyse the results for any question according to certain key characteristics
of respondents, such as their age or sex or where they live.
Back to contents
Page 19 of 32
ESiF User Guide : Released
Version 2.0 – September 2008
To analyse survey results in more detail (having already opened the survey as outlined above) you
first click on the Tabulation button at the top of the main viewing frame.
You then have the option to add results from any of the survey questions to either the rows or the
columns of the table that you are going to create.
•
To add any variable to the rows of a table, click on the relevant question and choose
Add to row from the drop down list of four options which is opened.
Click the tabulation
button
•
To add any variable to the columns of a table, you repeat this process with another
question and then choose Add to column.
•
You should then have the question tabulated with the survey sample characteristics
(below) in this case it is gender has been added to the column.
Back to contents
Page 20 of 32
ESiF User Guide : Released
Version 2.0 – September 2008
You can add more than one variable to the rows and columns of a table. You can also use the Add
to layers option to further filter the results being displayed. For example, you could analyse
satisfaction with council services according to respondents’ ethnicity but also using gender as an
additional filter.
Customising survey data using the dropdown menus
The illustration above shows that cross-tabulations can also be changed by using dropdown boxes
that work in just the same way as those for tables, charts and maps. This includes an option to
remove variables from the table and to change the type of results displayed. For example, to view
raw numbers as well as column and/or row percentages.
Changing the type of data displayed
There are four ways to display the survey data and these options are controlled by using the ‘Type’
dropdown. This allows you to look at the answers to survey questions in a number of different
ways.
Column percentage
In this case the percentages are being calculated vertically.
Therefore the 9.6 in the Very satisfied/Male box illustrates that
9.6 percent of all of the males surveyed marked very satisfied to
the relevant question on the survey. You will see that the three
total percentages columns all add up to 100.
Back to contents
Page 21 of 32
ESiF User Guide : Released
Version 2.0 – September 2008
Row percentage
In this case the percentages are being calculated horizontally.
Therefore the 55.8 in the Very satisfied/Male box illustrates that
55.8 percent of all of the people who marked very satisfied to
the relevant question on the survey were males. You will see
that the total percentages columns for the five question options
and total are all 100. The last column N= shows the number of
people who gave the relevant responses.
Raw numbers
This option displays the actual number of respondees (i.e. the
people who answered the question) by category (in this case
gender). Therefore in this case 43 males answered Very
satisfied to this question.
Row and column percentage
In this case the percentages for each cell are displayed as a
percentage of all of the people who responded to this question
(in this case 883 respondees). Therefore 4.9 in the Very
satisfied/Male box illustrates that 4.9 percent of all of the
respondees to this question were Male and Very satisfied.
(43 / 833 x 100)
Weighting surveys
Survey datasets may include one or more weighting variables. These typically correct for unequal
selection probabilities or to match the profile of the survey population to population estimates.
To apply a weighting variable:
1.
2.
3.
4.
Select the Weight option
and any predefined weighting variables will be displayed.
Click on the weighting variable you want to apply.
Click on the arrow between the boxes to move it to the box on the right.
If you click on an icon or tab above the weighting page, the weighting will be automatically
applied.
5. Alternatively, click on 'OK'.
Note: It is also possible to use a variable that is not pre-defined as a weight in the dataset. In this
case at point 2 above select a variable from the browse list and choose to 'Add as weight'. The
variable will then appear in the box on the right as in point 3 above.
Back to contents
Page 22 of 32
ESiF User Guide : Released
Version 2.0 – September 2008
The last analysis performed is automatically re-executed. To indicate that a weight variable is in
use the message 'Weight is on' appears below the results of any analyses or graphics. By hovering
over this message the label for the weighting variable will be displayed.
To remove weighting from an analysis:
1. Click on the Weight icon.
2. Click 'Clear' to remove all weight variables.
3. Click 'OK' to return to the previous page.
Charting survey data
You can very easily create charts of the tables of survey results you produce by clicking the
chart icon. Please refer to the section on ‘Looking at tables in charts’ in this user guide for more
information.
Additionally, Pie charts
no measure variable).
can be created when there are two or more variables in the table (but
Example of pie chart created in Surveys
Multiple response tables
In some surveys, respondees are asked to give a number of answers to a certain question. For
example “what are the five most important factors that make a good place to live in”. In this case,
the survey results are published in the form of a dataset along with the other survey data. This
dataset works in exactly the same as the ones published under Tables, charts and maps.
However, the detailed analysis functions listed above for survey results are not available for
multiple response tables.
Viewing publications, published maps and user guides
ESiF can also provide users with immediate access to useful publications that are closely related to
the main content and purpose of the site.
The main types of publications available in ESiF
Listed below are the most common types of publications available on ESiF. However, this list is
not exhaustive and we recommend that you browse though the publications in ESiF (or use the
search facility) to find the most useful sources of information. You can access published resources
Back to contents
Page 23 of 32
ESiF User Guide : Released
Version 2.0 – September 2008
via the links on the main pages of ESiF, the Surveys, Published maps and Use guide themes as
well as of course under Publications.
In briefs: These publications are commentaries on specific datasets (e.g. JSA claimant counts or
Average earnings). The In briefs are published under three headings Economy and employment,
Population and housing and Transport and environment and are published regularly. You will find
In briefs useful when you require additional contextual information on specific datasets or topic
areas.
Performance monitoring reports: Some statistics are not easily published in table or survey
form (e.g. the Local Area Agreement (LAA) reports. In this case, the information is published on
ESiF in PDF format.
In touch (the ESiF Newsletter): The ESiF newsletters are published in ESiF when they are
released. Hard copy versions of the newsletter are also available on request.
User guides: There are two versions of the user guide available, the Quick reference guide and
this, the more comprehensive version.
Other publications: Contains guidance on the mechanics of data collection and dissemination.
The ‘Which’ series of publications (e.g. ‘Which geography’) will tell you why ESiF publishes data for
different geographies and how these geographies interact.
Published indicators: Every month, we publish a list of all of the datasets available on ESiF and
the level of geographies they cover. As of August 2008 there were over 300 datasets published on
ESiF. This figure may increase as we source additional data. However, a lot of datasets on ESiF
are updated monthly (in the case of JSA claimant counts) or annually (in the case of Key Stage
attainment) and so the number of datasets will slowly level out but become increasingly
comprehensive.
Published maps: There are over 50 maps available in ESiF some are boundary maps (e.g. Wards
in East Sussex) and some are Thematic maps (e.g. 2007 Indices of Multiple Deprivation). The
maps are high resolution and can be printed to A3 size without any loss of quality.
Opening a publication
The instructions below show you how to open one of the LAA Performance Monitoring reports but
the same principle applies when opening all publications in ESiF.
1. Click on the box next to Publications (note that published material is available in other
themes such as Published maps).
2. Click on the box next to Local Area Agreement (LAA) performance monitoring – this
opens the theme. You will then see all of the publications available under that theme with
Back to contents
Page 24 of 32
ESiF User Guide : Released
Version 2.0 – September 2008
a
icon next to each publication
3. Click on the icon, this opens information about the publication (its metadata) in the main
viewing pane.
4. Click on Open resource in the main viewing pane – this opens the publication.
Note: Publication’s metadata might also include web links to other related recourses.
Publications are normally only available in PDF format so you will need to have a copy of Adobe’s
free Acrobat Reader installed on your PC to view them.
Opening ESiF help guides
You can open PDF versions of this ESiF User Guide and our initial guide to Getting Started with
East Sussex in Figures by clicking on the box next to User guides in the main navigation pane
and following the same procedure as for opening a publication (see above). Both guides can also
be opened by clicking on the links given in our main Getting started page.
Area profiles
This is where you can view and print summary profiles for different parts of the county.
When to use Area profiles
Area profiles contain a number of pre-determined tables, charts and maps that present key
information for different geographical areas. Area profiles are available for every ward and parish
in East Sussex, as well as for each district and for the county as a whole. This allows you to obtain
a large amount of key data in very little time. You can search on an area by either entering a
postcode or the name of the particular area you require data on.
Back to contents
Page 25 of 32
ESiF User Guide : Released
Version 2.0 – September 2008
Opening an Area profile
1. Click on the box next to Area profiles and
select the ‘select you area profile’ hyperlink
2. In the fist box enter the name of the area or its
full postcode (this is useful when you are not
sure of the name of the ward or parish you
require data for). You can also enter the first few
letters of a particular area (e.g. entering ‘S’ and
selecting Wards will return all wards that start
with the letter ‘S’).
3. In the second box you have a choice of selecting
either the Local authority (including the county)
Ward or Parish. Make your selection and then
click on ‘Search’.
4. ESiF will then search on your criteria and return
all areas that match the search. If more than
one area matches your search as in this example,
they will be returned in alphabetical order.
5. Click on the area you require
6. You then have an option to select the type of
area profile you require
The resulting area profile always starts with a contextual map of the selected area
Back to contents
Page 26 of 32
ESiF User Guide : Released
Version 2.0 – September 2008
The Area profile ‘breadcrumb’ trail
Just above the Area profile dashboard you will see a ‘breadcrumb’ trail. This allows you to go back
a step without having to start another area profile creation from scratch. For example, if you
clicked back on ‘Select your profile’ (stage 6 above) you could then create another profile for same
area (in this case Lewes Bridge (ward).
Printing Area profiles
There is a separate section on printing in this guide, but it’s worth noting that there are 2 options
for printing area profiles. The
icon will create a printout of the selected Area profile. This is
very useful for creating a hard copy that can be filed or circulated. Whereas the PDF version
creates a copy that can be easily stored electronically or e-mailed. To do this, save the
option
PDF in the desired personal folder.
Area profiles can not be bookmarked
. The Bookmark function is explained later in this guide.
Other useful functions
Printing
To print a table or chart, you use the
print button in ESiF’s main toolbar. This will open the
print dialogue box for your own printer. If the output is too big to print onto a single page, you
should use the print dialogue options to change the orientation of the page and scale as
necessary. The printout will include the name of the dataset, the row variable, the column
variable and the filter variable.
Printing SVG maps
Maps created using the
icon can not be printed using the
icon. However, there is a simple
way that you can print out maps or, include them in documents and publications.
When you have the view of the map that you require, press the ‘Print screen’ key on your
keyboard. This function captures the current view on your PC. You can them ‘paste’ the image
into the relevant application (MS Word or PowerPoint etc.) and crop and re-size the image
accordingly. The image below was created using this method.
Back to contents
Page 27 of 32
ESiF User Guide : Released
Version 2.0 – September 2008
Exporting to PDF
You can save any table or chart as a PDF file by selecting the
button from the main toolbar.
The resulting PDF can be easily stored electronically or e-mailed. You can save the PDF in the
desired personal folder. Another use for converting tables and charts into PDF is that you can
then copy certain elements of the PDF and import them into reports or documents. Select the
‘snapshot tool’ from the PDF reader (a camera icon) draw a box around the required part of the
PDF and paste the resulting image into the desired application. An example of this is given below
Using metadata when extracting data from ESiF
It is advisable to check the metadata of any dataset you wish to obtain information from. This can
be done by clicking the ‘Description’ tab when you are in a particular dataset, publication or
survey.
You can use the information in the metadata to help you to put the data in context and give more
meaning to the data for the user. For example, for the bar chart above you may want to add: -
This chart shows East Sussex school pupils by type of school in 2006/7; it provides summary
information on all pupils who live in East Sussex and also attend schools maintained by East
Sussex County Council.
Note: This dataset does not include information on all school pupils that live in East Sussex;
neither does it include data on all pupils in East Sussex schools.
The information is taken from the School Census which is carried out three times a year and is coordinated by East Sussex County Council.
Source: East Sussex in Figures
Exporting to MS Excel
You can very easily export any data table (including cross-tabulations of survey results) to an Excel
spreadsheet button in the main
spreadsheet for further analysis etc. by just clicking on the
toolbar. In order to take the spreadsheet off the ESiF server simple select ‘File’ and then ‘Save
As..’ and then save the file in the desired personal folder.
Geographies on ESiF are always published in the same order (e.g the districts are always displayed
in alphabetical order Eastbourne, Hastings, Lewes, Rother, Wealden). Therefore you could export
a number of datasets from ESiF to Excel and copy and paste into one spreadsheet. The dimensions
would be the same providing the table has not been sorted or customised.
Back to contents
Page 28 of 32
ESiF User Guide : Released
Version 2.0 – September 2008
Year group
Eastbourne
Hastings
Lewes
Rother
Wealden
School pupils by year group in 2006/7 - super output areas
All pupils Nursery schools Primary schools Secondary schools Sixth forms
11802
191
6535
5036
40
12742
204
6824
5299
415
10866
114
6143
4445
164
10073
45
5549
4361
118
17971
53
9873
6916
1129
School pupils by gender in 2006/7 - super output areas
Gender
All pupils Males
Females
Eastbourne
11802
6030
5772
Hastings
12742
6478
6264
Lewes
10866
5706
5160
10073
5136
4937
Rother
17971
9202
8769
Wealden
Creating bookmarks
If you have spent time customising a table, chart or map etc. so that it displays the data in the
desired way, you can save that view by creating a bookmark to ensure it will automatically open
like that for you in future.
1.
2.
3.
4.
To create a bookmark,
bookmark
click on the
button in the main toolbar.
Select Browser bookmark,
this will save it to the
Favourites folder in your
browser.
Give your bookmark a
name (and consider
creating a special folder in
Favourites for all your ESiF
bookmarks).
Click OK.
To open any saved bookmark, you select it from your Favourites folder, you can also use
bookmarks as a way of opening ESiF.
When you re-open the bookmark you will see the ESiF has created a unique address (URL) in the
address box of your browser.
You can copy this URL and use it as a link in other applications. However, the URL may be
extremely long. To compress this URL, go to Tiny URL http://tinyurl.com paste in the long URL
when prompted and Tiny URL will create a more compact link for you so:http://www.eastsussexinfigures.org.uk/webview/index.jsp?study=http%3A%2F%2Fesfigures01s.e
scc.gov.uk%3A80%2Fobj%2FfStudy%2F418&mode=cube&v=2&cube=http%3A%2F%2Fesfigures
01s.escc.gov.uk%3A80%2Fobj%2FfCube%2F418_C1&top=yes
Becomes
http://tinyurl.com/5t6rfg
Tiny URL is a free service
Back to contents
Page 29 of 32
ESiF User Guide : Released
Version 2.0 – September 2008
Searching
The search option can be used to find a search term, or terms, in the metadata of a published
Nesstar resource.
1. Enter the search term, or terms, in the box above the browse list
2. Press Return or click
If you enter the words “farm land” the search will look for any occurrence of the word “farm” and
the word “land”.
If you type in the words “Farming of land” no hits will be returned as the 'stop' word 'of' has been
included in the search. If any 'stop' words are used, no hits will be returned and a message will be
displayed asking for the stop words to be removed. Please remove the listed words and try again.
Examples of 'Stop' words are: and, the, in, of.
Search Results
The results of a search are listed at the end of the browse list under the heading 'Searching for:'
followed by the search term, and the number of hits.
The results are displayed under their relevant catalogue headings.
Browsing search results:
•
•
•
Click to view a table/cube.
Click to open a survey dataset.
Click to view the metadata for other types of resources, e.g. Publications. Click 'Open this
publication' to open the actual resource.
Copyright
The ‘Legal information’ page on ESiF contains very detailed information on how data from ESiF can
be used and published. The link for this page can be seen in dark grey at the bottom of the ESiF
site. The link is
http://www.eastsussexinfigures.org.uk/webview/static/legal.pdf
Back to contents
Page 30 of 32
ESiF User Guide : Released
Version 2.0 – September 2008
The main icons in ESiF and what they do
Listed below are the main icons used in ESiF. Each one of these icons is described in detail in
the User guide.
The home button effectively re-sets ESiF but will remove any
dataset you are currently looking at
Opens themes and sub themes in ESiF
Closes themes and sub themes in ESiF
Allows the user to carry out a single word search on all of the
content in ESiF
Allows the user to tab between the metadata (data on data) and
the dataset or survey
Opens a dataset
Opens a survey
Opens a publication
Takes the user form a chart or map back to a table view
Creates a bar chart from the data
Creates a time series chard from the data (when available)
Creates a map from the tabled data
Takes the dataset back to its default view
Allows the user to weight survey data (surveys only)
Converts the table on view into MS Excel format
Converts the table, chart or area profile into PDF format
Sends the table, chart or area profile to the user’s selected printer
Creates a bookmark (select browser bookmark)
Opens the help page
Back to contents
Page 31 of 32
ESiF User Guide : Released
Version 2.0 – September 2008
More information
For more information about East Sussex in Figures, please contact:
Tim Carpenter
East Sussex in Figures Co-ordinator
Research and Information Team
Transport and Environment Department
East Sussex County Council,
County Hall, Lewes, BN7 1UE
01273 482030
[email protected]
Or use the electronic feedback form available on the ‘Contact us’ Page
Back to contents
Page 32 of 32
ESiF User Guide : Released
Version 2.0 – September 2008