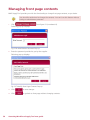
1
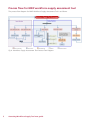
Workforce
Supply
Assessment Tool
user guide
i
Assessing Workforce Supply Tool user guide
About this guide
The NWP Supply Assessment Tool User Guide is organised as follows:
Chapter 1 Introduction, provides detailed start-up information and a brief description of the major
components of the tool.
Chapter 2 Assessing Workforce Supply Tool, contains a description of the over all functionality
of the tool, features provided, description of sheets intended for acquiring the data from users, and
description of the sheets involved with report generation.
Who is it useful for?
The tool is intended for any member of staff who would benefit from assessing elements of their
workforce supply to enable and facilitate effective workforce planning at a fully scalable level.
How can it help me and my organisation?
Whether you’re looking for individual statistics, such as sickness and absence or attempting to display a
more holistic report, this tool illustrates the process for you. It’s designed to profile the current staff at a
trust/PCT and help the organisation illustrate their workforce supply issues and aid workforce planning.
Documentation conventions
The Workforce Supply Assessment Tool User Guide uses the following conventions:
Symbol
Usage
Click
Refers to positioning the mouse pointer (or cursor) over a page button image or
a link, and clicking the left mouse button. If pressing the right mouse button is
required, this is stated as right-click.
Enter
Refers to typing letters or numbers on the computer keyboard.
Note: Calls your attention to additional information.
Tip: Calls your attention to a useful tip.
Warning: Calls your attention to an important warning.
Bold type
ii
Field names and images names within an explanation.
Assessing Workforce Supply Tool user guide
Contents
Chapter 1 - Introduction ������������������������������������������������������������������������������� 2
NWP supply assessment tool overview���������������������������������������������������������������������� 2
Input section of tool�������������������������������������������������������������������������������������������������������������� 2
Output section of tool����������������������������������������������������������������������������������������������������������� 2
Process flow for NWP workforce supply assessment tool������������������������������������������������������� 3
Chapter 2 - Assessing Workforce Supply Tool �������������������������������������������� 4
Getting started������������������������������������������������������������������������������������������������������������� 5
Logging in���������������������������������������������������������������������������������������������������������������������������� 7
Input sheets������������������������������������������������������������������������������������������������������������������ 8
Using ‘Employee data sheet’������������������������������������������������������������������������������������������������� 9
Using ‘Department target FTE sheet’����������������������������������������������������������������������������������� 13
Output sheets������������������������������������������������������������������������������������������������������������� 15
Generating reports�������������������������������������������������������������������������������������������������������������� 15
Statistical reports������������������������������������������������������������������������������������������������������������16
1. Competency report ������������������������������������������������������������������������������������������������������� 16
2. FTE Establishment report ���������������������������������������������������������������������������������������������� 17
3. Leaver analysis report ��������������������������������������������������������������������������������������������������� 17
4. Absence analysis report ������������������������������������������������������������������������������������������������ 17
5. Sickness analysis report ������������������������������������������������������������������������������������������������� 18
6. Retirement forecasting report ��������������������������������������������������������������������������������������� 18
7. Female age group reports ��������������������������������������������������������������������������������������������� 18
8. Number of staff contract wise �������������������������������������������������������������������������������������� 19
9. Staff recruitment source report ������������������������������������������������������������������������������������� 19
10. Leaver’s destination report ������������������������������������������������������������������������������������������ 20
11. Staff age group report������������������������������������������������������������������������������������������������� 20
Graphical reports�������������������������������������������������������������������������������������������������������������21
1. Leaver Analysis Report �������������������������������������������������������������������������������������������������� 21
2. Absence analysis report������������������������������������������������������������������������������������������������� 22
3. Sickness analysis report�������������������������������������������������������������������������������������������������� 23
4. Retirement forecasting report���������������������������������������������������������������������������������������� 24
5. Female age group report����������������������������������������������������������������������������������������������� 25
Export reports ����������������������������������������������������������������������������������������������������������������26
Refreshing / regenerating reports ���������������������������������������������������������������������������������27
Password protecting the exported file and sheets������������������������������������������������������28
Managing front page contents��������������������������������������������������������������������������������� 30
Appendix A �������������������������������������������������������������������������������������������������� 31
Glossary ������������������������������������������������������������������������������������������������������� 31
Customer support���������������������������������������������������������������������������������������� 31
1
Assessing Workforce Supply Tool user guide
Chapter 1
Introduction
NWP supply assessment tool overview
It is an Excel based tool designed to generate the workforce supply oriented reports automatically,
based on the data entered. These reports can be used for analysis and workforce planning for the
future. This tool can be used to assess the current workforce supply statistics and forecast its future
implication to an organisation.
The purpose of the tool is to support step 4 of NWP’s 6-step guide to workforce planning by providing
an accurate starting point for workforce improvement/workforce plans.
Moreover this tool will be used for decision making purposes by the managers of an organisation.
This tool has two main components: input section and output section. The detailed information can be
seen in respective chapters; however, a brief introduction of these is as follows:
Input section of tool
This section deals with acquiring the data from users (ESR administrator in this case). It comprises of
two excel sheets:
i) Employee sheet ii) Department target FTE sheet. The ‘Employee Sheet’ contains data about all
employees; whereas the ‘Department Target FTP Sheet’ will contain data about estimated targets for
employees grouped on basis of either OCC Code, department, directorate, or trust. Details of both
sheets can be seen in Chapter 2 Assessing Workforce Supply Tool of this document.
Keep saving your work while entering data, to prevent any data loss. Click
upper left corner of main window to save the work.
in
Output section of tool
This section of the tool deals mostly with report generation. All the data entered in ‘input section’ will
be used in generating reports in this section.
This section comprises of two parts:
• Report Generation
The report generation part comprises generation of 11 different reports, details of which can be
seen in Chapter 2 Assessing Workforce Supply Tool.
• Exporting Data to SRT
The data export part deals with exporting the data to an existing empty SRT tool workbook. ‘How
this can be achieved?’ is discussed in detail in Chapter 2 Assessing Workforce Supply Tool.
2
Assessing Workforce Supply Tool user guide
Process flow for NWP workforce supply assessment tool
The process flow diagram for NWP Workforce Supply Assessment Tool is as follows:
Fig A: Workforce Supply Assessment Tool-Process Flow Diagram
3
Assessing Workforce Supply Tool user guide
Chapter 2
Assessing Workforce Supply Tool
You will learn…
• Getting Started
• Input Sheets
• Generating outputs (reports and exporting data)
• Using Excel Sheets
• Managing Front Page Contents
This chapter provides detailed information about Workforce Supply Tool, using the sheets for entering
data and generating outputs in the form of reports or exporting to other external files/tool, and
customising the main interface of tool.
4
Assessing Workforce Supply Tool user guide
Getting started
Workforce Supply Tool is an Excel based tool. You must download it to the system, from Healthcare
Workforce Portal (www.healthcareworkforce.nhs.uk), to use it within your organisation.
The tool will work only with Microsoft Excel 2003.
The NWP Supply Assessment Tool needs to be configured for macros before launching it successfully.
For using this tool, the macro security level should be set to low. To do the task, perform these steps:
1. Go to ‘Tools’ menu in task bar.
2. Select ‘Macro’ from this menu.
3. Select ‘Security’ from sub-menu.
Fig B: Macro Settings-Menu
5
Assessing Workforce Supply Tool user guide
4. A pop-up will open. In this pop-up, under Security Level Tab, select low option by clicking on
the respective radio button. (See figure C).
Fig C: Macro Security Level Settings
5. Click
.
The settings will be saved.
6. Close the tool and reopen it, for using.
You will have to configure these settings only while launching application for first time.
7. If user tries to exit design mode before reopening the file he/she will get the following
message:
6
Assessing Workforce Supply Tool user guide
Logging in
1. Launch Workforce Supply Assessment Tool.
Following page displays.
Fig 2.1 Workforce Supply Assessment Tool-Main Page
»»
ENTER EMPLOYEE DATA
Click to open an Excel sheet where you can enter Employee data.
»»
ENTER DEPARTMENT DATA
Click to open an Excel sheet where you can enter Department data.
The above mentioned areas comprise ‘input’ section of the tool; where you can enter the
required data. It is explained in detail in section “Using Input Sheets”.
»»
SHOW REPORTS
Click to open a new screen from where you can view all reports.
Show Reports area comprise ‘output’ section of the tool; where you can get the reports
based on data entered in ‘input’ section. It is explained in detail in section “Using Output
Sheets”.
»»
MANAGE FRONTPAGE CONTENTS
Clicking this will let you change the contents of main page, as desired.
For more details, refer to “Managing Front Page Contents” section in this chapter.
7
Assessing Workforce Supply Tool user guide
Input sheets
As mentioned above, the input section comprises of two sheets where data can be entered. Each of
the sheets is discussed below.
Keep saving your work while entering data, to prevent any data loss. Click
left corner of main window to save the work.
in upper
All the following fields should be filled appropriately with meaningful data for effective
reporting as the reports are mainly based on these fields:
User ID, OCC Code, OCC Description, Age, Pay Band, Pay Point, Directorate,
Department, Team, Contract Type, Termination Date, Trust Employer, Number
of days absent, Number of days sick, Destination on leaving, Source on
Recruiting, Assignment work usage, KSF Dimension, Achieved Level, Gender,
Target Absence.
8
Assessing Workforce Supply Tool user guide
Using ‘Employee data sheet’
By using this sheet, you can enter the employee data in respective fields. Here, each row represents the
data about a single individual. But if a person is associated with multiple Competencies (ie Dimensions)
then the whole record will be repeated again for each competency (or dimension).
1. Click
from figure 2.1 (numbered as 1).
Following page displays.
Figure 2.2 Employee Sheet
9
Assessing Workforce Supply Tool user guide
Following table shows the details of columns used in the Employee Data Sheet.
For fields marked with *, the following instruction applies:
Click
in front of required field, and select a value from given drop down list.
Column Name
Column Description
User ID
Represents the user ID of employee.
It should be unique for every Job of an employee. Same
User ID will need to be repeated for every Competency/
Dimension with which employee is associated for a
particular job.
OCC Code *
Age
Represents National Occupational Code values that are currently provided
by the ESR system.
Values can also be entered manually.
Represents the age of employee.
Click number hyperlink (marked as red) in fig 2.5 to drill
down and see details of awaiting post outlines.
Ethnicity *
Area Of Work
Represents the ethnicity group of the employee. These values are also
provided by ESR.
Values can also be entered manually.
Represents the working area of employee.
You can enter alpha numeric data in this field, manually.
Pay Band *
Represents the salary band of employee.
Pay Point *
Represents the pay-point of employee.
Values can also be entered manually.
The drop-down will be available only if the Pay Band is
selected first.
Directorate
Represents the directorate to which the employee belongs.
You can enter any required text data in this field,
manually.
Department
Represents the department to which the employee belongs.
You can enter any required text data in this field,
manually.
Team
Represents the team to which the employee belongs.
You can enter any required text data in this field,
manually.
10
Assessing Workforce Supply Tool user guide
Staff Group
Represents the staff group to which the employee belongs.
You can enter any required text data in this field,
manually.
Contract Type *
Represents the contract type of employee.
Job Title
Manual entry is not allowed here.
Represents the job title of employee.
*
You can enter any required text data in this field,
manually.
Gender *
Disability Indicator
Represents the gender of employee.
*
Manual entry is not allowed here.
Represents either employee has some disability or not.
Disability Indicator
Description *
Represents the details of disability in an employee.
Date Of Hiring
Represents the hiring date of employee.
You can enter any required text data in this field,
manually.
You can enter any required text data in this field,
manually. The format should be dd/mm/yyyy.
Date Of Termination
Represents the termination date of employee.
You can enter any required text data in this field,
manually. The format should be dd/mm/yyyy.
Trust Employer *
Number Of Days Absent
Represents the employer-trust’s name of employee. The values can be
selected from pre-populated lists of trusts.
Manual entry is not allowed.
Displays total number of days of employee’s absence.
You can enter any required text data in this field,
manually.
Number Of Days Off Sick
Displays total number of days of employee’s absence on grounds of ‘sick
leave’.
You can enter any required text data in this field,
manually.
Destination On Leaving *
Represents the name of the trust where employee has moved after
switching the job.
Source on Recruiting
Represents the organisation name that the employee joined in initially
under NHS.
Assignment Title
Represents the Assignment title of employee. In case employees have
multiple assignments, you can enter another row for the same employee
but with different assignment title.
You can enter any required text data in this field,
manually.
11
Assessing Workforce Supply Tool user guide
Assignment Work Usage
Represents a numeric FTE value.
You can enter any required text data in this field,
manually.
KSF Dimension *
KSF Dimension-Level
Overtime
Represents the core and specific KSF dimensions for employee. You can
add another row(s), in case a person has more than one dimension for a
particular assignment.
*
Manual entry is not allowed.
Represents the level of employee against each core/specific KSF
dimension.
Manual entry is not allowed.
Represents the extra number of hours that the employee has put in.
You can enter any required text data in this field,
manually.
12
Assessing Workforce Supply Tool user guide
Using ‘Department target FTE sheet’
At this sheet, the user can enter the data in respective fields, about estimated targets for employees
grouped on basis of OCC Code, department, directorate, and trust. Here, each row represents the data
for a Trusts’ hierarchal group.
1. Click
from figure 2.1 (numbered as 2).
Following page displays.
Figure 2.3 Department Sheet
Following table shows the details of columns used in the Department Sheet.
Column Name
Column Description
Trust Name
Represents the name of trust.
*
Directorate Name
Values can also be entered manually.
Represents the subject directorate within each trust.
You can enter any required text data in this field,
manually.
Department Name
Represents the department name within each directorate.
You can enter any required text data in this field,
manually.
Team Name
Represents the team name with each department.
You can enter any required text data in this field,
manually. This is an optional field.
National Occupational Represents the group of employees on basis of National Occupational
Code *
Code of employees, within a team or department.
Target Attendance
Values can also be entered manually.
Represents the target attendance for this OCC Code, for a team or
department.
You can enter any required text data in this field,
manually.
13
Assessing Workforce Supply Tool user guide
Column Name
Column Description
Target Absence
Represents the target absence for this OCC Code, for a team or
department. Actual absents will be evaluated against this target absence,
in output section.
You can enter required text/numeric data in this field,
manually. This is an optional field
Click to go back to home page from any report
14
Assessing Workforce Supply Tool user guide
Output sheets
As mentioned above, the output section deals with report generation and data export to external files.
Each of the functionality is discussed below.
Generating reports
This page displays the list of all reports, generated by tool. At this page, you will be able to view three
types of reports namely:
• Statistical Reports
• Graphical reports
• Export Reports.
Each of the above enlisted report categories has a special purpose having different reports within.
Details’ regarding these reports and more is what this section will brief you with.
1. Click
from figure 2.1 (numbered 3).
Following page displays.
Fig 2.4 Show Reports – Main Page
15
Assessing Workforce Supply Tool user guide
2. To view each report, click
button in front of that report name.
Let’s discuss each report one by one.
Clicking
will only display the reports, without refreshing
it. To see updated/recent reports, refresh and regenerate it first (see
section “Refreshing/Regenerating Reports”).
Statistical reports
Statistical reports represent the current workforce supply statistics and forecast its future implication to
an organisation.
1. Competency report
This report shows the total number of staff possessing a particular competency based on KSF
dimension, and its corresponding level.
Here the data under ‘Total Staff’ in each row represents the number of staff possessing a particular
KSF Dimension at a particular KSF level e.g. First row of report (highlighted in figure 2.5) shows that
there is only one staff having level 4 of KSF’s Assessment and Treatment Planning dimension.
Fig 2.5 Competency Report
16
Assessing Workforce Supply Tool user guide
2. FTE Establishment report
This report shows the total number of staff belonging to this particular hierarchy (group). The
Directorate represents highest level of hierarchy, while moving left-to-right within columns.
Each row represents the total number of employees working in this particular group. For example,
the highlighted row represents that a total of 1 employee is working in group bearing OCC
Code QA004, as member of Clinical team, within department Clinical Governance, under Clinical
Governance directorate.
Fig 2.6 FTE Establishment Report
3. Leaver analysis report
This report shows the total number of staff that has left the organisation.
Turnover percentage is calculated on basis of ‘total number of leavers’ and the ‘number of total
users of trust’.
Fig 2.7 Leaver Analysis Report
4. Absence analysis report
This report shows the total number of staff, categorised on basis of Directorate or Department,
who are absent.
‘Number of Episodes of Absence’ means the total number of absents made so far and ‘number of
absent staff’ means the total number of staff who have made these absents (ie. sum of all staff
having 1 or more absents). Here, the report viewers can compare total number of absents against
the ‘target absent values’, for analysis purpose.
Fig 2.8 Absence Analysis Report
17
Assessing Workforce Supply Tool user guide
5. Sickness analysis report
This report shows the total number of staff by OCC code group, with their sickness percentage.
‘Days Lost’ means the total number of leaves made so far and ‘Headcount’ means the total number
of staff who have availed these leaves (ie. sum of all staff having 1 or more leaves). ‘Total staff’
represents the total number of staff within a particular group.
Fig 2.9 Sickness Analysis Report
6. Retirement forecasting report
This report shows the upcoming retirement forecasting for the total number of staff, categorised
on basis of directorates, department etc.
Fig 2.10 Retirement Forecasting Report
7. Female age group reports
This report shows the pay band wise count of female staff, falling between age group of 25 and
35, categorised on basis of directorates, department etc.
Fig 2.11 Female Age group Report
18
Assessing Workforce Supply Tool user guide
8. Number of staff contract wise
This report shows the number of staff on the basis of their contract types.
‘Total Staff’ represents the number of employees belonging to a specific ‘Contract Type’.
Fig 2.12 Number of Staff- Contract Wise Report
9. Staff recruitment source report
This report shows the total number of staff being recruited from a particular source.
Fig 2.13 Staff Recruitment Source Report
19
Assessing Workforce Supply Tool user guide
10. Leaver’s destination report
This report shows the total number of staff leaving for a particular destination.
Fig 2.14 Leaver’s Destination Report
11. Staff age group report
This report shows the total number of staff, who belong to a particular age group.
Fig 2.15 Staff Age Group Report
All the information in these reports comes from the two input sheets and
calculated automatically by the tool while generating report.
To go back to Show Reports page from any report, click
provided on top left corner of all reports.
20
Assessing Workforce Supply Tool user guide
link,
Graphical reports
The Workforce Supply Assessment Tool provides you with an option to view the reports in graphical
format.
1. To view each report, click
button in front of that report name. Let’s discuss
each report one by one.
The description of each of these reports can be seen in “Statistical Reports” section
in this chapter.
1. Leaver Analysis Report
The report displays as follows.
Fig 2.16 Leaver Analysis Report
The graphs show the total staff leaving the organisation, w.r.t ‘directorate’ and ‘pay band’. X-axis
represents the respective pay band or directorate; whereas the Y- axis represents the total number
of staff.
21
Assessing Workforce Supply Tool user guide
2. Absence analysis report
The report displays as follows.
Fig 2.17 Absence Analysis Report
The graph shows the ‘Number of Episodes of Absence’ w.r.t ‘directorate’. X-axis represents the
directorate; whereas the Y- axis represents the total number of absences.
22
Assessing Workforce Supply Tool user guide
3. Sickness analysis report
The report displays as follows.
Fig 2.18 Sickness Analysis Report
The graph shows the number of ‘Days Lost’ w.r.t ‘directorate’. X-axis represents the directorate;
whereas the Y- axis represents the number of days lost.
23
Assessing Workforce Supply Tool user guide
4. Retirement forecasting report
The report displays as follows.
Fig 2.19 Retirement Forecasting Report
The graphs show the total staff falling between age 55 and 65, w.r.t ‘directorate’ and ‘pay band’.
X-axis represents the respective pay band or directorate; whereas the Y-axis represents the total
number of staff falling between this age group.
24
Assessing Workforce Supply Tool user guide
5. Female age group report
The report displays as follows.
Fig 2.20 Female Age Group Report
The graphs show the total female staff falling between age 25 and 35, w.r.t directorate as well
as w.r.t. pay band. X-axis represents the respective pay band or directorate; whereas the Y-axis
represents the total number of female staff falling between this age group
25
Assessing Workforce Supply Tool user guide
Export reports
The Workforce Supply Assessment Tool provides you with an option to export all these reports (or any
of these, as required) to a new/blank Excel workbook.
1. Click
to export a report to new work book sheet from figure 2.4 ‘Show
Reports-Main Page’.
Following pop-up displays.
Fig 2.21 Export reports Pop-Up
From this page, you can select the report(s) you want to export to new Excel Sheet. You can select
the reports by clicking the checkboxes with that particular report name. Once you select the
reports and click
, you will be asked to give the path where you want to save this new
sheet. Doing this will export the report(s) to a new Excel workbook, with the specified name and at
specified location.
26
Assessing Workforce Supply Tool user guide
Refreshing / regenerating reports
The Workforce Supply Assessment Tool allows you to refresh or regenerate the reports at any time.
The reports will only be refreshed and won’t be displayed. To view these reports, you
will have to follow the same procedure as described in section “Generating Reports”.
1. Click
from figure 2.4, to refresh or regenerate the reports at any
time.
Following pop-up displays.
Fig 2.22 Refresh reports pop-up
From this page, you can select the report(s) you want to refresh or regenerate. You can select the
reports by clicking the checkboxes with that particular report name. Once you select the reports
and click
. Doing this will refresh the selected report(s) ie. the previous ones will be
replaced with the updated/recent versions of reports.
27
Assessing Workforce Supply Tool user guide
Password protecting the exported file and sheets
You can protect your Excel files/sheets with a password, after exporting these to a new Excel
Workbook.
To protect the files follow these steps:
1. Under Tools tab, click Options link.
Following screen displays.
Fig 2.22: Password Protection-File
2. Select Security tab from the screen in fig 2.22.
3. Enter password in field titled “Password to Open” (highlighted in fig 2.22).
Following screen displays
Fig 2.23: Confirm Password
4. Enter the same password in screen shown in fig 2.23
5. Click
Once you password protect the file, the file cannot be opened without entering correct
password..
28
Assessing Workforce Supply Tool user guide
To protect the sheets, follow these steps:
1. Go to Tools menu in task bar.
2. Select Protection from this menu.
3. Select Protect Sheet from sub-menu.
Fig 2.24: Password Protection-Sheet
Following screen displays.
Fig 2.25: Protect Sheet
4. Enter password in field titled “Password to Unprotect Sheet” (highlighted in fig 2.25).
Confirm Password screen displays (see fig 2.23).
5. Enter the same password in screen shown in fig 2.23
6. Click
29
.
Assessing Workforce Supply Tool user guide
Managing front page contents
NWP Supply Tool provides you with the functionality to change front page contents, as you desire.
You should be authorised to change the contents. You can’t use this feature without
having an administrator password.
1. Click
from figure 2.1 (numbered 4).
Following pop-up displays.
Fig 2.26 Administrator Password Pop-up
2. Enter the password provided to you by the supplier.
Following pop-up displays.
Fig 2.27 Modify front Page Contents Pop-up
30
3. Click
to save changes.
4. Click
to go back to front page without changing contents.
Assessing Workforce Supply Tool user guide
Appendix A
Glossary
Export data – To take data from one file to another, by copying it to the target file.
Front page – First/main page that is displayed when you start this Workforce Supply Assessment Tool
(see figure 2.1)
FTE - Full Time Equivalent
Input data– To enter data in some file etc.
OCC code – National Occupational Code
Customer support
Ikonami Ltd offers a Helpdesk service for its customers.
The Helpdesk will give you help for the use of the system and will answer all questions you might have
while using NWP Supply Assessment Tool.
The Helpdesk can be contacted via email.
E-mail: [email protected]
31
Assessing Workforce Supply Tool user guide
3000 Manchester Business Park
Aviator Way, Manchester M22 5TG
Tel: 0161 266 2300
Fax: 0161 266 1001
Email: [email protected]
www.healthcareworkforce.nhs.uk
Product code: NWPTO-0809-001/UG
www.ikonami.com
32
The content of this document remain the copyright and intellectual property of NHS National Workforce Projects
Assessing Workforce Supply Tool user guide