1
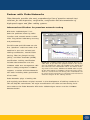
NETWORKSUPERVISION
Copper Cabling
Troubleshooting Handbook
NETWORKSUPERVISION
Table of Contents
Introduction
2
Troubleshooting Basics
3
Link Models
4
The Automated DTX Series Diagnostics
5
Causes of Cabling Faults
8
Advanced Troubleshooting Diagnostics
10
Conclusion
16
Introduction
“Certification” is the process of comparing the transmission performance of an
installed cabling system to a standard, using a standard defined method of
measuring the performance. Certification of the cabling system demonstrates
component quality and installation workmanship. It is typically a requirement to
obtain the cabling manufacturer’s warranty. Certification demands that the cabling
links yield a “passing” result. Technicians must diagnose the failing links and after
a corrective action has been implemented they must retest to ensure the link meets
the required transmission performance. The total time to certify an installation does
not only include making the certification measurements but also documentation
and troubleshooting.
Why the need for advanced diagnostics?
Today’s cabling installation professionals must therefore know how to troubleshoot and
diagnose high-performance cabling systems.
As newer high-performance cabling systems have been developed and deployed, every
aspect of the installation demands a higher level of skill and more attention to detail. New
test parameters have been added. The links must be tested using one of two link models –
the Permanent Link or the Channel – and the links are tested and evaluated over a greater
frequency range and with more data points. The components with which these links are
constructed need to deliver better performance and the quality of the workmanship during
installation must rise accordingly.
Due to the increased complexity of these cabling systems, determining the cause of failure
and quickly restoring suitable performance has become a challenging task. This handbook
guides you through the troubleshooting of advanced structured cabling systems using the
Fluke Networks DTX Series CableAnalyzer™ so you can increase your productivity and deliver
better value to your organization.
2
NETWORKSUPERVISION
Troubleshooting Basics
Most common causes of failures in twisted pair cabling:
1. Installation errors – Proper connections while maintaining the wire pairs and the twist
rate in each pair; always keep the “original twist” in each wire pair as much as practical
2. Connectors that do not meet the required transmission quality
3. Incorrect tester set up
4. Defects or damage in the installed cable
5. Bad patch cords*
*Patch cords rate high on the list in operating networks. Certification is often executed using the Permanent Link Model before
the patch cords used by the operating network are installed.
Before you begin testing, you should verify the basics:
• H
as the correct test standard been selected? – The certification test is executed
as an automated test or an “autotest”. The test standard you select for an autotest determines the link model (Permanent Link or Channel), the test parameters to be measured, the frequency range over which the tests are executed and the Pass/Fail criteria for each test.
• Has the correct link model been selected?
• Are you using the appropriate test adapter with a plug that matches the jack in the
Telecommunication Outlet (TO) or the patchpanel?
• H
as the test reference been set in the last 30 days? – It is recommended to set the
reference on a regular basis at a time that is easy to remember (such as every Monday morning).
• Are you using the most current version of the tester software?
• I s the Normal Velocity of Propagation (NVP) set correctly for the cable under test? –
NVP plays a role when the tester reports length or distance to a defect.
• I s the tester within its operating temperature range and in calibration? – Remember
that your Fluke Networks CableAnalyzer is a very accurate instrument that measures small noise disturbances in cables. These instruments are calibrated in the factory before shipping and this calibration should be verified every 12 months in an
authorized service center. If the tester has been stored in a colder or warmer place
than the one in which you are working (overnight in a vehicle), allow the unit to
warm up to its steady-state operating temperature before setting a reference or
executing any measurements. This may take 10 to 15 minutes or more depending
on the temperature differential.
3
Link Models
To obtain meaningful results, it is essential to select the appropriate autotest and link
model. The Permanent Link performance is defined in such a way that after adding good
patch cords to a passing link, the channel performance is automatically met. By “good”
patch cords, we mean patch cords that pass the same class or category rating as the link.
For this reason, it is recommended that new cabling installations are certified using the
Permanent Link model and test standard. Patch cords and equipment cords may be changed
many times during the life of the Permanent Link.
The Permanent Link test model requires that the test-interface cables connecting the test
tool to the link-under-test are totally transparent to the measurements. In a practical
sense, this means that certification test tools must be much more sophisticated to subtract
the test cord effects/contributions for each test parameter measurement.
However, the Permanent Link model includes the performance of the end connections – the
mated connection of the 8-pin modular plugs (RJ45) at the end of the test adapters and
the jacks (sockets) of the link. Plug-jack combinations can deliver varying test results for
critical parameters like Near-End Crosstalk (NEXT) and Return Loss. To properly asses the
performance of the end jacks of the link (in the TO and the patch panel) and the wire pair
terminations in those jacks, the plug at the end of the Permanent Link test adapter shall
be a test-reference plug. A test-reference plug delivers, for all frequency-sensitive test
parameters, performance in the center of the component specifications within a narrow
band of tolerance. These plugs do not vary much one from the other and deliver repeatable
test results.
Figure 1: Permanent Link Model
Channel measurements are typically performed when restoring service, or verifying cabling
for application support. It is uncommon to perform Channel tests at the conclusion of a
new installation, since the patch cords that belong to each link are rarely available at that
time. Correct Channel measurements must cancel the effects of the mated connection in
the tester’s Channel adapters.
Figure 2: Channel Model
4
NETWORKSUPERVISION
The Automated DTX Series Diagnostics
When an autotest fails or delivers a “marginal” pass result,
the DTX Series testers automatically process data to produce
diagnostic information for the cabling link. After the
diagnostic process has been completed, the user can press
the “FAULT INFO” key to see the results of the diagnostic
data processing of the test results.
First, let us review what a “marginal” test is. The margin of a
test is the difference between the measured value and the
applicable Pass/Fail limit value. The margin is positive when
the test passes, negative when the measurement fails and
zero when the measured value is equal to the limit value. A
greater margin indicates that the result is further away from
the limit. A larger positive margin therefore indicates a very
good test result. A very small margin means that the test
result is close to the limit value. A test result is called
marginal when its margin is smaller than the accuracy
specification for the test parameter. For example, the
accuracy of the Near End Crosstalk (NEXT) measurements is 1
dB at 250 MHz and the worst case margin of a link at 250
MHz is 0.4 dB. That NEXT test results at 250 MHz is
considered very close to the limit and is called a marginal
test result. In this case, the tester automatically generates
diagnostics information to point out what may have caused
this marginal result. This information provides the
opportunity to locate the problem, correct it and deliver a
link with good performance.
If the cabling link fails to pass the wire map test – the test
that verifies that all 8 wires connect the right pins at either
end of the cable – the tester halts the test and displays the
results. Figure 3 shows such a wire map failure. The wire in
pair 1 that connects pin 4 is open at 48 m from the Main
units and at 17 m from the Smart Remote unit. The DTX Main
unit is represented as the left-hand side of these screens. The
software halts and asks the operator whether or not to
continue the test. It often makes more sense to tackle the
wire map error before continuing the test. The open wire
causes the results for some test parameters to be undefined.
For example, the insertion loss of the wire pair that is open
is infinite. Any parameter based on a calculation with the
insertion loss value is therefore invalid or undefined.
Figure 3: The wire connecting
pin 4 is open at 48 m from the
main unit and at 17 m of the
Smart Remote unit.
Figure 4: Upon completion
of an Autotest, the tester’s
screen shows the list of test
parameters executed for
the selected test standard.
Test parameters marked with
the red X fail. The tester
also displays the worst-case
margin for each parameter in
parentheses at the right edge
of the screen.
5
The unique value of the DTX Series diagnostics come to
the forefront in the testers’ ability to locate performance
problems such as return loss or NEXT.
Figure 4 shows the test result screen of a failing Class E link.
Return Loss shows a marginal failure whereas Near End
Crosstalk (NEXT), Power Sum NEXT (PSNEXT), Attenuationto-Crosstalk Ratio (ACR) and Power Sum ACR (PSACR) show
outright failures. The numbers in parentheses on the right
hand side of the screen show the worst-case margin for the
corresponding test parameter.
By pressing the FAULT INFO key the tester offers four
diagnostic possibilities. Figures 5a though 5d show these
different possible scenarios for the failure. The user should
evaluate all of these possibilities, inspect the cable for what
is described and when a problem is confirmed, perform the
corrective action.
In figure 5a, the tester entertains that the link may have
more than four connectors. A first possibility for the failures
after analyzing the test results data. The link in question
contains four connectors as the tester screen shows. So this
diagnostic does not apply.
Figure 5a: All of the automatically generated diagnostics
graphically show the link with
the main unit at the bottom
of the picture and the Smart
Remote on top. The diagnostics
show a link of 67 m with four
connections and some uncertainty in the center (dashed
line). The diagnostics suspects
that the permanent link may
have too many connections.
In figure 5b, the diagnostics show that a shorter cable
segment at 18 m from the remote unit contains a Return Loss
defect that causes the marginal result for wire pair 4,5. The
tester prints the recommended inspection: “Verify wire twist
is maintained at the jack and verify that the jack is the
correct category rating.” In other words, either the wire
termination at the jack or the jack itself is the source of
the marginal test result for RL on pair 4,5.
Figure 5c shows the next possible fault location identified
by the tester diagnostics. At approximately 17 m form the
remote tester unit, excessive crosstalk occurs between two
wire pair combinations.
A last possibility is shown in the screen of figure 5d. The
tester locates a connector at 9 m from the tester remote
unit and an 8 m cord to the next connector in the link and
suspects the cable in the segment between these connectors.
The message “Verify the cable is the correct type. Cable
appears to be category 5.” warns that the source of the
failure could be that the 8-meter cord is a Cat 5 cable in
a link in which all component should rate as Cat 6 in order
to obtain Class E performance. Note that this screen tells
us that the second connector at the end of the patch cord
is 17 m removed from the tester remote unit. So, which
one of these automatically generated diagnostics is correct?
6
Figure 5b: Press the up or
down arrows to move from one
suspect location in the link
to the next. Move the right/
left arrow keys to read multiple
diagnostics at a location.
This location at 18 m from
the Smart remote only shows
one defect that is expected to
be the cause of the marginal
return loss results for wire pair
4,5. The tester also posts the
recommended inspections and
corrections.
NETWORKSUPERVISION
Figure 6 shows the configuration of the link we constructed
for this test.
Figure 7 shows a picture of the actual defect. The wire
pairs at the end of the 2 m patch cord are untwisted in
an excessive manner and caused the NEXT failures at that
connection as well as the marginal return loss problem for
pair 4,5 at that same location. The diagnostics described
above locate the defects at 18 m from the Smart remote
unit for return loss and at 17 m for NEXT. This is indeed
an accurate diagnostic. When the test technician locates
this point along the physical link, the defect indeed stands
out. The most expedient and typically best remedy for a
failing patch cord is to obtain and install a good Cat 6
replacement cord. At that time, you should retest the link
to ensure that all defects have been corrected and that the
link passes. The actual time to execute this repair should
not exceed a few minutes.
Figure 5c: This screen places
the source of the NEXT failures
in two of the wire pair combinations at 17 m from the Smart
Remote unit. The text in the
screen provides the suggested
inspections and corrective
actions.
Note that the configuration of this test link is unusual.
The recommended Permanent Link configuration ends in
a patch panel on one end and the TO at the other end
with optionally a consolidation point (CP) (connection)
no less than 15 m from either end, as depicted in figure 1.
In this regard, the diagnostic depicted in figure 5a is also
correct. This Permanent Link contains one more connection
than usual or than recommended. We know, however, that
after replacing the defective patch cord with a good one,
this link, including the connector, normally meets the
Class E permanent link test.
If the defect in this link had been at the consolidation point,
the technician would have to re-terminate that connection
after verifying that the connectors themselves are specified
as Cat 6 compliant components.
The automated link diagnostics save time over trial-anderror techniques that usually include re-terminating the
wiring and/or replacing the connecting hardware in several
locations in order to get a failing link to pass. The section
on advanced troubleshooting techniques will show you
how you can obtain and interpret the underlying diagnostic
information generated by the tester’s analysis algorithms.
Figure 5d: The last diagnostic
suspects the cable between the
two middle connections. You
learn in this text that the real
cause of the link failures is the
untwist of the wires at the end
of the patch cord.
7
Figure 6: The map of the permanent link under test. The wire pairs of patch cord 1 are untwisted at the left
termination as indicated in the schematic diagram.
Figure 7: This photo shows a close up of the wire pair termination at one end of the 2-meter patch cord.
This is the defect in the tested link.
8
NETWORKSUPERVISION
Causes of Cabling Faults
For each of the required TIA and ISO structured cabling measurements, you will find
troubleshooting tips to help quickly pinpoint the cause of failures when they occur.
In some instances, you will find suggested reasons why the measurement does not fail
in cases you would expect to see a failure.
Wiremap
Test Result
Possible Cause of Result
Open
• Wires brocken by stress at connections
• Cables routed to wrong connection
• Wire is not punched down properly and does not make contact in
the IDC
• Damaged connector
• Cuts or breaks in cable
• Wires connected to wrong pins at conector or punch block
• Application-specific cable (e.g. Ethernet using 12/36 only)
Short
• Improper connector termination
• Damaged Connector
• Conductive material stuck between pins at a connection
• Damage to cable
• Application – specific cable (e.g. factory automation)
Align reversed pair
• Wires connected to wrong pins at connector or punch block
Crossed pair
• Wires connected to wrong pins at connector or punch block
• Mix of 568A and 568B wiring standards (12 and 36 crossed)
• Crossover cables used (12 and 36 crossed)
Split pair
• Wires connected to wrong pins at connector or punch block
Length
Test Result
Possible Cause of Result
Length exceeds limits
• Cable is too long – check for coiled service loops and remove in
this case
• NVP is set incorrectly
Length reported is
shorter than known
length
• Intermediate break in the cable
One or more pairs
significantly shorter
• Damage to cable
• Bad connection
Note: Standard practices dictate that the cabling length be defined by the length of the shortest pair. NVP varies
per pair, meaning each pair could be reported with a different length. These two conditions can result in a cable
with three of four pairs over the length limit, yet the link result is a Pass (e.g. a channel with 101, 99, 103, 102
meters for the four pairs). A Pass in this case is the correct interpretation.
9
Delay/Skew
Test Result
Possible Cause of Result
Exceeds limits
• Cable is too long – Propagation delay
• Cable uses different insulation materials on different pairs – Delay skew
Insertion Loss (Attenuation)
Test Result
Possible Cause of Result
Exceeds limits
• Excessive length
• Non-twisted or poor quality patch cables
• High impedence connections – Use time domain techniques to troubleshoot
• Inappropriate cable category – e.g. Cat 3 in a Cat 5e application
• Incorrect autotest selected for cabling under test
NEXT and PSNEXT
10
Test Result
Possible Cause of Result
Fail, *fail, or *pass
• Poor twisting at connection points
• Poorly matched plug and jack (Category 6/Class E applications)
• Incorrect link adapter (Cat 5 adapter for Cat 6 links)
• Poor quality patch cords
• Bad connectors
• Bad cable
• Split pairs
• Inappropraite use of couplers
• Excessive compression caused by plastic cable ties
• Excessive noise source adjacent to measurement
Unexpected pass
• Knots or kinks do not always cause NEXT failures, especially
on good cable and far removed from the ends of the link
• Incorrect autotest selected (e.g. “Bad” Cat 6 link tested to Cat 5
limits)
• “Fails” at low frequency on NEXT graph but passes overall.
When using the ISO/IEC standards, the so-called 4dB rule
states all NEXT results measured while insertion loss <4dB
cannot fail
NETWORKSUPERVISION
Return Loss
Test Result
Possible Cause of Result
Fail, *fail, or *pass
• Patch cord impedence not 100 ohms
• Patch cord mishandling causes changes in impedence
• Installation practices (untwists or kinks of cable – the original twists should be maintained as much as possible for each wire pair) •
Excessive amount of cable jammed into the Telecom Outlet box
• Bad connector
• Cable impedance not uniform
• Cable not 100 ohm
• Impedance mismatch at junction between patch cable and
horizontal cable
• Poorly matched plug and jack
• Use of 120 ohm cable
• Service loops in telecommunications closet
• Inappropriate autotest selected
• Defective link adapter
Unexpected pass
• Knots or kinks do not always cause return loss failures,
especially on good cable and far removed from the ends of the link
• Incorrect autotest selected (easier to pass RL limits)
• “Fails” at low frequency on RL graph but passes overall
Due to the 3 dB rule, whereby all RL results measured while
insertion loss <3 dB cannot fail
ACR-F and PS ACR-F (older names: ELFEXT and PSELFEXT)
Test Result
Likely Cause of Result
Fail, *fail, or *pass
• General rule: troubleshoot NEXT problems first.
This normally corrects any ACR-F (ELFEXT) problems
• Service loops with many tightly coiled windings
Resistance
Test Result
Likely Cause of Result
Fail, *fail, or *pass
• Excessive cable length
• Poor connection due to oxidized contacts
• Poor connection due to marginally attached conductors
• Thinner gauge cable
• Incorrect patch cord type
11
Advanced Troubleshooting Diagnostics
The DTX Series diagnostics discussed above represent a
distillation of a more complex analysis of test results. In this
section, we discuss the lower level, more detailed diagnostics
information that the DTX Series testers generate. This section
is provided to enhance the understanding of the diagnostic
analysis of link failures. In many cases, the automated
diagnostics provide a clear description of the locations of
defects or poor cable termination. Knowledge of advanced
diagnostics may be able to distinguish cases in which
automated diagnostics fall short.
The basis of the tester’s ability to report the distance to a
location on the link-under-test where crosstalk is excessive or
where Return Loss is excessive, is the conversion of the test
results collected in the frequency domain to the time domain.
The DTX Series testers execute this conversion using unique
and patented digital signal processing techniques. The data
in the time domain is in turn converted to a profile of the
measured disturbance along the length of the link1.
Figure 8: Access HDTDX and
HDTDR data by selecting the
parameters. They are shown
at the end of the list of test
parameters. They are not test
parameters as defined by the
standards. The ‘i’ symbol before
their names indicates “for
information only.”
The two parameters that provide the time domain information
are HDTDX (High Definition Time Domain Crosstalk) and
HDTDR (High Definition Time Domain Reflectometry). As the
name indicates, the HDTDX parameter shows the profile of
crosstalk happening along the link-under-test while HDTDR
shows signal reflections along the link. Impedance changes
cause signal reflections that contribute to the measured
return loss value. If these reflections become too big and
the total amount of energy reflected exceeds the maximum
amount allowed, the return loss test fails.
Investigate HDTDX
When an Autotest yields a Fail result and the diagnostics in
the tester generate the time domain data, the detailed
diagnostic information is captured in the HDTDX and HDTDR
test parameters. The tester software further analyzes this
time domain information to generate the graphical results
with recommendations for the corrective action as we
discussed earlier. The user can view the HDTDR and HDTDX
information. Figure 8 shows the two diagnostic parameters
on the tester’s screen. Highlight HDTDX and press ENTER to
see the screen depicted in Figure 9. This figure shows the
magnitude of the NEXT coupling along the link for all six
The conversion from time to distance relies on the knowledge of the speed
with which the electrical signals travel over the twisted pair copper cabling. The
cabling characteristic called NVP (Nominal Velocity of Propagation) expresses this
speed with reference to a constant, which is the speed of light in vacuum. It is
desirable that the tester knows the correct value of NVP for each cable type.
Working with the correct value of NVP allows the tester to report the distance
to a cabling defect more precisely
1
12
Figure 9: The HDTDX trace
depicts the amount of crosstalk
that is generated at each
location along the link. The
horizontal axis is labeled in
meters or feet (not MHz!). The
Main unit is always located at
the left of the screen and the
distances are measured from
the Main unit. The spike at
49.1 meters from the Main unit
shows the location with an
exceptionally high amount of
crosstalk.
NETWORKSUPERVISION
wire-pair combinations. First, note that the horizontal axis
runs from 0.6 m to 67.6 m or shows the length of the cabling
link-under-test. The link starts at 0 m and runs through 67
m. The very ends (0.6 m) of the trace show the permanent
link adapters, which do not belong to the tested permanent
link. This is the same link we discussed earlier and that is
depicted in figure 6.
The curves show the magnitude of the NEXT coupling at each
point along the link. When you inspect the curves from left
to right, it is immediately clear that the NEXT coupling is
relatively low until we arrive at 49.1 m. A huge spike in the
NEXT curves indicates that the coupling at this point is
excessive and the probable cause of the link NEXT test failure.
The cursor is automatically positioned at this spike and the
tester reports the distance at which the cursor is located.
The tester’s screen also displays the magnitude of the NEXT
coupling measured at the point where the cursor is placed.
The value is -291.4 and is “off the chart” indicating that a
huge amount of crosstalk takes place at this location.
Figure 10: In order to get a
better assessment of the profile
of crosstalk, we have selected
to zoom in on the vertical axis
with a factor of two. The scale
now runs from +50 to -50.
Use the “Zoom controls” to analyze the details
The tester initially displays the full length of the link with
the vertical scale showing the reflection magnitude from
+100% to -100%. The operator can adjust the scales of both
axes to “zoom in” on a problem area. Press the soft key F2,
labeled “Change to Zoom”, to control the zoom features.
Figure 10 shows the same data as Figure 9 but with a zoom
or magnification of the vertical scale of a factor 2. Now the
vertical scale runs from +50 % to -50 %. And as figure 10
demonstrates, in this view the NEXT profile curve is magnified
by a factor of 2. It facilitates a more detailed inspection of
the NEXT profile. The symbol cursor or zoom appears in the
blue band below the display, above the soft key labels, to
indicate the mode of operation of the cursor keys. They
either increase the zoom along the vertical or horizontal
scales or allow you to move the cursor position left or right
along the link.
The screen in figure 10 remains very busy because it shows
the NEXT profile for all wire pair combinations. For further
analysis, you may elect to show the data for each pair
combination; press F3, labeled ‘Plot by Pair’ to view each pair
combination. Figure 11 shows the NEXT profile for the 1,2 –
4,5 pair combination while at the same time we have zoomed
in on the horizontal axis around the main reflection located
at 48.7 m. Note that this location is physically the same one
as shown in figures 9 and 10 at 49.1 m. The conversion from
time to distance varies a little from pair-to-pair, because the
Figure 11: To further examine
the HDTDX trace and determine
what is happening between different wire pairs, we view the
traces by wire pair combination. This screen shows the
crosstalk along the link for
the combination of the 1,2
and 4,5 wire pairs. Two spikes
are clearly visible, the biggest
one at 48.7 m. The screen also
shows the value of the reflection from this location as 253.3
– a value that is clearly off the
charts.
13
electrical signals travel at a slightly different speed on each
wire pair. Each wire pair in the cable is twisted at a
different twist rate to improve the NEXT performance of the
cable. However, this difference in twist rate changes both
the length of the copper conductor as well as the speed of
the signal. The tester reports what is called the electrical
length or distance which deviates somewhat form the
physically length you would obtain with a tape measure
along the link.
We can further analyze what is happening along the cable at
the first huge NEXT spike at 48.7 m. In the cursor mode of
operation, press the ‘Set Mark” key (F1) with the cursor in
position at 48.7 m and move the cursor to the right and
align it with the second big spike. The result shown in
figure 12 tells us that this second spike is located at
50.8 m and that the distance between the marker and
cursor is 2.1 m.
The two bigger spikes we have identified here show the
location of the connectors at either end of the 2-meter
patch cord in the link (see figure 6). No other significant
spikes are shown in the graph of figure 11. Thereby we can
conclude that the 2m patch cord is the source of the
problem. This conclusion, of course, coincides with the
conclusion we had reached using the automatic diagnostics
generated by the tester. In some case, this more detailed
HDTDX analysis can greatly assist in a determination
between a faulty cable versus faulty connections or poor
wire termination. If significant levels of NEXT are shown in
a portion of the cable, removed form any connections,
defects are disclosed in the cable and the remedy may be
much more complicated since the cable itself may have to
be replaced.
Figure 12: The traces can also
be examined around peaks of
interest. This screen shows
that we can set the marker
at the location identified in
figure 11 and then move the
cursor to the right. It places
the second peak at 50.8 m. By
comparing this information to
the link map shown in figure
6, you can see that the HDTDX
trace identified the two connectors of the patch cord and
the one with the untwisted
wire pairs causes a huge
amount of crosstalk.
Investigate HDTDR
If the link fails return loss, the HDTDR parameter provides
the detailed profile of signal reflections along the length of
the link. At each location along the link, the HDTDR graph
shows the magnitude of reflections. The total energy of
reflections results in the Return Loss measurement.
Figure 13 shows the full-scale HDTDR plot for the channel
we have been analyzing in this booklet. Without zooming
in, the HDTDR trace shows few reflections except at the
initial location of the cursor at 47.7 m where the measured
reflection is -17.3%. The values for HDTDR will generally be
smaller but the link test results are much more sensitive to
small reflection values. To show a more detailed analysis, we
14
Figure 13: The HDTDR trace
shows the signal reflection on
each wire pair. Locations showing an excessive amount of
reflected energy are the cause
of return loss failures. The
HDTDR traces typically show
fewer and smaller reflections
than the HDTDX traces.
NETWORKSUPERVISION
have increased the zoom for the vertical axis of the same
trace to 8X in figure 14. Figure 15 shows the HDTDR trace for
wire pair 4,5. We have moved the cursor to the left to show
the sharp peak more clearly in the trace at the location of
the untwisted wire pairs. This picture clearly shows how the
HDTRDR trace allows us to identify a location with a
significant return loss problem.
Upon closer inspection of figure 14 we can also determine
that the shorter 15 m link segment (L2 in figure 6) to the
right of the defective patch cord shows significantly more
return loss for several wire pairs than the higher quality
cabling segment to the left (L1).
Figure 14: This figure shows
the exact same data as in
figure 13 but we have increased
the sensitivity of the vertical
scale by enlarging the vertical
axis with a factor of 8. More
reflections are now visible but
the major one remains at the
distance of 47.7 m.
Figure 15: This figure shows
the reflection for pair 4,5 only.
To show the spike in the reflections more clearly, we moved
the cursor a bit to the left.
The more significant points of
reflection toward the ends show
the location of the connectors.
The cable segment L2 on the
right shows significant reflections in the cable itself.
15
Figure 16: Consult the Fluke Networks web page for product information as well as updates in standards
or white papers on best practices. Go to www.flukenetworks.com/design
Conclusion
Cabling installation is a multi-step process. It is a prudent practice to certify the cabling
system after installation to ensure that all installed links meet their expected level of
performance. Certification will likely identify some failing or marginally passing results.
In order to deliver a high quality cabling system, the defects that cause the failures and
marginal passes must be uncovered and corrected.
The Fluke Networks certification tools have always provided unique and powerful
diagnostics assistance to installation technicians. By knowing the nature of typical
faults, and how the tester’s diagnostics report them, you can significantly reduce the
time to correct an anomaly, an installation error or a defective component. Personnel
responsible for the networks operation can also benefit from the diagnostic capabilities
of a certification test tool; with the tester’s assistance they can limit the duration of
network downtime and restore service quickly.
Familiarize yourself with the capabilities of your test tool. A modest investment that pays
for itself many times over. For the latest information on cable testing standards, news, and
issues, visit the Fluke Networks web site.
16
Partner with Fluke Networks
Fluke Networks provides the most comprehensive line of premises network test
solutions for the inspection, verification, certification and documentation of
high-speed copper and fiber cabling systems.
Advanced certification for premium network testing
DTX Series CableAnalyzer™ has
been the preferred tester by cable
installers and network owners worldwide. They deliver laboratory accuracy
and productivity.
The DTX-1200 and DTX-1800 are the
first “platform” cable test tools that
combine in one unit: twisted pair
cabling certification, coaxial cable
testing, fiber loss/length testing
(OLTS), and Fiber Extended (OTDR)
certification. Cabling certification
includes documentation and the
LinkWare cable test management software is widely recognized. LinkWare
supports a number of Fluke Networks
test tools including older generations
of test tools.
Figure 17: LinkWare allows you to manage the test results data. If you store the graphical data in the tester,
you can upload this data into LinkWare. This allows the
user to access the information with a few mouse clicks
any time in the future. HDTDX and HDTDR data are part
of the data stored in LinkWare if they have been generated as a result of the link failing. This information can
be useful if the technicians in the field need assistance
with the analysis of the cabling defects.
Fluke Networks plays a leading role
and regularly contributes original research in the development of cabling standards in
TIA and ISO/IEC committees. All major manufacturers of cable and connecting hardware endorse the Fluke Networks DTX Series CableAnalyzer testers and the LinkWare
documentation.
17
N E T W O R K S U P E R V I S I O N
Fluke Networks
P.O. Box 777, Everett, WA USA 98206-0777
Fluke Networks operates in more than 50 countries
worldwide. To find your local office contact details,
go to www.flukenetworks.com/contact.
©2008 Fluke Corporation. All rights reserved.
Printed in U.S.A. 11/2008 3403692 BR-ENG-N Rev A