1
Offboard Diagnostic Information
System Service User Manual
Confidential. All rights reserved. Circulation or duplication without prior written consent of the responsible department of Volkswagen AG is prohibited. Contractual partners receive this document via the responsible procurement department only. VOLKSWAGEN AG Copyright © 2007 VOLKSWAGEN AG Version 4.9.29
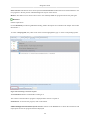
Table of Contents
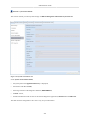
1. Introduction ............................................................................................................................ 12
1.1. Notes on the manual ...................................................................................................... 12
1.2. Structure of the manual .................................................................................................. 13
2. System requirements ............................................................................................................... 15
3. Installation ............................................................................................................................ 16
4. Update ................................................................................................................................... 33
5. Application start/user interface ................................................................................................... 38
5.1. Operation ..................................................................................................................... 47
5.1.1. Touchscreen ..................................................................................................... 47
5.1.2. Mouse and keyboard ........................................................................................... 47
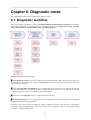
6. Diagnostic mode ...................................................................................................................... 48
6.1. Diagnostic workflow ...................................................................................................... 48
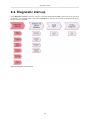
6.2. Diagnostic start-up ........................................................................................................ 49
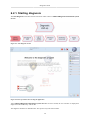
6.2.1. Starting diagnosis .............................................................................................. 50
6.2.2. Basic characteristics dialogue (GMD) ..................................................................... 56
6.2.3. Login to Group systems ....................................................................................... 60
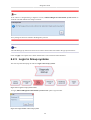
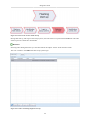
6.2.4. Selecting an order ............................................................................................... 61
6.2.5. Control unit identification .................................................................................... 68
6.2.5.1. Control unit list ....................................................................................... 71
6.2.5.2. Block diagram ......................................................................................... 73
6.2.5.3. Event memory ......................................................................................... 79
6.2.6. Starting guided fault finding (GFF) ........................................................................ 83
6.3. Test plan and special functions ........................................................................................ 84
6.3.1. Start modules, traversion tests, test plan calculation ................................................... 85
6.3.2. DISS / TPI ........................................................................................................ 86
6.3.2.1. Coding wizard ......................................................................................... 94
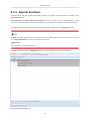
6.3.3. Special functions ................................................................................................ 95
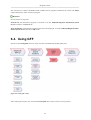
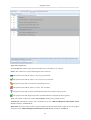
6.4. Using GFF ................................................................................................................... 96
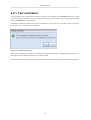
6.4.1. Test verification ................................................................................................ 107
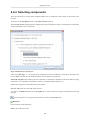
6.4.2. Selecting components ....................................................................................... 108
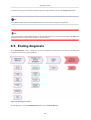
6.5. Ending diagnosis ......................................................................................................... 109
6.6. Self-diagnosis ............................................................................................................. 115
6.6.1. Self-diagnosis in general .................................................................................... 115
6.6.2. Control unit-specific functions ............................................................................ 121
6.6.2.1. Adaptation ........................................................................................... 121
6.6.2.1.1. Control units with KWP protocol ................................................... 122
6.6.2.1.2. Control units with UDS protocol .................................................... 124
6.6.2.2. Coding ................................................................................................ 126
6.6.2.2.1. Coding on KWP control units ........................................................ 127
6.6.2.2.2. Coding on UDS control units ........................................................ 129
6.6.2.3. Event memory ...................................................................................... 134
6.6.2.4. Default setting ...................................................................................... 138
6.6.2.4.1. Default setting on KWP control units .............................................. 138
6.6.2.4.2. Default setting on UDS control units ............................................... 140
6.6.2.5. Identification ........................................................................................ 146
6.6.2.6. Measured values .................................................................................... 147
6.6.2.6.1. Measured values with KWP control units .......................................... 147
6.6.2.7. Actuator diagnosis ................................................................................. 150
6.6.2.7.1. Actuator diagnosis on KWP control units ......................................... 150
6.6.2.7.2. Actuator diagnosis on UDS control units ......................................... 152
6.6.2.8. Access authorisation ............................................................................... 159
6.6.2.8.1. Control units with KWP 1281 protocol ............................................ 159
6.6.2.8.2. Control units with KWP 2000 or UDS protocol ................................. 159
6.6.3. Vehicle-specific functions .................................................................................. 161
6.6.3.1. Event memories for overall system ........................................................... 161
Offboard Diagnostic Information System Service User Manual
6.6.3.2. Transport mode .....................................................................................
6.6.3.3. Installation list ......................................................................................
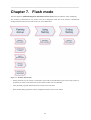
7. Flash mode ...........................................................................................................................
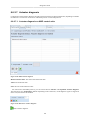
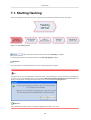
7.1. Starting flashing ..........................................................................................................
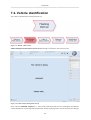
7.2. Vehicle identification ...................................................................................................
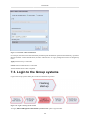
7.3. Login to the Group systems ..........................................................................................
7.4. Selecting orders ...........................................................................................................
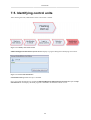
7.5. Identifying control units ................................................................................................
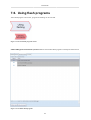
7.6. Using flash programs ...................................................................................................
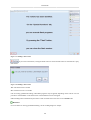
7.7. Ending a flash session ..................................................................................................
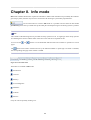
8. Info mode .............................................................................................................................
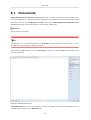
8.1. Documents .................................................................................................................
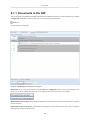
8.1.1. Documents in the GFF .......................................................................................
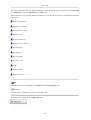
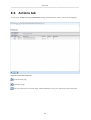
8.2. Actions tab .................................................................................................................
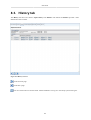
8.3. History tab .................................................................................................................
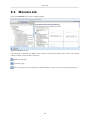
8.4. Manuals tab ................................................................................................................
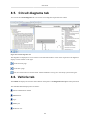
8.5. Circuit diagrams tab .....................................................................................................
8.6. Vehicle tab .................................................................................................................
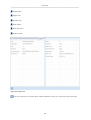
8.7. PR no. tab ..................................................................................................................
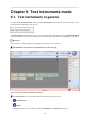
9. Test instruments mode ...........................................................................................................
9.1. Test instruments in general ............................................................................................
9.2. The Multimeter client area ............................................................................................
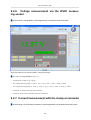
9.2.1. Voltage measurement with the URDI measuring lead ...............................................
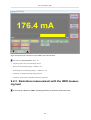
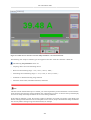
9.2.2. Current measurement with the URDI measuring lead ...............................................
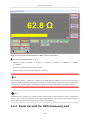
9.2.3. Resistance measurement with the URDI measuring lead ...........................................
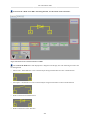
9.2.4. Diode test with the URDI measuring lead ..............................................................
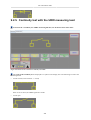
9.2.5. Continuity test with the URDI measuring lead ........................................................
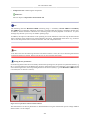
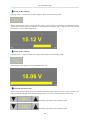
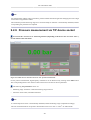
9.2.6. Voltage measurement via the DSO1 measuring socket .............................................
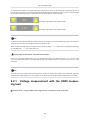
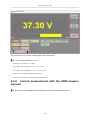
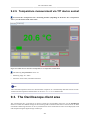
9.2.7. Current measurement with the clamp-on ammeter ...................................................
9.2.8. Pressure measurement via T/P device socket ..........................................................
9.2.9. Temperature measurement via T/P device socket .....................................................
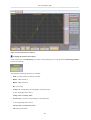
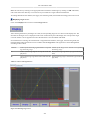
9.3. The Oscilloscope client area ..........................................................................................
9.3.1. Image position and time base ..............................................................................
9.3.2. Channel parametrisation .....................................................................................
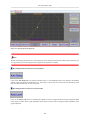
9.3.3. Setting the measuring mode ................................................................................
9.3.4. Long-term measurement in draw mode .................................................................
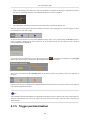
9.3.5. Trigger parametrisation ......................................................................................
9.3.6. Bandwidth limit ................................................................................................
9.3.7. Target curve function .........................................................................................
9.3.8. Freeze frame ....................................................................................................
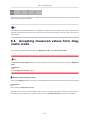
9.4. Accepting measured values from diagnostic mode .............................................................
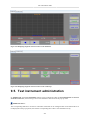
9.5. Test instrument administration .......................................................................................
10. Virtual keyboard manual ......................................................................................................
10.1. Installation ................................................................................................................
10.2. Software ...................................................................................................................
10.2.1. User interface .................................................................................................
10.2.1.1. Size of keyboard ...................................................................................
10.2.1.2. Special keys .........................................................................................
10.2.1.3. Settings dialogue ...................................................................................
10.2.2. Languages ......................................................................................................
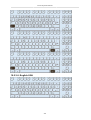
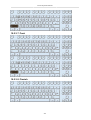
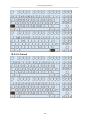
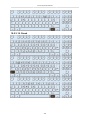
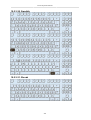
10.2.3. Keyboard layouts ............................................................................................
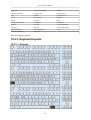
10.2.3.1. German ...............................................................................................
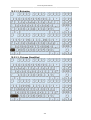
10.2.3.2. Bulgarian .............................................................................................
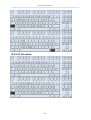
10.2.3.3. Chinese Simplified ................................................................................
10.2.3.4. Danish ................................................................................................
10.2.3.5. English GB ..........................................................................................
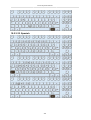
10.2.3.6. English USA ........................................................................................
10.2.3.7. Farsi ...................................................................................................
163
165
167
168
170
172
174
176
177
178
180
181
188
190
191
192
193
193
195
196
196
197
203
204
205
206
208
209
209
211
212
212
215
216
219
222
226
230
230
234
235
237
240
240
240
240
241
242
242
242
243
243
244
244
245
245
246
247
Offboard Diagnostic Information System Service User Manual
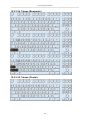
10.2.3.8. Finnish ................................................................................................
10.2.3.9. French ................................................................................................
10.2.3.10. Greek ................................................................................................
10.2.3.11. Italian ................................................................................................
10.2.3.12. Japanese ............................................................................................
10.2.3.12.1. Direct input .............................................................................
10.2.3.12.2. Hiragana .................................................................................
10.2.3.12.3. Katakana .................................................................................
10.2.3.13. Korean ..............................................................................................
10.2.3.13.1. English ...................................................................................
10.2.3.13.2. Hangul ....................................................................................
10.2.3.14. Croatian .............................................................................................
10.2.3.15. Dutch ................................................................................................
10.2.3.16. Polish ................................................................................................
10.2.3.17. Portuguese .........................................................................................
10.2.3.18. Rumanian ..........................................................................................
10.2.3.19. Russian ..............................................................................................
10.2.3.20. Swedish .............................................................................................
10.2.3.21. Slovak ...............................................................................................
10.2.3.22. Slovenian ...........................................................................................
10.2.3.23. Spanish ..............................................................................................
10.2.3.24. Taiwan (Bopomofo) .............................................................................
10.2.3.25. Taiwan (ChaJei) ..................................................................................
10.2.3.26. Thai ..................................................................................................
10.2.3.27. Czech ................................................................................................
10.2.3.28. Turkish ..............................................................................................
10.2.3.29. Hungarian ..........................................................................................
11. Administration mode .............................................................................................................
11.1. Operation .................................................................................................................
11.2. General area .............................................................................................................
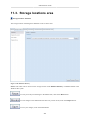
11.3. Storage locations area .................................................................................................
11.4. Support area ............................................................................................................
11.5. Connections area ......................................................................................................
11.6. Verification area ........................................................................................................
12. Additional program functions .................................................................................................
12.1. Data ........................................................................................................................
12.1.1. Current view ..................................................................................................
12.1.2. Diagnostic protocol ..........................................................................................
12.1.3. Diagnostic session ...........................................................................................
12.1.3.1. Repair interruption ................................................................................
12.1.3.2. Continuing a repair ...............................................................................
12.1.4. Hotfix ...........................................................................................................
12.2. Extras ......................................................................................................................
12.2.1. Search ...........................................................................................................
12.2.2. VCI ..............................................................................................................
12.2.3. Test drive ......................................................................................................
12.3. Help ........................................................................................................................
12.3.1. Online help ....................................................................................................
12.3.2. Support ..........................................................................................................
12.4. Info .........................................................................................................................
13. External verification ............................................................................................................
14. Error messages ....................................................................................................................
14.1. Error IDs .................................................................................................................
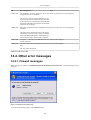
14.2. Other error messages ..................................................................................................
14.2.1. Firewall messages ..........................................................................................
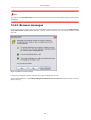
14.2.2. Browser messages ...........................................................................................
15. Index ..................................................................................................................................
Glossary ...................................................................................................................................
247
248
249
250
251
251
251
252
252
252
253
253
254
255
256
256
257
258
258
259
260
261
261
262
263
263
264
266
266
269
282
288
293
301
303
303
304
304
306
306
308
310
311
311
314
318
321
322
325
330
334
335
336
348
348
349
350
356
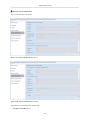
List of Figures
1.1. Example of a diagnostic workflow ...........................................................................................
1.2. Example of part of a workflow with individual steps ...................................................................
1.3. Example of an active link in the table of contents .......................................................................
3.1. Starting the installation ..........................................................................................................
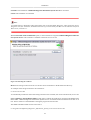
3.2. Language selection for installation ...........................................................................................
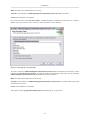
3.3. The Offboard Diagnostic Information System Service Setup wizard ................................................
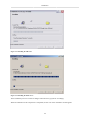
3.4. Target folder for installation ...................................................................................................
3.5. Target directory for diagnostic components ................................................................................
3.6. Platform selection .................................................................................................................
3.7. Selection of the application languages .......................................................................................
3.8. Selecting the diagnostic interface .............................................................................................
3.9. Message for Bluetooth interface ...............................................................................................
3.10. Selecting the certificate ........................................................................................................
3.11. Selecting the start menu folder ...............................................................................................
3.12. Displaying the copying process ..............................................................................................
3.13. Installing the PDU API ........................................................................................................
3.14. Installing the MCD server .....................................................................................................
3.15. Installation completed ..........................................................................................................
3.16. Starting the PostSetup ..........................................................................................................
3.17. Display of the PostSetup data ................................................................................................
3.18. Installation of the PostSetup data ...........................................................................................
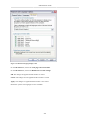
3.19. Internet options for Internet Explorer 6 ....................................................................................
4.1. Data update via network .........................................................................................................
4.2. Connecting to update site .......................................................................................................
4.3. Displaying available updates ...................................................................................................
4.4. No updates available ..............................................................................................................
4.5. Displaying the progress of a data update ...................................................................................
4.6. Message relating to an update when the preconfigured time has passed ...........................................
4.7. Message relating to an update when data is available ...................................................................
4.8. Update message after exiting Offboard Diagnostic Information System Service .................................
5.1. Starting Offboard Diagnostic Information System Service .............................................................
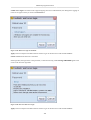
5.2. Window with warnings/notes (part 1) .......................................................................................
5.3. Window with warnings/notes (part 2) .......................................................................................
5.4. The Offboard Diagnostic Information System Service user interface ...............................................
5.5. The information area .............................................................................................................
5.6. Modes menu ........................................................................................................................
5.7. Standard functions menus .......................................................................................................
5.8. Data submenu .......................................................................................................................
5.9. Extras submenu ....................................................................................................................
5.10. Help submenu .....................................................................................................................
5.11. Info submenu ......................................................................................................................
5.12. Status area example, test plan calculation .................................................................................
6.1. Diagnostic start-up workflow ..................................................................................................
6.2. Diagnostic start-up section ......................................................................................................
6.3. Start diagnosis section ............................................................................................................
6.4. Start-up window after starting the application .............................................................................
6.5. Bluetooth connection not permitted ..........................................................................................
6.6. Start window for diagnostic start-up .........................................................................................
6.7. No vehicle connected .............................................................................................................
6.8. No vehicle connected .............................................................................................................
6.9. Vehicle identification not possible ............................................................................................
6.10. Ignition is switched off .........................................................................................................
6.11. Ignition status cannot be identified .........................................................................................
6.12. Status area example, determining the VIN ...............................................................................
6.13. GMD execution section ........................................................................................................
12
13
13
17
17
17
18
19
20
21
21
22
23
24
25
26
26
27
28
29
30
31
33
34
34
35
35
36
36
37
38
38
39
40
40
42
43
44
44
45
45
45
48
49
50
50
51
52
53
54
54
54
55
56
56
Offboard Diagnostic Information System Service User Manual
6.14. Dialogue for selecting the basic vehicle characteristics ............................................................... 56
6.15. Query for guided fault finding ............................................................................................... 57
6.16. Error during automatic identification ....................................................................................... 58
6.17. Entering the VIN manually ................................................................................................... 58
6.18. Login to Group systems section ............................................................................................. 60
6.19. Login window to the Group systems ....................................................................................... 60
6.20. Select order section - Diagnostic start-up ................................................................................. 61
6.21. Select order section - Flash start-up ........................................................................................ 62
6.22. Order view during diagnostic start-up ...................................................................................... 62
6.23. Login to Group systems not possible ...................................................................................... 63
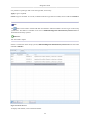
6.24. Order list view .................................................................................................................... 64
6.25. Order detail view ................................................................................................................ 65
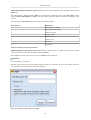
6.26. Entering the order number .................................................................................................... 66
6.27. Selecting "Work without order" ............................................................................................. 67
6.28. Identify control units section ................................................................................................. 68
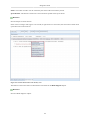
6.29. "Check installation list" dialogue ............................................................................................ 68
6.30. Editing the coding status ....................................................................................................... 69
6.31. "Control units not identified" dialogue .................................................................................... 70
6.32. View of the control unit list .................................................................................................. 71
6.33. Information on a control unit ................................................................................................. 72
6.34. Sorting the control unit list ................................................................................................... 72
6.35. View of the block diagram .................................................................................................... 73
6.36. Examples of the graphical display of the control units ................................................................ 75
6.37. Buttons for the individual control units .................................................................................... 75
6.38. Context menu (control unit buttons) ........................................................................................ 76
6.39. Entering a control unit as installed .......................................................................................... 76
6.40. Control units entered manually "as installed" displayed in italics .................................................. 77
6.41. "Select variant" dialogue ....................................................................................................... 77
6.42. Selecting a guided function for a control unit ........................................................................... 78
6.43. View of the event memory entries .......................................................................................... 79
6.44. Opening an event memory entry ............................................................................................ 80
6.45. Information on an event memory entry .................................................................................... 80
6.46. Sorting the event memory list ................................................................................................ 81
6.47. Context menu in the event memory view ................................................................................. 82
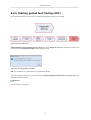
6.48. Start GFF section ................................................................................................................ 83
6.49. Starting guided fault finding .................................................................................................. 83
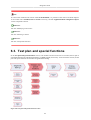
6.50. Test plan and special functions section .................................................................................... 84
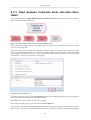
6.51. Start modules, traversion tests, test plan calculation section ......................................................... 85
6.52. Variant selection view .......................................................................................................... 85
6.53. DISS/TPI section ................................................................................................................. 86
6.54. DISS tab view after diagnostic start-up .................................................................................... 87
6.55. Table with DISS complaints .................................................................................................. 87
6.56. Coding wizard dialogue box .................................................................................................. 88
6.57. Function buttons on the DISS tab ........................................................................................... 89
6.58. View of the TPI tab ............................................................................................................ 90
6.59. Displaying a selected TPI number .......................................................................................... 90
6.60. Entering TPI manually ......................................................................................................... 91
6.61. Transferring a diagnostic object to the test plan ........................................................................ 91
6.62. Deselected customer code ..................................................................................................... 92
6.63. Selecting the overall view ..................................................................................................... 93
6.64. Overall view of customer code .............................................................................................. 93
6.65. Coding wizard .................................................................................................................... 94
6.66. Special functions view .......................................................................................................... 95
6.67. Using GFF section ............................................................................................................... 96
6.68. Test plan view .................................................................................................................... 97
6.69. Activating a test in the test plan ............................................................................................. 98
6.70. Test view on the Process tab ................................................................................................. 99
6.71. Message and instruction window during the test ...................................................................... 100
Offboard Diagnostic Information System Service User Manual
6.72. Step sequence during the test ...............................................................................................
6.73. Buttons for selecting alternative test steps ..............................................................................
6.74. Displaying the selected test step ...........................................................................................
6.75. Decision buttons in the test program .....................................................................................
6.76. Function descriptions in the test program ...............................................................................
6.77. Local and global documents in the test program ......................................................................
6.78. Exiting the document view ..................................................................................................
6.79. Verification mode query ......................................................................................................
6.80. Window for selecting tests ..................................................................................................
6.81. End diagnosis section .........................................................................................................
6.82. Ending diagnosis ...............................................................................................................
6.83. Ending fault finding ...........................................................................................................
6.84. Erasing the event memory ...................................................................................................
6.85. Erasing the event memory ...................................................................................................
6.86. Executing the program for the readiness code .........................................................................
6.87. Send diagnostic protocol? ....................................................................................................
6.88. Print diagnostic protocol? ....................................................................................................
6.89. Support request .................................................................................................................
6.90. Block diagram without control units read out ..........................................................................
6.91. Manual identification of control units ....................................................................................
6.92. Entering a control unit as installed that has not been identified ...................................................
6.93. Starting self-diagnosis .........................................................................................................
6.94. Selection window for control unit self-diagnosis ......................................................................
6.95. Selection window for vehicle self-diagnosis ............................................................................
6.96. Self-diagnosis: Example of a tab name ..................................................................................
6.97. Warning if adaptation is not supported ..................................................................................
6.98. Adaptation KWP ...............................................................................................................
6.99. Adaptation information area .................................................................................................
6.100. Error message in the event of an invalid adaptation value ........................................................
6.101. Adaptation UDS ..............................................................................................................
6.102. Warning on closing the parameter list ..................................................................................
6.103. Confirmation prompt before performing the adaptation ............................................................
6.104. Error message in the event of an invalid adaptation value ........................................................
6.105. Short code ......................................................................................................................
6.106. Confirmation prompt before coding .....................................................................................
6.107. Success message after coding .............................................................................................
6.108. Request to reset the ignition ...............................................................................................
6.109. New and old code ............................................................................................................
6.110. Error message during coding due to missing data ...................................................................
6.111. Binary code .....................................................................................................................
6.112. User input for binary code .................................................................................................
6.113. Confirmation prompt before binary coding ............................................................................
6.114. Note on missing checksum during binary coding ....................................................................
6.115. Note on incorrect checksum during binary coding ..................................................................
6.116. Success message after coding .............................................................................................
6.117. Request to reset the ignition ...............................................................................................
6.118. Warning when switching to plain text code ...........................................................................
6.119. UDS plain text code .........................................................................................................
6.120. KWP event memory .........................................................................................................
6.121. Sorting the event memory entries ........................................................................................
6.122. UDS event memory ..........................................................................................................
6.123. KWP default setting .........................................................................................................
6.124. UDS default setting - Selection of the default settings .............................................................
6.125. UDS default setting - Parametrisation ..................................................................................
6.126. UDS default setting - Measured value selection .....................................................................
6.127. Selecting the default setting ...............................................................................................
6.128. UDS default setting - Configuration ...................................................................................
6.129. Results window of self-diagnosis identification ......................................................................
101
102
102
103
104
105
106
107
108
109
110
110
111
111
112
113
113
114
116
116
117
118
118
119
120
121
122
123
123
124
125
125
126
127
127
128
128
128
128
129
130
131
131
132
132
132
133
133
135
136
137
138
140
141
142
143
144
146
Offboard Diagnostic Information System Service User Manual
6.130. Measured value selection (KWP) ........................................................................................
6.131. KWP measured value display .............................................................................................
6.132. KWP actuator diagnosis ....................................................................................................
6.133. Buttons for actuator diagnosis ............................................................................................
6.134. Actuator diagnosis status ...................................................................................................
6.135. UDS actuator selection ......................................................................................................
6.136. UDS actuator parametrisation .............................................................................................
6.137. UDS actuator diagnosis - Parametrisation problems ................................................................
6.138. UDS measured value selection ...........................................................................................
6.139. Selecting the actuator ........................................................................................................
6.140. UDS actuator diagnosis .....................................................................................................
6.141. Example of the actuator test on several actuators ...................................................................
6.142. Access authorisation .........................................................................................................
6.143. Access authorisation - Authentication ..................................................................................
6.144. Access authorisation - Successful ........................................................................................
6.145. Access authorisation - Unsuccessful ....................................................................................
6.146. Event memories for overall system ......................................................................................
6.147. Selecting the method for erasing the event memory ................................................................
6.148. Warning before erasing the event memory ............................................................................
6.149. Transport mode ................................................................................................................
6.150. Success message after changing transport mode .....................................................................
6.151. Transport mode ................................................................................................................
6.152. Installation list .................................................................................................................
6.153. View in the event of faulty communication with a control unit ..................................................
7.1. Workflow in flash mode .......................................................................................................
7.2. Start flashing section ............................................................................................................
7.3. Start window for flash start-up ...............................................................................................
7.4. Identify vehicle section .........................................................................................................
7.5. Vehicle analysis during flash start-up ......................................................................................
7.6. Manual vehicle identification .................................................................................................
7.7. Automatic vehicle identification .............................................................................................
7.8. Login to Group systems section .............................................................................................
7.9. Login window to the Group systems .......................................................................................
7.10. Select order section ............................................................................................................
7.11. Selecting an order for flashing .............................................................................................
7.12. Identify control units section ................................................................................................
7.13. Control unit identification ...................................................................................................
7.14. Execute flash programs section ............................................................................................
7.15. Available flash programs .....................................................................................................
7.16. End flashing section ...........................................................................................................
7.17. Ending a flash session ........................................................................................................
7.18. Ending a flash session ........................................................................................................
8.1. Tabs in Info mode ...............................................................................................................
8.2. Info mode start-up view .......................................................................................................
8.3. Selecting a document to be displayed ......................................................................................
8.4. View of a document ............................................................................................................
8.5. Example 1, document tree .....................................................................................................
8.6. Example 1, document view ...................................................................................................
8.7. Example 2, document tree .....................................................................................................
8.8. Example 2, document view ...................................................................................................
8.9. Document with hot spot .......................................................................................................
8.10. Open hot spot ...................................................................................................................
8.11. Displaying the documents for a test plan ................................................................................
8.12. View of the Actions tab ......................................................................................................
8.13. History tab view ................................................................................................................
8.14. Manuals tab view ..............................................................................................................
8.15. Circuit diagrams view .........................................................................................................
8.16. Vehicle view .....................................................................................................................
147
149
150
150
151
152
153
154
155
155
156
157
159
160
160
160
161
162
162
163
163
164
165
166
167
168
169
170
170
171
172
172
173
174
174
176
176
177
177
178
179
179
180
181
182
183
184
185
185
186
186
187
188
190
191
192
193
194
Offboard Diagnostic Information System Service User Manual
8.17. PR no. view ......................................................................................................................
9.1. Test instruments user interface - Multimeter .............................................................................
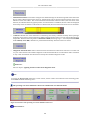
9.2. Structure of the Multimeter client area ....................................................................................
9.3. Structure of the operating area of the multimeter client area ........................................................
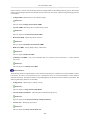
9.4. Test parameter buttons in function block 1 ...............................................................................
9.5. Client area for activated "Voltage URDI" voltage measurement ....................................................
9.6. Client area for activated "Current URDI" current measurement ....................................................
9.7. Client area for activated "Resistance URDI" resistance measurement .............................................
9.8. Client area for activated "Diode test URDI" .............................................................................
9.9. Client area for activated "Continuity test URDI" .......................................................................
9.10. Client area for activated "DSO1" voltage measurement .............................................................
9.11. Client area for activated "Current clamp-on ammeter" current measurement ..................................
9.12. Client area for activated "Pressure T/P" pressure measurement ...................................................
9.13. Client area for activated "Temperature T/P" temperature measurement .........................................
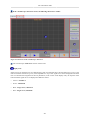
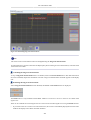
9.14. Structure of the "Oscilloscope" client area ..............................................................................
9.15. "Oscilloscope" display area ..................................................................................................
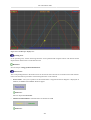
9.16. Parametrisation of channel A ...............................................................................................
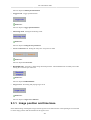
9.17. Setting the measuring mode .................................................................................................
9.18. Parametrisation of long-term measurements ............................................................................
9.19. Evaluating long-term measurements ......................................................................................
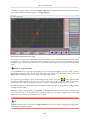
9.20. Parametrisation of the trigger ...............................................................................................
9.21. Client area of the target curves function .................................................................................
9.22. Recording target curves ......................................................................................................
9.23. Recording target curves of two channels ................................................................................
9.24. Showing target curves ........................................................................................................
9.25. Displaying diagnostic measured values on the multimeter ..........................................................
9.26. Displaying diagnostic measured values on the oscilloscope ........................................................
9.27. Activating expert mode in the target curves function ................................................................
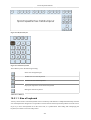
10.1. Title bar icon ....................................................................................................................
10.2. Keyboard layout ................................................................................................................
10.3. Numeric keyboard ..............................................................................................................
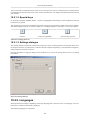
10.4. Settings dialogue ...............................................................................................................
11.1. Administration window .......................................................................................................
11.2. Selecting the design ...........................................................................................................
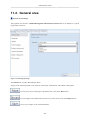
11.3. Language setting ................................................................................................................
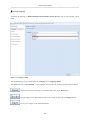
11.4. Additional Windows language support ...................................................................................
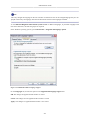
11.5. Windows language display codes ..........................................................................................
11.6. Update view .....................................................................................................................
11.7. System configuration view ..................................................................................................
11.8. System environment view ...................................................................................................
11.9. Licence information view, Part 1 ..........................................................................................
11.10. Licence information view, Part 2 ........................................................................................
11.11. Global configuration view .................................................................................................
11.12. View of GFF sequence details ............................................................................................
11.13. Details view for the virtual keyboard ...................................................................................
11.14. Database directory ............................................................................................................
11.15. Diagnostic session storage location ......................................................................................
11.16. Flash paths view ..............................................................................................................
11.17. Diagnostic protocol view ...................................................................................................
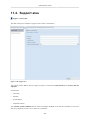
11.18. Support view ...................................................................................................................
11.19. Outgoing mail server view .................................................................................................
11.20. Error message for incorrect mail server ................................................................................
11.21. Error message for incorrect sender mail address .....................................................................
11.22. Brand settings view ..........................................................................................................
11.23. Group system: GFF view ...................................................................................................
11.24. ElsaPro Group system view ...............................................................................................
11.25. Carport Group system view ...............................................................................................
11.26. Group system DISS view ..................................................................................................
195
196
198
199
201
204
205
206
207
208
209
210
211
212
213
214
217
220
223
225
227
231
232
232
233
237
237
239
240
241
241
242
266
269
270
271
272
273
274
276
277
277
278
280
281
282
283
285
286
288
290
292
292
293
294
295
297
298
Offboard Diagnostic Information System Service User Manual
11.27. Group system eShop view .................................................................................................
11.28. Mirror server 2 view .........................................................................................................
11.29. External verification view ..................................................................................................
12.1. Data button .......................................................................................................................
12.2. Selecting the diagnostic protocol ..........................................................................................
12.3. Query if a diagnostic session is cancelled ...............................................................................
12.4. Saving a diagnostic session .................................................................................................
12.5. Feedback after saving a diagnostic session .............................................................................
12.6. Loading a diagnostic session file ..........................................................................................
12.7. Error while loading a diagnostic session ................................................................................
12.8. Login while loading a diagnostic session ................................................................................
12.9. Contents of the Extras menu ................................................................................................
12.10. Dialogue for the search function .........................................................................................
12.11. Displaying the search results ..............................................................................................
12.12. Example of a search result .................................................................................................
12.13. Changing the diagnostic hardware .......................................................................................
12.14. Removal of the diagnostic hardware ....................................................................................
12.15. Selection of the desired diagnostic hardware .........................................................................
12.16. Connecting the new diagnostic hardware ..............................................................................
12.17. Changing the diagnostic hardware .......................................................................................
12.18. Diagnostic hardware has been changed ................................................................................
12.19. Changing the diagnostic hardware failed ..............................................................................
12.20. Activating test drive mode .................................................................................................
12.21. Confirmation that test drive mode is active ...........................................................................
12.22. Ending test drive mode .....................................................................................................
12.23. Confirmation that test drive mode has been cancelled .............................................................
12.24. Confirmation that test drive mode has been ended ..................................................................
12.25. Help menu ......................................................................................................................
12.26. Context-related online help ................................................................................................
12.27. The online help window ....................................................................................................
12.28. Navigation in the online help .............................................................................................
12.29. Navigation bar of the online help ........................................................................................
12.30. The "Send support request" window ....................................................................................
12.31. Information on the feedback sender .....................................................................................
12.32. Feedback error classification ..............................................................................................
12.33. Feedback error priority ......................................................................................................
12.34. Attaching a diagnostic session ............................................................................................
12.35. Mail server login for feedback ............................................................................................
12.36. Incorrect mail server login .................................................................................................
12.37. Feedback message with offline connection ............................................................................
12.38. Window with warnings/notes (part 1) ..................................................................................
12.39. Window with warnings/notes (part 2) ..................................................................................
12.40. Window with warnings/notes (part 3) ..................................................................................
12.41. Info area .........................................................................................................................
14.1. Description of the error messages .........................................................................................
14.2. Windows firewall message ..................................................................................................
14.3. Browser security message ....................................................................................................
299
300
301
303
305
306
307
307
308
309
309
311
312
313
313
314
315
315
316
316
317
317
318
318
319
319
319
321
322
323
324
324
325
326
327
327
327
328
328
329
330
331
332
333
335
348
349
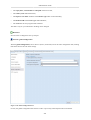
List of Tables
6.1. Meaning of the SCP status numbers ......................................................................................... 63
6.2. View names of control unit self-diagnosis ................................................................................ 119
6.3. View names of vehicle self-diagnosis ...................................................................................... 120
6.4. Table of keyboard shortcuts .................................................................................................. 158
7.1. Meaning of the SCP status numbers ........................................................................................ 175
9.1. Setting the timebase ............................................................................................................. 216
9.2. Maximum measuring time during long-term measurement ........................................................... 224
9.3. Colour of the signal curves ................................................................................................... 233
10.1. Installation parameters ........................................................................................................ 240
10.2. Installer return values ......................................................................................................... 240
10.3. I+ME keys ....................................................................................................................... 241
10.4. Changing characters ........................................................................................................... 242
10.5. Languages supported .......................................................................................................... 243
14.1. Table of error IDs .............................................................................................................. 336
Chapter 1. Introduction
1.1. Notes on the manual
This manual describes how to use the Offboard Diagnostic Information System Service program of the Volkswagen Group. The program is used in the field of workshop diagnosis. It allows vehicle control units to be identified and event memory entries to be read. It also supports vehicle repairs using guided fault finding. Functions
such as test instrument support, flashing control units and vehicle self-diagnosis extend the range of applications.
All important information and services of the Volkswagen group are available to you for your work via network
connection to the Group systems.
Offboard Diagnostic Information System Service is intended for all brands of the Volkswagen group.
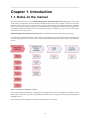
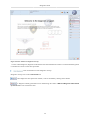
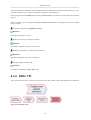
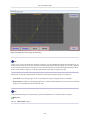
To illustrate the significant workflows, such as diagnosis and flashing, the corresponding chapters include a graphical view showing which part of the process is just being described, what the previous step was and what is to
do next.
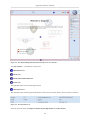
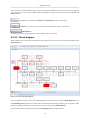
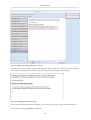
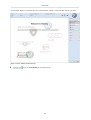
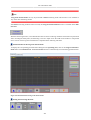
Figure 1.1. Example of a diagnostic workflow
The complete diagnostic workflow is displayed in the example shown above. The diagnostic workflow consists
of four parts, each consisting of the corresponding individual steps. In the figure, the currently described part is
highlighted in red.
The description of the individual parts with the individual steps is as follows:
12
Introduction
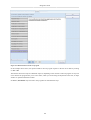
Figure 1.2. Example of part of a workflow with individual steps
In this example, the individual steps are displayed in their practical chronological order and the currently described
individual step is displayed in red.
Note:
Please read this manual carefully before you use Offboard Diagnostic Information System Service for the
first time. It is imperative that you observe the warnings and notes with regard to using Offboard Diagnostic
Information System Service and the vehicle during diagnostic and repair work.
Up-to-dateness of the figures: All figures are up-to-date even if they have an older version number.
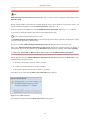
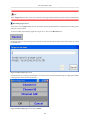
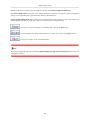
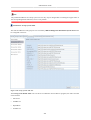
1.2. Structure of the manual
To ensure quick access to the information you require, we recommend that you use the table of contents in the
PDF document. If the manual is available in electronic form, click on the topic you require once in the table of
contents to go directly to that chapter.
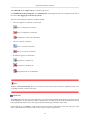
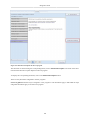
Figure 1.3. Example of an active link in the table of contents
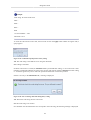
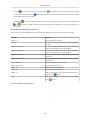
The blue push-pin is usually used as a bullet or as a means of structuring the procedure within the system.
Note:
The red pin, the addition Note: and the border (for black-and-white printouts) indicate particularly important
information that must always be observed.
Note:
Additional information and useful tips are available below this symbol.
13
Introduction
Fonts:
All system components such as menus, buttons and keys on the keyboard or touchscreen are displayed in bold.
This makes it easier to search within the manual and in Offboard Diagnostic Information System Service. File
names or paths are displayed in italics.
Example: "After clicking on the Start diagnosis button, the vehicle's basic characteristics must always be selected.
The Basic vehicle characteristics dialogue appears."
References:
References within this manual enable you to go straight to linked or related topics. They are also linked electronically.
Reference:
The chapter entitled "Name of the chapter" also contains additional information
14
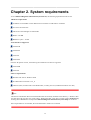
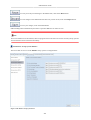
Chapter 2. System requirements
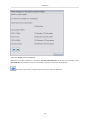
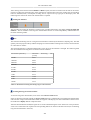
To use Offboard Diagnostic Information System Service, the following requirements must be met:
Hardware requirements
PCMCIA slot with EDIC card or Bluetooth via VAS5054 or USB cable to VAS5054
PT boxes and VAS 5055
CPU from 1Ghz and higher recommended
RAM > 512 MB
Hard drive space > 10 GB
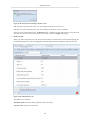
Tester hardware supported
VAS5051B
VAS5052A
VAS6150
VAS6150A
From the 4th quarter of 2011, the following tester hardware will also be supported:
VAS6150B
VAS6160
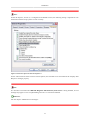
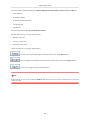
Software requirements
Windows XP / SP3 or Windows 2000
Java Runtime Environment 1.5.0_11
Libraries (DLL) for Microsoft Visual Studio 2005, vcredist_x86.exe (included in Windows XP / SP3)
Note:
The libraries installed for Microsoft Visual Studio 2005 are normally available in the directory c:\Windows\WinSxS and start with x86_Microsoft_VC80_CRT*. Without this data, a test device cannot create a hardware key
meaning that no licence can be acquired in Offboard Diagnostic Information System eShop for the device.
If the required data is not available, the local administrator needs to be consulted.
15
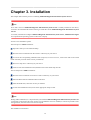
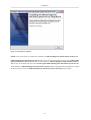
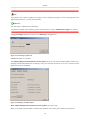
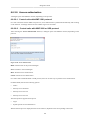
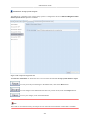
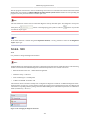
Chapter 3. Installation
This chapter deals with the process of installing Offboard Diagnostic Information System Service.
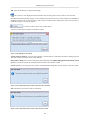
Note:
If an older version of Offboard Diagnostic Information System Service is already installed on the device,
it needs to be uninstalled first before starting to install the current Offboard Diagnostic Information System
Service.
To install, uninstall and configure Offboard Diagnostic Information System Service, administration rights
are required for the operating system on the tester or laptop.
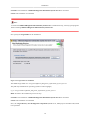
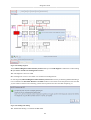
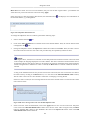
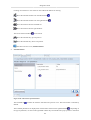
You have two installation options.
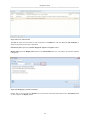
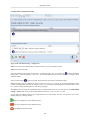
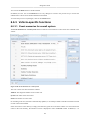
The first option is online installation:
Open the e-mail you received from eShop.
Save the licence certificate from the e-mail to a directory of your choice.
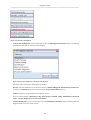
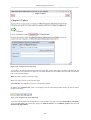
To access the corresponding installation file (setup.exe) on mirror server 2, click on the URL in the e-mail
(make sure that you click on the version you ordered).
Now save setup.exe to a directory of your choice.
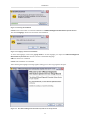
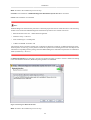
DVD To start the installation wizard, double-click on the stored setup.exe file.
The second option is offline installation:
Save the licence certificate received via e-mail to a directory of your choice.
Insert the DVD with the installation data in the drive.
After the DVD starts, select the version you ordered.
To start the installation wizard, click on the appropriate setup.exe file.
Note:
During offline installation, it is important that you install the Offboard Diagnostic Information System Service
version that corresponds to the order. If setup.exe of a different version is installed, it will not be possible to start
the application, since the licence will not correspond.
The installation wizard starts.
16
Installation
Figure 3.1. Starting the installation
Cancel:Click on this button to cancel the installation of Offboard Diagnostic Information System Service.
The desired language needs to be selected for the installation.
Figure 3.2. Language selection for installation
To select the language, click on the pop-up menu to set the language you require for Offboard Diagnostic
Information System Service. German is shown as the default language.
OK:The selection is confirmed.
Cancel: The installation is terminated.
After selecting the language a message appears asking you to close any programs still open.
Figure 3.3. The Offboard Diagnostic Information System Service Setup wizard
17
Installation
Continue: The installation of Offboard Diagnostic Information System Service is continued.
Cancel: The installation is terminated.
Note:
To ensure that Offboard Diagnostic Information System Service is installed correctly, close any open programs
before installing Offboard Diagnostic Information System Service.
Now specify the target folder for the installation.
Figure 3.4. Target folder for installation
The default target folder is C:\Programs\Offboard_Diagnostic_Information_System_Service
The path may be different for operating systems in other languages,
e.g. C:\Program Files\Offboard_Diagnostic_Information_System_Service
Back: Go back in the installation process one step.
Continue: The installation of Offboard Diagnostic Information System Service is continued.
Cancel: The installation is terminated.
Now, the target directory for the diagnostic components (MCD server, MCD projects and PDU API) needs
to be specified.
18
Installation
Figure 3.5. Target directory for diagnostic components
The default target directory is C:\ODIS-DIAG-MODULES
Back: Go back in the installation process one step.
Continue: The installation of Offboard Diagnostic Information System Service is continued.
Cancel: The installation is terminated.
Use the Target platform pop-up menu to select on which device Offboard Diagnostic Information System
Service is to be installed.
19
Installation
Figure 3.6. Platform selection
For diagnostic systems, select the type of diagnostic system here; for a PC or notebook, always select the option
Standard PC/Notebook.
Back: Go back in the installation process one step.
Continue: The installation of Offboard Diagnostic Information System Service is continued.
Cancel: The installation is terminated.
The Select application languages pop-up menu is used to select the application languages supported.
20
Installation
Figure 3.7. Selection of the application languages
Up to 5 languages can be selected.
Back: Go back in the installation process one step.
Continue: The installation of Offboard Diagnostic Information System Service is continued.
Cancel: The installation is terminated.
The Diagnostic interface pop-up menu is used to select the desired diagnostic interface.
Figure 3.8. Selecting the diagnostic interface
21
Installation
Back: Go back in the installation process one step.
Continue: The installation of Offboard Diagnostic Information System Service is continued.
Cancel: The installation is terminated.
Note:
Offboard Diagnostic Information System Service has been prepared for the use of PassThru boxes. The following
models can be used with Offboard Diagnostic Information System Service without restrictions:
•
Blue Streak Electronics Inc. - iflash Global Programmer
•
Dearborn Group - VSI-2534
•
Drew Technologies - CarDAQ-Plus
•
I+ME Actia GmbH - PassThru+ XS
The PassThru boxes listed have already been configured as diagnostic interfaces in Offboard Diagnostic Information System. For start-up, you only need to connect the respective box to the diagnostic tester via USB port and
install the corresponding software package from the Offboard Diagnostic Information System Service installation
folder (sub-directory: "drivers").
If a Bluetooth interface was selected, a message will appear informing you that to use the VAS5054 according
to the radio head documentation, Bluetooth pairing needs to be established.
Figure 3.9. Message for Bluetooth interface
Back: Go back in the installation process one step.
22
Installation
Continue: The installation of Offboard Diagnostic Information System Service is continued.
Cancel: The installation is terminated.
Note:
To install and use a diagnostic radio head, please refer to the document Diagnostic radio head VAS 5054A,
Diagnostic interface VAS 5055, Installation and start-up on VAS 5052A from Base CD 16 and VAS 6150 from
Base CD 15, Version 1.11.
With the Selection of the certificate file option, a valid certificate is assigned to Offboard Diagnostic Information System Service. The certificate is available in the form of a license.dat.
Figure 3.10. Selecting the certificate
Browse: The storage location of the license.dat file can be searched for in the Windows file directory.
An example of the storage location for the certificate is:
C:\Licences\license.dat
To automatically transfer the name of the storage location to the text field, click on the certificate file, license.dat.
Copy certificate to the installation folder: If this option is ticked, the certificate is copied into the default installation folder. Offboard Diagnostic Information System Service is installed without certificate file if there is no
tick. Then it needs to be installed before starting the program for the first time.
The default installation folder for the licence file is:
C:\Program Files\Offboard_Diagnostic_Information_System_Service\license\license.dat
23
Installation
Back: Go back in the installation process one step.
Continue: The installation of Offboard Diagnostic Information System Service is continued.
Cancel: The installation is terminated.
Now select the name of the start menu folder. "Offboard Diagnostic Information System Service" is used by
default. If you do not wish to create a directory in the start menu, tick the checkbox.
Figure 3.11. Selecting the start menu folder
To create a shortcut to Offboard Diagnostic Information System Service on the desktop for each user, tick the
checkbox: Create shortcuts for all users. To make the shortcut on the desktop visible only to the user installing
Offboard Diagnostic Information System Service, deselect the checkbox.
Back: Go back in the installation process one step.
Continue: The installation of Offboard Diagnostic Information System Service is continued. The copying and
installation process starts.
Cancel: The installation is terminated.
The progress of the copying and installation process is displayed via a progress bar.
24
Installation
Figure 3.12. Displaying the copying process
Cancel: The installation is terminated.
Note:
Depending on the capacity of the processor, the installation process may take several minutes.
The progress of the installation of the diagnostic components PDU API and MCD server is displayed individually
for each component.
25
Installation
Figure 3.13. Installing the PDU API
Figure 3.14. Installing the MCD server
These installation processes cannot be changed. The buttons are greyed out accordingly.
When the installation of all components is completed, the last view of the installation wizard appears.
26
Installation
Figure 3.15. Installation completed
Finish: Click on this button to complete the installation of Offboard Diagnostic Information System Service.
Offboard Diagnostic Information System Service can now be started by double-clicking on the Offboard Diagnostic Information System Service shortcut on the desktop. Offboard Diagnostic Information System Service can also be started via the start menu: Start\Programs\Offboard Diagnostic Information System Service.
The installation of Offboard Diagnostic Information System Service is completed when the application is started
for the first time. For this, the Offboard Diagnostic Information System PostSetup appears again.
27
Installation
Figure 3.16. Starting the PostSetup
The completion of the installation by the PostSetup works like a software update. It can be executed via the internet
using the preset URL of the importer's mirror server. The correct URL, the user name and password are required
for this. If the installation data for the PostSetup is available locally, e.g. on DVD, the installation can also be
completed without internet access.
URL: Mirror server address (depends on the importer). This field is always on a red background. This colour
indicates that the specified URL is correct.
Select local directory: Opens Windows Explorer, via which the directory with the PostSetup files is selected.
User name: User ID for access to the mirror server
Password: Password for access to the mirror server.
Cancel: PostSetup is cancelled.
PostSetup is continued.
28
Installation
Figure 3.17. Display of the PostSetup data
Before the actual data installation is started, the maximum download size of the data to be installed and the
download time for installation via internet according to the type of connection are displayed.
This button can be used to navigate backwards step-by-step in the PostSetup.
29
Installation
Figure 3.18. Installation of the PostSetup data
The diagnostic data and vehicle projects of the brands entered in the licence certificate and the help files are
installed according to the language selection made at the start of the installation. The corresponding data packages
and the installation progress are displayed in the Progress dialogue.
When this installation has been completed successfully, you can use Offboard Diagnostic Information System
Service for your work.
Note:
It is possible to cancel the installation of the language-dependent diagnostic data, vehicle projects and help files
when Offboard Diagnostic Information System Service is started for the first time. However, in that case you
cannot use the application for your work.
If shared network drives are to be configured for using several Offboard Diagnostic Information System Service test devices, observe the Microsoft Windows documentation for the configuration of the network drives.
The structure of the folders can be organised as one sees fit. The local path structure of Offboard Diagnostic
Information System Service after automatic installation and the default folder names in the administration of
Offboard Diagnostic Information System Service are a useful starting point.
Reference:
See also "Administration mode" chapter
30
Installation
Note:
If Internet Explorer, Version 6, is configured as the default browser, the following setting is required for communication with the Group systems to work correctly:
Figure 3.19. Internet options for Internet Explorer 6
On the "Advanced" tab of the browser's internet options, the tick needs to be removed from the "Display short
Http error message" property.
Note:
If a firewall is activated while Offboard Diagnostic Information System Service is being installed, an error
message may appear. Access to OffboardDiagLauncher.exe must not be blocked.
Reference:
See also chapter "Additional error messages"
31
Installation
32
Chapter 4. Update
Regular software and data updates are available for Offboard Diagnostic Information System Service. The
update cycle and login data required for automatic updates can be configured in Admin mode.
Reference:
See also Administration chapter - "General area" and "Connections area".
Each time the program is started, the Offboard Diagnostic Information System Updater searches for updates
in the start configuration of Offboard Diagnostic Information System Service.
Figure 4.1. Data update via network
URL: The URL for the update server (mirror server 2) can be changed here for updates via the network. The URL
default setting is applied from the admin area and may be changed there permanently.
Select local directory: If the update is installed via CD/DVD or a network drive, this button can be used to select
the drive with the update CD/DVD inserted or the folder on the network drive. The user name and password are
not required for an offline update.
User name: Enter the user name.
Password: Enter the password.
To access the update server, the local administrator needs to be consulted.
Click on Continue to start connecting.
Cancel: The update is cancelled.
An update may be imported online as well as offline.
33
Update
Note:
If a firewall is active while an update is in progress, an error message may appear. Access to the application file
OffboardDiagLauncher.exe must not be blocked.
Reference:
See also chapter "Additional error messages"
To perform an update of the operating system of the test device or laptop, administration rights are required.
A progress dialogue displays the progress of connecting to the update site.
Figure 4.2. Connecting to update site
Cancel: The update is cancelled.
The Offboard Diagnostic Information System Updater shows the size of the available updates and the corresponding estimated download times according to the type of network connection, as soon as a connection to the
update site has been established.
Figure 4.3. Displaying available updates
Back: Offboard Diagnostic Information System Updater goes back a step.
Next: An available program update is automatically installed. At this point, please follow the instructions.
34
Update
Cancel: Installation of the update is cancelled.Offboard Diagnostic Information System Service is then started
in the current version.
If no update data is available, Offboard Diagnostic Information System Service informs you of this with the
following message.
Figure 4.4. No updates available
Back: Offboard Diagnostic Information System Updater goes back a step.
Next: The Offboard Diagnostic Information System Service Updater is closed.
Cancel: Installation of the update is cancelled.Offboard Diagnostic Information System Service is then started
in the current version.
If update data is available, there are updates for the following areas:
1) Individual program components of Offboard Diagnostic Information System Service, if they have been licensed.
2) Data processed by Offboard Diagnostic Information System Service, such as diagnostic data, test programs
and similar.
3) Programs provided by third parties, such as MCD server or virtual keyboard.
The progress dialogue displays the installation progress for all components of the update.
Figure 4.5. Displaying the progress of a data update
Cancel: Installation of the data update is cancelled.
35
Update
Note:
Depending on the data volume, the data update may take some time.
During the update of applications from third parties, individual installation routines may start with instructions
that need to be followed.
If an update cycle was entered in Admin mode, a corresponding message is displayed at the configured time
when closing or starting Offboard Diagnostic Information System Service.
Figure 4.6. Message relating to an update when the preconfigured time has passed
This symbol
message.
is used to refer to a pending update. Click on the symbol to open the Time to check for updates
OK: Updates are searched for via the configured connection.
If updates are available, the system will inform you of this with the Updates available message.
Figure 4.7. Message relating to an update when data is available
OK:Normally, you can continue to work. On closing Offboard Diagnostic Information System Service, the
following message appears:
36
Update
Figure 4.8. Update message after exiting Offboard Diagnostic Information System Service
Yes: The update is continued, as described above.
No: No update is initiated. This does not change the update cycle.
37
Chapter 5.
interface
Application
start/user
This chapter gives a brief introduction to the user interface of Offboard Diagnostic System Information Service
and how to use it. For individual functions described here, there are references to other chapters of the manual if
more detailed descriptions are available.
Offboard Diagnostic Information System Service is started after installing it via the Windows start menu:
Figure 5.1. Starting Offboard Diagnostic Information System Service
The virtual keyboard can also be started using the Windows start menu under "Keyboard".
After completing the start procedure, the user interface is displayed in diagnostic mode.
In addition, a window appears with warnings and notes that must be observed.
Figure 5.2. Window with warnings/notes (part 1)
Note:
The OK button for closing the window with warnings and notes is not active until the text has been scrolled
down completely.
38
Application start/user interface
Figure 5.3. Window with warnings/notes (part 2)
OK: The window is closed.
After closing this window, Offboard Diagnostic Information System Service is available for work.
Reference:
For more details, see "Additional functions/info" chapter
39
Application start/user interface
Figure 5.4. The Offboard Diagnostic Information System Service user interface
The user interface
is divided into several areas:
Information area
Client area
Modes and standard functions
Status area
The individual areas have the following functions:
Information area
The information area contains general information on the licence, the order and the vehicle currently connected.
Figure 5.5. The information area
The area on the left shows the importer number, dealership number and order number.
40
Application start/user interface
The vehicle ID and the engine code are available in the centre.
For unaffiliated market participants, the remaining time of the diagnostic flat rate is displayed in the area in
the centre, after logging on to the Group systems.
The area on the rights uses symbols to indicate whether:
•
There is a diagnostic connection to the vehicle
There is a diagnostic connection,
There is no diagnostic connection,
No diagnostic connection is identified.
•
There is a network connection
There is a network connection,
There is no network connection.
•
Whether the ignition is switched on
The ignition is switched on,
The ignition is switched off
The ignition status is not identified.
Note:
Without a network connection, there is no connection to the Group systems. Functions depending on this, such
as flashing and TPI, can then not be used.
Client area
The client area is the main part of the application. All relevant data available during diagnosis and testing such
as block diagrams, test plans and test results is displayed here. In addition, all file entries are made here, such as
entering measured values in tests, selecting test steps and identifying individual control units.
Each mode has its own tab bar in the client area with various tabs. Depending on the type and scope of the
session, individual tabs are enabled. Inactive tabs without content are greyed out.
41
Application start/user interface
Tab bar for Flash mode:
Tab bar for Diagnostic mode:
Tab bar for Info mode:
Tab bar for Admin mode:
Note:
The Actions and History tabs are not available to the unaffiliated market participant on the tab bar in Info mode.
The Verification tab is only available if Offboard Diagnostic Information System Service was purchased in
a product version with external verification.
Modes and standard functions
To switch modes click on the desired button in the Modes menu.
Figure 5.6. Modes menu
The following modes are available:
Flash mode:
Test instruments mode:
Diagnostic mode:
42
Application start/user interface
Info mode:
Admin mode:
The individual modes are described in the following chapters.
Note:
It is only possible to switch from diagnostic mode to flash mode or vice versa if the current diagnostic session
or flash session was exited first.
Reference:
See also "Ending diagnosis"
See also "Data/diagnostic session"
The Standard functions menu contains functions that can always be accessed in Offboard Diagnostic Information System Service .
The following standard functions are available:
Figure 5.7. Standard functions menus
The following Data submenu can be used
43
Application start/user interface
Figure 5.8. Data submenu
•
to print screenshots,
•
to send, save, print and copy diagnostic protocols,
•
to interrupt diagnostic sessions and resume them later on,
•
to download hotfixes.
Reference:
See also chapter "Data"
Note:
The menus on the right side are opened and closed again by clicking on the
.
The following Extras submenu includes the following:
Figure 5.9. Extras submenu
44
name row
Application start/user interface
•
The search function,
•
The option of changing the diagnostic hardware (Vehicle Communication Interface VCI),
•
Test drive mode.
Reference:
See also "Extras" chapter
Via the following Help submenu, the following functions are available:
Figure 5.10. Help submenu
•
Online help,
•
Feedback function for support queries.
Reference:
See also "Help" chapter
The following Info submenu includes the following:
Figure 5.11. Info submenu
•
Information on new functions under New features,
•
Information on software and data versions,
•
Attention, caution and note information.
Status area
The status area shows the current progress and status.
Figure 5.12. Status area example, test plan calculation
45
Application start/user interface
For example, the progress of the calculation of the test plan during diagnostic start-up can be monitored.
The buttons for adjusting the size of the client area and for exiting Offboard Diagnostic Information System
Service are available to the right of the status line.
The Hide button is used to hide the Modes and standard functions area.
The Show button can be used to show this area again.
To hide the Information area and the Modes and standard functions area, click on the Full screen
button.
To show the Information area and the Modes and standard functions area again, click on this button.
To exit the Offboard Diagnostic Information System Service program, click on this button. A confirmation prompt will then ask you if you really want to exit the program. If you confirm this with Yes, Offboard
Diagnostic Information System Service is closed. If guided fault finding is active, it needs to be exited first.
Otherwise you will be asked whether a support request is to be sent at the end of the diagnostic session.
Reference:
See also "Ending diagnosis"
46
Application start/user interface
chapter
5.1. Operation
Offboard Diagnostic Information System Service can be operated using the mouse and keyboard and/or using
the touchscreen. Larger buttons make it easier to operate the program using the tester and the touchscreen.
5.1.1. Touchscreen
A touchscreen is a sensor screen available on some diagnostic units. Here you press the buttons with your fingers
and / or a touch pen instead of using the mouse and keyboard.
Note:
The "right mouse button" is not used for the touchscreen. Menus and buttons that would otherwise be accessed
using the right mouse button are displayed on the touchscreen by keeping the left mouse button pressed (for
approx. 1 second).
5.1.2. Mouse and keyboard
The program can also be used with the mouse. To do this, move the cursor over the desired button and left-click
for confirmation.
The menus and buttons of the context menu that would otherwise be accessed with the right mouse button are
displayed by keeping the left mouse button pressed (for approx. 1 second).
The keyboard is required to enter values in test programs or guided functions if this is required by test steps. The
VIN is also entered manually using the keyboard.
47
Chapter 6. Diagnostic mode
This chapter deals with the scope of functions in diagnostic mode.
6.1. Diagnostic workflow
The typical workflow of a diagnostic session with Offboard Diagnostic Information System Service is described
in the following chapters. A diagnostic session is characterised by the sections Diagnostic start-up, Test plan
and special functions, Using fault finding (GFF) and Ending diagnosis.
Figure 6.1. Diagnostic start-up workflow
In the Diagnostic start-up section, the vehicle is connected and identified (GMD), login to the Group systems
is performed, a corresponding order is selected from ElsaPro, the vehicle's control units are identified and, finally,
the start of GFF is initiated.
In the Test plan and special functions section, start modules and traversion tests are executed, the test plan
is calculated automatically and adjusted manually via DISS and TPI, if necessary. At the end of this section, the
test plan and special functions are available for guided fault finding.
The focus of the Using GFF section is on the execution of GFF tests.
In the End diagnosis section, a diagnostic session is completed by erasing the event memory, executing end
modules and the option of giving feedback.
In addition to this typical course of a diagnostic session, in diagnostic mode it is also possible to subsequently
mark control units as installed, change control unit variants, check individual control units using guided functions
or perform a complete self-diagnosis.
48
Diagnostic mode
6.2. Diagnostic start-up
In the Diagnostic start-up section, the vehicle is connected and identified (GMD), login to the Group systems is
performed, a corresponding order is selected from ElsaPro, the vehicle's control units are identified and, finally,
the start of GFF is initiated.
Figure 6.2. Diagnostic start-up section
49
Diagnostic mode
6.2.1. Starting diagnosis
The Start diagnosis section describes the connection of the vehicle to Offboard Diagnostic Information System
Service.
Figure 6.3. Start diagnosis section
Figure 6.4. Start-up window after starting the application
After Offboard Diagnostic Information System Service has been started, the user interface is displayed in
diagnostic mode without any vehicle data.
The diagnostic hardware is identified first. This process may take some minutes.
50
Diagnostic mode
Note:
Figure 6.5. Bluetooth connection not permitted
Yes: Bluetooth is used on your own responsibility.
No: A Bluetooth connection is not established.
The use of Bluetooth connections is not permitted in every country. If communication with the vehicle is established via Bluetooth connection, e.g. VAS5054, in one of these countries, Offboard Diagnostic Information
System Service will inform you about this in a message.
Reference:
A detailed description of how to change the diagnostic hardware is available in the "Extras/VCI" chapter.
51
Diagnostic mode
Figure 6.6. Start window for diagnostic start-up
To start vehicle diagnosis, diagnostic mode must be activated. Whether the vehicle is connected and the ignition
is switched on is shown in the start-up window.
Click on this button to start diagnostic start-up.
Diagnostic start-up runs on the Control units tab.
Once diagnostic start-up has been started, it can be cancelled by clicking on this button.
A diagnosis already performed can be ended using this button. Offboard Diagnostic Information
System Service is not closed in this case.
52
Diagnostic mode
Note:
Offboard Diagnostic Information System Service only provides the option of diagnosis and flashing for the
licensed brands.
Which vehicle models of this brand are available depends on the type of dealer of a brand in the licence. All
vehicle models are available to a licensed authorised dealer, dealer type = H.
Only EU vehicles are available to a licensed unaffiliated market participant, dealer type = U, of a brand.
It is possible to check the contents of the licence in the administration area:
See also "Administration/General/Licence info"
An unaffiliated market participant must log on to the Group systems online at the start of a diagnostic or flash
session to enable diagnostic or flash start-up.
If login is cancelled, Offboard Diagnostic Information System Service returns to the start screen.
After login, Offboard Diagnostic Information System Service displays the remaining duration of validity of
the diagnostic flat rate in days and hours in the Information area of the user interface under Time remaining.
In addition, the Actions tab and History tab are not available to the unaffiliated market participant.
During diagnostic start-up, Offboard Diagnostic Information System Service checks the vehicle status according to the battery and ignition status:
•
Is the battery connected (terminal 30 - battery voltage)?
•
Is a vehicle connected (terminal 30 - battery voltage)?
•
Is this vehicle's ignition switched on (terminal 15 - ignition)?
If the battery is not connected, the Battery not connected dialogue appears.
Figure 6.7. No vehicle connected
If no vehicle is connected, the No vehicle connected dialogue appears.
53
Diagnostic mode
Figure 6.8. No vehicle connected
Repeat: The vehicle connection is re-checked.
Continue: The system resumes diagnostic start-up.
Cancel: Diagnostic start-up is cancelled.
If a vehicle is connected, the ignition status is checked without another message being displayed.
If it is still not possible to identify the vehicle despite correct diagnostic plug connection, the Vehicle identification
not possible dialogue appears.
Figure 6.9. Vehicle identification not possible
Repeat: Vehicle identification is repeated.
Continue: The system resumes diagnostic start-up.
Cancel: Diagnostic start-up is cancelled.
Diagnostic start-up is automatically resumed without a message if the ignition is identified as switched on on the
vehicle.
If the ignition is switched off, the Ignition is switched off dialogue appears.
Figure 6.10. Ignition is switched off
54
Diagnostic mode
Repeat: The ignition is re-checked.
Continue: The system resumes diagnostic start-up.
Cancel: Diagnostic start-up is cancelled.
If the ignition status is not identified, the Ignition status cannot be identified dialogue appears.
Figure 6.11. Ignition status cannot be identified
Repeat: The ignition status is re-checked.
Continue: The system resumes diagnostic start-up.
Cancel: Diagnostic start-up is cancelled.
Note:
The status of battery, ignition and vehicle identification is checked during the following activities:
•
Diagnostic start-up
•
Reading the event memory of a control unit
•
Reading the event memories of all control units
•
Manual identification of a control unit
•
Diagnostic exit
Note:
Diagnostic start-up may take several minutes.
Note:
Offboard Diagnostic Information System Service cannot be closed while the control unit list is being created.
55
Diagnostic mode
The current progress of diagnostic start-up is shown at the bottom right of the user interface.
Figure 6.12. Status area example, determining the VIN
6.2.2. Basic characteristics dialogue (GMD)
The next section describes the identification of a vehicle according to its basic characteristics.
Figure 6.13. GMD execution section
The main element is the Basic vehicle characteristics (GMD) dialogue.
Figure 6.14. Dialogue for selecting the basic vehicle characteristics
If the ignition status is OK, the vehicle identification number (VIN) is read out of the vehicle and the Basic
vehicle characteristics dialogue appears for selecting the basic vehicle characteristics.
56
Diagnostic mode
The VIN can be corrected manually, if required, by switching the vehicle identification from automatic to manual.
A detailed description of how to switch between automatic and manual is given below.
Cancel: Vehicle identification, and thus diagnostic start-up, is cancelled.
Whether guided fault finding is to be used during a diagnostic session or not is also decided using the Basic
Characteristics dialogue.
Figure 6.15. Query for guided fault finding
With every diagnostic start-up, Work with guided fault finding is automatically set by default in the Basic
vehicle characteristics dialogue. If this option is deselected a warning is displayed with information about the
consequences.
Only Self-diagnosis and Guided functions are available.
Yes: The diagnostic session is resumed without guided fault finding. In this case, work can only be continued
without an order.
No: Diagnosis is resumed using guided fault finding.
Reference:
For more information on self-diagnosis, see chapter "Self-diagnosis".
Vehicle identification for determining the GFF diagnostic data in the Basic Vehicle Characteristics dialogue
can be performed automatically or manually. Basic characteristics that are not determined clearly, need to be
identified manually.
If an error occurs during automatic identification, a message is displayed with the request for manual identification
of the vehicle.
57
Diagnostic mode
Figure 6.16. Error during automatic identification
OK: Identification mode is switched to manual.
Basically, there are two possible reasons why automatic identification failed:
•
An error occurred while reading the VIN, e.g. due to a faulty control unit.
•
An error occurred while determining the diagnostic data corresponding to the VIN. The data pool is outdated
or incorrect.
If an error occurs during automatic identification, you have the option of switching between automatic mode and
manual mode.
When switching from automatic mode to manual mode, all previously determined basic characteristics are
retained but can be changed. However, if basic characteristics are changed, all previously selected characteristics
will expire. When switching from manual mode to automatic mode, all basic characteristics entered manually
as valid are retained. That means the validity of manually entered characteristics is automatically checked and
adjusted, if necessary. For example, an invalid VIN is replaced by the VIN automatically read.
Figure 6.17. Entering the VIN manually
In manual mode, the plausibility of the entered VIN is checked, e.g. for its correct length (17 characters). There
is no other technical check of the VIN. The manually entered VIN must be plausible for manual identification of
the vehicle to be continued. Otherwise, there are no restrictions and dependencies in terms of the selection of the
vehicle characteristics provided.
Note:
If a plausible but technically incorrect VIN is entered, Offboard Diagnostic Information System Service might
not provide purposeful tests for GFF due to missing requirements. The manual input of the VIN should therefore
be performed carefully.
In automatic mode, it is no longer possible to change the vehicle identification number and the clearly determined
basic characteristics.
58
Diagnostic mode
Vehicle identification is continued after determining the VIN.
There are several pop-up menus in the Basic vehicle characteristics dialogue that allow you to choose from
several proposals, if available.
Select the vehicle manufacturer in the Manufacturer pop-up menu.
The models for the manufacturer selected above are now shown in the Model pop-up menu.
After you have selected the model, select the model year for the selected vehicle in the Model year pop-up menu.
Once the model year has been selected, specify the model type in the Model type pop-up menu (e.g. saloon,
estate, etc.).
Finally, select the vehicle engine in the Engine pop-up menu.
Note:
The selection of the basic characteristics from the pop-up menus of GMD for unaffiliated market participants
is limited toEU5 vehicles.
59
Diagnostic mode
Note:
If the vehicle is changed during a diagnostic session, Offboard Diagnostic Information System Service rereads the VIN and indicates the change of vehicle.
Every change of vehicle is entered in the diagnostic protocol.
Note:
The individual pop-up menus will not be active until a selection has been made in the pop-up menu above.
Click on Apply to accept the basic vehicle characteristics. The vehicle has been identified.
6.2.3. Login to Group systems
The next step after identifying the vehicle is login to the Group systems.
Figure 6.18. Login to Group systems section
To login, Offboard Diagnostic Information System Service opens a login window.
Figure 6.19. Login window to the Group systems
60
Diagnostic mode
Login takes place once per session. The global user ID and the password for access to the Group systems are
required for login.
Apply: The login data is sent to the Group systems.
Cancel: The login data is discarded. Authorised dealers may repeat login at all times.
This button is available in all views of Offboard Diagnostic Information System Service that obtain data
from Group systems. It can be used to repeat login at all times.
After login, access to services such as ElsaPro, CarPort, DISS etc. will be possible in the subsequent course of
the diagnostic session.
Note:
An unaffiliated market participant must login to the Group systems online at the start of a diagnostic or flash
session to enable diagnostic or flash start-up.
If login is cancelled, Offboard Diagnostic Information System Service returns to the start screen.
After login, Offboard Diagnostic Information System Service displays the remaining duration of validity of
the diagnostic flat rate in days and hours in the Information area of the user interface under Time remaining.
In addition, the orders and vehicle history are not available to the unaffiliated market participant.
6.2.4. Selecting an order
After login to the Group systems, an order is selected for the diagnostic session. It is also possible to work without
an order, which is decided in this section.
Figure 6.20. Select order section - Diagnostic start-up
The same procedure is used to start up a flash session in Flash mode.
61
Diagnostic mode
Figure 6.21. Select order section - Flash start-up
During flash start-up, after login to the Group systems, the order selection is opened on the Orders tab. The order
selection process is identical in both modes.
Reference:
Selecting orders during flash start-up is also described in the chapter: "Flash / Order selection mode".
The view switches to the Orders tab after Group system login.
Figure 6.22. Order view during diagnostic start-up
62
Diagnostic mode
Offboard Diagnostic Information System Service lists all orders available for the identified vehicle on the
Orders tab.
The order number is displayed under Order, the current status in the SCP process under SCP status, and the
vehicle's licence plate number, the date of the order and a descriptive text on the order are displayed in the
order list.
The meaning of the SCP status numbers is listed in the following table.
SCP status no.
Description
1
Scheduling appointment
2
Preparing for appointment
3
Vehicle reception
4
Work processes
5
Quality control
6
Vehicle return
7
Follow-up
8
Completed
Table 6.1. Meaning of the SCP status numbers
Offboard Diagnostic Information System Service checks whether there is an online connection to the Group
systems to be able to load order and vehicle data from ElsaPro.
The configuration of the web service for access to ElsaPro is described here:
Reference:
See also "ElsaPro connections"
Normally, login to the Group systems during diagnostic start-up is successful. If not or if the online connection
was interrupted, the following error message is displayed.
Figure 6.23. Login to Group systems not possible
63
Diagnostic mode
It is possible to repeat login and correct the login data, if necessary.
Apply: Login is repeated.
Cancel: Login is cancelled. As a result, no data from the Group systems is available, such as orders from ElsaPro.
Note:
The
button can be used to reload order data from ElsaPro. Authorised dealers can also log on to the Group
systems here. This button is available in all views of Offboard Diagnostic Information System Service that
obtain data from Group systems.
Reference:
See "Info mode" chapter
If there is a connection to the Group systems, Offboard Diagnostic Information System Service lists the orders
available in ElsaPro.
Figure 6.24. Order list view
To display order details, click on the desired order.
64
Diagnostic mode
Details: Click on this button to display the order details.
Figure 6.25. Order detail view
In the Order detail view, order such as order type, order date, order status and collection data, customer such
as name, address, city and telephone, order items with information on item number, type and text and DISS
complaints with DISS BA ID, customer live statement, customer code and TPI from DISS are displayed in
three subdivided areas.
Reference:
For DISS complaints, see also "DISS/TPI" chapter.
Display order list: To return to the order list from the detail view, click on this button.
An order for the diagnostic session can be selected from this list or an order created with manual order number.
A marked order with order number can be selected from ElsaPro by clicking on the Select order button.
Without a connection to the Group systems, only a standard order is created for working with manual order
number. It is possible to assign a number to this order and select it for the diagnostic session.
65
Diagnostic mode
Figure 6.26. Entering the order number
If a manual order number is to be assigned, the Standard order for working with manual order number needs
to be selected from the list by left-clicking on it.
Enter no...: Click on this button to open a window for entering the order number, which may consist of a combination of letters and numbers as desired.
Apply: The order number is used.
Cancel: No order number is assigned.
Without order: Diagnostic start-up is continued without an order.
66
Diagnostic mode
Figure 6.27. Selecting "Work without order"
To do this, click on the Without order button.
Note:
Only orders with order numbers can be selected for a diagnostic session. The selected order is valid for the entire
diagnostic session and cannot be changed.
An order is essential for warranty invoicing.
The order number is added to the diagnostic protocol.
Self-diagnosis is not available for a diagnostic session with order.
The selection of the order is thus completed.
67
Diagnostic mode
6.2.5. Control unit identification
After selecting the order, the identification of the control units starts. To do this, Offboard Diagnostic Information System Service evaluates the gateway installation list first.
Figure 6.28. Identify control units section
If the vehicle is marked in the equipment network for CAN diagnosis, the gateway installation list is read with
information on the communication protocol, the vehicle's target installation, the vehicle's actual installation and
the current event memory status.
If a difference between the target installation and the actual installation in the vehicle is identified according to
the status information in the gateway installation list, Offboard Diagnostic Information System Service opens
a Check installation list window with the control units in the order provided by the gateway. This installation
list can be sorted by diagnostic address, control unit name, coding status and installation status in the test window.
Figure 6.29. "Check installation list" dialogue
The installation status is indicated by these symbols:
The target installation displayed corresponds to the actual installation.
68
Diagnostic mode
The target installation displayed corresponds to the actual installation. The target installation has been changed
and not coded yet.
The target installation displayed does not correspond to the actual installation.
The target installation displayed does not correspond to the actual installation. The target installation has been
changed and not coded yet.
Close: The window is closed.
The installation status can be edited via the coding status.
Figure 6.30. Editing the coding status
The coded or not coded setting can be edited.
To do this, mark the control unit using the mouse and click on the coding status on the right to open the listbox
for making a selection.
Coded means that the control unit is included in the target installation.
Not coded means that the control unit is not included in the target installation.
Code: The changes to the coding setting are applied and the installation list is re-read. If there are still differences
between the actual installation and the target installation, the dialogue is displayed again.
Close: Checking of the installation is stopped and the existing code is accepted.
Note:
For the following automatic identification of the control units, a reading plan is compiled, in which all control
units are listed, which are addressed independently by the system during identification. The reading plan consists
of information of the MCD project, the gateway installation list and the control unit nodes of the equipment
network. The list is thus limited to those control units that are very probably installed in the vehicle.
69
Diagnostic mode
If control units indicated in the equipment network as correctly installed are not identified during automatic
identification, it is possible to read them out again. The dialogue opens: Control units not identified (installed
correctly).
Figure 6.31. "Control units not identified" dialogue
All control units that have not been identified are displayed in the left-hand field of the dialogue. By marking
one or more control units and clicking on the direction arrow >, control units can be moved into the right-hand
window to be identified again.
Control units can also be moved into the left-hand window using < if repeated identification is not desired.
Repeat reading: To start another attempt to read these control units, click on this button. If the control units are
still not identified, the dialogue appears again. The list of control units then only includes those previously selected.
Close: To close the dialogue and end repeated identification, click on this button.
70
Diagnostic mode
6.2.5.1. Control unit list
The control units can be viewed in the control unit list or in the block diagram. The desired view is selected using
the corresponding button.
Figure 6.32. View of the control unit list
The Control units list shows the control units installed in vehicles with a full options package. The control units
installed in the vehicle are displayed in black. The control units not identified are displayed in grey. Control units
subsequently entered "as installed" are displayed in black italics. Control units with event memory entries are
displayed in red.
The Control units table has three columns.
Address column
The Address column shows the diagnostic address for each control unit.
Event column
The Event column shows the number of event memory entries for each control unit.
Name column
The Name column shows the name of each control unit.
71
Diagnostic mode
Figure 6.33. Information on a control unit
More information about the control unit is available in brackets after the control unit name. The name of the variant
is only displayed if a variant has been set.
System name
Variant
Software part number
Software version number
System designation
There are several ways to sort these columns.
Click on the Sort preference button. An additional button appears that can be used to sort the table's
contents.
Figure 6.34. Sorting the control unit list
Address, ascending: To sort the control units by diagnostic address value, beginning with the smallest value,
click on this button.
Event, ascending: This button sorts the control units by the number of their events.
Name, ascending: This button lists all the control units in alphabetical order.
In all, there are three ways of sorting the address, event and name:
1) In ascending order (address number, number of events, control unit name)
2) In descending order (address number, number of events, control unit name)
3) Unsorted (address number, number of events, control unit name)
The sort preference can be changed in this order. The captions of the buttons are changed accordingly.
Note:
Clicking on Change sort preference button again shows the Event, descending button. Click on the Event,
descending button to show control units with the most event entries at the beginning of the table. This provides
a quick overview of the control units with event entries displayed.
Another way to sort the table's contents is to click on the corresponding column heading in the table. To sort the
diagnostic addresses in ascending order, click on the Address heading once. To sort the numbers in descending
72
Diagnostic mode
order, click on the column heading again. To return the diagnostic addresses to the unsorted order in which they
were originally read, click on the column heading a third time. Sorting works the same way for the Event and
Name columns.
To change the view between Actual no. and Maximum no. click on this button.
Actual no.: To show only the control units actually installed, click on this button.
Maximum no.:
To show all control units possible for the vehicle model, click on this button.
6.2.5.2. Block diagram
When reading of the control units is started, the block diagram for the vehicle may already be displayed on the
Control units tab.
Figure 6.35. View of the block diagram
To open a graphical overview of the current block diagram in the overall view, click on the Block diagram button.
The block diagram displays the control unit network of the full options package. Clicking on a control unit symbol
displays a message text with the system name of the control unit under the block diagram.
Several buttons that can be used to navigate in the block diagram are available below it.
73
Diagnostic mode
From left to right:
Switching to the overall view of the block diagram
If you have zoomed in on the block diagram and would like to return to the overall view, click on this button.
Zooming in on the block diagram
Each time you click on this button, the block diagram 's size increases and you can recognise further details.
If the button is not active, the block diagram is at maximum zoom size.
Zooming out of the block diagram
Click on this button to zoom out of the block diagram. This button is not enabled in the overall view of
the block diagram.
Moving the block diagram
To move the block diagram, click on this button.
After activating the button, click on the block diagram and move it in the desired direction using your finger (if
you are using the touchscreen). If you are using a mouse, hold down the left mouse button and move the mouse
to access the desired point in the block diagram.
This button is not enabled in the overall view of the block diagram.
Note:
If the
symbol is activated, it is not possible to double-click using the touchscreen or left mouse button.
Individual control units are displayed differently depending on their state.
74
Diagnostic mode
The control unit was not identified and is only installed in vehicles with a full options package.
The control unit was not identified, but it exists in the gateway installation list.
The control unit has been found and identified and does not have any event memory entries.
No event memory entries were found for this control unit.
Figure 6.36. Examples of the graphical display of the control units
In the event of a longer click (approx. one second) or right-click on a control unit in the block diagram or the
control unit list, another button bar opens. The buttons on this bar apply to the control unit selected.
Figure 6.37. Buttons for the individual control units
The following buttons are available via the context menu:
75
Diagnostic mode
Figure 6.38. Context menu (control unit buttons)
If you click on the Test instruments button, Offboard Diagnostic Information System Service switches to
Test instruments mode.
Reference:
See also chapter "Test instruments"
For a preferred or subsequent identification of a control unit, depending on the time of the call, click on the
Identify control units button:
•
The preferred identification is applied during automatic control unit identification. The order of automatic
control unit identification is changed here.
•
Subsequent identification is applied after control unit identification. An undetected and identified control
unit is subsequently entered as installed manually here. If the entry is made by confirming the message from
Offboard Diagnostic Information System Service displayed below, the control unit is entered as installed
manually.
Figure 6.39. Entering a control unit as installed
Yes: The control unit is marked as entered as installed manually and displayed in the block diagram and the
control unit list accordingly.
No: The control unit is marked as not entered as installed.
If a control unit has been subsequently entered as installed manually because it could not be identified automatically, it is displayed in italics in the control unit list and in the block diagram.
76
Diagnostic mode
Figure 6.40. Control units entered manually "as installed" displayed in italics
The Select variant button enables a variant of the control unit to be selected if several control variants exist.
All possible variants of the control unit are shown.
The variant can be changed any number of times.
Figure 6.41. "Select variant" dialogue
Select: After the control unit variant has been selected and confirmed by clicking on this button, the control unit
list, the event memory and the test plan are updated automatically.
Close: To close the dialogue without selecting a variant, click on this button.
The variant selection is only available for control units already identified or entered manually.
Reference:
See also "Guided fault finding, Calculate test plan" chapter
To re-read only the event memory entries of the selected control unit, click on the Read event memory button.
The test plan is automatically updated in the process.
To read the event memories of all control units identified, click on the Read all event memories button. The
test plan is thus also updated.
After identification of a control unit, the Guided functions button can be used to open a selection that includes
all function tests for this control unit, e.g. actuator diagnosis for the crash signal. If a function test is selected and
you click on the Execute button, the program is executed on the Process tab.
77
Diagnostic mode
Figure 6.42. Selecting a guided function for a control unit
Execute: A selected guided function is executed by clicking on this button on the Process tab.
Cancel: The Guided Functions window is closed.
Self-diagnosis button and
chapter of this manual.
Vehicle self-diagnosis button are described in detail in the "Self-diagnosis"
Reference:
See also chapter "Self-diagnosis"
78
Diagnostic mode
6.2.5.3. Event memory
The event memory view can be used to view event memories available for all control units. This list only contains
control units with an event memory entry.
Figure 6.43. View of the event memory entries
Click on the Event memory list tab
entries.
on the Control units tab
At first, the entries are closed and the list displays the control units.
79
to list the control units with event memory
Diagnostic mode
Figure 6.44. Opening an event memory entry
Double-click on an event memory entry to open or close it. If it is marked with a plus sign (+) or a minus sign
(-), click on the plus sign or minus sign to open or close it.
Details on the control unit are explained in the following figure.
Figure 6.45. Information on an event memory entry
The following information is available in the event memory entry according to the numbers:
Event code
80
Diagnostic mode
Symptom code
Event location
Symptom
Memory status
You can use the Display button to switch between the two views
The standard ambient conditions are displayed
The standard ambient conditions are not displayed
.
The standard environmental conditions provide information on the following:
•
Status
•
Date and time of the entry
•
Mileage
•
Priority
•
Frequency counter
•
Unlearning counter / driving cycle
To change the sequence within an event memory entry, click on the Sort preference button. The
active sort order is greyed out in the menu.
Figure 6.46. Sorting the event memory list
Mileage: To sort the contents by kilometres driven in ascending order, click on this button.
Priority: This button shows the contents sorted in order of importance.
Frequency counter: Click on this button to sort the contents by the frequency counter (how frequently the event
was identified).
81
Diagnostic mode
Status: This button is used to sort the contents by the status of the event memory entries.
sporadic/static: This button is used to list events entered as sporadic at the top of the list.
Reference:
See also chapter "Control unit list"
In the event of a longer click (approx. one second) or right-click on a control unit, the control unit context menu
opens like in the control unit list.
Figure 6.47. Context menu in the event memory view
The buttons of the context menu are described in more detail in the Block diagram chapter.
Reference:
See also "Block diagram" chapter.
82
Diagnostic mode
6.2.6. Starting guided fault finding (GFF)
Once identification of the control units is completed, guided fault finding can be started.
Figure 6.48. Start GFF section
Offboard Diagnostic Information System Service opens the Diagnostic start-up confirmation window with
the message that guided fault finding (GFF) should be started.
Figure 6.49. Starting guided fault finding
OK: Use this button for confirmation to start guided fault finding.
The next chapter describes the processes executed by Offboard Diagnostic Information System Service during
guided fault finding in detail.
Reference:
See also chapter "Using GFF"
83
Diagnostic mode
Note:
If control units installed in the vehicle could not be identified, it is possible to enter them in the block diagram
or the control unit as installed, select a variant if necessary, and then supplement them as diagnostic objects
via the component selection.
Reference:
See also "Identifying control units"
Reference:
See also "Selecting a variant"
Reference:
See also "Component selection"
6.3. Test plan and special functions
In the Test plan and special functions section, start modules and traversion tests are executed, the test plan is
calculated automatically and adjusted manually via DISS and TPI, if necessary. At the end of this section, the test
plan and special functions are available for guided fault finding.
Figure 6.50. Test plan and special functions section
84
Diagnostic mode
6.3.1. Start modules, traversion tests, test plan calculation
This section describes how Offboard Diagnostic Information System Service executes start modules and traversion tests and then creates the test plan.
Figure 6.51. Start modules, traversion tests, test plan calculation section
When guided fault finding is started, start modules and traversion tests are executed on the Process tab. These
tests run in the background.
During a traversion test, the control unit information read out is used to set the control unit variants. If a variant
cannot be determined automatically or if a vehicle-specific characteristic is to be specified, a message is displayed
with an appropriate selection. If several variants of individual control units are available in the context of the
traversion tests, a dialogue for selecting variants appears.
Figure 6.52. Variant selection view
To select a control unit variant, click in the Variant field next to the corresponding control unit. A button appears
that can be used to open the menu for selecting the variants.
Set variant: The selected control unit variants are applied.
After setting the control unit variants, the creation of the test plan starts.
The automatic compilation of the test plan and the order of the test programs depend on the event memory entries
read out of the control units, the Technical Product Information (TPI) and on customer findings during dialogue
85
Diagnostic mode
reception available in coded form. These coded customer live statements are made up of fault objects (e.g. components), fault types (e.g. "rattling") and boundary conditions (e.g. temperature).
The test programs in the test plan are listed in the guided fault finding, sorted from top to bottom by their potential
success.
There are several ways of creating and updating a test plan. More details on creating the test plan are available
in these chapters:
Creating a test plan during diagnostic start-up.
Reference:
See chapter "Diagnostic start-up"
Creating a test plan by selecting the variant.
Reference:
See chapter "Diagnostic start-up variant button".
Updating a test plan by re-reading the event memory.
Reference:
See chapter"Diagnostic start-up event memory".
Test plan update via DISS / TPI.
Reference:
See chapter "Guided fault finding, DISS /TPI"
6.3.2. DISS / TPI
This section describes how to control the creation of the test plan with the creation and integration of complaints.
Figure 6.53. DISS/TPI section
86
Diagnostic mode
After compiling the test plan in the background, Offboard Diagnostic Information System Service automatically
switches to the DISS tab.
Figure 6.54. DISS tab view after diagnostic start-up
On the one hand, all DISS complaints are listed for the order selected in ElsaPro. On the other hand, manual
complaints can be created using a coding wizard. These complaints can be used to change the test plan for guided
fault finding.
Figure 6.55. Table with DISS complaints
The table list of DISS complaints has four columns:
1. DISS BA ID: That is the identification number of a complaint.
2. Customer live statement: That is the complaint in the customer's words as entered during placement of the
order.
3. Customer code: That is the customer live statement in text form.
87
Diagnostic mode
4. TPI from DISS: The number of the TPI assigned to the complaint from the DISS system.
There are two possible categories of DISS complaints:
1. Complaints from the DISS system: These complaints display all DISS information from the currently used
order from ElsaPro and are called automatically in the background when the order is selected at the start of the
diagnostic session. To list the complaints from DISS, an online connection with login to the Group systems is
necessary.
2. Manual complaints: These complaints are entered manually and displayed in the customer code column. The
DISS BA ID is always "manual", the two remaining columns are without data. These complaints are also available
offline without login to the Group systems.
A manual complaint is created using the coding wizard. Click on the Coding... button of a marked blank complaint
line to open the Coding wizard dialogue box.
Figure 6.56. Coding wizard dialogue box
Each time after entering a manual code in the complaints table, Offboard Diagnostic Information System Service creates a new row for a manual complaint.
Reference:
How to use the coding wizard is described in more detail in the "Coding wizard" chapter.
Functions for displaying TPI:
88
Diagnostic mode
At the bottom of the complaint list, there are function buttons that can be used to open the overall view of a
customer code for a marked complaint, to extend the test plan, select suitable TPI lists from the DISS system or
select individual TPI linked to the complaint on the TPI tab.
These function buttons are only enabled for existing DISS complaints.
Figure 6.57. Function buttons on the DISS tab
Code...: All details of the customer code are displayed in a table for the selected complaint in the Overall view
of customer code window.
If this function button is selected in combination with a marked, blank line, the window with the Coding wizard
opens.
Extend test plan...: The Transfer diagnostic objects to test plan window appears, in which the diagnostic objects
linked to available codes are displayed. These diagnostic objects can be added to the test plan. Not all complaints
have linked diagnostic objects. The test plan cannot be extended in these cases. A detailed explanation of this
function is available later on in this section.
Reference:
See also "Extend test plan" section.
Display TPI list: All TPI that corresponds to a customer code of a selected complaint are displayed, if available.
The application automatically switches to the TPI tab and opens the Display TPI window on the TPI list tab. This
function is only available for complaints from the DISS system and for customer complaints with all mandatory
fields filled. For access to DISS, login to the Group systems is required.
89
Diagnostic mode
Figure 6.58. View of the TPI tab
The TPI tab shows the same table list with complaints as the DISS tab, with the additional TPI manually, in
which the manually entered TPI is displayed.
Extend test plan: Opens the Transfer diagnostic objects to test plan window.
Display TPI: Opens the Display TPI window in the TPI numbers tab view. The TPI for the selected complaint
is displayed.
Figure 6.59. Displaying a selected TPI number
Further TPI can be accessed from ElsaPro and viewed. Enter the desired TPI number in the TPI number field
for this and press the Display button.
90
Diagnostic mode
Figure 6.60. Entering TPI manually
Adding TPI manually:
The Display TPI dialogue box provides the option of using the TPI number field to enter TPI numbers in the
TPI manually column on the TPI list and TPI number tabs. For this, enter the TPI number in the field and click
on the Apply button to assigned it as a manual TPI to the marked complaint. The Apply button is only enabled
for new TPI numbers. All manually entered TPI are listed in the dropdown list.
Extend test plan:
If the Extend test plan button is pressed for a marked complaint on the DISS tab or on the TPI tab, the Transfer
diagnostic objects to test plan dialogue appears.
Figure 6.61. Transferring a diagnostic object to the test plan
This dialogue lists all complete customer codes, including manual ones, that belong to the current order. The
customer codes and their TPI from DISS are displayed in the top half of the dialogue. The diagnostic objects of
the selected TPI are displayed in the bottom half, if available.
The customer code/TPI called using the Extend test plan function is selected automatically. The diagnostic objects
of this selected customer code/TPI are also displayed automatically.
The diagnostic objects can either be selected or deselected individually by clicking on the tick in the left-hand
column or all in one go.
Select all: All diagnostic objects are selected.
Deselect all: All diagnostic objects are deselected.
91
Diagnostic mode
Transfer to test plan: Click on this button to transfer the diagnostic objects for the selected customer codes/TPI
to the test plan calculation. Customer codes/TPI already transferred to the test plan and their diagnostic objects
are greyed out in the list view. They cannot be transferred to the test plan again.
Cancel: No diagnostic objects are transferred and the dialogue box is closed.
Diagnostic objects are only displayed for marked customer codes/TPI.
Figure 6.62. Deselected customer code
No customer code is selected in the figure above, which is why no diagnostic objects are displayed in the list at
the bottom.
Close: The dialogue box is closed.
Note:
Test programs added to the test plan as the result of a new assessment by diagnostic objects added can only be
removed on the Test plan tab.
Reference:
See also chapter "Using GFF"
For selected customer codes, you can call the overall view using the context menu and the right mouse button.
92
Diagnostic mode
Figure 6.63. Selecting the overall view
This function corresponds to the Entire customer code function described above.
Close: The dialogue box is closed.
Figure 6.64. Overall view of customer code
The Overall view of customer code displays all code levels of the coding wizard with the available entries.
Close: The overall view is closed.
After editing the DISS complaints, the creation of the test plan can be completed.
93
Diagnostic mode
6.3.2.1. Coding wizard
The coding wizard is used as follows:
Figure 6.65. Coding wizard
The coding wizard can be used to make entries in the fields for the customer code. To simplify the process, the
coding wizard specifies the code fields required step by step in the correct technical order with a green border.
The code levels to be completed are on the left in the form of buttons, i.e. groups and sub-groups of components/functions, complaint types, boundary conditions and gen. boundary conditions. Fields in which the
selected code values are displayed are next to the buttons. When an entry is made in a code field, all buttons of
the subordinate fields that can now also be completed are enabled.
The corresponding values for the buttons with a green border for completing are displayed in the right-hand window, which are selected by clicking on them. The active button is displayed as the heading. The figure above
shows the Boundary conditions button.
Boundary conditions and gen. boundary conditions are marked and inserted or removed by clicking on the direction
buttons << or >> .
It is also possible to click on an enabled button on the left side, regardless of the coding wizard's proposals, which is
then displayed with a green border and can then be completed. After completing them, the coding wizard continues
with its proposed specifications as described above.
Note:
Fields on the right with an * are mandatory fields that must be completed so that manual customer codes can
be added to the test plan.
The General boundary conditions field includes boundary conditions not assigned directly to the customer
code. If completed, it will not be possible to find any diagnostic objects for the current customer code.
94
Diagnostic mode
6.3.3. Special functions
In addition to the test plan in guided fault finding, further test programs of the same name are available on the
Special functions tab.
Special functions are vehicle-specific test programs. They are not selected via basic characteristics or control
units in the context of diagnostic start-up. Instead, they are provided from the database for individual vehicles.
To display tests available for the overall vehicle, click on the Special functions tab in Diagnostics mode.
Note:
In Flash mode, after vehicle and control unit identification the flash programs available for the vehicle are listed
on the Special functions tab. There is no test plan in this mode.
Reference:
See also chapter "Using flash programs"
Examples of special functions in Diagnostics mode are Code immobiliser and Transport protection.
Figure 6.66. Special functions view
95
Diagnostic mode
This view has two columns. The Tests column includes the test programs available for the vehicle. The Status
column indicates the status of each test program.
Reference:
See also chapter "Using GFF"
Perform test: The selected test program is executed. To do this, Offboard Diagnostic Information System
Service switches to the Process tab.
Show documents: The documents assigned to the vehicle are displayed. To do this, Offboard Diagnostic Information System Service switches to Info mode.
6.4. Using GFF
The focus of the Using GFF section is on the execution of Guided Fault Finding (GFF) tests.
Figure 6.67. Using GFF section
After creating the test plan, click on the enabled Test plan tab to switch to the list of test programs.
96
Diagnostic mode
Figure 6.68. Test plan view
The Test plan tab contains a table with the available tests. This table has two columns.
Status: This column has a symbol indicating the status of the test.
This symbol shows that the status is "Test not yet performed".
This symbol shows that the status is "ok". This test was successful.
This symbol shows that a test has been cancelled by the user.
This symbol shows that the status is "not ok". The test failed.
This symbol shows that no status could be determined for the execution of the program.
This symbol shows that diagnosis has been created and that the component has been repaired.
Tests: This column contains the possible test programs sorted by their potential success.
Perform test: This button is used to start a selected test. For this, Offboard Diagnostic Information System
Service switches to the Process tab.
Documents: This button can be used as an option to display documents either for the test plan or for a test program
selected. For this, Offboard Diagnostic Information System Service switches to the Info tab.
97
Diagnostic mode
Select own test: This button can be used to open the Overview of tests window that can be used to add one's own
test programs to the test plan for individual diagnostic objects of the vehicle.
Remove: This button can be used to remove one's own manually added test program from the test plan again.
Reference:
Further explanations.
For the documents provided in guided fault finding, further descriptions are available in the chapter "Info mode/
Documents/...".
To select a test program (test), either click on the text line highlighted in grey or on the corresponding symbol.
Figure 6.69. Activating a test in the test plan
The Perform test button is enabled after clicking on it.
The content of the selected test program is displayed below the list to explain it.
Perform test: To start the test program, click on this button.
Offboard Diagnostic Information System Service switches to the Process tab on which the instructions and
input options for the test program started are displayed.
98
Diagnostic mode
Figure 6.70. Test view on the Process tab
The name of the active test program is displayed at the top left (in the example above "Error in ECU"), with the
name of the current individual step below it (in the example above "Message").
Done/Continue: This button is used to confirm a message and go to the next test step.
Cancel test: If the test is ended prematurely by clicking on this button, this cancelled test step is indicated by the
symbol on the Test plan tab under the Status column.
Help: This button is activated if a help text is available for the test program.
Use the navigation buttons below the messages to navigate within the individual messages.
Back to the first message. This button is only active if there is more than one message.
Shows the last message available. This button is only active if there is more than one message.
Previous message
Next message
99
Diagnostic mode
The Message and instruction window is in the middle of the Process view.
Figure 6.71. Message and instruction window during the test
The message window for the test sequence contains information and instructions for the individual test steps.
The individual steps executed so far are listed on the left of the active test program.
100
Diagnostic mode
Figure 6.72. Step sequence during the test
The current test step is displayed within a blue border.
To view previously processed messages and instructions for fault finding, use the navigation buttons described
above or click on the individual test steps to the left of the fault finding instructions (e.g.: Test preparation steps,
Select model, End modules, Event memory evaluation, ...).
A test program can provide alternative test steps for selection.
101
Diagnostic mode
Figure 6.73. Buttons for selecting alternative test steps
As shown above in the example, use the numbered buttons (here -1- and -2-) to select the required action. To
receive the next instructions for troubleshooting, click on the -2- button as shown in the example.
Figure 6.74. Displaying the selected test step
The -2- button has been selected in this example; you can recognise it by the -2 - below the selection options.
A test program can request decisions using buttons.
102
Diagnostic mode
Figure 6.75. Decision buttons in the test program
In the example shown above, the question made in the test program requires a decision to be made by clicking
on Yes or No.
The buttons shown here may have different captions, depending on the contents of the test program. It may also
occur that the test program asks you to enter values, which you can do using the keyboard. In this case, an input
window is opened instead of the button.
In addition, documents may be stored in test programs for individual test steps.
103
Diagnostic mode
Figure 6.76. Function descriptions in the test program
The document is selected using the corresponding button, such as Function description. The name of the document and thus the button caption depend on the test program.
To display the corresponding document, click on the Function description button.
These are only documents integrated in the test programs.
Local and global documents may be assigned to a test program. Local documents apply to individual test steps
and global documents apply to the entire test program.
104
Diagnostic mode
Figure 6.77. Local and global documents in the test program
If several local and global documents are integrated in a test program, all local documents are combined in a block
at the top and all global documents in a block at the bottom. Both blocks are clearly separated from each other.
Documents with the same name are numbered in both blocks.
Reference:
More explanations on documents are available in the "Documents" chapter.
105
Diagnostic mode
Figure 6.78. Exiting the document view
The document is displayed in the display and message window of the Process view.
To return to the test program's test step from the document view and continue the test, click on this button.
After completing the test program, click on the Done/Continue button to finish the test. Offboard Diagnostic
Information System Service switches back to the table view of the Test plan tab and you can continue with
the next tests.
106
Diagnostic mode
6.4.1. Test verification
A test program can be executed several times by selecting it and clicking on the Perform test button to restart
it. If the test program has been run once successfully (green tick in the test plan view), a message appears asking
whether verification is to be performed.
Verification mode allows other entries to be tried out than in the previous test to be able to check (verify) the
previous result by confirmation or contradiction.
Figure 6.79. Verification mode query
Yes: Click on this button to restart the previously conducted and successful test. Depending on the type of test,
this can be done with different parameters or selection options.
No: Click on this button to perform the previously conducted and successful test again with the same parameters.
107
Diagnostic mode
6.4.2. Selecting components
The Test plan tab gives you the option of adding further tests on components of the vehicle or documents to the
test plan.
To do this, on the Test plan tab click on the Select own test... button.
The Overview of tests window appears, displaying the vehicle's diagnostic objects. The desired test or document
can be selected here via a tree structure.
Figure 6.80. Window for selecting tests
Click on the plus sign ( + ) to navigate down through the structure. In addition to components, documents can
also be added to the test plan. Selected documents are executed like test programs.
Add to the test plan: After selecting the test required for a component or document, click on this button to apply
the selection. A test program or document can also be selected by double-clicking on it.
Additional components or documents can now be added.
Manually added tests are at the end of the test plan.
You can use the Remove button on the Test plan tab to remove these test programs and documents from the
test plan.
To also search for a test using the search function, click on the Search symbol.
Reference:
See also chapter "Search function"
Close: The window is closed.
108
Diagnostic mode
To start the test program for manually added components and documents, click on the Perform test button.
Note:
Tests and documents that have been added manually to the test plan are displayed in light blue.
Note:
Components that have been added manually to the test plan and have not yet been tested using the Perform test
button will NOT be accepted if the test plan is calculated again.
6.5. Ending diagnosis
In the End diagnosis section, a diagnostic session is completed by erasing the event memory, executing end
modules and the option of giving feedback.
Figure 6.81. End diagnosis section
To end diagnosis, click on the End diagnosis button on the Control units tab.
109
Diagnostic mode
Figure 6.82. Ending diagnosis
Then, Offboard Diagnostic Information System Service opens the End diagnosis confirmation window asking
Do you want to end the current diagnostic session?
Yes: The diagnostic session is ended.
No: The diagnostic session is not ended. It is continued in unchanged form.
On selecting Yes, Offboard Diagnostic Information System Service will ask you whether guided fault finding is
to be continued in the Exit GFF: Decision: exit GFF? window. If not all tests of the test plan have been executed
yet, the window contains a note informing you that the test plan has not been executed completely yet.
Figure 6.83. Ending fault finding
Yes: Guided fault finding is continued and not ended.
110
Diagnostic mode
No: Guided fault finding is ended and exiting the diagnostic session is thus continued.
If the vehicle is changed during a diagnostic session, Offboard Diagnostic Information System Service asks
whether the repair of the connected vehicle is to be continued or whether the current session is to be cancelled.
Figure 6.84. Erasing the event memory
Continue: Exiting the diagnostic session is continued.
Cancel: Click on this button to cancel the diagnostic exit and continue the repair of the connected vehicle.
If, during the repeated query of the event memories, new or previously set ones were found Offboard Diagnostic
Information System Service will ask you whether a new test plan is to be calculated.
Figure 6.85. Erasing the event memory
Yes: Click on this button to re-create the test plan, thus continuing guided fault finding.
No: No new test plan is created and exiting guided fault finding is continued.
In the next step for ending the diagnostic session, what are referred to as end modules are executed. These programs are based on the diagnosed vehicle model and its equipment variants. There is no group of defined end
module programs. They are compiled individually by diagnostic editors for the existing vehicle models. Their sequence cannot be described for all vehicles in the same way. The program sequence may also deviate significantly.
The end module programs are executed like GFF test programs on the Process tab. Depending on the program,
decisions might be required or questions might need to be answered.
111
Diagnostic mode
Note:
The readiness code program is an exception to this rule. This program is an integral component of Offboard
Diagnostic Information System Service, which is always executed when guided fault finding is ended.
The readiness code program is an end module created by diagnostic editors for diesel vehicles with diesel particulate filter. That is why the program sequences of these diesel vehicles may deviate.
Figure 6.86. Executing the program for the readiness code
Yes: Click on this button to execute the test program for the readiness code.
No: The program for the readiness code is not executed.
In the last program on the Process tab, you will need to decide whether the diagnostic protocol is to be sent to
support.
112
Diagnostic mode
Figure 6.87. Send diagnostic protocol?
Send: The diagnostic protocol is automatically sent to support if there is a network connection. If there is currently
no network connection, the diagnostic protocol is saved and sent the next time Offboard Diagnostic Information
System Service is started.
Skip: The diagnostic protocol is not sent.
After executing the end modules, the Exit GFF: print/save diagnostic protocol dialogue appears which you can
use to choose whether to print or save a diagnostic protocol.
Figure 6.88. Print diagnostic protocol?
Print: Offboard Diagnostic Information System Service transfers a formatted diagnostic protocol to the default
Windows printer driver. It is opened and can be printed with all familiar Windows settings. The completion of
the printout needs to be confirmed with OK. Then the Exit GFF: print/save diagnostic protocol dialogue is
opened again.
113
Diagnostic mode
Save: Offboard Diagnostic Information System Service opens the Select diagnostic protocol dialogue. After
selecting the type of protocol, which can be cancelled, the Windows Save dialogue is opened for saving the protocol. After saving it or cancelling saving, the Exit GFF: print/save diagnostic protocol dialogue is re-opened.
Reference:
See also "Data" chapter for detailed information on selecting the type of protocol and on saving the protocol.
Continue: Offboard Diagnostic Information System Service continues to exit GFF.
Finally, Offboard Diagnostic Information System Service opens the Send support request dialogue. Here, you
again have the option of sending the diagnostic protocol with a support request.
Figure 6.89. Support request
Cancel: The support request is cancelled and nothing is sent.
Send support request: An automatic support request is sent with diagnostic protocol.
If errors occurred during the program sequence, the support request may also be edited and your own comments
and screenshots added.
Add notes: The feedback dialogue is opened for further editing. This button is only available on ending the
diagnostic session if Offboard Diagnostic Information System Service detected any errors during the program
sequence.
A precise description of the support request is available in the Feedback chapter.
Reference:
See also chapter "Feedback"
The diagnostic session is thus finished. Offboard Diagnostic Information System Service is in the start view
of diagnostic mode.
114
Diagnostic mode
6.6. Self-diagnosis
The following chapters describe under which circumstances self-diagnosis functions of the control units are available, in addition to guided fault finding, how the self-diagnosis functions are called and what the individual functions can do.
Self-diagnosis gives the user the option of accessing individual diagnostic functions of the control unit or vehicle.
Self-diagnosis is generally used if:
•
No GFF is available for the vehicle (very old or very new vehicle model),
•
No GFF is available for the problematic case,
•
GFF refers to the self-diagnosis.
Unlike with GFF, the interpretation of the results must be performed by the user.
6.6.1. Self-diagnosis in general
There are two ways to execute self-diagnosis functions in Offboard Diagnostic Information System Service:
1.
Diagnosis with guided fault finding is performed without an order.
In this case, the self-diagnosis functions for identified control units or control units entered as installed
manually are available in the context menu of the block diagram or control unit list.
Reference:
See chapter "Block diagram"
2.
If diagnostic start-up is performed as quick start-up without the using guided fault finding option, Offboard
Diagnostic Information System Service does not automatically identify the control units. The control units
are identified manually or entered as installed manually via the block diagram or the control unit list.
Note:
Subsequent start-up of guided fault finding is possible using this button on the Control
units tab. That starts the automatic identification of the control units and guided fault finding.
115
Diagnostic mode
Figure 6.90. Block diagram without control units read out
You must left-click (for about 1 second) or right-click on the desired control unit in the block diagram or
control unit list. That opens the context menu.
Figure 6.91. Manual identification of control units
116
Diagnostic mode
Identify control unit: The selected control unit is identified.
Read event memory: If an identified control unit has event memory entries, this button is enabled. It can be
used to re-read the event memories of the control unit.
Read all event memories: The event memories of all control units identified so far are re-read.
Guided functions: This button is enabled for an identified control unit. It is used to open the guided functions
available for the selected control unit in a selection window. If a guided function is marked and you click on
Execute, Offboard Diagnostic Information System Service starts this function and switches to the Process
tab for this.
If a control unit is not identified during manual identification, Offboard Diagnostic Information System
Service opens a message asking whether it is to be entered as installed manually.
Figure 6.92. Entering a control unit as installed that has not been identified
Yes: The control unit is entered manually as installed. The self-diagnosis functions are not available.
No: The control unit is not entered as installed.
Reference:
See chapters "Diagnostic start-up" and "Block diagram".
Note:
Self-diagnosis is only possible with control units identified or entered as installed.
Calling self-diagnosis functions:
For self-diagnosis, you must left-click (for about 1 second) or right-click on a control unit marked as installed,
which opens a context menu with the self-diagnosis buttons.
117
Diagnostic mode
Figure 6.93. Starting self-diagnosis
•
Control unit self-diagnosis: Click on this button to open the Self-diagnosis functions selection window with
self-diagnosis functions for the control unit selected.
Figure 6.94. Selection window for control unit self-diagnosis
The name of the control unit is displayed in the window.
Execute: The selected function is executed. To do this, Offboard Diagnostic Information System Service
switches to the Results tab (with the exception of the Access authorisation function).
Cancel: No function is executed and the window is closed.
You can choose between Adaptation, Code, Event memory, Default setting, Identification, Measured
values, Actuator diagnosis and Access authorisation.
•
Vehicle self-diagnosis: Click on this button to open the Self-diagnosis functions selection window with selfdiagnosis functions for the overall vehicle.
118
Diagnostic mode
Figure 6.95. Selection window for vehicle self-diagnosis
Execute: The selected function is executed. To do this, Offboard Diagnostic Information System Service
switches to the Results tab (with the exception of the Transport mode function).
Cancel: No function is executed and the window is closed.
Here, you can choose between the functions Event memories for entire system, Transport mode and Installation list.
The functions are executed and the results displayed on the Results tab. For each control unit, every function has
its own subordinate tab. These tabs have different designations for the individual functions.
For control unit-specific self-diagnosis functions, the designations are as follows:
Function
Tab name
Adaptation
KAL
Code
COD
Event memory
ESP
Default setting
BAS
Identification
ID
Measured values
MW
Actuator diagnosis
SGT
Table 6.2. View names of control unit self-diagnosis
With these functions, in addition to the view name the address is displayed on the tab of the corresponding control
unit.
Example:
The tab for the Event memory function of the central electrics with the address 09 has the name
"09 - ESP".
119
Diagnostic mode
Figure 6.96. Self-diagnosis: Example of a tab name
Functions that apply to the overall vehicle may have the following names:
Function
Tab name
Entire event memory
VEH - DTC
Installation list
VEH - VBL
Table 6.3. View names of vehicle self-diagnosis
The transport mode and access authorisation functions are not listed here, since they are executed in a separate
window and not on the Results tab.
To display and execute a function, Control unit self-diagnosis or Vehicle self-diagnosis must be selected from
the menu first, and then the desired function name.
Every function can also be active once for each control unit. If a tab is already open for a function for a control
unit and the function is selected again, the existing tab is displayed. To restart the function explicitly, the existing
tab must be closed first by clicking on
.
If the function is not supported by the control unit, a warning is displayed and you are not taken to the Results tab.
120
Diagnostic mode
Figure 6.97. Warning if adaptation is not supported
OK: The message is closed.
The individual self-diagnosis functions are described in the following chapters.
6.6.2. Control unit-specific functions
6.6.2.1. Adaptation
Depending on whether the adaptation is to be performed on KWP or UDS control units, configuration and operation
will deviate.
121
Diagnostic mode
6.6.2.1.1. Control units with KWP protocol
For KWP control units, after switching to the Adaptation view all adaptation channels of the selected control
unit are displayed in a list
. The channels are numbered and sorted in ascending order. A maximum of 255
channels can be used per control unit. All 255 channels are always displayed, regardless of whether they are
actually being used by the current control unit.
Figure 6.98. Adaptation KWP
New adaptation values can be entered in the
table. It has four columns:
Old value/default value: The adaptation value read out of the control unit.
Test value: The current test value. Initially identical to the value in the Old value/default value column.
Input: The value entered by the user. Initially identical to the value in the Old value/default value column.
Unit: The unit of the adaptation value, if entered.
There are four buttons below the table:
Select channel: Selects a channel selected in the list.
Apply: Writes the modified adaptation value into the control unit.
Reset: Resets the test value to the original value.
122
Diagnostic mode
Reset all: If test values were set on several channels, they are reset to their original values - provided the new
values have not yet been saved to the control unit using Apply.
If the control unit or data input support this function, the information area
the selected channel, e.g. its designation:
also displays more information on
Figure 6.99. Adaptation information area
To change the adaptation value of a channel, perform the following steps:
1.
2.
Select a channel from the
Click on the Select channel button or double-click on the desired channel. Then, the current channel value
is displayed in the
3.
list.
table.
Change the adaptation value in the Input table column and confirm it with Enter. Then, the value is sent to
the control unit first as the new test value. This procedure may be repeated any number of times.
Example:
In the figures above, channel 4 was selected. For the dash panel insert/instrument cluster control unit used
in the example, the language displayed is set at this channel. The value 1 stands for German and the value 2
for English. If the user sets the test value to 2, all messages are shown on the display panel of the instrument
cluster in English until a different test value is entered, the Reset button is used or a different channel is
selected.
As long as the modified value has not yet been saved to the control unit, the user can reset the test value to
the initial value by clicking on the Reset button (i.e. to the value in the Old value/default value column).
The test value is also reset if a new channel is selected or on changing or closing the tab.
If the new value is invalid, an error message informs the user of this and the value is not stored in the control
unit as the test value:
Figure 6.100. Error message in the event of an invalid adaptation value
4.
If the correct test value was determined, click on the Apply button to save it to the control unit. Only then
is the value in the Old value/default value column set to the new value. After saving the value, the Reset
button is disabled. Both values are also disabled if the value in the Input field and the value in the Old
value/default value field are identical.
123
Diagnostic mode
On saving values, whether the value to be written is valid is checked - like for setting test values. If that is not the
case, the error message described in step 3 appears and the write operation is cancelled.
6.6.2.1.2. Control units with UDS protocol
For UDS control units, when switching from the Adaptation tab, all available adaptation functions of the selected
control unit are listed in a table. They can be used to change the adaptation values of the control unit.
This is illustrated in the following figure using the control unit with diagnostic address 17 (instrument cluster/dash
panel insert):
Figure 6.101. Adaptation UDS
This is illustrated in the following figure using the control unit with diagnostic address 17 (instrument cluster/dash
panel insert, 17 - KAL tab).
The table of adaptation functions has four columns:
Adaptation/parameter: The name of the adaptation function or parameter.
Old value: The parameter value read out of the control unit.
Input: The new parameter value. To change the value, click in the Input column of the desired parameter. Depending on the type of parameter, the new value may be selected from a list
Unit: The unit of the adaptation value.
124
or entered as desired.
Diagnostic mode
Every adaptation function
has parameters
. By default, they are displayed in closed form; they can be
displayed by double-clicking in the row or by clicking on + in front of the function's name. Another double click
or a click on - closes the parameter list again.
To open the parameters of all functions in one go, click on the
button on the right below the table. In the
same way, clicking on
closes all open parameter lists again. Depending on the number of available functions,
opening may take a while.
Note:
When you close one or more parameter lists, all values that have not yet been saved are lost. The user is informed
about this by a message:
Figure 6.102. Warning on closing the parameter list
Yes: The values entered are discarded and the parameter list is closed.
No: The parameter list remains open and the values entered are retained.
There are three buttons below the table:
Restore: Restores the values of the selected adaptation function saved to the control unit before the last write
operation. Clicking on the button displays the values last used in the Input column. To write the restored values
into the control unit, click on the Apply button.
Reset all: Restores the values of all adaptation functions saved to the control unit before the last write operation.
Clicking on the button displays the values last used in the Input column. To write the restored values into the
control unit, click on the Apply button.
Apply: After changing the values of all desired adaptation functions, you can save them by clicking on the Apply
button. Then, the user needs to confirm this:
Figure 6.103. Confirmation prompt before performing the adaptation
Yes: The new adaptation values are written.
125
Diagnostic mode
No: The adaptation values are not written into the control unit.
Reset control units: This option is only active for control units that support this function. If the tick is set, the
control unit is reset after writing the adaptation values.
Before saving the values, the validity of the parameter values entered freely is checked. If this check is not successful, the values are not written into the control unit and an error message informs the user of the cause:
Figure 6.104. Error message in the event of an invalid adaptation value
If the new values were saved successfully, they are displayed in the Current value column.
6.6.2.2. Coding
Depending on whether coding is to be performed on KWP or UDS control units, configuration and operation will
deviate.
The selection of the subsystem to be coded, i.e. of the control unit subordinate to the current control unit, is the
same in both cases:
1.
Whether subsystems are available is checked.
2.
The system names of all available subsystems are displayed in a selection list. There is normally no default
entry, instead the text "Please select subsystem" is displayed in the list.
3.
The user selects a subsystem or the control unit.
4.
The current code of the control unit is read automatically.
If the control unit does not have any subsystems, steps 2 and 3 are omitted. Then, on opening the Coding tab, the
control unit is selected automatically and the code is also read directly.
The subsequent steps deviate, depending on the diagnostic protocol and type of code.
Note:
Gateway control units represent an exception. The Coding function cannot be selected for these control units.
126
Diagnostic mode
6.6.2.2.1. Coding on KWP control units
The Coding function for KWP control units is explained below. There are two possible code types for these
control units, the short code and the long code. The type of code depends on the control unit and cannot be
changed by the user.
1.
Short code
Figure 6.105. Short code
Apply: Writes the code into the control unit.
Restore: Enters the value last coded in the New code field. Click on Apply to save the restored code to the
control unit.
After opening the tab or selecting the desired subsystem, the code is read out of the control unit and displayed
in the Old code field. The new value can be entered in the New code field and confirmed using the Enter
key. That enables the Apply button.
After pressing the Apply button, a message appears with a confirmation prompt.
Figure 6.106. Confirmation prompt before coding
Yes: Writes the new code value into the control unit.
127
Diagnostic mode
No: Writing is not performed.
If coding was successful, another message is displayed:
Figure 6.107. Success message after coding
After confirming the message, the user is requested to reset the control unit:
Figure 6.108. Request to reset the ignition
To do this, switch the ignition key to the "Off" position and then back to its former position.
Now, the old value is also displayed in the Old code display field, followed by the original code value in
brackets:
Figure 6.109. New and old code
This procedure may be repeated any number of times. If coding was not successful due to an invalid value or
other problems, a corresponding error message informs the user of this and the current code is not changed.
Depending on the type of error that occurred, the messages may differ, e.g. stating that communication with
the vehicle could not be established. After rectifying the problem, coding can be repeated. Any example of
an error message is shown in the following figure:
Figure 6.110. Error message during coding due to missing data
2.
Long code
128
Diagnostic mode
With the long code, the values to be coded are displayed in the form of a bit field consisting of up to 32
bytes. It is displayed in binary and in hexadecimal representation. It is displayed in the same way as for the
binary code for UDS control units.
Reference:
See "UDS binary code".
6.6.2.2.2. Coding on UDS control units
For UDS control units, there is a binary code and a plain text code. These are different representations of the
same type of code. If supported by data input, after calling the Code function and possibly selecting the subsystem
the plain text code is displayed by default. Otherwise, the binary code is displayed.
1.
UDS binary code and KWP long code
The representation of the binary code for UDS control units and of the long code for KWP control units is
identical. The following description applies to the binary code, but also applies to the long code in the same
way.
The code string is displayed in a table view. Every row of the table corresponds to a byte of the code string:
Figure 6.111. Binary code
The table has five columns:
Byte no..: The byte number in the code string.
129
Diagnostic mode
Current value, hex: The value in hexadecimal representation.
Current value, binary: The value in binary representation.
Input, hex: The user's entry in hexadecimal representation.
Input, binary: The user's entry in binary representation.
There are three buttons below the table:
Apply: Writes the modified code string into the control unit.
Restore: Restores the code last used.
Plain text code: Switches to plaint text code representation, if supported by the control unit. Otherwise,
the button is disabled.
The value may be changed in binary form as well as in hexadecimal form. If you click in one of the two
cells, a new input screen will appear:
Figure 6.112. User input for binary code
If one of the two values is changed, the corresponding binary or hexadecimal value is automatically updated
during input. Closing the dialogue discards the changes.
Apply: The changes are added to the table.
Cancel: The changes are discarded.
Once all changes have been made as desired, the checksum corresponding to the code string must be entered
in the Checksum text field. It can be calculated as follows:
The code string is split up into 2-byte groups. If the byte number is odd, the value 00 is attached to the end
of the byte. The values are added up, any out-of-range value is cut off.
130
Diagnostic mode
Example:
Code string: F0 01 02 04 08 10 20
F001 +
0204 +
0810 +
2000
11A15 & 0xFFFF = 1A15
Checksum: 1A15
To write the code into the control unit, the user must click on the Apply button. Before saving the code, a
query appears.
Figure 6.113. Confirmation prompt before binary coding
Yes: The code string is checked for errors using the checksum.
No: Coding is cancelled.
If "Reset control units" is ticked, an automatic reset is performed after coding, i.e. the control unit is automatically switched off and back on again. If not, the user will need to perform a manual reset after coding,
i.e. switch the ignition key once to the "Off" position and then back to its former position.
If there is no entry in the Checksum field, a warning is displayed:
Figure 6.114. Note on missing checksum during binary coding
Yes: Writes the code string into the control unit.
No: The code string is not written.
If a checksum was entered that does not correspond to the code string, the following message is displayed:
131
Diagnostic mode
Figure 6.115. Note on incorrect checksum during binary coding
Yes: Still writes the code string into the control unit.
No: The code string is not written.
If coding was successful, another message is displayed:
Figure 6.116. Success message after coding
The new parameter values are now displayed in the table.
In the event of an error, an error message informs the user of the reason why the code not could not be saved:
Depending on the type of error that occurred, the messages may differ, e.g. stating that communication with
the vehicle could not be established.
After rectifying the problem, coding can be repeated.
Reference:
See also "Error messages" chapter.
If coding was successful and no automatic control unit reset was performed, after confirming the message
the user is requested to manually reset the control unit:
Figure 6.117. Request to reset the ignition
To do this, switch the ignition key to the "Off" position and then back to its former position.
For UDS control units that support this option, the user can click on the Plain text button to switch to the
view for plain text coding. Changes already made in the binary view are not applied. In this case, the user
is informed about this by a message:
132
Diagnostic mode
Figure 6.118. Warning when switching to plain text code
Yes: Switches to the plain text code view. Any changes in the binary view are lost.
No: Does not switch to the plain text code view. Changes in the binary view are retained.
If the code was saved without errors, the Restore button is enabled. Click on this button to restore the code
last used. To write the restored code into the control unit, click on the Apply button again.
2.
Plain text code
When you switch to the plain text code, the current code string is read out of the control unit and split up into
its individual parameters. They are displayed in the table along with their designation and read-out value.
Figure 6.119. UDS plain text code
The table has five columns:
Parameter name: The name of the parameter in the code string.
Current value: The current code value.
133
Diagnostic mode
Input: The user name entry.
There are three buttons below the table:
Apply: Writes the modified code string into the control unit.
Restore: Restores the code last used.
Binary code: Switches to binary code representation.
To change the value of a parameter, the user must click on the desired parameter row in the input column.
The new value can now be selected from a selection list.
For this type of code, it is not necessary to enter a checksum since only the code values from data input and
thus valid values can be selected.
Coding is started after clicking on the Apply button. With the exception of checking the checksum, the process
is the same as for binary coding and is described there.
Reference:
See "UDS binary code".
6.6.2.3. Event memory
The Event memory function reads the current contents of the event memory of a control unit. It also provides
the option of erasing the event memory.
134
Diagnostic mode
Figure 6.120. KWP event memory
The contents of the event memory are displayed in two tables arranged on top of each other. The table at the top
lists all events read out of the selected control unit. It has four columns:
Event code: The code number of the event.
SAE code: The code number of the event in SAE format.
Event text: The description of the event.
active: Indicates whether the event is active or not.
If you click on an event line,
the table at the bottom
lists the ambient conditions. They represent additional
information on the selected event, such as mileage, date, fault status etc. The number and type of these pieces of
information may deviate partially from one control unit to another. The table has two columns:
Type/name: The type of information.
Value: The value read.
A + may precede the designators. That means that they represent a group of individual pieces of information that
can be opened by clicking on +. If the group is open, - is displayed in front of its main entry. Click on this symbol
to close the group again.
There are three areas for additional functions to the right of the tables:
Refresh
: Clicking on the now button triggers re-reading of the event memory. Selecting the in cycles checkbox
initiates the reading of the event memory in cycles at the cycle time entered in the text field below. If the cycle
time is changed, click on the now button again to accept the new cycle time.
135
Diagnostic mode
Sort
: You can enter a criterion here by which the event memory entries are sorted in the table at the top.
Clicking on the column headings of the table at the top
reverses the sort order (ascending/descending). The
default sort order is descending by priority and the time of the occurrence of the events displayed:
Figure 6.121. Sorting the event memory entries
Delete : To delete the contents of the event memory in the selected control unit, click on the Event memory
button. A confirmation dialogue appears. The event memory is only erased after confirmation using the yes button.
Click on no to cancel the process.
Note:
After erasing an event memory, it is re-read immediately and its content is displayed. If the event memory is
not empty and still includes all or some events displayed before the erasure, the control unit did not accept the
command for erasing or the corresponding event was immediately re-entered since the cause of the error has not
been eliminated yet.
Event memory entries that have been deleted CANNOT be restored!
136
Diagnostic mode
Figure 6.122. UDS event memory
For UDS control units, in addition to the ambient conditions to the right of the table, another table is displayed
with information on the event status.
Name: The name of the status bit.
Value: The value of the status bit.
137
Diagnostic mode
6.6.2.4. Default setting
The configuration of the default setting and of the measured values to be displayed deviates, depending on whether
the function is executed on control units with KWP protocol or with UDS protocol.
6.6.2.4.1. Default setting on KWP control units
The steps for executing the Default setting function on a KWP control unit are explained below.
Figure 6.123. KWP default setting
Read measured values: Reads the measured values for a channel out of the control unit.
Default setting: Configures the default setting for a channel.
In the list on the left,
the desired setting channel can be marked and thus selected by clicking on it. The
available channels are displayed in a list, sorted in ascending order. Multiple selection is not possible. 254 channels
are available per control unit. All 254 channels are always displayed, regardless of whether some of them are not
being used by the current control unit. If a channel that is not used is selected, no measured values are displayed
and no default setting can be configured for this channel either.
No channel has a default setting to start with, and the Default setting button is disabled.
The second table
lists all measured values available for the selected channel.
Measured value name: The name of the measured value.
Value: The value returned by the control unit.
138
Diagnostic mode
Unit: The unit of the measured value.
First, select a channel from the list. Then, after clicking on the Read measured values button, the measured values
are read for this channel and displayed in the table. During this process, no settings are changed in the control unit.
The Read measured values button is now disabled and the Default setting button is enabled.
To start the process of defining settings, click on the Default setting button. Then all measured values displayed
are processed one after the other.
If a different channel is selected during the functional sequence and you click on the Read measured values
button, the process of defining settings is stopped and measured values are re-read.
Some default setting operations require the user's action. If that is the case, the required action is displayed in the
table of measured values for the currently active measured value. Once the action has been performed, the process
of defining settings is automatically continued.
When the default settings have been configured, the result is displayed in the Default settings for KWP - Status
field.
Example:
The necessary action "apply accelerator pedal" is displayed as the measured value. If the user performs this action,
this text disappears from the table of measured values and the process of defining settings is continued.
After configuring the default setting, the newly configured measured values are displayed. If the default setting
was not successful, a dialogue appears with an error message that needs to be confirmed by the user. Depending
on the type of error that occurred, the messages may differ, e.g. stating that communication with the vehicle could
not be established. After rectifying the problem, the process of configuring the default settings can be repeated.
Reference:
See also "Error messages" chapter.
139
Diagnostic mode
6.6.2.4.2. Default setting on UDS control units
For UDS control units, after selecting the default settings, parameters can be additionally set and measured values
selected. To do this, the following steps are required:
1.
Selecting the default settings
2.
Parametrisation of the default settings
3.
Selecting the measured values
4.
Configuration of the default settings
The individual steps are described in the following in detail.
Selecting the default settings
Figure 6.124. UDS default setting - Selection of the default settings
The desired default settings need to be selected from the initial view of the function. The available settings are
displayed in the left-hand list
. The right-hand list
contains the selected settings. It is empty to start with.
Moves the selected default settings from the left-hand list into the right-hand list.
Moves all default settings into the right-hand list.
140
Diagnostic mode
Moves the selected default settings from the right-hand list into the left-hand list.
Moves all default settings into the left-hand list.
The list of selected default settings
hand list.
can be sorted. To do this, select exactly one default setting from the right-
Moves the entry up one position.
Moves the entry down one position.
Switches to the next view, Parametrisation.
Parametrisation
Figure 6.125. UDS default setting - Parametrisation
Default parameters: To set all parameters to their corresponding default values, click on this button. Whether
values are missing or invalid is checked in this case and the relevant parameters and default settings are marked
accordingly.
The left-hand list
by default.
contains the default settings selected in the previous view. The first default setting is selected
141
Diagnostic mode
As soon as a default setting is selected, the right-hand table
displays the corresponding parameters. Depending
on the type of parameter, its value in the right-hand column may be selected from a pop-up menu or entered as
desired. If you enter the value freely, whether it is valid is checked. If problems are detected or if a value is missing,
the respective parameter is marked in red and the corresponding default setting is displayed in bold red characters.
Reference:
See also the Parametrisation problems figure in the "Actuator diagnosis" chapter.
Switches to the next view, the Measured value selection. As long as problems still exist during parametrisation, i.e. at least one parameter is marked in red, clicking on the button will cause an error message to be displayed.
You can only switch to the next view when all parameters have valid values, i.e. when no parameters are marked
in red any more.
Switches back to the previous view. Even if default settings are added or removed there, all settings made
are retained for the remaining default settings.
Reference:
See also "Error messages" chapter.
Measured value selection
Figure 6.126. UDS default setting - Measured value selection
This view can be used to select measured values for every default setting displayed during the process. In addition,
global measured values can also be selected, i.e. measured values that apply to all default settings.
142
Diagnostic mode
Figure 6.127. Selecting the default setting
The pop-up menu at the top
lists all previously selected default settings. The first entry is always "overall". The
measured values are assigned to this entry that do not apply to a specific default setting but to the entire control unit.
The available measured values are displayed for the default setting selected or for the "overall" entry on the lefthand side
. Like for the selection of default settings, the measured values to be displayed can be selected here.
The right-hand list
contains the selected measured values. It is empty to start with.
Moves the selected measured values from the left-hand list into the right-hand list.
Moves all measured values into the right-hand list.
Moves the selected measured values from the right-hand list into the left-hand list.
Moves all measured values into the left-hand list.
The list of selected measured values
right-hand list.
can be sorted. To do this, select exactly one measured value from the
Moves the entry up one position.
Moves the entry down one position.
Switches to the execution of the default settings.
Switches back to the previous view. Even if parameters are modified or default settings added or removed there,
the selection of measured values for the remaining default settings is retained.
143
Diagnostic mode
Configuration of the default settings
Figure 6.128. UDS default setting - Configuration
Name: The name of the default setting, measured value or group of measured values.
Value: The measured value.
The actual default setting for the control unit is configured in this view. A list at the top
displays the default
settings and – closed by default to start with – the corresponding measured values. Click on + to display these
measured values.
The list at the bottom
displays all global measured values and groups of measured values.
Measured values may be combined to groups. In this case, there is a + in front of the group designator and the
column on the right does not have any values. Click on + to open the group and display its measured values. Click
on - in front of the group designator to close the group again.
The status of the currently selected default setting is displayed above the two tree structures in the UDS default
settings - Status field. Some possible status indications may be: active, not active, ended.
To start with, the default settings to be configured need to be selected first. For this, you can select one or more
default settings by clicking on them.
starts the configuration of the default settings.
stops the configuration of the default settings.
stops all active default settings.
144
Diagnostic mode
switches to the next default setting.
switches back to the parametrisation. For this, the configuration of the default setting is interrupted. That
also applies if the tab is closed or exited. If the user then returns to the Configure default setting view, it is not
automatically continued but needs to be re-started manually.
If you clicked on
to switch to the next default setting, click on
to execute the currently selected default
setting. When it is finished, the process is continued with the next default setting in the list. Once the end of the
list has been reached, the first list entry follows. The measured values of the currently configured default setting
are open by default. All other are closed, however.
During this process, the
button is disabled and greyed out:
. Click on
to stop the currently configured
default setting. It can be continued with
. For this, the currently selected default setting is used to start, regardless of at which point the process was interrupted.
Some default setting operations require the user's action. If that is the case, the required action is displayed in the
table of measured values for the currently active measured value. Once the action has been performed, the process
of defining settings is automatically continued.
Reference:
See also the example for KWP control units.
After configuring the default setting, the newly configured measured values are displayed. If the default setting
was not successful, a dialogue appears with an error message that needs to be confirmed by the user. Depending
on the type of error that occurred, the messages may differ, e.g. stating that communication with the vehicle could
not be established. After rectifying the problem, the process of configuring the default settings can be repeated.
Reference:
See also "Error messages" chapter.
145
Diagnostic mode
6.6.2.5. Identification
The self-diagnosis function Identification is for reading various permanent values out of the control unit, such as
part number, software version etc. These values can only be displayed, they cannot be modified.
Figure 6.129. Results window of self-diagnosis identification
In this example, the control unit for the central electrics has been selected and identification has been performed.
The table at the top
has four columns containing information read out of the control unit.
System identification: The name of the control unit.
Part number: The unique part number of the control unit.
Software version: The current software version.
Workshop code: The workshop code.
The main control unit addressed is displayed in the very top row of the table. Further auxiliary control units that
can be accessed via the main control unit are displayed in the following rows – if available. This is the wiper
module in the example above.
To display additional identification characteristics, select the respective entry in the table at the top.
For the information displayed in the table at the bottom
the user can switch between the standard identification
characteristics and the extended identification characteristics of the system selected above. The Show extended
146
Diagnostic mode
identification button is used for this purpose. If it is confirmed, the extended identification is displayed and the
button is given the caption: Show standard identification. After selecting an entry from the upper table, the
standard identification is automatically displayed first.
6.6.2.6. Measured values
The control unit for which the selection has been made is shown in the upper left part of the tab. The example
shows the engine's electronics. The Measured values tab has two views: one for configuring the measured values
to be recorded (see figure at the top) and one for displaying the test results. After compiling the measured values
to be displayed in the first view, as shown in the figure above, use the Display measured values button to open
the measured value display.
The configuration of the measured values to be displayed deviates, depending on whether the measured values
were read by control units with KWP protocol or by control units with UDS protocol.
6.6.2.6.1. Measured values with KWP control units
The measured values to be read out must be selected first:
Figure 6.130. Measured value selection (KWP)
For control units with KWP protocol, measured value blocks are read out with up to four measured values. The
measured value block numbers (1 to 254) and, if necessary, the measured value position within the corresponding
measured value block are entered in the Block.Position text field, separated by a dot. After the entry has been
made, the Apply button is enabled. If a block number outside the valid value range is entered, Apply remains
disabled.
Click on Apply to transfer the entry to the right-hand list
containing the selected measured values. If only
the block number is entered, when you click on Apply all four measured values of this block are displayed. By
147
Diagnostic mode
entering further measured values, any number of measured values from different blocks can be configured for
the display.
Example:
Input: 8
Apply
Applied selection: 8.1, 8.2, 8.3, 8.4
• All measured values of the block are applied.
Input: 1.2
Apply
Applied selection: 1.2
• Only the measured value at the selected position is applied
Clicking on the required measured value block in one of the two lists enables the buttons for moving.
Moves the selected measured value blocks into the left-hand list
Moves the selected measured value blocks into the right-hand list
.
.
Moves all measured value blocks into the left-hand list
Moves all measured value blocks into the right-hand list
The list of selected measured value blocks
can be sorted:
Moves the selected entry up one position.
Moves the selected entry down one position.
These buttons can be used in the same way for UDS control units after selecting the measured value designators,
as described above.
Clicking on the Display measured value button displays the measured values for the measured value blocks in
the right-hand table in the results view. At the same time, the current measured values are read out and displayed
in a table.
148
Diagnostic mode
Figure 6.131. KWP measured value display
Measured value name: The name of the measured value block.
Value: The measured value.
Updating the measured values can be controlled using the control elements in the Update area. In the standard
case, the measured values are updated in cycles as soon as possible.
You can set the desired update interval in seconds in a text field. Update in cycles can be deactivated by deselecting
the "in cycles" checkbox. If this option is deselected, you can update the measured values specifically using the
now button.
You can use the Select measured values button to return to the initial view and then change the selection of the
measured values to be displayed.
149
Diagnostic mode
6.6.2.7. Actuator diagnosis
Configuration of the actuator diagnosis and of the measured values to be displayed deviates, depending on whether
the function is executed on control units with KWP protocol or with UDS protocol.
6.6.2.7.1. Actuator diagnosis on KWP control units
Figure 6.132. KWP actuator diagnosis
Measured value name: The name of the measured value
Value: The measured value.
Unit: The unit of the measured value.
For control units with KWP protocol, you can choose between selective and sequential actuator diagnosis.
The selection is set to Sequential by default. Depending on the control unit, not all diagnostic types are supported.
In this case, the buttons are disabled.
Figure 6.133. Buttons for actuator diagnosis
Starts actuator diagnosis.
150
Diagnostic mode
Switches to the next actuator (not supported by all control units).
Stops actuator diagnosis.
If the user enters a numeric actuator code, selective actuator diagnosis is automatically active.
If the user wants to switch back to sequential actuator diagnosis after entering a code, the entered code must
be deleted first. Only then can Sequential be selected again. It is not possible to select both sequential actuator
diagnosis and an actuator code.
Only if one of the two options is selected - and this is also supported by the control unit - is the
Click on this button to start actuator diagnosis.
1.
button enabled.
Selective actuator diagnosis (KWP 1281 and KWP 2000)
The actuator test is started and the text field for the actuator code is blocked until the function has been ended
or cancelled.
2.
Sequential actuator diagnosis (KWP 2000 only)
After starting the diagnosis of the first actuator, the
button and the text field for the actuator code are
disabled until the function has ended itself or is cancelled by the user clicking on the
button.
Some control units permit diagnosis to be continued on the next actuator during the functional sequence. In
this case, the
button is enabled while the function is in progress. Click on this button to stop diagnosis
on the current actuator and continue it on the next actuator.
For control units that use the KWP 2000 protocol, measured values are read in cycles by the control unit in addition
to the diagnostic status. A selection is not possible. The measured values displayed are specified by the control unit.
When actuator diagnosis is finished, the test result is displayed in the Actuator diagnosis - Status field.
Figure 6.134. Actuator diagnosis status
If additional values were read by the control unit, they are displayed in the Measured values table. The left-hand
column contains the name of the measured value, the measured value is displayed in the column in the middle
and its unit is displayed in the right-hand column.
151
Diagnostic mode
6.6.2.7.2. Actuator diagnosis on UDS control units
For control units with UDS protocol, actuator diagnosis can be configured more extensively. After selecting the
Actuator diagnosis function for a UDS control unit, the user is first taken to the Actuator selection view (see fig.
UDS actuator selection). A list of the available actuators of the control unit appears, which that can be parametrised
individually. The actuator tests selected and configured this way can then be performed in succession or simultaneously.
The function can be exited in all states by closing the tab. If the tab is exited (e.g. by selecting a different tab) or
if the view is changed, the status of the function is retained in terms of parametrisation. However, all currently
active actuator tests are stopped. That also applies if you switch from the conduction of actuator diagnosis back to
the parametrisation. It is therefore not possible to add or parametrise individual actuators during an active actuator
diagnosis.
The four phases of actuator diagnosis for UDS control units are described in the following in detail.
1.
Actuator selection
Figure 6.135. UDS actuator selection
The left-hand list
in this view contains all actuators available for the selected control unit. This list can
be sorted alphabetically by clicking on the column heading. The right-hand list
be tested. It is empty to start with.
contains the actuators to
You can select one or more actuators either by clicking on them or using the keyboard. The first actuator
is selected that starts with the letter entered. If the same letter is entered again, the next element with this
initial letter is selected.
Reference:
More information on using the keyboard is available in the table of "Shortcuts".
152
Diagnostic mode
Clicking on an actuator in one of the two lists enables the buttons for moving.
Moves the selected actuators into the left-hand list
Moves the selected actuators into the right-hand list
.
.
Moves all actuators into the left-hand list.
Moves all actuators into the right-hand list.
The list of selected actuators
can be sorted:
Moves the selected entry up one position.
Moves the selected entry down one position.
Switches to the next view, Parametrisation.
2.
Parametrisation
Figure 6.136. UDS actuator parametrisation
The left-hand list
default.
contains the actuators selected in the previous view. The first actuator is selected by
The available parameters are displayed for each actuator selected in the right-hand table
. Depending on
the type of parameter, its value in the right-hand column may be selected from a pop-up menu or entered as
153
Diagnostic mode
desired. If you enter the value freely, whether it is valid is checked. If problems are detected or if a value is
missing, the respective parameter is marked in red and the corresponding actuator is displayed in bold red
characters:
Figure 6.137. UDS actuator diagnosis - Parametrisation problems
To set all parameters to their corresponding default values, click on the Default parameters button. Whether
values are missing or invalid is checked in this case too, and the relevant parameters and actuators are marked
accordingly.
Switches to the next view, the Measured value selection. As long as problems still exist during
parametrisation, i.e. at least one parameter is marked in red, clicking on the button will cause an error message
to be displayed informing the user that there is still a data problem. You can only switch to the next view
when all parameters have valid values, i.e. when no parameters are marked in red any more.
Switches back to the previous view. Even if actuators were added or removed there, all settings made
are retained for the remaining actuators.
Reference:
See also chapter "Error messages"
3.
Measured value selection
154
Diagnostic mode
Figure 6.138. UDS measured value selection
This view can be used to select measured values for every actuator displayed during the conduction of the
actuator tests. In addition, global measured values can be selected for actuators.
Figure 6.139. Selecting the actuator
The pop-up menu at the top
lists all previously selected actuators. The first entry is always the "overall"
value to which the measured values are assigned that do not apply to a specific actuator but to the entire
control unit.
The left-hand list
displays the measured values available for the selected actuator or for the "overall"
entry. Like for the selection of actuators, the measured values to be displayed can be selected here. The righthand list
contains the selected measured values. It is empty to start with.
Clicking on a measured value in one of the two lists enables the buttons for moving.
Moves the selected measured values into the left-hand list
Moves the selected measured values into the right-hand list
Moves all measured values into the left-hand list.
Moves all measured values into the right-hand list.
155
.
.
Diagnostic mode
The list of selected measured values
can be sorted:
Moves the selected entry up one position.
Moves the selected entry down one position.
Reference:
The measured values can also be selected using the keyboard. Information on using the keyboard is available
in the table of shortcuts.
Switches to the conduction of the actuator diagnosis.
Switches back to the previous view. Even if parameters are modified or actuators added or removed
there, the selection of measured values for the remaining actuators is retained.
4.
Conduction of actuator diagnosis
Figure 6.140. UDS actuator diagnosis
The actual actuator diagnosis is performed in this view. At the top, the selected actuators and, closed by
default to start with, the corresponding measured values are displayed in a tree structure
. Click on + to
display these measured values. The actuator parameters and their values are displayed if you move the mouse
pointer over an actuator.
All global measured values for actuators are displayed in the tree structure
156
at the bottom.
Diagnostic mode
Measured values may be combined to groups. In this case, there is a + in front of the group designator and the
column on the right does not have any values. Click on + to open the group and display its measured values.
Click on - in front of the group designator to close the group again.
The status of the currently selected actuator test is displayed above the two tree structures in the Actuator
diagnosis - Status field. Some possible status messages may be: active, not active, ended.
To start actuator diagnosis, the actuators to be checked need to be selected first. You can select one or more
actuators by clicking on them.
Starts the selective actuator test.
Stops the actuator test.
Stops all active actuator tests.
Switches to the next actuator.
Switches to the previous view. All actuator tests are stopped when this is done. That also applies if the
tab is closed. If the user then returns to the Perform actuator diagnosis view, the actuator tests are not
automatically continued but need to be re-started manually.
Note:
Figure 6.141. Example of the actuator test on several actuators
The
and
buttons always only apply to the currently selected actuator test.
For example, if you select the actuators
If you then reduce the selection to actuators
stopped, while actuator
to
before starting, these tests are started by clicking on
and
and click on
, only the actuators
and
.
are
continues. Mutually independent actuators may be started and stopped at all times.
The
button can be used to also perform a sequential actuator test for a UDS control unit. For this, no
other actuator test may be active. In addition, exactly one actuator must be selected in the list on the left. If
both conditions are fulfilled, the button is enabled.
157
Diagnostic mode
Click on
to switch to the next actuator and click on
list has been reached, clicking on
performed actuator test are opened.
Click on the
to start the test for this actuator. If the end of the
takes you to the first list entry. The measured values of the currently
to stop the currently active actuator test. The sequential actuator test can be continued with
and
. The test is started with the currently selected actuator, regardless of at which point the test was
interrupted.
Special features when using the keyboard
Some settings can also be made using shortcuts with the keyboard. The following shortcuts are available:
Shortcut
Function
CTRL + A
Selects all entries in a table
Tab key
For views with two selection lists: switches between the
two lists
CTRL + left arrow
For views with two selection lists: moves an element
from the right-hand list to the left-hand list
CTRL + right arrow
For views with two selection lists: moves an element
from the left-hand list to the right-hand list
CTRL + up arrow
Moves the selected element one position up within a selection list
CTRL + down arrow
Moves the selected element one position down within a
selection list
Shift + left arrow
Switches back to the previous view
Shift + right arrow
Switches to the next view
CTRL + P
Starts the actuator test (Play)
CTRL + S
Stops the actuator test (Stop)
CTRL + N
While an actuator test is in progress: Next actuator (corresponds to the
ESC
button)
In the actuator diagnosis conduction view: corresponds
to the
Table 6.4. Table of keyboard shortcuts
158
button.
Diagnostic mode
6.6.2.8. Access authorisation
A dialogue opens with different contents, depending on the protocol.
6.6.2.8.1. Control units with KWP 1281 protocol
For control units that use the KWP 1281 protocol, access authorisation is performed automatically after clicking
on the function. A message informs the user whether login was successful.
6.6.2.8.2. Control units with KWP 2000 or UDS protocol
After selecting the Access authorisation function, a dialogue opens with different contents, depending on the
protocol.
Figure 6.142. Access authorisation
Back: Switches back to the previous dialogue.
Next: Switches to the next dialogue.
Done: Performs access authorisation.
Cancel: Cancels access authorisation.
For control units with KWP 2000 or UDS protocol, there are several ways to perform access authorisation.
For KWP 2000, there are the following options:
•
Code 2
•
Security access automatic
•
Security access level 3/4
•
Security access level 5/6
The UDS protocol supports these options:
•
Login
•
System-specific access authorisation
Which of these options is displayed in the list for selection, depends on the corresponding control unit.
159
Diagnostic mode
To perform access authorisation, select the desired option and confirm it by clicking on Continue. A new dialogue
appears, in which a numeric code needs to be entered in the Login code field for authentication.
Figure 6.143. Access authorisation - Authentication
After clicking on the Continue button, authentication is performed and the result of the function is displayed. If
authentication was successful, "Successful!" is displayed there. If it failed, a message is displayed accordingly. If
available, more information on the cause of the error is displayed.
Click on Details to have any additional information displayed, if required.
Figure 6.144. Access authorisation - Successful
Figure 6.145. Access authorisation - Unsuccessful
160
Diagnostic mode
You can use the Done button to end the method.
In addition, the user can use the Back button in every dialogue to switch to the previous step to re-enter the
authentication code or select another authentication method.
To cancel the process in any dialogue, click on the Cancel button.
6.6.3. Vehicle-specific functions
6.6.3.1. Event memories for overall system
The Event memories for overall system function reads the event memories of all control units installed in the
vehicle.
Figure 6.146. Event memories for overall system
The view consists of a table with three columns:
Address: The diagnostic address of the control unit.
System: The name of the control unit.
Event: The number of events read.
On switching to the view, the table is automatically updated, i.e. an attempt is made to read the events that occurred
in each control unit installed.
If the control unit's event memory is empty, 0 is entered in green text in the same column. For control units with
entries in the event memory, the number of events is displayed in red in the Event column. In addition, a + is
161
Diagnostic mode
displayed in front of the diagnostic address. If the user clicks on it, the events that occurred are listed in detail.
Additional information on an event can be displayed by clicking on the + in front of the event.
If it was not possible to read the event memory of a control unit, the Event column for this control unit remains
empty.
The user has two ways of updating the table: by clicking on the now button or by ticking the in cycles option.
In the first case, the table is updated exactly once. To stop the update, click on the Cancel button.
If the user selects update in cycles, the table is updated continuously according to the interval displayed in the
text box under the option. The value must be entered in seconds. By default, an interval of 30 seconds is used. If
no value is entered, the value last entered is used. If the interval is shorter than the time required for the update,
reading is started again immediately after finishing a reading cycle. The interval may be changed during the update
in cycles. The new value needs to be confirmed using the Return key. To stop updates in cycles, remove the tick
from the in cycles option. It is also possible to update the table immediately between two cycles by clicking on
the now button.
After reading all event memories, double-click on a table row to select the Read event memory function for the
corresponding control unit (the prerequisite for this is that it was possible to read the control unit's event memory).
As a result, the content of the event memory of the selected control unit is displayed on a new tab.
Reference:
See "Event memory" chapter.
Once the event memory has been read completely at least once, the user may erase the event memory of the
overall system. For this, there are several methods that depend on the control unit or vehicle. For example, the
error memories can be erased together in one go or in succession:
Figure 6.147. Selecting the method for erasing the event memory
To erase the event memory in one go, select Overall system from the list in this example (it is already selected
by default) and confirm this by clicking on the Execute button. A confirmation prompt appears:
Figure 6.148. Warning before erasing the event memory
Yes: The event memories of all control units that support this function will be erased.
No: Erasure will not be performed.
After completing the erasure, any errors that occurred are displayed in a dialogue. If the method was successful,
no other messages are displayed.
To erase the event memories of the control units one after the other, select Individual from the list. The confirmation prompt above appears here as well, which needs to be confirmed by the user with OK. Then, the event
162
Diagnostic mode
memories of the control units are erased one after the other. After each erasure, the event memory of the control
unit is re-read and the result is displayed in a table.
Note:
After erasing an event memory, it is re-read immediately and its content is displayed. If the event memory is
not empty and still includes all or some events displayed before the erasure, the control unit did not accept the
command for erasing or the corresponding event was immediately re-entered since the cause of the error has not
been eliminated yet.
Event memory entries that have been deleted CANNOT be restored!
6.6.3.2. Transport mode
The following dialogue appears:
Figure 6.149. Transport mode
Execute: Executes the selected function.
Done: Closes the dialogue.
Cancel: Cancels the changing of transport mode.
To switch transport mode on or off, the corresponding list entry needs to be selected and confirmed by clicking
on the "Execute" button. The result of the function (successful / not successful) is displayed in the information
area above the list:
Figure 6.150. Success message after changing transport mode
In the event of an error, a new message appears with detailed information on the error:
Reference:
See also chapter "Error messages"
163
Diagnostic mode
Figure 6.151. Transport mode
Depending on the type of error that occurred, an additional message may be displayed with details (e.g. that the
vehicle could not be connected). After eliminating the problem, a new attempt can be made to change transport
mode.
164
Diagnostic mode
6.6.3.3. Installation list
The actual installation coded in the vehicle is displayed in the installation list. In addition, the number of events
that occurred for each control unit is displayed, if available.
Figure 6.152. Installation list
Address: The diagnostic address of the control unit.
System: The name of the control unit.
SB: Sleep bit. Indicates whether the vehicle bus is in standby mode.
Event: The number of events in the control unit's event memory.
Available subsystems are also displayed. If a control unit has subsystems, i.e. subordinate control units, this is
indicated by a +. Click on it to open the subsystems. The first level is open by default. In the example here, that
is the diagnostic interface, to which all other control units are subordinate.
165
Diagnostic mode
Control units for which events occurred are marked in red. In addition, the number of events is displayed in the
"Event" column.
Control units coded as installed but that cannot be addressed, are marked in red and displayed in bold characters:
Figure 6.153. View in the event of faulty communication with a control unit
The installation list can be updated manually or in cycles. For a single, manual update, use the now button.
If the user selects update in cycles, the table is updated continuously according to the interval displayed in the
text box under the option. The value must be entered in seconds. If the interval is shorter than the time required
for the update, reading is started again immediately after finishing a reading cycle. The interval may be changed
during the update in cycles. The new value needs to be confirmed using the Return key. To stop updates in cycles,
remove the tick from the in cycles option. It is also possible to update the table immediately between two cycles
by clicking on the now button.
166
Chapter 7. Flash mode
After the diagnosis, Offboard Diagnostic Information System Service also provides the option of flashing.
The workflow in flash mode is very similar to the one in diagnostic mode, but not as extensive. Guided fault
finding and the functions for the control units are not available here.
Figure 7.1. Workflow in flash mode
•
During flash start-up, the vehicle is connected to the test device and identified, login to the Group systems is
performed, an order is selected for the session and the control units are identified.
•
Then, the flash programs determined for the vehicle can be executed.
•
If the desired flash programs have been completed, the flash session can be ended.
167
Flash mode
7.1. Starting flashing
In the Start flashing section, the vehicle is connected to the test device and flash start-up takes place.
Figure 7.2. Start flashing section
After selecting the mode with the same name, flashing is available.
Connecting the vehicle is described in detail in the Starting diagnosis chapter.
Reference:
For more details on vehicle identification, see the "Starting diagnosis" chapter.
Note:
For legal reasons, not every diagnostic connection can be used for flashing, e.g. radio connections. If a diagnostic
connection is used for flashing that is not permitted, Offboard Diagnostic Information System Service will
display an appropriate warning and request that you use a connection with legal approval.
Reference:
For a detailed description of how to change the diagnostic hardware, see "VCI".
168
Flash mode
If a permitted diagnostic connection has been selected and the vehicle is connected, flash start-up can begin.
Figure 7.3. Start window for flash start-up
Click on Start flashing to start flash start-up.
169
Flash mode
7.2. Vehicle identification
The vehicle is identified after starting flash start-up.
Figure 7.4. Identify vehicle section
Offboard Diagnostic Information System Service attempts an automatic vehicle analysis first.
Figure 7.5. Vehicle analysis during flash start-up
If the vehicle is identified completely, i.e. VIN, brand, model and model year are unambiguous and familiar,
vehicle identification is performed fully automatically without displaying a basic vehicle characteristics dialogue.
170
Flash mode
If automatic vehicle identification fails, Offboard Diagnostic Information System Service displays a basic vehicle characteristics dialogue with information on the VIN, manufacturer, model and model year.
Figure 7.6. Manual vehicle identification
This dialogue can be used for the manual selection of the essential basic vehicle characteristics.
Apply: The selected basic vehicle characteristics are applied and flash start-up is continued.
Cancel: Vehicle identification is cancelled.
Reference:
A detailed description of the basic vehicle characteristics dialogue is available in the "Basic characteristics dialogue
(GMD)" chapter.
Note that the GMD for flash start-up is less detailed.
It is possible to switch between manual and automatic vehicle identification.
171
Flash mode
Figure 7.7. Automatic vehicle identification
For example, the VIN can be entered manually and subsequent identification performed automatically, if possible.
During automatic vehicle identification, the basic characteristics on a grey background cannot be changed any
more.
Apply: Flash start-up is continued.
Cancel: Vehicle identification is cancelled.
Vehicle identification is thus completed.
7.3. Login to the Group systems
Login to the Group systems takes place in the next flash start-up section.
Figure 7.8. Login to Group systems section
To login, Offboard Diagnostic Information System Service opens a login window.
172
Flash mode
Figure 7.9. Login window to the Group systems
Login takes place once per session. The global user ID and the password for access to the Group systems are
required for login.
Apply: The login data is sent to the Group systems.
Cancel: The login data is discarded. Authorised dealers may repeat login at all times.
This button is available in all views of Offboard Diagnostic Information System Service that obtain data
from Group systems. It can be used to repeat login at all times.
Note:
Offboard Diagnostic Information System Service only provides the option of diagnosis and flashing for the
licensed brands.
Which vehicle models of this brand are available depends on the type of dealer of a brand in the licence. All
vehicle models are available to a licensed authorised dealer, dealer type = H.
Only EU vehicles are available to a licensed unaffiliated market participant, dealer type = U, of a brand.
It is possible to check the contents of the licence in the administration area:
See also "Administration/General/Licence info"
An unaffiliated market participant must log on to the Group systems online at the start of a diagnostic or flash
session to enable diagnostic or flash start-up.
If login is cancelled, Offboard Diagnostic Information System Service returns to the start screen.
After login, Offboard Diagnostic Information System Service displays the remaining duration of validity of
the diagnostic flat rate in days and hours in the Information area of the user interface under Time remaining.
In addition, the orders and vehicle history are not available to the unaffiliated market participant.
Reference:
See also chapter "Login to Group systems"
173
Flash mode
7.4. Selecting orders
After login to the Group systems, an order is selected for the flash session or created manually.
Figure 7.10. Select order section
If login is successful, Offboard Diagnostic Information System Service selects the order data for the current
vehicle from ElsaPro.
Figure 7.11. Selecting an order for flashing
174
Flash mode
Offboard Diagnostic Information System Service switches to the Orders tab and displays a list of all orders
available for the vehicle.
The order number is displayed under Order, the current status in the SCP process under SCP status, and the
vehicle's licence plate number, the date of the order and a descriptive text on the order are displayed in the
order list.
The meaning of the SCP status numbers is listed in the following table.
SCP status no.
Description
1
Scheduling appointment
2
Preparing for appointment
3
Vehicle reception
4
Work processes
5
Quality control
6
Vehicle return
7
Follow-up
8
Completed
Table 7.1. Meaning of the SCP status numbers
If an order from ElsaPro is to be used, the desired order needs to be marked for this.
Select order: Click on this button to continue flash start-up with the order from ElsaPro.
However, it is also possible to create an order manually. For this, a standard order for working with manual
order number is marked in the list.
Enter no... : Click on this button to open a window for entering the manual order number required here.
Select order: Flash start-up is continued with the manual order.
Without order: If work is to be performed without an order, flash start-up is continued if you click on this button.
Reference:
See also "Selecting an order" chapter.
The selection of the order is thus completed.
175
Flash mode
7.5. Identifying control units
After selecting the order, identification of the control units is started.
Figure 7.12. Identify control units section
Offboard Diagnostic Information System Service displays a progress dialogue for identifying control units.
Figure 7.13. Control unit identification
Cancel flash start-up: Flash start-up is cancelled.
Once control unit identification is completed, Offboard Diagnostic Information System Service opens the Special functions tab and displays the flash programs available for the identified vehicle in a list.
176
Flash mode
7.6. Using flash programs
After identifying the control units, programs for flashing can be executed.
Figure 7.14. Execute flash programs section
Offboard Diagnostic Information System Service lists the available flash programs on the Special functions tab.
Figure 7.15. Available flash programs
177
Flash mode
The desired flash program is marked by clicking on it.
Perform test...: The selected flash program is started. For this, Offboard Diagnostic Information System Service switches to the Process tab.
Show documents: The button can be used to display corresponding documents, if available. For this, Offboard
Diagnostic Information System Service switches in Info mode to the Documents tab.
Flash programs are executed in the same way as GFF diagnostic programs.
Reference:
See also chapter "Using GFF"
Flash sessions can be saved, re-opened and continued just like diagnostic sessions. The application automatically
detects whether a diagnostic or flash session is to be saved or resumed.
Reference:
For more details on saving flash sessions, see the "Data" chapter.
7.7. Ending a flash session
If the desired flash programs have been completed, the flash session can be ended.
Figure 7.16. End flashing section
To end the flash session, you need to switch to the Flash tab.
178
Flash mode
Figure 7.17. Ending a flash session
If you click on this button, exiting the flash session is started and this must be confirmed in a query
that follows.
Figure 7.18. Ending a flash session
Yes: The flash session is ended.
No: The flash session is not ended.
Like for exiting guided fault finding, end module programs may be applied, depending on the vehicle. It is also
possible to send feedback on the flash session. This feedback can also be skipped.
Offboard Diagnostic Information System Service then switches back to the start screen in Flash mode.
Reference:
For more details on exiting guided fault finding, see the "Ending diagnosis" chapter.
179
Chapter 8. Info mode
Info mode combines all functions required for information. Most of this information is provided by the Volkswagen Group systems, which is why an active connection with valid login is particularly important here.
Click on this button to switch to Info mode. It is possible to do this from all other modes
provided diagnostic start-up or flash start-up has taken place. Subsequent login to the Group systems is possible.
Note:
The contents of the following tabs are provided via Group system services. A single login to the Group systems
for each diagnostic session and the online connection to the network are required for this.
You can use the
pages.
and
buttons to scroll backwards and forwards if the contents are spread over several
The
button can be used to reload content or by the authorised dealer to repeat login. If content is reloaded,
the corresponding start page of the window is loaded.
Figure 8.1. Tabs in Info mode
These tabs are available in Info mode:
"Documents"
"Actions"
"History"
"Circuit diagrams"
"Manuals"
"Vehicle"
"PR No".
Every tab can be opened by clicking on it.
180
Info mode
8.1. Documents
Offboard Diagnostic Information System Service provides a number of documents. These documents come
from the knowledge base in the diagnostic database and apply to the diagnosed vehicle with its equipment variants.
Documents can also be opened in Diagnostic or Flash mode. For this, Offboard Diagnostic Information System
Service automatically switches from diagnostic or flash mode to Info mode.
Reference:
See also chapter "Using GFF"
Note:
The document tree can only be displayed on the Documents tab after diagnostic or flash start-up, since the
documents are only compiled for diagnosed vehicles.
After switching to Info mode, the view of the Documents is open. If you switch to Info mode again, the tab last
activated is displayed.
Figure 8.2. Info mode start-up view
Vehicle documents: If you click on this button, all documents available for the currently identified vehicle are
displayed in a tree structure on the Documents tab.
181
Info mode
Figure 8.3. Selecting a document to be displayed
Individual branches can be opened in the tree structure by clicking on the plus sign [+] or closed by clicking on
the minus sign [-].
After marking one of the documents listed in the tree structure using the mouse, the button for displaying the
document is enabled.
Display document: The marked document is opened.
The document can also be opened directly in the document tree by double-clicking on it.
182
Info mode
Figure 8.4. View of a document
To return to the document structure, click on this button.
There are documents with text only or images only or combined text-image documents. The combined text-image
documents are displayed next to each other.
Below are two examples of typical documents for a vehicle.
Example 1 of a pure text document:
183
Info mode
Figure 8.5. Example 1, document tree
Selection of: Chassis - Repair instructions - Gen. notes on line tests
184
Info mode
Figure 8.6. Example 1, document view
Example 2 of a combined text-image document:
Figure 8.7. Example 2, document tree
Selection of: Body - Target values - Headlight adjustment
185
Info mode
Figure 8.8. Example 2, document view
Image documents may have what are referred to as hot spots. Hot spots are image areas with a red border.
Figure 8.9. Document with hot spot
If you click on a hot spot, another image is opened with a more detailed view of the area within the red border.
186
Info mode
Figure 8.10. Open hot spot
Documents can be printed as the current view.
Reference:
See also "Current view"
187
Info mode
8.1.1. Documents in the GFF
The test programs for guided fault finding include numerous different documents. These documents are available
in Diagnostic mode either in the test plan view or in the test programs themselves.
Reference:
See also chapter "Using GFF"
Figure 8.11. Displaying the documents for a test plan
Documents: If you click on this button on the Test plan tab in Diagnostic mode, a context menu appears from
which you can select whether documents are to be displayed for the test plan or for a test program:
Documents for the test plan: All documents for diagnostic objects taken into account in the test plan are provided
in a tree structure.
Documents for the test program: All documents for diagnostic objects taken into account in the test program
selected are provided in a tree structure.
188
Info mode
After selecting the document type, Offboard Diagnostic Information System Service switches from the Test plan
tab in Diagnostic mode to the Documents tab in Info mode.
Documents for the test programs describe the following issues. Which documents are available depends on the
test program.
Block circuit diagram
File with CD contents
Instructions for settings
Fitting location
Function description
Function test instructions
Test equipment
Pin assignment
Fuse assignment
Connector view
Tools
Circuit diagram
Repair instructions
Note:
Additional documents are available on the Manuals and Circuit diagrams tabs.
Reference:
See also chapters: "Manuals tab" and "Circuit diagrams tab"
To return to the test plan, switch to Diagnostic mode.
189
Info mode
8.2. Actions tab
A click on the Actions tab displays field actions already performed for the vehicle, such as recall campaigns.
Figure 8.12. View of the Actions tab
Scroll forward a page.
Scroll back a page.
You can use this button to reload content. Authorised dealers can log on to the Group systems here again.
190
Info mode
8.3. History tab
The History tab shows the vehicle's repair history from ElsaPro. The manual for ElsaPro provides a more
detailed list of the contents.
Figure 8.13. History tab view
Scroll forward a page.
Scroll back a page.
You can use this button to reload content. Authorised dealers can log on to the Group systems here again.
191
Info mode
8.4. Manuals tab
Click on the Manuals tab to access workshop manuals.
Figure 8.14. Manuals tab view
The documents are listed by their VIN in a tree structure on the left side of the window. Click on the required
manual to display it in the window on the right.
Scroll forward a page.
Scroll back a page.
You can use this button to reload content. Authorised dealers can log on to the Group systems here again.
192
Info mode
8.5. Circuit diagrams tab
You can use the Circuit diagrams tab to access the circuit diagrams required for the vehicle.
Figure 8.15. Circuit diagrams view
The diagrams are displayed in a tree structure in the left-hand window. Click on the required circuit diagram to
display it in the window on the right.
Scroll forward a page.
Scroll back a page.
You can use this button to reload content. Authorised dealers can log on to the Group systems here again.
8.6. Vehicle tab
The Vehicle tab displays all relevant vehicle details. Prerequisite is that diagnostic start-up has been performed.
The individual details displayed are as follows:
Vehicle identification number
Manufacturer
Type
Model year
Production site
193
Info mode
Serial number
Engine code
Gearbox code
Sales number
Sales description
Production date
Figure 8.16. Vehicle view
You can use this button to reload content. Authorised dealers can log on to the Group systems here again.
194
Info mode
8.7. PR no. tab
The table on the PR No. tab shows the equipment numbers for the selected vehicle. Diagnostic start-up must
be performed first for this.
Figure 8.17. PR no. view
You can use this button to reload content. Authorised dealers can log on to the Group systems here again.
195
Chapter 9. Test instruments mode
9.1. Test instruments in general
To access Test instruments mode, click on the Test instruments button on the user interface of the start screen
in the Modes area (right edge of the screen).
Test instruments mode allows the user to perform measurements independently without guided fault finding
using test instruments that can be parametrised. Test results are displayed numerically or graphically on the screen.
Reference:
See also chapter: "Offboard Diagnostic Information System Service user interface"
The multimeter user interface is automatically active after starting:
Figure 9.1. Test instruments user interface - Multimeter
The user interface in test instruments mode consists of the following six areas:
•
•
Information area:
Tab bar:
The tabs on the tab bar can be used to activate the Multimeter or Oscilloscope client area.
196
Test instruments mode
Reference:
See also chapter The Multimeter client area and The Oscilloscope client area
•
Client area:
The structure of the client area changes depending on which function has been activated using the tabs. All
specific test parameters for the selected measurement option are displayed in this client area.
Reference:
See also Fig.: Structure of the Multimeter client area and Fig.: Structure of the Oscilloscope client area
•
Modes:
By clicking on the buttons, you can switch to Info, Diagnosis and Admin mode at all times. The most recently
set measurement options and functions remain intact when switching modes.
Reference:
See also Test instrument administration
•
Standard functions:
Note:
To print the current screen view, click on the Data button in the Standard functions area.
To hide the Information area
screen
•
and the modes
and to zoom in on the other areas, click on the Full
button.
Status line:
Status messages from the system are displayed in the status line.
The default settings for test instruments mode (such as units of measurement) can only be set in Admin mode.
Reference:
See also chapter Test instrument administration
9.2. The Multimeter client area
Click on the Multimeter tab on the tab bar to activate the corresponding client area. Use the Multimeter function to
make user-defined settings for the measuring leads connected via the device sockets and to use these instruments.
Measuring functions can be set, measurements can be carried out and test results can be read.
If the Multimeter function is active, the following client area is visible:
197
Test instruments mode
Figure 9.2. Structure of the Multimeter client area
The Multimeter client area consists of the following three areas:
Display area:
The bottom part of the display area is for the graphical display of measured values in the form of bar charts.
Switching states and measured values for the selected measurement option are displayed in the centre. The top
part serves to display important system messages, for example, a message stating that the test instruments are
being calibrated.
Operating area
Use the various buttons in the operating area to start or end measuring functions and to set the required test
parameters, such as Coupling and Measuring range.
Reference:
See also section Setting the test parameters
Function area:
Use the corresponding buttons in the function area to select relevant service functions for each measuring function
or the selected test procedure (service functions not available are hidden from view). The following functions can
be selected depending on the measuring function:
•
Freeze frame: "Freezes" the current display. Cyclic repetition of the measurement pauses and the last measured
value is displayed statically. To resume cyclic measurement, click on the button again. For the remote-controlled operation of the Freeze frame function, use the remote control button on the measuring probe of the
U/R/D and DSO measuring lead (red measuring lead). .
198
Test instruments mode
•
Minimum/maximum can be used to configure user-defined settings for the measuring leads connected via the
device sockets. Measuring functions can be set, measurements can be carried out and test results can be read.:
Indication of the limit values. The current minimum and maximum measured values (after activation of the
function) are indicated in the bar graph by means of vertical markers. In addition, the limit values are displayed
numerically below the markers. If the function is deactivated, the limit values measured so far are discarded.
•
Calibrate: Manual start of the calibration of a measuring lead. Always calibrate manually when replacing a
measuring lead or using a measuring lead in a different measurement position or in case of large fluctuations in
temperature. With the measuring functions Resistance URDI(measuring range <= 100 ohm), Current URDI
and Continuity test URDI, calibration is performed automatically when the function is started.
•
Diagnostic measured values: Shows measured values and measured value blocks read out of a control unit
in cycles. These must first be loaded in diagnostic mode and transferred for test instruments mode. The button
is only visible if measured value blocks have already been loaded in diagnostic mode.
Reference:
See also chapter Applying measured values from diagnostic mode
Note:
To trigger the Freeze frame function by remote control, use the remote control button on the measuring probe
of the URDI and DSO measuring lead.
The operating area of the multimeter client area is divided into two function blocks:
Figure 9.3. Structure of the operating area of the multimeter client area
Function block 1:
199
Test instruments mode
Function block 1 consists of all measuring functions and parameters of the URDI measuring system. The buttons
and the corresponding indication of measured values are shown in yellow font. The following measuring functions
are available:
•
Voltage URDI - Measurement of AC and DC voltage
Reference:
See also chapter Voltage measurement URDI
•
Current URDI - Measuring direct and alternating current
Reference:
See also chapter Current measurement URDI
•
Resistance URDI - Measuring ohmic resistance
Reference:
See also chapter Resistance measurement URDI
•
Diode test URDI - Testing diode polarity and function
Reference:
See also chapter Diode test URDI
•
Continuity test URDI - Test to check whether there is a connection of low resistance (<= 2 ohm) between
two points.
Reference:
See also chapter Continuity test URDI
Function block 2:
All measuring functions and parameters of the current measurement are combined via connection DSO1 in function block 2, as well as various pressure sensors, a temperature sensor or current measurement via the clamp-on
ammeter connection. The buttons and the corresponding display of measured values are shown in green font. The
following measuring functions are available:
•
Voltage DSO1 - Measuring AC and DC voltage
Reference:
See also chapter Voltage measurement DSO1
•
Current clamp-on ammeter - Measuring direct and alternating current
Reference:
See also chapter Current measurement, clamp-on ammeter
•
Pressure T/P - Measuring the pressure
Reference:
See also chapter Pressure measurement T/P
200
Test instruments mode
•
Temperature T/P - Measuring the temperature
Reference:
See also chapter Temperature measurement T/P
Note:
The measuring functions Resistance URDI (measuring range <= 100Ohm), Current URDI and Continuity
test URDI have an automatic calibration option that is executed when the program is started for the first time.
In addition, whether automatic calibration of a measuring lead is necessary depends on the device. A system
message may then ask you to carry out further operating steps.
In addition, the captions of the buttons in the operating area of the multimeter client area may deviate from the
figure "Structure of the operating area of the multimeter client area". That depends on the device (e.g. "Pressure
T/P-1" and "Temperature T/P-2" instead of "Pressure T/P" and "Temperature T/P).
Note:
To be able to the start the measuring functions from function blocks 1 and 2, the correct measuring lead must be
connected to the device sockets. If this is not the case, an error message will appear.
Setting the test parameters:
If a measuring function has been successfully started in the operating area, the specific test parameter buttons (e.g.
DC or AC measurement) will be added to the respective function block. If a test parameter is not available for the
active measuring function, the corresponding button will be inactive (black) (e.g. if the Resistance URDI function
is activated, the AC button is inactive).
Figure 9.4. Test parameter buttons in function block 1
The characteristics of the test parameters are described below using the measurement option Voltage URDI in
function block 1 as an example.
201
Test instruments mode
Setting the DC coupling:
Clicking on the "==" button activates DC voltage or direct current measuring mode:
When a measurement option is started, the DC voltage or direct current test parameter is automatically active,
provided this measuring mode is supported. The bar graph in the display area is centred in this case and thus
divided into a positive and a negative area.
Setting the AC coupling:
Clicking on the "~" button activates AC voltage or alternating current measuring mode:
The bar graph in the display area is left-justified in this case.
Setting the measuring range:
When starting a measurement option, the automatic measuring range selection is active. In this case the arrow
buttons to the left and right of the measuring range display are not active and can therefore not be used.
Measuring range button in DC automatic mode
Measuring range button in AC automatic mode
202
Test instruments mode
To switch from automatic to manual measuring range selection, click on the measuring range display button. In
this case the arrow buttons to the left and right of the measuring range display are yellow or green. If the minimum
or maximum measuring range is reached, the corresponding button is inactive (black).
Measuring range button in DC manual mode
Measuring range button in AC manual mode
Note:
In addition to the indication directly in the measuring range button, the current measuring range is also shown in
the display area on the left and right end of the bar graph's scale.
If the current measured value is not within the set measuring range, "++++" characters are displayed if the range
is exceeded and "- - - -" if it is fallen short of.
Setting single measurements or parallel measurements:
In the case of a single measurement, only one measurement option from function block 1 or 2 is active. In the
case of a parallel measurement, one measurement option from function block 1 and one from 2 are active at the
same time.
Note:
In the case of active parallel measurement, both test results are output in the display area, and the bar graph and
minimum/maximum function are not available. In the function area, the Minimum/minimum button is hidden.
9.2.1. Voltage measurement with the URDI measuring lead
To activate the "Voltage URDI" measuring function, use the button of the same name:
203
Test instruments mode
Figure 9.5. Client area for activated "Voltage URDI" voltage measurement
The following test parameters can be set:
•
Coupling: DC voltage or AC voltage
•
DC voltage measuring range: ± 2V | ± 20V | ± 50V
•
AC voltage measuring range: 0...2V | 0...20V | 0...40V
•
Automatic or manual measuring range selection
•
Functions: freeze frame, minimum/maximum, calibration
9.2.2. Current measurement with the URDI measuring lead
To activate the "Current URDI" measuring function, use the button of the same name:
204
Test instruments mode
Figure 9.6. Client area for activated "Current URDI" current measurement
The following test parameters can be set:
•
Coupling: direct current or alternating current
•
Direct current measuring range: ± 200mA | ±2A
•
Alternating current measuring range: 0...200mA | 0...2A
•
Automatic or manual measuring range selection
•
Functions: freeze frame, minimum/maximum, calibration
9.2.3. Resistance measurement with the URDI measuring lead
To activate the "Resistance URDI" measuring function, use the button of the same name:
205
Test instruments mode
Figure 9.7. Client area for activated "Resistance URDI" resistance measurement
The following test parameters can be set:
•
Measuring ranges: 0...10Ohm / 0...100Ohm / 0...1kOhm / 0...10kOhm / 0...100kOhm / 0...1MOhm /
0...10MOhm
•
Automatic or manual measuring range selection
•
Functions: freeze frame, minimum/maximum, calibration
Note:
If the measuring ranges 0 - 10Ohm or 0 - 100Ohm are selected manually, calibration is necessary. For this, the red
and black measuring probes need to be moved together. A system message will then ask you to carry out further
operating steps. The message text "Calibration in progress" is shown in the display area during calibration.
Note:
Additional contact resistance up to the object being measured can be compensated for by means of manual calibration. Due to a short circuit directly at the object being measured, not only the measuring lead but also the
supply lead to the object being measured are included in the calibration.
9.2.4. Diode test with the URDI measuring lead
206
Test instruments mode
To activate the "Diode test URDI" measuring function, use the button of the same name:
Figure 9.8. Client area for activated "Diode test URDI"
The result of the diode test is then displayed as a diagram in the display area. The following four states can
be distinguished:
•
Short-circuit - diode defective or the connected object being measured does not have a diode function
•
Interruption - diode defective or the connected object being measured does not have a diode function
•
Diode connected in forward direction
•
Diode connected in reverse direction
207
Test instruments mode
9.2.5. Continuity test with the URDI measuring lead
To activate the "Continuity test URDI" measuring function, use the button of the same name:
Figure 9.9. Client area for activated "Continuity test URDI"
The result of the continuity test is displayed as a symbol in the display area. The following two states can
be distinguished:
•
Circuit closed (if line resistance <= 2 ohm)
If the circuit is closed, an audible signal also sounds.
•
Circuit open
208
Test instruments mode
9.2.6. Voltage measurement via the DSO1 measuring socket
To activate the "Voltage DSO1" measuring function, use the button of the same name:
Figure 9.10. Client area for activated "DSO1" voltage measurement
The following test parameters can be set:
•
Coupling: DC voltage or AC voltage
•
DC voltage measuring range: ± 0.4V | ± 1.6V | ± 4V | ± 16V | ± 40V | ± 160V | ± 400V
•
AC voltage measuring range: 0...0.4V | 0...1.6V | 0...4V | 0...16V | 0...40V | 0...160V | 0...400V
•
Automatic or manual measuring range selection
•
Functions: freeze frame, minimum/maximum, calibration
9.2.7. Current measurement with the clamp-on ammeter
To activate the "Current clamp-on ammeter" measuring function, use the button of the same name:
209
Test instruments mode
Figure 9.11. Client area for activated "Current clamp-on ammeter" current measurement
The following four clamp-on ammeter types are supported: 50A SZ / 100A SZ / 500A SZ / 1800A SZ.
The following test parameters can be set:
•
Coupling: direct current or alternating current
•
Direct current measuring range: ± 5A | ± 10A | ± 50A | ± 100A | ...
•
Alternating current measuring range: 0...5A | 0...10A | 0...50A | 0...100A | ...
•
Automatic or manual measuring range selection
•
Functions: freeze frame, minimum/maximum, calibration
Note:
The first time the measurement option is started, you will be requested to perform calibration. Current measurement cannot be started as long as the information text "Calibration in progress" is shown at the top of the display
area. Do not clamp the clamp-on ammeter to live wires during calibration.
If the clamp-on ammeter is open, the warning "Clamp-on ammeter not closed!" will appear in the display area
but the running measurement will not be interrupted. For this reason, always check that the clamp-on ammeter
fits correctly before starting a long-term measurement, for example.
210
Test instruments mode
Note:
For measurements with the clamp-on ammeter, perform manual calibration again after changing from low to high
current due to magnetisation effects.
The maximum possible measuring range for a connected clamp-on ammeter is automatically identified, and the
corresponding test parameters are adjusted.
9.2.8. Pressure measurement via T/P device socket
To activate the "Pressure T/P" measuring function (depending on the device also "Pressure T/P 1"),
use the button of the same name:
Figure 9.12. Client area for activated "Pressure T/P" pressure measurement
For the pressure measurement, high-frequency interference can be filtered out by clicking on the Filter button.
The corresponding button is also shown in function block 2 in the area of the test parameters.
The following test parameters can be set:
•
Measuring range: automatic or manual measuring range selection
•
Functions: freeze frame, minimum/maximum
Note:
A connected pressure sensor is automatically identified, and the measuring range is adjusted accordingly.
The unit of measurement for the pressure measurement can be set to "bar" or "lb/in2" in Admin mode.
211
Test instruments mode
9.2.9. Temperature measurement via T/P device socket
To activate the "Temperature T/P" measuring function (depending on the device also "Temperature
T/P 2"), use the button of the same name:
Figure 9.13. Client area for activated "Temperature T/P" temperature measurement
The following test parameters can be set:
•
Measuring range: 20...200°C
•
Functions: freeze frame, minimum/maximum
Note:
The connected temperature sensor for measurements in liquid or air is automatically detected. The unit of measurement for the temperature measurement can be set to "°C" or "°F" in Admin mode.
9.3. The Oscilloscope client area
The "Oscilloscope tab" on the tab bar is used to activate the corresponding client area. Use the Oscilloscope
function to make user-defined settings for the measuring leads connected via the device sockets and to use these
instruments. Measuring functions can be set, measurements can be made and test results can be displayed, saved
and compared using the digital storage oscilloscope.
212
Test instruments mode
If the "Oscilloscope" function is active, the following client area is visible:
Figure 9.14. Structure of the "Oscilloscope" client area
The "Oscilloscope" client area consists of three areas:
Display area:
Signal curves are displayed in a two-dimensional system of coordinates here. The horizontal axis (x axis) is the
time axis and the vertical axis (y axis) is the amplitude axis. Up to four signal curves can be displayed at the same
time. To facilitate the assignment of the test parameters (in the corners of the display area), the captions of the
buttons and the signal curves are displayed in different colours:
•
Yellow - Channel A
•
Green - Channel B
•
Blue - Target curve, channel A
•
Red - Target curve, channel B
213
Test instruments mode
Figure 9.15. "Oscilloscope" display area
Operating area:
In the operating area, various measuring functions can be parametrised using the buttons. The buttons shown
depend on the function active in the function area.
Reference:
See also chapter Image position and time base
Function area:
The corresponding buttons in the function area can be used to select relevant service functions for each measurement or the selected test procedure. The following functions can be selected:
•
Freeze frame - The cyclic repetition of the measurement is stopped and the last diagram is displayed. In
addition, the Cursor 1 and Cursor 2 buttons appear.
Reference:
See also chapter Freeze frame
•
Channel A and channel B - Parametrisation of channels A and B
Reference:
214
Test instruments mode
See also chapter Channel parametrisation
•
Trigger mode - Trigger parametrisation
Reference:
See also chapter Trigger parametrisation
•
Measuring mode - Setting the measuring mode
Reference:
See also chapter Setting the test parameters
•
Cursor 1 and Cursor 2 - Setting the start point / end point of a mark
Reference:
See also chapter Freeze frame
•
Bandwidth limit - Activating / deactivating the band-pass filter. The bandwidth limit is already active after
starting the "Oscilloscope" client area.
Reference:
See also chapter Bandwidth limit
•
Target curves - Recording and playing target curves
Reference:
See also chapter Target curves function
9.3.1. Image position and time base
In the default setting of the digital storage oscilloscope, the arrow buttons shown in the operating area can be used
to set the image position and the timebase for the signal curves.
215
Test instruments mode
•
Image position: The signal curves can be moved horizontally in the grid. The trigger point (coloured arrow
( ) according to the channel colour) can be moved along with the curve. Once the maximum left or right
image position has been reached, the respective arrow button becomes inactive.
•
Timebase: Scanning the signal curves in x-direction can be increased and reduced. The current timebase is
shown centred in the top edge of the display area. Once the maximum or minimum timebase has been reached,
the corresponding arrow button becomes inactive.
Note:
To set the image position and timebase, the buttons Channel A, Channel B , Measuring mode, Trigger mode
and Target curves should not be enabled.
Note:
1-channel active
Timebase in Draw mode
Timebase in other modes
0.2...100 s/div.
1.25 µs/div. to 0.1 s/div.
with active long-term measurement: 5ms/div. to with active Min/Max function: 5 µs/div. to 0.1 s/
100 s/div.
div.
2-channels active 0.2...100 s/div.
2.5 µs/div. to 0.1 s/div.
with active long-term measurement: 5ms/div. to with active Min/Max function: 5 µs/div. to 0.1 s/
100 s/div.
div.
Table 9.1. Setting the timebase
The minimum timebase (1.25 µs/div.) can only be set for single-channel operation (channel A or channel B active).
In dual-channel operation, the minimum timebase is 2.5 µs/div. The timebases 20, 50 and 100 s/div can only be
set in Draw measuring mode.
9.3.2. Channel parametrisation
To activate the operating area for parametrisation of the respective channel, click on the Channel A or Channel
B button. To exit channel parametrisation, click on the selected button again.
After activating the Channel A or Channel B button, a parametrisation dialogue in the colour of the activated
channel appears in the operating area. Channel parametrisation is explained below using channel A as an example.
The same procedure applies to channel B.
216
Test instruments mode
Figure 9.16. Parametrisation of channel A
Assigning the measurement option:
Click on the arrow of the Channel pop-up menu in the operating area to assign the desired measuring functions
to the active channel.
The following measuring functions are available:
•
OFF - No measurement connection selected
•
DSO1 - DSO channel A
•
DSO2 - DSO channel B
•
KV - KV clamp
•
Temp. T/P - Temperature corresponding to connected sensor
or also, depending on the device:
Temp. T/P-1 and Temp. T/P-2
•
Pressure T/P - Pressure corresponding to connected sensor
or also, depending on the device:
Pressure T/P-1 and Pressure T/P-2
•
SZ- Clamp-on ammeter
217
Test instruments mode
Note:
In case of a parallel measurement, channel A and channel B are assigned a measurement option and both are
active. In case of a single measurement, either channel A or channel B is active.
Setting the measuring range:
Use the arrow buttons in the operating area to set the measuring range (unit of meas./div.). If the minimum or
maximum measuring range is reached, the corresponding button is disabled (black).
The set measuring range is output together with the coupling in the colour of the respective channel in the display
area (channel A top left, channel B bottom left).
Setting the coupling:
To assign the desired measuring mode to the active channel, click on the arrow of the Coupling pop-up menu
in the operating area.
The following test parameters are available:
•
AC coupling against AC voltage
With an AC coupling, any DC voltage components of a measuring signal are blocked and only the AC voltage
component is displayed. That is practical if the DC voltage component of a measuring signal is much higher
than the AC voltage component, which would be falsified by the indicated value.
•
DC coupling against DC voltage
With a DC coupling, DC and AC voltage components are displayed.
•
GND (ground) coupling with earth
The set coupling ("=" DC; "~" AC) is output together with the measuring range in the colour of the respective
channel in the display area (channel A top left, channel B bottom left).
Setting the filter:
Click on the arrow of the Filter pop-up menu in the operating area to assign the desired filter type to the active
channel.
218
Test instruments mode
The following filter types are available:
•
OFF - No filter is active.
•
HF (high-pass filter) - Filters out everything below a frequency limit.
•
LF (low-pass filter) - Filters out everything above a frequency limit.
Reference:
See also chapter Bandwidth limit
Show limit values:
To activate the indication of the limit values, click on the Min/Max button in the operating area.
The current minimum and maximum measured values (after activation of the function) are output numerically
in the centre at the bottom part of the display area in the colour of the respective channel. If the function is
deactivated, the limit values measured so far are discarded.
Note:
The Min/Max function is activated or deactivated simultaneously for a parallel measurement for both channels.
Moving the signal curve
The signal curves can be moved vertically using the scroll bar (on the right next to the display area). The trigger
point (coloured arrow ( ) according to the channel colour) can be moved along with the curve. The signal curves
for channel A and channel B can be moved independently of each other.
The offset to the base line is shown below the scroll bar.
Note:
If the minimum timebase of 1.25 µs/div has been set, only one channel can be activated. The button for the second
channel is hidden.
9.3.3. Setting the measuring mode
If you click on the Measuring mode button, a parametrisation dialogue will appear in the operating area to set the
mode for entering measured values. The selected mode always applies to channel A and channel B. The selected
measuring mode is displayed in the centre of the bottom part of the display area (blue text).
219
Test instruments mode
Figure 9.17. Setting the measuring mode
Note:
Which measuring mode buttons are visible depends on the channel parametrisation. Measuring modes that are
not supported by the measuring functions assigned to the channels are hidden.
Recording measured values in auto setup mode:
Click on the Auto Setup button to perform automatic setup, i.e. the amplitude of the active channels, the timebase
and the trigger threshold are automatically set. Auto setup is carried only once after each call. Measuring mode
then switches automatically to auto level mode.
Recording measured values in auto level mode:
Click on the Auto Level button to automatically update the relative trigger threshold set (percentage threshold
in the range of ±100% of the signal amplitude) so that there is always only one triggered signal regardless of the
signal amplitude.
220
Test instruments mode
Note:
Auto Setup and Auto Level can only work correctly if there is a periodic signal with a low degree of interference.
In Auto Level measuring mode, signals can be triggered regardless of their amplitude height and zero position,
since triggering refers to a percentage amplitude value. When switching from Auto Setup mode, triggering is
automatically set to 0% of the amplitude value.
In auto measuring mode:
Click on the Auto button to start the measurement automatically when there is a valid trigger event (corresponding
to the set trigger threshold) or after a delay time has elapsed (which depends on the selected timebase).
Note:
If no information about the signal is available, use Auto measuring mode. A signal curve is also output if the
trigger is outside the amplitude (untriggered display). The trigger can then be guided manually to a value in the
amplitude range to produce a frozen image.
Recording measured values in normal mode:
Click on the Normal button for the cyclic measurement to be performed only if there is a valid trigger event.
Note:
Normal measuring mode should be used only if there is exact information on the amplitude and frequency of the
measuring signal. A triggered signal curve is only output if the trigger is within the amplitude range of the signal.
Recording measured values in single mode:
Click on the Single button to perform only a single measurement after a valid trigger event. The signal is measured
and displayed immediately as a freeze frame. Make sure that there is a valid trigger event.
221
Test instruments mode
Recording measured values in draw mode:
Click on the Draw button to perform the measurement without trigger. The signal curve in the display area is
displayed continuously from the left to the right. Draw measuring mode serves to display low-frequency or slow
signals (e.g. lambda probe). Long-term measurement is also possible in this measuring mode.
Reference:
See also Long-term measurement chapter
Note:
High-frequency or fast signals cannot be displayed in Draw measuring mode. A timebase from 0.2 to 100 s/
div can be set.
The Trigger mode function for parametrising the trigger is not available after Draw measuring mode has been
activated.
Note:
In case a signal curve is not displayed after Auto Setup measuring mode has been started, check the following
points in this order:
1.
Is the DSO measuring lead connected correctly to the device socket and the signal source?
2.
Has channel parametrisation been performed correctly? Have the desired measurement options been assigned correctly to the channel (e.g. channel A is assigned to DSO1)?
Reference:
See chapter: Channel parametrisation
3.
Are measuring mode and, if necessary, the trigger set correctly?
Reference:
See chapter: Setting the measuring mode
4.
Finally, automatic setup should be repeated.
9.3.4. Long-term measurement in draw mode
222
Test instruments mode
Note:
Long-term measurements can only be performed in Draw measuring mode. This function is not available in
any of the other measuring modes!
After Draw measuring mode has been activated, the Long-term measurement function is available in the function area.
With this measuring function, a user-defined time interval can be set during which the measurement is performed.
After recording has taken place, the measuring curves are output across the width of the window in compressed
form. The use of the long-term measurement is explained in the following sub-items:
Parametrisation of the long-term measurement:
To display the corresponding parametrisation dialogue in the operating area, click on the Long-term measurement button in the function area. The Freeze frame function is automatically activated during parametrisation.
Figure 9.18. Parametrisation of long-term measurements
Setting the measuring duration:
223
Test instruments mode
After clicking on the buttons with the Minutes or Hours caption, the blue arrow buttons at the side can be used to
increase or reduce the measuring time. If the maximum or minimum time interval is reached, the corresponding
button is disabled (black). The elapsed recording time is output in the top right part of the display area. The
measuring time remains the same if the measurement is repeated.
Setting the timebase:
The procedure for setting the timebase is similar to the procedure described in the chapter Image position and
timebase . The set timebase in the long-term measurement function is saved independently of the timebase for
the other measuring modes.
Note:
The maximum measuring time for a long-term measurement is limited by the timebase (sampling rate). The data
quantity increases proportionately with the sampling rate. The maximum recording time is 55 hours and 33 minutes
for a time base of 10s/div.
The measuring duration is adjusted automatically by the device if the timebase is changed. The following table
lists the maximum measuring times in relation to the set timebase:
Set timebase [time/div.]
Maximum
[h:min]
5ms/div.
00:01
10ms/div.
00:03
20ms/div.
00:06
50ms/div.
00:16
0.1s/div.
00:33
0.2s/div.
01:06
0.5s/div.
02:46
1s/div.
05:33
2s/div.
11:06
5s/div.
27:46
10s/div.
55:33
measuring
time
Table 9.2. Maximum measuring time during long-term measurement
Starting the long-term measurement:
To start the long-term measurement, click on the locked Freeze frame button.
If the set measuring time has elapsed, the Freeze frame function is automatically activated and the measurement
ends. The text "Long-term measurement ended" also appears in the display area. All recorded data is shown across
the width of the display area in compressed form.
After the measurement has ended, the signal curves can be evaluated using the cursor function. It is also possible to
zoom in on a selected area as required. The corresponding buttons are shown in the function area (see "Evaluating
long-term measurements" sub-item).
224
Test instruments mode
Figure 9.19. Evaluating long-term measurements
Note:
The values set for a measurement cannot be changed during the long-term measurement.
It is advisable not to connect or disconnect USB periphery devices during an active measurement, since that could
result in the loss of data.
Cancelling the long-term measurement:
To stop a long-term measurement before it is finished, click on the Freeze frame button. The data measured so
far can be evaluated, despite the cancellation. The text "Long-term measurement cancelled" appears in the display
area.
Evaluating the long-term measurement
After a long-term measurement has been finished, the Cursor 1 and Zoom buttons are displayed.
The Zoom button is only available if the Cursor 1 button is not active. It serves to zoom in on a detail of the
signal curve.
There are two methods for increasing the size of a section of the recorded signal curve using the Zoom function:
•
If you click on the curve section to be increased in size, this section is immediately displayed across the entire
width of the display area with the minimum timebase.
225
Test instruments mode
•
Click on the starting point of the curve area to be zoomed in on (hold down the right or left button) and move
the cursor to the desired end point. Two cursors are shown for better orientation.
The selected area will then be zoomed in on across the entire width of the display area.
After the area has been selected, blue arrow buttons are shown in the operating area. Use these buttons to move
the selected area to the left or right.
To activate the cursor function, click on the Cursor 1 button. This is also possible using the Zoom function in
order to evaluate a detail that has been zoomed in on. In the function area, use the respective button to select
between Cursor 1 and Cursor 2.
Use the mouse or the touchscreen to move the respective cursor ( ) in the display area along the recorded signal
curve. The current position is displayed in the amplitude and time function area:
The orange arrow buttons in the operating area can be used to position the marking cursor more precisely in
the grid.
If both cursors are active, the difference in amplitude and time between the cursor positions is shown in the function
area instead of amplitude and time.
Note:
The amplitude values and the difference in amplitude in the function area are shown in the colour of the respective
channel. If both channels are active, the values are shown one below the other. The time value is the same for
both channels.
9.3.5. Trigger parametrisation
226
Test instruments mode
To change the trigger settings, click on the Trigger mode button. After the function has been activated, the respective parametrisation dialogue appears in the operating area.
Figure 9.20. Parametrisation of the trigger
If a channel has already been parametrised, the relevant settings for this channel are automatically accepted for
the trigger. It is not necessary to define any further settings for the trigger in this case. If no channels have been
parametrised yet, a measurement connection has to be defined as the trigger before any further settings can be
made.
Setting the trigger threshold:
Use the scroll bar on the right side of the display area to set the trigger threshold to any trigger value ± 100% of
the maximum measuring range. The maximum measuring range is displayed in blue font at the top right in the
display area. The default setting for the trigger is a trigger threshold of 0.
The current trigger threshold is shown in the display area by means of an arrow ( ). If the trigger threshold
is within the valid amplitude range, the arrow is shown in the colour of the respective channel. If triggering is
external, the arrow is blue. If the trigger threshold is outside the valid amplitude range, the arrow is red.
The direction of the arrow (pointing up or down) indicates whether the trigger is triggered with a rising (positive)
or falling (negative) edge.
The trigger voltage is displayed below the scroll bar. In Auto Level measuring mode, the trigger voltage is shown
as a percentage value of the amplitude of the measuring signal (e.g.: the trigger voltage is 2.5V if the signal
amplitude is ±5V and the trigger threshold is set to +50%).
Note:
If Draw measuring mode is activated, the Trigger mode function is not available. Untriggered recording of the
measured data will then take place.
227
Test instruments mode
Selecting the trigger channel:
The following measuring function can be set as a trigger by clicking on the arrow of the Channel pop-up menu:
•
OFF - No measurement connection selected
•
DSO2 - DSO socket 2
•
DSO1 - DSO socket 1
•
KV - KV clamp via KV device socket
•
Temp. - Temperature via T/P device socket
or also, depending on the device:
Temp. T/P-1 and Temp. T/P-2 via T/P-1 and T/P2 device sockets
•
Pressure - Pressure via T/P device socket
or also, depending on the device:
Pressure T/P-1 and Pressure T/P-2 via T/P-1 and T/P2 device sockets
•
SZ- Clamp-on ammeter via SZ device socket
•
Trigger pick-up - Trigger pick-up via TZ device socket
The available measuring signals of the set measuring function can then be used as a trigger event to trigger a
measurement of the oscilloscope.
Note:
For the selected trigger channel, the corresponding measuring lead must be connected to the corresponding
device socket. If no measuring lead is connected, the "Trigger missing!" error message is displayed in the display
area.
Selecting the trigger coupling:
To set the measuring mode, click on the arrow of the Coupling pop-up menu.
•
AC coupling against alternating current/voltage
With an AC coupling, any DC voltage proportions of a measuring signal are blocked and only the AC voltage
proportion is displayed. That is practical if the DC voltage component of a measuring signal is much higher
than the AC voltage component, which would be falsified by the indicated value.
228
Test instruments mode
•
DC coupling against direct current/voltage
With a DC coupling, DC and AC voltage proportions are displayed.
•
GND (Ground) coupling with earth
Selecting the filter:
To select the filter type, click on the arrow of the Filter pop-up menu. Undesired signal components (in the high
or low frequency range) of the measuring signal can thus be attenuated.
•
OFF - No filter is active.
•
HF (high-pass filter) - Filters out everything below a frequency limit.
•
LF (low-pass filter) - Filters out everything above a frequency limit.
Selecting the trigger edge:
To select the trigger edge, click on the arrow of the Edge pop-up menu.
•
pos. - Measuring signal triggered with rising edge
•
neg. - Measuring signal triggered with rising edge
In case of a positive or negative edge, the arrow (trigger threshold) in the display area is displayed with the arrow
pointing up or down.
Moving the trigger point horizontally:
To move the trigger point to the left or right on the grid, click on the blue arrow buttons pointing horizontally
(arrow in the display area).
If the trigger point is outside the display area after being moved, the arrow is red.
Setting the range of values for the trigger amplitude:
To set the range of values for the trigger amplitude, click on the blue vertical arrow buttons.
229
Test instruments mode
For externally triggered measuring signals, changing the range of values for the trigger amplitude does not have
an effect on the measuring range and the depiction of the triggered measuring signal.
The set range of values for the trigger amplitude is shown in blue in the top right part of the display area. The
value is only visible if the Trigger mode function is active.
Note:
For the trigger pick-up, is not possible to set the trigger threshold, the filter, the trigger edge or the trigger amplitude.
9.3.6. Bandwidth limit
To activate the Bandwidth limit (BWL) function, use the button of the same name. This places a low-pass filter
with a frequency limit of 75kHz on the active measuring channels.
Activation of the bandwidth limit is shown centred in the display area next to the timebase.
Note:
To prevent the high-frequency band from being unintentionally filtered out by means of an activated bandwidth
limit when the user has defined a high signal sampling frequency, the test instruments application features automatic deactivation of the BWL function.
The threshold is a timebase <= 0.1 ms/div (sampling rate >= 500kHz).
9.3.7. Target curve function
To activate the Target curves function, use the button of the same name. To deactivate the function, click on
the Back button. After the function has been activated, the respective parametrisation dialogue appears in the
operating area.
230
Test instruments mode
Figure 9.21. Client area of the target curves function
Note:
Target curves are for supporting the diagnostic technician in both guided fault finding and stand-alone test instruments with reference curves. The currently measured signal (yellow and green signal curve) can be compared
to the reference signal (blue and red signal curve). If the characteristics of the measured signal match the characteristics of the reference signal, it can be assumed that the tested vehicle component is OK.
A distinction is generally made between two different modes when using the target curves function:
•
User mode: Only existing target curves can be displayed. Only the "Display" button is available.
•
Expert mode: In addition to displaying target curves, authenticated individuals can also record, save and edit
target curves and implement them in function tests.
Note:
To activate the full target curve functionality, password authentication in "Admin" mode is required.
Reference:
See also Admin mode chapter
231
Test instruments mode
Note:
If the Target curve function is active, the channels, the trigger and the measuring mode cannot be parametrised.
Recording target curves:
To be able to record target curves at least one channel must be parametrised first. Simultaneous recording of two
channels is also possible.
To start recording the measuring signal as a target curve, click on the Record button.
If the measurement is only running on one channel, the file name and the storage location of the target curve must
be defined next.
Figure 9.22. Recording target curves
If measurements are running on both channels, you need to choose between the following recording options before
entering the file name and storage location:
Figure 9.23. Recording target curves of two channels
232
Test instruments mode
Make the selection by clicking on the appropriate button and then confirming it by clicking on OK. Afterwards,
enter a file name and a directory to save the file as you would for a single-channel measurement.
All settings defined for the channels, the trigger, the measuring mode, the timebase and image position are saved.
Displaying target curves:
Click on the Display button to show recorded target curves.
After selecting the directory and target curve file, the corresponding target curve is shown in the display area. The
file name of the target curve is displayed in the centre of the bottom part of the display area. The previous target
curve file format *.sk2 is supported as well as the file format *.sk3 introduced with ODIS.
If a measurement is running, this measurement is stopped and the channels, the trigger, the measuring mode, the
timebase and the image position are set in accordance with the target curve. The signal curves can be distinguished
according to their colour:
Channel
Colour of the measuring signal and the correspond- Colour of the target curve and the corresponding
ing measuring range
measuring range
A
Yellow (measuring range at the top left of the dis- Blue (measuring range at the top right of the display
play area)
area)
B
Green (measuring range at the bottom left of the dis- Red (measuring range at the bottom right of the display area)
play area)
Table 9.3. Colour of the signal curves
Figure 9.24. Showing target curves
233
Test instruments mode
When displaying target curves, the measuring signal may be exactly on top of the recorded signal for the target
curve. To be able to better distinguish the two curves, use the scroll bar on the right side of the display area to
vertically shift the measuring curve with regard to the target curve. Select the respective channel beforehand
using the Channel A and Channel B buttons in the operating area.
Saving target curves:
To save the displayed target curve with all its channel settings to another directory, click on the Save button.
The file name is retained.
Deleting target curves:
To delete the displayed target curve, click on the Delete button.
A dialogue appears asking you to confirm this deletion. To delete the target curve permanently, click on the Yes
button. The measurements parametrised with the parameters of the target curve continue to run.
Freeze frame:
To stop the cyclic repetition of the measurement and display the last diagram, click on the Freeze frame button.
Unlike the Freeze frame function, it is not possible to perform an evaluation without using the Target curve
function.
9.3.8. Freeze frame
To stop the cyclic repetition of the measurement and display the last diagram, click on the Freeze frame button.
Unlike the Freeze frame function, it is not possible to perform an evaluation without using the Target curve
function. In addition, the Cursor 1 and Cursor 2 buttons appear in the function area.
Use the mouse or the touchscreen to move the respective cursor ( ) in the display area along the recorded signal
curve. The current position is displayed in the amplitude and time function area:
The orange arrow buttons in the operating area can be used to position the marking cursor more precisely in
the grid.
234
Test instruments mode
If both cursors are active, the difference in amplitude and time between the cursor positions is shown in the function
area instead of amplitude and time.
Note:
The amplitude values and the difference in amplitude in the function area are shown in the colour of the respective
channel. If both channels are active, the values are shown one below the other. The time value is the same for
both channels.
9.4. Accepting measured values from diagnostic mode
It is possible to transfer measured values from Diagnostic mode to Test instruments mode.
Note:
The Measured value diagnosis function is only available if measured values have been selected in Diagnostic
mode.
Reference:
see also Diagnostic start-up chapter
Default settings in diagnostic mode:
Click on the Diagnosis button to activate the corresponding mode. The desired control unit must then be selected.
Reference:
See also chapter Diagnostic start-up
Select the control unit for which measured values are to be accepted. Then right-click on the current selection.
The following group of buttons is displayed, from which the Test instruments button needs to be selected:
235
Test instruments mode
A window is opened for selecting a measured value block (KWP control units) or individual measured values
(UDS control units). After selecting the measured value block or individual measured values (a maximum of four
measured values can be displayed), confirm the selection by clicking on the OK button.
After confirmation, Test instruments mode is automatically set. The Measured value diagnosis function is
available for both the Multimeter function and the Oscilloscope function.
After clicking on the Measured value diagnosis button, the first four measured values are shown in the display
area.
236
Test instruments mode
Figure 9.25. Displaying diagnostic measured values on the multimeter
Figure 9.26. Displaying diagnostic measured values on the oscilloscope
9.5. Test instrument administration
In Admin mode, special test instrument settings can be configured. Under the Test instruments and Test instruments action tabs, the following actions are available for selection from the pop-up menu:
GDI device driver:
The corresponding GDI driver for the test instrument connected can be configured here. If the desired driver is
not displayed on the pop-up menu, check if the corresponding device driver was installed correctly.
237
Test instruments mode
Physical units:
This functions allows physical units to be defined for the various measured values of the stand-alone test instruments. However, the defined settings are not taken into account in guided fault finding. The following physical
units can be configured:
•
Voltage: V (volt)
•
Current: A (ampere)
•
Resistance: ohm
•
Pressure: bar (bar), lb/in2 (pound per square inch)
•
Temperature: °C (degrees Celsius), °F (degrees Fahrenheit)
Signal generator:
The signal generator function allows settings to be configured for the duration and pitch of the signal for the
continuity test. A frequency between 0 and 4000 Hz can be selected for the acoustic signal.
Test instruments, GDI components:
The version numbers of the GDI components used can be viewed here.
Self-test:
The self-test action allows the self-test integrated in the test instrument to be started. The result is shown in the
form of OK/not OK indication on the screen.
Target curve functionality:
After clicking on the target curve function action, perform user authentication to activate Expert mode for the
Oscilloscope target curve function. A dialogue appears prompting you to enter the location ID and the corresponding password in the text field.
Once this information has been entered correctly, the Activate and Cancel buttons will appear. If the target curve
function has already been activated, the Deactivate button appears instead of the Activate button.
238
Test instruments mode
Figure 9.27. Activating expert mode in the target curves function
Reference:
See also chapter Target curves function
239
Chapter 10. Virtual keyboard manual
10.1. Installation
Administrator rights are required for the installation. The installer for the "Virtual keyboard" can be opened without
graphical user interface. The parameters supported are listed in Table 10.1, “Installation parameters” .
/VERYSILENT
Suppresses the graphical user interface
/DIR=directory
The directory to which the "virtual keyboard" is to be installed
/UNINSTALL
Uninstallation of the "virtual keyboard"
Table 10.1. Installation parameters
Table 10.2, “Installer return values” includes the return values of the installer.
0
No errors
1
No administrator rights
7
There is not sufficient memory capacity on the drive
Table 10.2. Installer return values
During the installation process, a system service will be installed that starts the "virtual keyboard". This service
also monitors whether the "virtual keyboard" is running. If it is terminated by an application, the service restarts
the "virtual keyboard".
10.2. Software
The "virtual keyboard" runs on Windows XP with Service Pack 2 installed. It emulates a normal keyboard connected via USB or PS/2. The "virtual keyboard" program sends keyboard events to the active application in the
same way as by a real keyboard.
The "virtual keyboard" starts as soon as the login screen appears. The keyboard can be displayed or hidden via an
icon on the title bar (see Figure 10.1, “Title bar icon”) of the active application.
Figure 10.1. Title bar icon
10.2.1. User interface
If "Virtual keyboard" is displayed, the keyboard is always visible. It is transparent, allowing applications behind
the keyboard to be read. The "virtual keyboard" has no title bar, no system menu and no Minimise and Maximise
buttons. Instead, it has I+ME keys that can be used to set the size, type (numeric or normal keyboard) and transparency of the keyboard.
240
Virtual keyboard manual
Figure 10.2. Keyboard layout
Figure 10.3. Numeric keyboard
The I+ME keys have the following meaning:
Shows the settings dialogue
Reduces the size of the keyboard
Increases the size of the keyboard
Displayed components on the numeric keyboard
Hiding the numeric keyboard
Table 10.3. I+ME keys
10.2.1.1. Size of keyboard
Two keys can be used to scale the keyboard. The size of the keys and characters is adapted automatically when the
size of the keyboard is changed. It is not possible to increase the size of the keyboard beyond the size of the screen.
If you try to move the keyboard out of the screen area, it is pushed back. After hiding and re-displaying the
keyboard, it assumes its last size and position.
241
Virtual keyboard manual
The set size of the "virtual keyboard" is saved, not its current position, however. That means the "virtual keyboard"
is displayed at the bottom in the centre in the size last used when the user displays the keyboard for the first time
after a restart.
10.2.1.2. Special keys
On pressing a special key (SHIFT, STRG,...), this key is highlighted. This marking is removed again the next time
a normal key is pressed.
The currently active characters are displayed on the keys and pressing a special key adapts the layout accordingly.
The different display options are shown in Table 10.4, “Changing characters” using the "<" key as an example.
Normal
After pressing SHIFT
After pressing ALTGR
Table 10.4. Changing characters
10.2.1.3. Settings dialogue
The settings dialogue can be used to define the transparency of the "virtual keyboard". The possible values are in
the range between 0% (no transparency) and 90% (almost complete transparency). The keyboard's transparency
changes while the scroll bar is moved.
Press the OK button to apply the change. Press the Reset key to restore the setting that was active on opening
the window.
Figure 10.4. Settings dialogue
10.2.2. Languages
The keyboard layout changes, depending on the input language that is currently active. If a language is not supported, the US American keyboard is displayed.
The following languages are supported:
242
Virtual keyboard manual
Bulgarian
Chinese (Simplified)
Danish
German (Germany)
English (UK)
English (USA)
Farsi
Finnish
French (France)
Greek
Italian (Italy)
Japanese
Korean
Croatian
Dutch
Polish (programmers)
Portuguese
Rumanian
Russian
Swedish
Slovak (QWERTY)
Slovenian
Spanish
Taiwan (Bopomofo)
Taiwan (ChaJei)
Thai (Kedmanee)
Czech
Turkish (Turkish Q)
Hungarian
Table 10.5. Languages supported
10.2.3. Keyboard layouts
10.2.3.1. German
243
Virtual keyboard manual
10.2.3.2. Bulgarian
10.2.3.3. Chinese Simplified
244
Virtual keyboard manual
10.2.3.4. Danish
10.2.3.5. English GB
245
Virtual keyboard manual
10.2.3.6. English USA
246
Virtual keyboard manual
10.2.3.7. Farsi
10.2.3.8. Finnish
247
Virtual keyboard manual
10.2.3.9. French
248
Virtual keyboard manual
10.2.3.10. Greek
249
Virtual keyboard manual
10.2.3.11. Italian
250
Virtual keyboard manual
10.2.3.12. Japanese
10.2.3.12.1. Direct input
10.2.3.12.2. Hiragana
251
Virtual keyboard manual
10.2.3.12.3. Katakana
10.2.3.13. Korean
10.2.3.13.1. English
252
Virtual keyboard manual
10.2.3.13.2. Hangul
10.2.3.14. Croatian
253
Virtual keyboard manual
10.2.3.15. Dutch
254
Virtual keyboard manual
10.2.3.16. Polish
255
Virtual keyboard manual
10.2.3.17. Portuguese
10.2.3.18. Rumanian
256
Virtual keyboard manual
10.2.3.19. Russian
257
Virtual keyboard manual
10.2.3.20. Swedish
10.2.3.21. Slovak
258
Virtual keyboard manual
10.2.3.22. Slovenian
259
Virtual keyboard manual
10.2.3.23. Spanish
260
Virtual keyboard manual
10.2.3.24. Taiwan (Bopomofo)
10.2.3.25. Taiwan (ChaJei)
261
Virtual keyboard manual
10.2.3.26. Thai
262
Virtual keyboard manual
10.2.3.27. Czech
10.2.3.28. Turkish
263
Virtual keyboard manual
10.2.3.29. Hungarian
264
Virtual keyboard manual
265
Chapter 11. Administration mode
11.1. Operation
You can use Administration mode to configure various settings for Offboard Diagnostic Information System
Service.
Clicking on the Admin mode button makes the following view visible.
Figure 11.1. Administration window
The administration view provides five tabs for system settings, sorted by area. These tabs are as follows:
•
General
System-specific settings are configured here, such as the language or update mode.
•
Storage locations
The storage locations of the system and work data are configured here.
•
Support
The support settings are configured here.
•
Connections
266
Administration mode
The connections to individual services of the Group systems are configured here.
•
Verification
The verification is configured here if this function has been licensed.
The setting options listed are available on this tab.
In order to be able to define settings, first select the settings by clicking on them in the left-hand selection window.
The configuration options are then available in the right-hand window.
To reset previously saved changes to the factory settings, click on the Reset button.
To reset changes to the default state that have not yet been saved, click on the Reject button.
To save your changes, click on the Save button.
Note:
If you change system settings, Offboard Diagnostic Information System Service may no longer work. Only
make changes to the configuration after being requested to do so by Support. Changes made on your own are
your responsibility.
The following administration areas are available:
"General / brand design"
"General / language"
"General / update"
"General / system logging"
"General / system environment"
"General / licence information"
"General / global configuration"
"General / GFF sequence"
"General / keyboard settings"
"Storage locations / database"
"Storage locations / diagnostic session"
"Storage locations / flash paths"
267
Administration mode
"Storage locations / diagnostic protocol"
"Support / contact data"
"Support / outgoing mail server"
"Connections / brand settings"
"Connections / Group system: GFF"
"Connections / Group system: ElsaPro"
"Connections / Group system: Carport"
"Connections / Group system: DISS"
"Connections / Group system: eShop"
"Connections / mirror server 2"
"Verification / configuration"
Note:
The Verification tab is only available if Offboard Diagnostic Information System Service was purchased in
a product version with external verification.
268
Administration mode
11.2. General area
General / brand design
The graphical user interface of Offboard Diagnostic Information System Service can be adapted to a special
group brand in this area.
Figure 11.2. Selecting the design
The Selection list is used in Brand design details.
Designs of the following brands can be selected: Volkswagen, Audi, Bentley, Seat, Skoda, Lamborghini.
To reset previously saved changes to the default state, click on the Reset button.
To reset changes to the default state that have not yet been saved, click on the Reject button.
To save your changes, click on the Save button.
269
Administration mode
General / language
To change the language of Offboard Diagnostic Information System Service, click on the Language pop-up
menu.
Figure 11.3. Language setting
The desired language can be selected from the Language list in Language details.
The default selection is Automatically, i.e. the language corresponds to the operating system of the test device.
To reset previously saved changes to the default state, click on the Reset button.
To reset changes to the default state that have not yet been saved, click on the Reject button.
To save your changes, click on the Save button.
270
Administration mode
Note:
This only changes the language for the user interface. If documents exist in the changed language they are displayed in the newly set language, otherwise the documents remain in the languages installed.
To use Offboard Diagnostic Information System Service in different languages, in particular languages with
East Asian characters, the following steps are required:
In the Windows operating system, open Control Panel -> Regional and language options.
Figure 11.4. Additional Windows language support
On the Languages tab, activate the options in the Supplemental language support area.
OK: The changes are applied and the window is closed.
Cancel: The changes are not applied and the window is closed.
Apply: The changes are applied and the window is not closed.
271
Administration mode
Figure 11.5. Windows language display codes
On the Advanced tab, activate all Code page conversion tables.
On the Advanced tab, activate the Default user account settings.
OK: The changes are applied and the window is closed.
Cancel: The changes are not applied and the window is closed.
Apply: The changes are applied and the window is not closed.
Restart the system. The languages are now available.
272
Administration mode
General / update
How frequently Offboard Diagnostic Information System Service is to search mirror server 2 for updates can
be set under Planning in Update details.
Figure 11.6. Update view
Update cycle (in days): 1 needs to be entered as the default value in this text field. That means that available
program updates are searched for every day after the program has been started for the first time. If you enter 0
under Update cycle, Offboard Diagnostic Information System Service will start without searching for program
updates. Alternatively, you can enter the desired update cycle in days here. For example, if you would like to look
for updates every five days, enter the number 5 here.
Time for update: The desired update time can be specified here.
Update on (Monday - Sunday): The desired day of the week is selected here.
Start update after (s): A delay in time for the update start is entered here in seconds.
To reset previously saved changes to the default state, click on the Reset button.
To reset changes to the default state that have not yet been saved, click on the Reject button.
273
Administration mode
To save your changes, click on the Save button.
Note:
If 0 is entered as the value for the update cycle in days, Offboard Diagnostic Information System Service never
searches for existing updates. New data thus might be overlooked.
General / system logging
A selection window can be used to define the system logging contents. The system log is written into a log file,
which is sent with the feedback.
Figure 11.7. System configuration view
If the feedback support team requires more detailed information, the contents can be set in System logging details
under Setting.
The selection:
274
Administration mode
•
All
consists of all log contents listed here. This is the largest file. Its transmission may therefore take the longest
time.
•
Information
consists of log contents with information.
•
Warnings
consists of log contents with warnings.
•
Errors
consists of log contents with errors.
•
Fatal errors
consists of log contents with fatal errors.
The scope of the log information entered increases from "Fatal errors" to "All". A detailed log output may reduce
the performance.
To reset previously saved changes to the default state, click on the Reset button.
To reset changes to the default state that have not yet been saved, click on the Reject button.
To save your changes, click on the Save button.
275
Administration mode
General / system environment
This section informs you about system settings of Offboard Diagnostic Information System Service.
Figure 11.8. System environment view
Under System environment details,
•
the system path to the application directory is displayed,
•
the software and data versions,
•
the storage location of the diagnostic database, DIDB DB Basis,
•
the ECF version,
•
and the manufacturers and versions of the external diagnostic applications, MCD Server and PDU API.
The data cannot be changed here. The view is only for your information.
276
Administration mode
General / licence information
This view shows all licence details.
Figure 11.9. Licence information view, Part 1
Figure 11.10. Licence information view, Part 2
The following licence information is displayed:
•
Product and brand variants,
277
Administration mode
•
The expiry date, serial number and file path of the licence file,
•
The country code under Information,
•
The importer and dealer numbers and the dealer type under Licensed brand(s),
•
The hardware ID and the tester type under Hardware,
•
The version of the start program under Launcher.
The data is only for your information. Nothing can be changed.
Reference:
See also Note in "Diagnostic start-up" chapter.
General / global configuration
With the global configuration, all test devices (testers, notebooks) access the same configuration file, meaning
that all the devices have the same settings.
Figure 11.11. Global configuration view
For this, the global configuration file must be saved in a previously selected path in the local network.
278
Administration mode
Select: A path can be set here for the individual test devices under Global configuration directory.
Use global configuration: This option is for setting whether the test device is to apply the global configuration
settings if a corresponding file is specified in the directory described above.
Change global configuration: Select whether the configuration data of the test device is to be written back to the
global configuration directory under here. That overwrites the global configuration data.
To reset previously saved changes to the default state, click on the Reset button.
To reset changes to the default state that have not yet been saved, click on the Reject button.
To save your changes, click on the Save button.
Note:
If no global configuration directory is selected, Offboard Diagnostic Information System Service uses the local
configuration settings.
279
Administration mode
General / GFF sequence
The list of individual test steps on the left in the sequence view of guided fault finding can be enabled or disabled.
Figure 11.12. View of GFF sequence details
Always display test steps: If this setting is activated, the test steps are displayed. Otherwise, the list of test steps
is deactivated.
To reset previously saved changes to the default state, click on the Reset button.
To reset changes to the default state that have not yet been saved, click on the Reject button.
To save your changes, click on the Save button.
280
Administration mode
General / keyboard settings
The use of the virtual keyboard can be deactivated or activated.
Figure 11.13. Details view for the virtual keyboard
Use virtual keyboard: If this setting is activated, the virtual keyboard is activated. Otherwise, the use of the virtual
keyboard is deactivated.
If the use of the virtual keyboard is activated, it appears automatically if entries are required using the keyboard
in test programs of guided fault finding.
To reset previously saved changes to the default state, click on the Reset button.
To reset changes to the default state that have not yet been saved, click on the Reject button.
To save your changes, click on the Save button.
281
Administration mode
11.3. Storage locations area
Storage locations / database
The storage location of the diagnostic database can be set in this area.
Figure 11.14. Database directory
Select: This button can be used to set the storage location of the database directory in Database details in the
Windows file system.
To reset previously saved changes to the default state, click on the Reset button.
To reset changes to the default state that have not yet been saved, click on the Reject button.
To save your changes, click on the Save button.
282
Administration mode
Note:
You must consult support before changing this path! Otherwise the vehicle's diagnostic data is no longer available.
If the database is copied to a different location, the new path needs to be entered here.
Storage locations / diagnostic session
The storage location and the file name setting of the diagnostic session data can be preconfigured in this area.
Figure 11.15. Diagnostic session storage location
Select: This button can be used to select the specified storage location for the diagnostic session data under Diagnostic session details in the Target directory field.
During a session, the Windows Save dialogue can be used to save the session data to a different location.
File name pattern: A name pattern for the diagnostic session can be selected in the text field.
In the example displayed, the file name consists of the VIN, the date with four-digit year, two-digit month and
day and the exact time, e.g. VIN_2009-08-12_16-27-15.ses.
283
Administration mode
These specifications are possible:
• %YYYY#for the current year
• %MMM#for the current month
• %DD#for the current day of the month
• %hh#for the current hour of the day in 24 h format
• %mm#for the current minute of the hour
• %ss#for the current second of the minute
• %VIN#Vehicle Identification Number (chassis number) of the diagnosed vehicle.
• Freely definable text that may include the following characters:
• Letters in upper and lower case,
• All digits from 0 - 9,
• And the following characters: _(underline) -(minus) .(dot)
To reset previously saved changes to the default state, click on the Reset button.
To reset changes to the default state that have not yet been saved, click on the Reject button.
To save your changes, click on the Save button.
Note:
A storage location must be available to be able to save the session data.
284
Administration mode
Storage locations / flash paths
The file paths are specified in this area used by Offboard Diagnostic Information System Service to load flash
files.
Figure 11.16. Flash paths view
Select: In Flash path details under Flash paths, this button is used to specify the path to the flash files in the
Windows file system for Path 1 (CDROM) and Path 2 (hard drive). Local flash files can be stored under these
paths and made available for flashing.
To reset previously saved changes to the default state, click on the Reset button.
To reset changes to the default state that have not yet been saved, click on the Reject button.
To save your changes, click on the Save button.
The manual entry of the paths must comply with Windows specifications:
CDROM drive letter:\Flash data or
285
Administration mode
Drive letter:\Folder name\Flash data
Note:
If no valid path information is available here, local access to flash files is not possible.
Storage locations / diagnostic protocol
The storage location and the choice of names for diagnostic protocol in Windows file system are specified here.
Offboard Diagnostic Information System Service proposes a default setting.
Figure 11.17. Diagnostic protocol view
Select: The storage location for the diagnostic protocol can be entered under Diagnostic protocol in the Target
directory field in Diagnostic protocol details.
During a session the Windows Save dialogue can be used to save the protocol data to a different location.
File name pattern:A name pattern for the protocol can be selected in this text field. In the example displayed,
the file name consists of the VIN, the date with four-digit year, two-digit month and day and the exact time, e.g.
VIN_2009-08-10_14-32-34_dprot.
286
Administration mode
These specifications are possible:
• %YYYY#for the current year
• %MMM#for the current month
• %DD#for the current day of the month
• %hh#for the current hour of the day in 24 h format
• %mm#for the current minute of the hour
• %ss#for the current second of the minute
• %VIN#Vehicle Identification Number (chassis number) of the diagnosed vehicle.
• Freely definable text that may include the following characters:
• Letters in upper and lower case,
• All digits from 0 - 9,
• And the following characters: _(underline) -(minus) .(dot)
To reset previously saved changes to the default state, click on the Reset button.
To reset changes to the default state that have not yet been saved, click on the Reject button.
To save your changes, click on the Save button.
Note:
To avoid confusion with other files, the diagnostic protocol is saved in the default settings with the VIN in the
file name.
287
Administration mode
11.4. Support area
Support / contact data
The data of the person available to support as the contact is entered here.
Figure 11.18. Support view
The contact and his address data for support enquiries is entered in Contact details under Contact data for
enquiries
Possible data:
•
First name
•
Surname
•
E-mail address
•
Telephone number
The Automat. positive feedback field is used to set whether feedback on the statistical evaluation is to be sent
after every diagnostic session, even is there are no problems.
288
Administration mode
Off: No automatic positive feedback is sent.
On: Automatic positive feedback is sent.
To reset previously saved changes to the default state, click on the Reset button.
To reset changes to the default state that have not yet been saved, click on the Reject button.
To save your changes, click on the Save button.
Note:
This information is required so that the support team can consult the correct contact in the event of enquiries.
Reference:
See also "Support" chapter
289
Administration mode
Support / outgoing mail server
The feedback mail connection for support is configured in this area.
Figure 11.19. Outgoing mail server view
The following is set in Outgoing mail server details under Connection parameters:
•
Connection:
An e-mail is sent with every feedback - Mail setting,
The feedback is stored temporarily and locally - QUEUE setting.
If you switch from the QUEUE setting to the Mail setting, Offboard Diagnostic Information System Service
sends the temporarily saved e-mails with the next feedback.
•
Mail server: The name of the mail server
•
Mail server port: The port of the mail server
•
Mail server login: Set a tick here if login to the mail server is requested.
•
Login name: The login name for the mailbox entered here is automatically entered in the Login window
during login.
•
Password usage:
290
Administration mode
The password is saved until Offboard Diagnostic Information System Service is closed. If the password is
to apply until Offboard Diagnostic Information System Service is closed, on sending the message a login
window opens, in which the login name and the password are entered by default.
The password only applies to the next feedback transmission.
•
Secure connection If the mail server requests SSL or TSL, a tick must be set here.
•
E-mail transmission address: You can enter your own sender address here. That is necessary if the support
team is to send a reply to this address.
To reset previously saved changes to the default state, click on the Reset button.
To reset changes to the default state that have not yet been saved, click on the Reject button.
To save your changes, click on the Save button.
If the e-mail is sent via the mail server of a provider, the provider's specifications need to be entered. The provider
provides the necessary data, such as mail server address, SMTP port and security settings. For login, the login
name must be used for the mailbox and the password that was assigned.
If there is a separate network with its own mail server, it must be configured forSMTP (Simple Mail Transfer
Protocol). An old mail server, which does not support this protocol (e.g. older versions of Microsoft Exchange),
cannot be used. The administrator of the mail server provides the necessary data for the configuration of the
outgoing mail server.
Reference:
See also "Support" chapter
Note:
The configuration entries for the mail server must be entered precisely according to the specifications. Free text,
such as mail server information and mail transfer address, is not checked. Faulty entries will cause feedback
transmission errors.
The outgoing mail server does not support the use of a proxy server for access to the internet.
If security software is used, such as a firewall or anti-virus protection, make sure that it doesn't block the mail
server or the ports used.
The size limit set on the mail server for e-mails must be observed. Your provider or mail server administrator can
give you the required information. The size limit might need to be adjusted, if this is possible. If a feedback mail
exceeds this size limit, it will not be sent. Feedback mails with attached files may have a size of 2MB to 5MB.
Backend mail transmission is implemented by the JavaMail standard software library. If transmission errors occur
in this software, only the English original text can be displayed in error messages. In this case, reference to the
original text of the error message is made. There are exceptions:
291
Administration mode
If the mail server is not entered correctly, login is displayed with error message ODS9102E with a reference to
the unknown mail server.
Figure 11.20. Error message for incorrect mail server
The user name and password can be re-entered.
Apply: User name and password are accepted.
Cancel: Login is cancelled.
If a syntactically incorrect sender address is entered, login appears with error message ODS9105E with a note
on the invalid sender mail address.
Figure 11.21. Error message for incorrect sender mail address
The user name and password can be re-entered.
Apply: User name and password are accepted.
Cancel: Login is cancelled.
292
Administration mode
11.5. Connections area
Connections / brand settings
How each Group brand connects to the Group system, via CPN or Internet, can be set here.
Figure 11.22. Brand settings view
Brand to be configured: The brand can be selected from the Selection list for which the settings are to be defined
in the following views on the Connection types tab. Only the brands licensed for the tester are available in this
brand selection.
Connection types: Whether a Group system service is called via a CPN or an Internet address is selected here.
This setting can be defined individually for each brand.
To reset previously saved changes to the default state, click on the Reset button.
To reset changes to the default state that have not yet been saved, click on the Reject button.
To save your changes, click on the Save button.
293
Administration mode
Note:
The predefined addresses for Group system services may only be changed after consulting the support team of
the corresponding brand. Otherwise, access is not possible.
Connections / Group system: GFF
The network addresses of the group services accessed by Offboard Diagnostic Information System Service can
be configured in this area.
Figure 11.23. Group system: GFF view
The Group system details: GFF view lists all service addresses used in GFF test programs, the URLs of which
can be entered:
•
Pin Service
•
SVMService
•
RepairHints
•
ProtoService
294
Administration mode
To reset previously saved changes to the default state, click on the Reset button.
To reset changes to the default state that have not yet been saved, click on the Reject button.
To save your changes, click on the Save button.
Offboard Diagnostic Information System Service specifies addresses for these services.
Note:
If incorrect addresses are entered here, GFF test programs will not be able to access the necessary Group systems
and can therefore not be executed successfully.
Connections / Group system: ElsaPro
The access data for services of the ElsaPro Group system is configured here.
Figure 11.24. ElsaPro Group system view
295
Administration mode
To be able to display data from ElsaPro in Offboard Diagnostic Information System Service the URLs for
•
Vehicle history,
•
Workshop manuals,
•
Technical product information,
•
Circuit diagrams
•
Field actions
need to be entered under Group system details: ElsaPro.
The data required to log on to the Group systems,
•
Brand (1 character)
•
Country (3 characters)
•
Dealer ID (5 characters)
is taken from the licence and only displayed here.
To reset previously saved changes to the default state, click on the Reset button.
To reset changes to the default state that have not yet been saved, click on the Reject button.
To save your changes, click on the Save button.
Note:
If these entries are not correct, either the ElsaPro data cannot be accessed or the required login to the Group
systems will fail.
296
Administration mode
Connections / Group system: Carport
The address for connecting to the carport Group system is configured in this area. Offboard Diagnostic Information System Service specifies an address.
Figure 11.25. Carport Group system view
The URL for vehicle data via which this service is accessed is entered under Group system details: Carport
To reset previously saved changes to the default state, click on the Reset button.
To reset changes to the default state that have not yet been saved, click on the Reject button.
To save your changes, click on the Save button.
Note:
If the URL is not entered correctly, the Carport service cannot be accessed and no vehicle data is available.
297
Administration mode
Connections / Group system: DISS
The address for connecting to the Group system, DISS, is configured in this area. Offboard Diagnostic Information System Service specifies an address.
Figure 11.26. Group system DISS view
The DissUrl for the Group system, DISS, via which complaints are transferred, is entered under Group system
details: DISS.
To reset previously saved changes to the default state, click on the Reset button.
To reset changes to the default state that have not yet been saved, click on the Reject button.
To save your changes, click on the Save button.
298
Administration mode
Note:
Without a correct URL for DISS, no complaints can be displayed from the DISS system or assigned TPI.
Connections / Group system: eShop
The address for connecting to the Group system, eShop, is configured in this area. Offboard Diagnostic Information System Service specifies an address.
Figure 11.27. Group system eShop view
The URL for the eShop service for the automatic renewal of licences acquired via eShop is entered under Group
system details: eShop.
To reset previously saved changes to the default state, click on the Reset button.
To reset changes to the default state that have not yet been saved, click on the Reject button.
299
Administration mode
To save your changes, click on the Save button.
Note:
Without the correct URL for the eShop licence update service, automatic licence renewal via Offboard Diagnostic Information System Service is not possible. Without automatic renewal, the licence that will expire must
be re-ordered via eShop.
Connections / mirror server 2
Offboard Diagnostic Information System Service obtains files for updates and external verification from mirror
server 2.
Figure 11.28. Mirror server 2 view
The address of the local mirror server is entered in the Mirror server URL field that was configured locally
for the workshop.
Entries only need to be made in the Mirror server user and Mirror server password fields if the local mirror
server was configured during login. The local administrator provides this information.
300
Administration mode
To reset previously saved changes to the default state, click on the Reset button.
To reset changes to the default state that have not yet been saved, click on the Reject button.
To save your changes, click on the Save button.
11.6. Verification area
Verification / configuration
This setting is used to configure the additional external verification function. This setting option is only available
if Offboard Diagnostic Information System Service was purchased with this feature.
Figure 11.29. External verification view
Select: In Configuration details under Configuration, this button is used to specify the verification target
directory in the Windows file system. That is the default directory for saving verification data provided from
GFF editors via mirror server 2.
Data on the tester editing the verification data is entered in the other fields:
•
Initials of tester
•
First name of tester
•
Surname of tester
•
E-mail address of tester
301
Administration mode
To reset previously saved changes to the default state, click on the Reset button.
To reset changes to the default state that have not yet been saved, click on the Reject button.
To save your changes, click on the Save button.
If the Verification tab is activated for the first time during a diagnostic session after starting Offboard Diagnostic
Information System Service, a login dialogue is displayed, in which the tester's data needs to be entered. This
login dialogue contains the data entered and saved here as the default values.
Note:
The external verification configured here can only be used if a corresponding Offboard Diagnostic Information
System Service licence has been acquired. A verification point must be specified in this licence, which must
correspond to the tester specified here.
302
Chapter 12.
functions
Additional
This chapter describes those functions that are available across all different modes.
These additional program functions or standard functions consist of three menus:
•
The Data menu
•
The Extras menu
•
The Help menu
12.1. Data
The Data menu contains the following four function areas:
•
Current view
•
Diagnostic protocol
•
Diagnostic session
•
Hotfix.
Figure 12.1. Data button
303
program
Additional program functions
Note:
After an Offboard Diagnostic Information System Service software or data update, the diagnostic session data
of a predecessor version cannot be loaded any more since software version and DIDB version deviate. To resume
an interrupted diagnostic session by loading the diagnostic session data, the software and DIDB versions must
match.
Reference:
See "System environment" in the Administration chapter.
12.1.1. Current view
Current view:
Click on this button to create and print a screenshot of the current view. The operating system's
standard selection window opens for selecting the printer. If a view is empty, e.g. a tab without content, this button
is greyed out.
12.1.2.
Diagnostic protocol
Diagnostic protocol:
Click on this button to send the current diagnostic protocol to Volkswagen. For this, an online
connection and login to the Group systems are required. If no such connection is currently available, the data is
stored temporarily and sent the next time the Group system is available after logging on to the Group systems. In
addition, the diagnostic protocol is stored at the storage location for diagnostic protocols as file with the extension
.b64 for external transmission.
Reference:
See chapter "Login to Group systems".
Click on this button to save the current diagnostic protocol. The Windows dialogue appears
for saving files.
The DiagnosticProtocols subfolder in the Offboard Diagnostic Information System Service directory is proposed as the storage location. The diagnostic protocol is saved in html format and can be viewed in the web
browser. This button is enabled after performing diagnosis.
Click on this button to print the current diagnostic protocol after selecting the scope of the
protocol. A print menu appears. Select the printer. This button is enabled after performing diagnosis.
Three different scopes are available to send, save and print the saved protocol.
1. The long protocol type includes the entire data of a diagnostic session.
2. The short protocol type includes the entire vehicle-specific data of a diagnostic session, without GFF data.
304
Additional program functions
3. The function test protocol type includes the GFF data of a diagnostic session.
Figure 12.2. Selecting the diagnostic protocol
OK: The selected protocol type is printed or saved.
Cancel: The selection of the protocol type is cancelled and the window is closed.
Click on this button to open a Help window in the folder with the stored diagnostic protocols.
A diagnostic protocol that has already been saved as Html and XML or possibly as file with the extension .b64
can be copied here. A b64 file can thus be copied to an external storage medium, such as a USB stick, to send
it from another tester.
Click on this button to open a Windows file window for opening a *.b64 file. This function
can be used to load a diagnostic protocol in b64 format from an external storage medium, such as a USB stick,
and then send it to Volkswagen, if the Group system connection is not available at the original tester. This button
is already available after starting the application.
305
Additional program functions
12.1.3.
Diagnostic session
Diagnostic session:
Click on this button to save the current diagnostic session to the sessions subfolder and resume
it later on. This button is enabled after performing a diagnosis.
Reference:
See next chapter "Repair interruption".
Click on this button to load a previously saved diagnostic session into Offboard Diagnostic
Information System Service. This button is only available directly after starting the application, before performing a diagnosis.
Reference:
See next chapter "Continuing a repair".
12.1.3.1. Repair interruption
Diagnostic sessions can be interrupted and restarted for a repair interruption. The menu with the buttons is
described in detail above.
Reference:
See also chapter "Data"
Note:
The vehicle state, i.e. the state of the control units (addressability, identification data and event memory entries),
must not be changed between the saving and loading of the diagnostic session data.
This button is used to interrupt the diagnostic session. Offboard Diagnostic Information
System Service then opens the Stop query.
Figure 12.3. Query if a diagnostic session is cancelled
Yes: The storage location defined in the administration settings is proposed as the storage location.
306
Additional program functions
No: Saving the diagnostic session is cancelled.
Figure 12.4. Saving a diagnostic session
Diagnostic session files have the file extension *.ses.
Save: The diagnostic session is saved.
Cancel: Saving the diagnostic session is cancelled.
After saving the session, Offboard Diagnostic Information System Service asks whether feedback is to be sent.
Figure 12.5. Feedback after saving a diagnostic session
Cancel: The support request is cancelled.
Send support request: The support request is sent.
Then the system is back at the start position again.
Reference:
307
Additional program functions
See Administration chapter "Storage locations area".
Note:
The diagnostic sessions are saved in the default settings to the test device, thus enabling a diagnostic session to
also be resumed or interrupted in test drive mode. If a network path has been entered in the settings, the data will
be saved locally during mobile operation and compared when a network connection is available. Changes to the
settings for saving data can be made in Admin mode.
Reference:
See also Administration chapter "Storage locations area".
12.1.3.2. Continuing a repair
To continue a repair, the diagnostic session data can be re-applied. The menu with the buttons is described in
detail above.
Reference:
See also chapter "Data"
When a diagnostic session is in progress, no other diagnostic session can be resumed, which is why this button is
then greyed out. It is only possible to resume diagnostic sessions if diagnostic start-up was not performed.
If you click on the Continue button, the Windows dialogue appears for loading a file.
Figure 12.6. Loading a diagnostic session file
The desired diagnostic session file must be selected here.
Open: The diagnostic session is loaded.
Cancel: Loading the diagnostic session is cancelled.
308
Additional program functions
Note:
The vehicle state, i.e. the state of the control units (addressability, identification data and event memory entries),
must not be changed between the saving and loading of the diagnostic session data.
If the vehicle state is changed, Offboard Diagnostic Information System Service displays an error message with
a note on the modified data.
Figure 12.7. Error while loading a diagnostic session
In the example shown above, the VIN of the saved vehicle has changed compared to the vehicle currently connected.
To load a diagnostic session, login to the Group systems is activated.
Figure 12.8. Login while loading a diagnostic session
309
Additional program functions
If the data from the Group systems is to be used for a resumed session, login is required.
Apply: The login data entered (global user ID and password) is accepted and login performed.
Cancel: Login to the Group systems is cancelled. No Group system information is available during the loaded
session.
Reference:
See also chapter "Data"
12.1.4. Hotfix
Hotfix:
If you click on this button, it is possible to download a hotfix or workshop data patch. A hotfix
is provided individually to a dealer (or a workshop) in a special folder on mirror server 2.
Typical hotfix data is diagnostic data or GFF test programs adapted specially for the dealer. Active hotfixes may
be overwritten by newer ones.
After activating the Get button, Offboard Diagnostic Information System Service searches for the workshop
patch under the mirror server 2 address. If it is available, the user is asked whether the patch is to be installed.
With a positive confirmation, the patch is installed. Otherwise, the installation can also be cancelled.
If the connection to mirror server 2 could not be established or if no data is found there, a corresponding message
is displayed.
If you click on this button, it is possible to delete an installed hotfix or workshop data patch.
Offboard Diagnostic Information System Service asks the user if the workshop patch is really to be deleted.
With a positive confirmation, the patch is deleted. Otherwise, you can also cancel the deletion here.
Note:
The date of the hotfix update is not saved.
310
Additional program functions
12.2. Extras
The following functions are available in the Extras menu of the standard functions:
Figure 12.9. Contents of the Extras menu
•
Search function (Find)
•
Vehicle Communication Interface (VCI)
•
Test drive
12.2.1.
Search
Search:
The search function is opened using the Find button.
The magnifying glass symbol can also be used to open the search function from the Overview of tests.
Reference:
See also "Component selection" chapter.
After clicking on the button or magnifying glass symbol, the search dialogue appears, which is empty on opening
it for the first time during a diagnostic session. When opened the next time, the last search result is displayed
by default.
311
Additional program functions
Figure 12.10. Dialogue for the search function
Search terms: One or more search terms can be entered in this text field. Several search terms need to be
separated by commas.
Object types: The search can be limited to specific types here, such as test programs, documents, diagnostic
objects, special functions and guided functions. At least one object type must be selected.
Reference:
See also chapters "Using GFF", "Documents", "DISS/TPI", "Test plan and special functions" and "Self-diagnosis".
Find: This button is enabled if a search term is entered and at least one object type has been selected. After
activating it, the results are displayed under Search results.
312
Additional program functions
Figure 12.11. Displaying the search results
The results are sorted by
object type and
source.
Go to: To go to the corresponding result or add the object type that has been found to the test plan, select the
corresponding entry. Then this button is enabled. Click on the Go to button to open the marked objects.
A document is displayed in the document view.
A guided function is started during the process.
A test program is attached to the test plan.
With a diagnostic object, an existing test is attached to the test plan.
A special function is added to the special functions.
The following figure shows a search result.
Figure 12.12. Example of a search result
313
Additional program functions
The test program "Connection to the air-conditioning control unit" was selected in the search results here and the
Go to button was clicked on. Offboard Diagnostic Information System Service attaches the corresponding test
program to the test plan and switches to the test plan view.
Note:
The search function will not be active until after diagnostic start-up has taken place. If no diagnostic start-up has
taken place, the
to search for object types.
button or the magnifying glass symbol is inactive
and it is not possible
Note:
If the search function is started using the Component selection, it is only possible to search for the diagnostic
object object type.
12.2.2. VCI
VCI:
It is possible to change the diagnostic hardware.
Note:
Offboard Diagnostic Information System Service has been prepared for the use of PassThru boxes. The following
models can be used with Offboard Diagnostic Information System Service without restrictions:
•
Blue Streak Electronics Inc. - iflash Global Programmer
•
Dearborn Group - VSI-2534
•
Drew Technologies - CarDAQ-Plus
•
I+ME Actia GmbH - PassThru+ XS
The PassThru boxes listed have already been configured as diagnostic interfaces in Offboard Diagnostic Information System. For start-up, you only need to connect the respective box to the diagnostic tester via USB port and
install the corresponding software package from the Offboard Diagnostic Information System Service installation
folder (sub-directory: "drivers").
Figure 12.13. Changing the diagnostic hardware
314
Additional program functions
In the Extras menu of the standard functions, the dialogue for changing the diagnostic hardware is selected by
clicking on VCI.
The change is made in several steps:
Figure 12.14. Removal of the diagnostic hardware
1. Remove the currently connected diagnostic hardware and confirm this in the dialogue box.
Cancel: The diagnostic hardware change is cancelled.
Figure 12.15. Selection of the desired diagnostic hardware
315
Additional program functions
2. Selection of the desired diagnostic hardware in the dialogue box
Cancel: The diagnostic hardware change is cancelled.
Figure 12.16. Connecting the new diagnostic hardware
3. Connecting the new diagnostic hardware to the vehicle and confirming it in the dialogue box.
Cancel: The diagnostic hardware change is cancelled.
Figure 12.17. Changing the diagnostic hardware
316
Additional program functions
4. Clicking on Change to confirm the connection of the new diagnostic hardware.
Cancel: The diagnostic hardware change is cancelled.
The change is thus completed.
Figure 12.18. Diagnostic hardware has been changed
Close: The dialogue for changing the diagnostic hardware is closed.
If the change fails, Offboard Diagnostic Information System Service will inform you of this in the dialogue.
Figure 12.19. Changing the diagnostic hardware failed
Close: The window is closed.
If problems occur while changing the diagnostic hardware, please contact Support.
Reference:
See chapter "Diagnostic start-up"
317
Additional program functions
12.2.3. Test drive
Test drive:
A Test drive mode is integrated in Offboard Diagnostic Information System Service. Activate this mobility
mode if a test drive is being carried out with the vehicle and there is thus no network connection available to
the tester.
Note:
Mobile operation can only be started and ended when there is a network connection.
The Test drive button has two situation-dependent functions and changes its appearance accordingly:
If the application is not in test drive mode, it is started using this button.
If the application is in test drive mode, it is exited using this button.
Click on this button to start test drive mode.
The following message appears:
Figure 12.20. Activating test drive mode
Deactivate Test drive mode:To copy all the required data to the test device, click on this button.
Cancel: Activation of test drive mode is cancelled.
After copying has taken place, a message appears stating that test drive mode is now activated.
Figure 12.21. Confirmation that test drive mode is active
318
Additional program functions
OK: Click on this button to confirm the message.
This symbol is now displayed in the information area, showing that test drive mode is now activated.
The data created during mobile operation is saved temporarily to the test device. It is also possible to send feedback.
Feedback messages are stored temporarily until test drive mode has been ended and a network connection reestablished. They are sent by the system.
To cancel test drive mode, click on this button.
Test drive mode can then either be cancelled or ended.
Figure 12.22. Ending test drive mode
Cancel test drive mode If you click on this button, no mobile data is synchronised with the workshop network.
The data created in test drive mode will be deleted.
End test drive mode: If you click on this button, the mobile data from Offboard Diagnostic Information System
Service is synchronised with the workshop network and test drive mode is ended.
Cancel: Ending or cancelling test drive mode is cancelled and the diagnostic session remains in test drive mode.
Figure 12.23. Confirmation that test drive mode has been cancelled
Ok: Cancellation of test drive mode is confirmed.
Figure 12.24. Confirmation that test drive mode has been ended
319
Additional program functions
Ok: Ending test drive mode is confirmed.
The symbols in the information area of Offboard Diagnostic Information System Service are displayed here
that indicate the status of the network connection and of test drive mode.
Network connection is available. Test drive mode can be activated.
Network connection is interrupted. Test drive mode cannot be activated. A network connection must be
established first.
Test drive mode is activated.
Test drive mode is activated but the network connection is interrupted.
Note:
If the directory in which the global configuration is saved to the server is renamed or deleted in test drive mode,
a corresponding message does NOT appear when ending test drive mode. Offboard Diagnostic Information
System Service continues to use the local copy of the configuration. The individual responsible for the network
ensures that Offboard Diagnostic Information System Service is correctly configured after any changes to the
workshop infrastructure have been made.
320
Additional program functions
12.3. Help
The Help menu includes these two functional areas that provide the user with support in the event of problems:
•
Online help
•
Support...
Figure 12.25. Help menu
321
Additional program functions
12.3.1. Online help
Online help:
After clicking on this button, the online help appears in a separate window, in which the help
texts are displayed in the context of the application.
The online help can be accessed at all times during operation of Offboard Diagnostic Information System Service.
Example: If you have currently opened the Test plan tab after performing guided fault finding and then click on
the help symbol, the online help will open with the corresponding Guided fault finding chapter.
Figure 12.26. Context-related online help
A more exact description of the online help window follows.
322
Additional program functions
Figure 12.27. The online help window
In the left-hand area of the online help
you can use the table of contents to find the desired chapters.
For navigation in the table of contents and the search results there are navigation symbols
below the window.
The navigation symbols can be used from the left to the right to open the complete table of contents, to list all
search results of a search, to display the current link and to set a bookmark.
In the right-hand area of the online help
the navigation bar
the desired information is displayed after selecting a chapter. Use
to navigate in this area.
The search function
can also be used to search for specific terms in the online help. After entering the search
term, click on Go to start the search.
You can use links and the navigation bar to move within the right-hand window with the help texts.
323
Additional program functions
Figure 12.28. Navigation in the online help
To navigate in the help texts displayed in the area on the right, use the links (shown in blue and underlined). The
links are always above and below a chapter or sub-chapter and the text also includes references that work as direct
links to the specified chapters.
Back: This link is used to scroll back a page.
Next: This link is used to scroll to the next page.
Text reference: This link takes you to the corresponding chapter.
In addition, the navigation bar (item 4 in the figure with the online help window further up) can be used to
navigate in the help.
Figure 12.29. Navigation bar of the online help
You can use the navigation bar displayed above from the left to the right to navigate backwards and forwards,
access the start page of the online help, display the table of contents, set a bookmark, print the help text and
maximise the help window.
324
Additional program functions
12.3.2. Support
Support:
There are several ways of sending a support request or feedback from Offboard Diagnostic Information System
Service.
For standard functions that are always visible, use the Support button to send a support request at any time.
The question whether feedback is to be sent is part of the process of exiting a diagnostic or flash session.
Reference:
See "Ending diagnosis" chapter.
See "Flash mode" chapter.
On exiting the application, it is also possible to send feedback.
This button is used to open the Send support request window.
Figure 12.30. The "Send support request" window
This button can be used to send a screenshot of the error message or problem with the
support request. Clicking on the Insert screenshot button inserts a screenshot of the current view of Offboard
Diagnostic Information System Service in the text box.
To cancel the support request without sending it, click on the Cancel button. The window is closed.
Cancellation of the support request needs to be confirmed in a query.
325
Additional program functions
Yes: The support request is cancelled and exited.
No: The support request is not cancelled.
Click on this button to send the support request. This button is only enabled if the mail address in
the hotline section is valid.
The online help for feedback operation is available via this button.
The Information on the feedback sender section is at the top left of the support window.
Figure 12.31. Information on the feedback sender
The
First name,
Surname,
E-mail address and
Telephone no.
are entered here.
If information on the feedback sender is entered in the administration under Support area (see reference below),
it is set by default. The data can be overwritten in the Send support request dialogue. If the overwritten data is
to be reused for the next support request, change it in the administration under Support area.
In addition to the sender data, the brand of the diagnostic data used must be selected in the Manufacturer field if
no diagnostic session is currently active. Otherwise, the field is specified by default according to the vehicle brand.
Reference:
See "Support area" in the Administration mode chapter.
The Error classification section is for assigning the error to an area of the application.
326
Additional program functions
Figure 12.32. Feedback error classification
Whether it is a hardware error, software error, a content-related error, a faulty translation or whether the error
cannot be assigned to any of these areas is specified here. Only one selection is possible.
The Priority section is for specifying how urgently the error needs to be rectified.
Figure 12.33. Feedback error priority
Activate For your information if you are providing feedback in the form of comments or suggestions. That is
the default setting.
Activate Order processing only possible to a limited extent if discrepancies or error messages occur that impede
the workflow.
Activate Order processing not possible if this error prevents you from working with Offboard Diagnostic Information System Service.
To add the current diagnostic session, select the Add current diagnostic session checkbox.
Figure 12.34. Attaching a diagnostic session
The current diagnostic session includes information that makes it easier for the Offboard Diagnostic Information
System Service development team to understand the user's feedback. The current diagnostic protocol is attached
automatically with every feedback.
Note:
The Attach current diagnostic session checkbox should always be selected if support is requested due to problems executing GFF.
In the event of errors, please do not fail to include a screenshot to accelerate identification and rectification of
the error.
327
Additional program functions
If Mail server login is activated in the support/outgoing mail server administration, the dialogue for logging on
to the server appears when you click on the Send button.
Figure 12.35. Mail server login for feedback
Apply: The user and password data entered is used to log on to the mail server and send the feedback.
Cancel: Feedback transmission is cancelled.
If the login data, the login name or the password, is entered incorrectly, error message ODS9106E appears with
a note on the incorrect login data.
Figure 12.36. Incorrect mail server login
Apply: The user and password data entered is used to log on to the mail server and send the feedback.
328
Additional program functions
Cancel: Feedback transmission is cancelled.
Reference:
See "Outgoing mail server details" in the Administration chapter.
Note:
If there is currently no online connection, the support request is stored temporarily in the system and sent the
next time an online connection is established.
Figure 12.37. Feedback message with offline connection
OK: The message is confirmed and closed.
329
Additional program functions
12.4. Info
After starting Offboard Diagnostic Information System Service a window is displayed with general warnings
and notes. The following figures show the window with different positions of the scroll-bar:
Figure 12.38. Window with warnings/notes (part 1)
330
Additional program functions
Figure 12.39. Window with warnings/notes (part 2)
331
Additional program functions
Figure 12.40. Window with warnings/notes (part 3)
OK: The window is closed.
These warnings and notes can be opened at all times via the Info area.
The following information functions are available in the Info area.
332
Additional program functions
Figure 12.41. Info area
•
New features:
This button is used to open the Release Notes with information on new functions compared to the previous
version of Offboard Diagnostic Information System Service and on errors rectified.
The window is automatically displayed during the first start after each new installation of Offboard Diagnostic
Information System Service.
•
Versions:
This button is used to open the Version information window. It contains information on the installed versions
of Offboard Diagnostic Information System Service, the diagnostic data, the MCD server, the PDU API, the
ECF and the ODX projects.
•
Attention:
This button is used to open the Warnings/notes window with warnings and notes of the Attention category.
•
Caution:
This button is used to open the Warnings/notes window with warnings and notes of the Caution category.
•
Note:
This button is used to open the Warnings/notes window with warnings and notes of the Note category.
The Info menu can be used to select the Attention, Caution and Note descriptions individually.
333
Chapter 13. External verification
Note:
External verification is only available if Offboard Diagnostic Information System Service was purchased in a
product version with external verification.
The External verification application is available on the Verification tab in the Diagnosis view.
The external verification is for checking editorial objects. These editorial objects need to be verified before productive operation on the testers. Editorial objects may be elements of the equipment network, diagnostic objects,
additional documents, function tests and texts.
Reference:
See "Verification" in the extended configuration
334
Chapter 14. Error messages
Error messages may occur for a variety of reasons while you are using Offboard Diagnostic Information System
Service . Error messages contain information that is important for classification and for the subsequent procedure.
Figure 14.1. Description of the error messages
Error ID: The ID assigned to the error.
Topology name: The name of the application range where the area occurs.
Error description: The description of the malfunction.
OK: Closes the error message.
Use the error ID to look for the specific error message in the "Error ID" table. The column on the right, Notes,
describes how to further proceed.
Note:
The most frequently encountered error messages occur as a result of connection failures to the vehicle and the
network. In this case, it is recommended to check the connections and restart the system.
335
Error messages
14.1. Error IDs
ID
Error displayed
Note
No ID
No vehicle data found.
This message may be displayed on the following
tabs: Orders, Vehicles and PR numbers.
Please check the network connection and inform
Support.
No ID
This page cannot be displayed.
The information area of the user interface shows
the current network status. If the network status is "offline", the following tabs cannot be displayed: TPI, Action, History, Circuit diagrams
and Manuals.
Please check the network connection and inform
Support.
No ID
No network connection available.
This error message is displayed in the following situation: a tab is activated while the network
connection is active; in the meantime, the network connection is interrupted.
Connect to the network again or contact Support.
ODS0001E
Sensor ... is not connected to logical port ....
Please contact Support.
ODS0002E
It is not permitted to execute ... in the current Please contact Support.
state.
ODS0003E
Object ... is in poor condition.
ODS0004E
The configuration does not correspond to the Please contact Support.
connected device.
ODS0005E
A fault has occurred in the display module of the Please contact Support.
oscilloscope.
ODS0006E
No trigger channel has been set up for the trig- Please contact Support.
gered measurement.
ODS0007E
The GDI versions of the GDI components do not Please contact Support.
match.
ODS0008E
A GDI error has occurred.
ODS0009E
An error has occurred in the GDI coordinator: ... Please contact Support.
(error code: ...
ODS0010E
An error has occurred in the GDI driver: ... (error Please contact Support.
code: ...
ODS0011E
There is a conflict with the DCD.
ODS0012E
An error occurred during installation of the de- Please contact Support.
vice driver.
ODS0013E
The measuring device is not configured in the Please contact Support.
GDI driver.
ODS0014E
An error has occurred while parsing target Please contact Support.
curve ....
ODS5001E
No knowledge base is available for the selected Please check if there is an update for the softmodel ... .
ware or data.
Please contact Support.
Please contact Support.
Please contact Support.
"Flash" mode cannot be executed for this model. If the error still applies, please contact Support.
336
Error messages
ID
Error displayed
Note
ODS0502E
This software installation is incomplete.
Please check if there is an update for the software or data.
"Flash" mode cannot be executed with the existing software.
If the error still applies, please contact Support.
ODS0503E
"Flash" mode does not support the current Please check if there are updates for the software
brand ... at the moment.
or data.
"Flash" mode cannot be executed for this brand. If the error still applies, please contact Support.
ODS0504E
There are inconsistencies within the diagnostic Please check if there is an update for the softdata for the current brand ... .
ware or data.
"Flash" mode cannot be executed for this brand. If the error still applies, please contact Support.
ODS0505E
There are ambiguities within the diagnostic data Please check if there is an update for the softfor the current brand ... .
ware or data.
"Flash" mode cannot be executed for this brand. If the error still applies, please contact Support.
ODS1001E
Not available - Timeout after ... seconds.
Please contact Support.
ODS1002E
The session has expired for account ....
Please restart the program.
If the error still applies, please immediately contact Support.
ODS1003E
Unable to connect to VehicleBaseServiceV15. Incorrect connection data and server data has
been entered in the Administration area.
Please contact Support.
ODS1004E
Connection to ... was interrupted.
Please try again. If you are still unable to log in,
please contact Support.
ODS1005E
Transmission problem ... occurred with connec- Please try again or contact Support.
tion to ....
Connection interrupted.
ODS1006E
Unable to connect with the URI/URL.
The address entered is not responding or reacting at the moment.
Please try again later or contact Support.
ODS1007E
Negative response from server. The error ID is ... Please contact Support.
ODS1008E
Negative response from server:
ODS1501E
The version of the selected session ... is not com- Please contact Support.
patible with the current program version ... . .
The session cannot be loaded.
ODS1502E
The type of the selected session ... is not com- Please contact Support.
patible with the current product ... The session
cannot be loaded.
ODS1503E
The type of the selected session cannot be deter- Please contact Support.
mined. The session cannot be loaded.
ODS2001E
The password for account ... is invalid.
Please contact Support.
ODS2002E
Password for account ... has expired.
Please contact Support.
ODS2003E
No authentication available.
Please contact Support.
ODS2004E
Account ... is not known.
Please contact Support.
ODS2005E
Authentication is required for access to ....
Please contact Support.
Please contact Support.
337
Error messages
ID
Error displayed
Note
ODS2006E
Hardware with ID ... is marked as blocked. Login was attempted with a diagnostic tester, the
Please contact your support specialist.
hardwareID of which is disabled by the server.
Please contact Support.
ODS2007E
Your flat rate has expired. Please contact your Please acquire a new flat rate if you are an unafsupport specialist.
filiated market participant.
Please contact Support if you are an authorised
dealer.
ODS2008E
The maximum number of concurrent user ses- Please login again at a later time.
sions for your flat rate has been reached. It is not
possible to log in until an existing user session
is available.
ODS2500E
The Group system has indicated a fault: ...
ODS2501F
No MCD system found. Please check the instal- Please contact Support.
lation of the MCD system.
ODS2502E
Data does not exist.
Please contact Support.
Possible causes could be the following:
Missing or faulty vehicle project
The function is not intended for the control unit.
Please contact Support.
ODS2503E
Unable to read/determine VIN.
Check that the vehicle is connected and the ignition is switched on.
ODS2504F
No MCD/DTS system found.
Please contact Support.
ODS2506E
Unable to print correctly.
No access to the printer.
The print job has been cancelled by the user.
Please check the printer settings or contact your
system administrator.
ODS2507E
Unable to create the print layout for the graphic. Please contact Support.
ODS2508F
Important Softing libraries could not be found. Possible causes:
1. MCD server is not installed. Please correct
this by installing the current MCD server.
2. The working directory of the MCD server is
not within the system path.
3. The working directory of the MCD server cannot be accessed.
Please contact Support.
ODS2509F
Important Softing libraries show discrepancies Please correct this by installing the current MCD
between installed and expected versions.
server.
Please contact Support.
ODS2510F
The ECF framework for access to the MCD sys- Please correct this by installing the latest EDF
tem could not be instantiated.
version.
Please contact Support.
338
Error messages
ID
Error displayed
Note
ODS2511F
The MCD system could not be instantiated.
This may be for several reasons.
1. Another application using the MCD server is
active. End these applications and restart the application.
2. Another application using the MCD server
cannot be closed. Restart the computer and try
again.
Please contact Support.
ODS2512F
The system is being shut down now. All pending Please check if Offboard Diagnostic Informaactivities will be cancelled.
tion System Service is working again correctly after the start. If that is not the case, contact
Support.
ODS2513E
The diagnostic interface of the MCD system Check the configuration of your diagnostic hardcould not be configured correctly.
ware in the PDU-Api and adjust it, if necessary.
ODS2514E
Error while accessing the logical link monitor of Please contact Support.
the MCD system.
ODS3001E
File ... could not be found.
Check that the path is correct or contact Support.
ODS3002E
No read permission for account ... for file ....
You do not have the necessary access rights.
Please contact Support.
ODS3003E
No write permission for account ... for file ....
You do not have the necessary access rights.
Please contact Support.
ODS3004E
No space to write file ....
The data carrier is full. Please contact your system administrator or Support.
ODS3005E
File folder ... could not be found.
Check that the path is correct or contact Support.
ODS3006E
Incorrect file format for file .... Format ... was Please contact Support.
expected.
ODS3007E
File ... in file folder ... cannot be processed or Please contact Support.
written.
ODS3008E
File ... in file folder ... cannot be opened or read. Please contact Support.
ODS3009E
File ... cannot be copied to ....
ODS3010E
Filter file for HexService not available or not Please contact Support.
legible.
Please contact Support.
The hex service function cannot be executed.
ODS3011E
An error occurred while displaying the result of Please contact Support.
the build status test.
ODS3012E
An error occurred while generating the html re- Please contact Support.
sult log.
ODS3501E
Connection data to Group systems is incorrect or Please contact Support.
does not exist. Please contact Support.
ODS4001E
The data structure ... could not be created or con- Please contact Support.
verted. Please contact Support.
ODS4002E
The software library ... could not be found.
Please contact Support.
ODS4003E
The software library ... could not be opened.
Please contact Support.
ODS4004E
The parameters received for calling ... are incor- Please contact Support.
rect.
339
Error messages
ID
Error displayed
Note
ODS4005F
Incorrect Java installation.
Please contact Support.
ODS4006E
Module (service) ... is not available.
Please contact Support.
ODS4007E
The service ... could not be configured.
Please contact Support.
ODS4008E
Session with vehicle ... could not be recovered. Please check the connection to the vehicle or
contact Support.
ODS4009E
An internal system error occurred. The system Please restart the system. If this does not rectify
might therefore be instable. Please send feed- the error, please contact Support.
back and contact Support. It is recommended to
shut down and restart the system
ODS4010E
The data structure ... contains errors in content. Please contact Support.
ODS4011E
The code ... is not supported by the system.
Please contact Support.
ODS4012E
There is no session data to be saved.
Please contact Support..
ODS4013E
The session data could not be reconstructed.
Please contact Support.
ODS4014E
The session data could not be saved.
Please contact Support.
ODS4015E
An error occurred while entering a parameter.
Please contact Support.
The entered value cannot be converted to the
type of the parameter.
ODS4016E
An error occurred while entering a parameter.
Please contact Support.
The type of parameter is not supported.
ODS4501E
Test drive mode could not be activated.
Please contact Support.
ODS4502E
The licence file cannot be opened or read. Test Please contact Support.
drive mode is not activated.
ODS4503E
The licence file could not be copied. Test drive Please contact Support.
mode is not activated.
ODS4504E
Test drive mode could not be deactivated.
Please contact Support.
ODS5001E
Test program or step ... could not be loaded.
Please contact Support.
ODS5002E
Connection to test instruments not available.
Please contact Support.
ODS5003E
An internal fatal test program error has occurred. Please contact Support.
This test will be cancelled. Error type: ...
Details: ...
ODS5004E
Internal test program error. A user interaction at- Please perform the test again or contact Support.
tempt was made, which is only permitted within
a test step. This test will be cancelled.
ODS5005E
Document ... could not be loaded.
ODS5006E
Unable to determine the knowledge base for the Please contact Support.
vehicle. Guided fault finding is not possible for
this vehicle. Details: ...
ODS5007E
A version problem in test ... has been detected. Please contact Support.
ODS5008E
Decompression of test program ... failed due to Please contact Support.
a missing or invalid compression. The test program could not be loaded.
ODS5009E
Decoding of test program ... failed due to a miss- Please contact Support.
ing or invalid code. The test program could not
be loaded.
Please contact Support.
340
Error messages
ID
Error displayed
Note
ODS5010E
The signature check of test program ... failed due Please contact Support.
to a missing or manipulated signature. The test
program could not be loaded.
ODS5501E
Control unit ... could not be found.
Please contact Support.
ODS5502E
Connection ... could not be opened.
Please contact Support.
ODS5503E
Connection ... could not be generated.
Please contact Support.
ODS5504E
Unexpected result during control unit communi- Please contact Support.
cation, method ...
ODS5505E
Control unit communication not possible, Please contact Support.
method ...
ODS5506E
Error ... during control unit communication, Please contact Support.
job ..., control unit ... ECF error text: ...
ODS5507F
Communication description file ... could not be Please contact Support.
found.
ODS5508F
Error while reading communication description Please contact Support.
file.
ODS5509F
Contents of communication description file in- Please contact Support.
valid.
ODS5510E
Communication job ... for control unit ... could Please contact Support.
not be found in description file.
ODS5511E
Method ... described incorrectly ... in description Please contact Support.
file.
ODS5512E
Error while converting parameters for class ...
ODS5513E
Communication job ... for connection ... could Please contact Support.
not be generated.
ODS5514E
Incorrect job description for ... in description Please contact Support.
file.
ODS5515E
Error while acquiring results of control unit Please contact Support.
communication.
ODS5519E
Internal error in test program: method ... for Please contact Support.
job ... not found.
ODS5551E
Connection name for control unit ... could not be Please contact Support.
found.
ODS5552E
Communication job ... could not be created.
ODS5553E
Requirement parameters for communication Please contact Support.
job ... could not be determined.
ODS5554E
Unable to determine a valid value for require- Please contact Support.
ment parameter ... of communication job ... .
ODS5555E
Unknown requirement parameter ... for commu- Please contact Support.
nication job ... . .
ODS5556E
The value ... for requirement parameter ... could Please contact Support.
not be converted into type ... .
ODS5557E
The value ... for requirement parameter ... cannot Please contact Support.
be converted into type ... .
ODS5558E
The value ... for requirement parameter ... could Please contact Support.
not be entered.
341
Please contact Support.
Please contact Support.
Error messages
ID
Error displayed
Note
ODS5559E
Control unit communication not possible, com- Please contact Support.
munication job ... .
ODS5560E
Error ... during control unit communication, Please contact Support.
job ..., control unit connection ... .
ODS5570E
Measured value table ... could not be found.
Please contact Support.
ODS5571E
Entry ... in measured value table ... not found.
Please contact Support.
ODS5572E
Control unit ... from measured value table ... not Please contact Support.
found.
ODS5573E
No valid entries found in measured value ta- Please contact Support.
ble ... .
ODS6003F
The brand ... of the installed diagnostic data dif- Please contact Support.
fers from the brands in the certificate: ...
ODS6004F
The software version installed ... differs from the Please contact Support.
version in the certificate: ...
ODS6005F
The hardware key in certificate ... does not cor- Please contact Support.
respond to the hardware key of hardware ....
ODS6007F
Certificate expired on ....
Please contact Support.
ODS6008F
Certificate is not valid until ....
Please contact Support.
ODS6009F
No valid contractual status could be determined. An error occurred while determining the dealer's
Cancelling diagnostic session.
contract status.
Please contact Support.
ODS6010E
You are not authorised for the selected brand. An attempt is being made to load a diagnostic
Loading the diagnostic session will be cancelled. session with a non-licensed brand.
Please contact Support.
ODS6011E
The contractual status of the diagnostic session An attempt is being made to load a diagnostic
does not correspond to your contractual status. session, of which the saved contract status does
Loading the diagnostic session will be cancelled. not correspond to the current contract status of
the brand used.
Please contact Support.
ODS6012F
No brand-related information could be deter- Please contact Support.
mined because no current brand is available.
ODS6013F
There is no information in the licence for the ... Please contact Support.
brand.
ODS6101E
Creation of or access to the certificate memory Please contact Support.
failed.
ODS6102E
Importing the certificate file failed.
Please contact Support.
The file format is not supported.
ODS6103E
Importing the certificate file failed.
Please contact Support.
The certificate file does not only contain X.509
certificates.
ODS6104E
Importing the certificate file failed.
Please contact Support.
The private key could not be determined. Please
check the password.
342
Error messages
ID
Error displayed
Note
ODS6105E
Importing the certificate file failed.
Please contact Support.
The validity period of a certificate does not include the current date.
ODS6106E
Importing the certificate file failed.
Please contact Support.
The certificate chain to be imported is not valid.
ODS6107E
Importing the certificate file failed.
Please contact Support.
The certificate's hardware ID does not match the
hardware ID of the current ODIS licence.
ODS6108E
Importing the certificate file failed.
Please contact Support.
The certificate could not be inserted in the certificate memory.
ODS6109E
Deleting the certificate failed.
Please contact Support.
The certificate could not be deleted from the certificate memory.
ODS6110E
Access to the certificate memory for client cer- Please contact Support.
tificates failed due to a changed hardware ID.
The certificate memory will now be re-created.
ODS6501E
The database ... required for the application was Please exit the application and check the instalnot found.
lation.
Please contact Support.
ODS6502E
Error while determining the metadata for the da- Please contact Support.
ta adapter ...
ODS6503E
Database ... could not be opened. Please close If that does not fix the error, please contact Supthe application and restart it.
port.
ODS6504E
A data adapter was not found; therefore, there Correct or update the installation.
is no database available. Diagnosis will not be
Please contact Support.
possible.
ODS7001E
Database ... cannot be opened.
Please contact Support.
ODS7002E
Database ... cannot be closed.
Please contact Support.
ODS7003E
Database ... cannot be read.
Please contact Support.
ODS7004E
Entries in database ... not possible.
Please contact Support.
ODS7005E
The database structure is faulty.
Please contact Support.
ODS7006E
Internal DB access error - no primary key de- Please contact Support.
fined for table ... .
ODS7501F
The Diagnostic Information Database (DIDB) is Please contact Support.
not available.
ODS7502E
Query to Diagnostic Information Database Please contact Support.
(DIDB) failed.
ODS7503E
Update of the diagnostic database failed. Diag- Please contact Support.
nosis will be performed using the old diagnostic
data. Please contact Support.
ODS8001E
Communication with vehicle interrupted.
ODS8002E
Error during communication with the control Please contact Support.
unit with control address ....
343
Please check the connection to the vehicle or
contact Support.
Error messages
ID
Error displayed
Note
ODS8003E
Operation on the control unit with the control ad- Please contact Support.
dress ... was faulty.
Error message: ...
ODS8004E
Unable to establish communication with the ve- Please check the connection to the vehicle or
hicle.
contact Support.
ODS8005E
The following error occurred during communi- Please contact Support.
cation with the MCD system: ...
ODS8006F
Diagnostic hardware could not be found. Please Please check the connection to the vehicle and
check whether the corresponding hardware is the diagnostic hardware or contact Support.
connected correctly.
ODS8007E
The following error occurred during communi- Please contact Support.
cation with the MCD system:
Error code: ...
Error code description: ...
ODS8008E
The following error occurred during communi- Please contact Support.
cation with the vehicle:
Error code: ...
Error code description: ...
ODS8009E
No event memories could be read while commu- Please contact Support.
nicating with the control unit: ...
Error description: ...
ODS8010E
The operation was cancelled by the control unit. Please contact Support.
Possible causes:
Login incorrect or missing
Others
ODS8011E
Control unit with control address ... is not in- Please contact Support.
stalled or does not respond.
ODS8012E
An error occurred during communication with Please contact Support.
the vehicle:
The control unit's response contains implausible
data.
ODS8013E
An error occurred while filtering/checking the Please contact Support.
flash sessions. A possible cause could be incompatibility between ODX data input and flash data.
ODS8014E
Diagnostic project ... is not available. Please Please contact Support.
check the installation of your software.
ODS8015E
Communication with the vehicle could not be re- Please contact Support.
set.
Possible cause: there are still active diagnostic
jobs.
344
Error messages
ID
Error displayed
Note
ODS8016E
An error occurred during communication with Please contact Support.
the vehicle:
Check if the ignition is switched on.
ODS8017F
An error occurred during hardware initialisa- Please contact Support.
tion/deinitialisation of:
with the following manufacturer error description: ...
ODS8018E
An error occurred during communication with Please contact Support.
the vehicle:
The control unit's response contains implausible
data.
ODS8019E
An error occurred during communication with Please contact Support.
the vehicle:
The code has not been applied by the control
unit.
ODS8020E
An error occurred during communication with Please contact Support.
the vehicle:
The operation on the control unit was faulty.
ODS8021E
An error occurred during communication with Please contact Support.
the vehicle:
The operation was stopped by the control unit.
ODS8022E
An error occurred during communication with Please contact Support.
the vehicle:
The entered value is outside the valid value
range.
ODS8023E
An error occurred during data input or interpre- Please contact Support.
tation of data. Possible causes:
One of the entered values is outside the valid value range.
The control unit returns implausible data.
The MCD system reports the following error:
Error code: ...
Error code description: ...
ODS8024E
An error occurred during communication with Please contact Support.
the MCD system:
The MCD job ... did not return any results after
its execution.
ODS8025E
It is not possible to access communication pa- Please contact Support.
rameters of the control unit ... before connecting.
345
Error messages
ID
Error displayed
Note
ODS8026E
Communication with the vehicle has been inter- Please contact Support.
rupted.
Possible causes: Vehicle or battery not connected.
Error code: ...
Error code description: ...
Note: ...
ODS8027E
For control unit ... - ... the connection cannot be Please contact Support.
terminated due to existing communication jobs.
When communication with this control unit is
finished you can try again to disconnect.
ODS8028E
Communication protocol ... is not supported.
Please contact Support.
ODS8029E
No gateway available.
Please contact Support.
ODS8030E
No bus master available.
Please contact Support.
ODS8031E
There is an error in the existing diagnostic data. Please contact Support.
Diagnostic start-up cannot be performed.
ODS8032E
Work is not possible with the selected method. Please contact Support.
No other methods are available to continue diagnostic start-up.
ODS8033E
Work is not possible with the selected method. Please contact Support.
Diagnostic start-up must be continued with a different method.
ODS8034E
There is no information available for internally Please contact Support.
marked vehicles.
Diagnostic start-up will be cancelled.
ODS9001E
Contents of software pool and data pool are Please contact Support.
faulty.
ODS9002E
An error occurred during download from soft- Please contact Support.
ware pool and data pool.
ODS9003E
An error occurred during upload to software Please contact Support.
pool and data pool.
ODS9004E
Cannot connect to MirrorServer2.
ODS9005E
There is not enough free memory for the up- Please contact Support.
date. ... kB required, but only ... kB available.
ODS9006E
Administration rights are required for the up- Please contact Support.
date. Please log in as an administrator and then
perform the update.
ODS9007E
The update failed or was cancelled.
ODS9101E
Local computer name could not be determined. Please contact Support.
ODS9102E
The configured mail server ... is not known.
Please contact the mail server administrator or
your provider.
ODS9103E
No information configured for mail server.
Please check the information or contact Support.
Please contact Support.
Please contact Support.
346
Error messages
ID
Error displayed
Note
ODS9104E
Transmission of the existing e-mail(s) failed.
Check that there is a network connection or contact Support.
The original text of the error message is: ...
ODS9105E
Error while creating e-mail.
Please contact the mail server administrator or
your provider.
Invalid sender e-mail address ... identified.
ODS9106E
Login to mail server ... failed.
Please correct your login name or password or
contact the mail server administrator or your
Please check the login name and/or the pass- provider.
word.
ODS9201E
Dealer portal not available.
Please try again later or contact Support.
ODS9202E
Transactions cannot be loaded.
Please try again later or contact Support.
ODS9203E
Test plan will be created without customer code. Please try again later or contact Support.
ODS9204E
DISS codes cannot be loaded.
Please try again later or contact Support.
ODS9205E
List of circuit diagrams cannot be displayed.
Please try again later or contact Support.
ODS9206E
Circuit diagram cannot be loaded.
Please try again later or contact Support.
ODS9207E
Vehicle data cannot be loaded.
Please try again later or contact Support.
ODS9208E
System for immobiliser adaptation (FAZIT) not Please try again later or contact Support.
available.
ODS9209E
Fault candidates cannot be loaded.
Please try again later or contact Support.
ODS9210E
System for coding (System42) not available.
Please try again later or contact Support.
ODS9211E
System for flashing (System42) not available.
Please try again later or contact Support.
ODS9212E
Login not possible. No access to the dealer por- Please try again later or contact Support.
tal.
ODS9213E
The transaction cannot be completed. The Group Please try again later or contact Support.
system is not available.
The data will be stored temporarily and sent automatically when the Group system is available
again and Offboard Diagnostic Information System Service has been started on this computer.
ODS9214E
Receiving system for key transponder not avail- Please try again later or contact Support.
able.
The data will be stored temporarily and sent automatically when the Group system is available
again and Offboard Diagnostic Information System Service has been started on this computer.
ODS9215E
Receiving system for diagnostic protocol not Please try again later or contact Support.
available.
The data will be stored temporarily and sent automatically when the Group system is available
again and Offboard Diagnostic Information System Service has been started on this computer.
347
Error messages
ID
Error displayed
Note
ODS9216E
The diagnostic protocol cannot be saved. The Please try again later or contact Support.
storage location is not available.
The protocol will be stored temporarily in encrypted form and saved automatically when the
storage location is available again and Offboard
Diagnostic Information System Service has been
started on this computer.
ODS9217E
Receiving system for the current build status not Please try again later or contact Support.
available.
The data will be stored temporarily and sent automatically when the Group system is available
again and Offboard Diagnostic Information System Service has been started on this computer.
ODS9218E
Template ... is missing in the GFF data. The test Please contact Support.
will be cancelled.
ODS9219E
No URL found in the configuration data for the Please contact Support.
alias ... .
The test will be cancelled.
Table 14.1. Table of error IDs
14.2. Other error messages
14.2.1. Firewall messages
When carrying out updates for Offboard Diagnostic Information System Service, a firewall message may be
displayed.
Figure 14.2. Windows firewall message
To confirm this message, click on the Unblock button.
348
Error messages
Note:
If you click on the Keep Blocking button, the firewall blocks the execution of the update and the program cancels
the attempt.
14.2.2. Browser messages
In some cases browser security warnings may be displayed. These messages come after starting Offboard Diagnostic Information System Service and after selecting certain tabs that access a web Group interface for the
first time.
Figure 14.3. Browser security message
Confirm this message by clicking on Yes for the page to be displayed correctly.
If you clicked on No here, restart Offboard Diagnostic Information System Service and click on Yes to correctly
display the page.
349
Chapter 15. Index
Index
A
Access authorisation, 159
Actions tab, 190
Actual installation, 68
Actual no., 73, 82
Actuator code, 150
Actuator diagnosis, 150
Adaptation, 121
Admin, 42
Administration, 266
Anti-virus protection, 291
B
Basic characteristics, flashing, 171
Basic vehicle characteristics, 56
Binary code, 129
Block diagram, 73
Bluetooth interface, 22
Brand design, 269
Brand, licensed, 278
Browser error message, 349
C
Cancel diagnosis, 52
Certificate, 23
Change diagnostic hardware, 51
Change display format, 73
Change sort preference, 72
Change system language, 270
Circuit diagrams, 193
Client area, 41, 41
Code, 41
Coded, 69
Coding, 126
Coding status, 69
Coding wizard, 88
Complaints, 86
Component selection, 108
Conduction of overall tests, 96
Control unit, correctly installed, 70
Control unit-specific functions, 121
Control units, 71, 79, 117
Control units list, 71
Copy, diagnostic protocol, 304
Creating a test plan, 86
Current measurement
Clamp-on ammeter, 209
URDI measuring lead, 204
Customer code, 86
350
Index
Cycle, update, 33
D
Data menu, 43
Database storage location, 282
Dealer, 41
Dealer number, 41
Dealer type, 278
Default setting, 138
Deleting event memory entries, 136, 163
Design, 269
Diagnosis, 42
Diagnostic connection, legal, 168
Diagnostic interface, 21
Diagnostic object, 92
Diagnostic protocol, 286
Diagnostic protocol, send external, 304
Diagnostic session storage location, 283
Display format, 82
DISS complaints, 86
Documents, 181, 188
DVD, 16
E
E-mail size restriction, 291
End diagnosis, 52
End modules, 111
Engine code, 193
Error classification, 326
Error messages, 335
Event code, 135
Event memories for overall system, 161
Event memory, 79, 134
Event memory entry, 79
Event text, 135
Executing the test program, 98
External verification, 301, 334
Extras menu, 44
F
Feedback, 288, 325
Filter setting, 218
Firewall, 31, 291, 348
Flash start-up, 168
Flashing, 167
Frequency counter, 82
Full screen, 46
Function description, 104
G
Gateway, 68
Gateway installation list, 68
Gearbox code, 193
GFF, 83
GFF sequence, 280
Global configuration, 278
Guided fault finding, 83,
351
Index
Guided function, 78
H
Hardware part number, 81
Hardware version number, 81
Help menu, 45
Hotfix, 310
I
Identification, 146
Identify control units, 76
Ignition, 41
Importer, 41
Importer number, 41
Info, 42
Info menu, 45
Information area, 40
Installation, 16
Installation list, 68, 165
Installation status, 68
Interface, 40
K
KWP, 122, 127, 138, 147, 150, 150
KWP 1281, 159
KWP 2000, 159
L
Language, 270
Licence, 278
Limit values, 219
Load, session, 306
M
Mail server, 291
Manufacturer, 59
Maximum no., 73, 82
Measured value block, 147
Measured values, 147
Mileage, 82
Mirror server, 300
Model, 59
Model year, 59
Modes, 42
Modes menu, 42
Mouse, 47
Multimeter client area
AC coupling, 202
Calibration , 199
Clamp-on ammeter, 209
DC coupling, 202
Diagnostic measured values, 199
DSO measuring lead, 209
Freeze frame, 198
Function blocks, 200
Measuring range, 202
Minimum / maximum, 199
352
Index
Pressure measurement, 211
Single and parallel measurements, 203
Temperature measurement, 212
Test parameters , 201
URDI measuring lead, 203
N
Network, 41
Notes, 333
O
Online help, 321
Operation, 47
Order, 41
Order number, 41
Oscilloscope client area
Bandwidth limit, 230
Channel parametrisation, 216
Freeze frame, 234
Long-term measurement in draw mode, 222
Measuring mode, 219
Target curves, 230
Time base and image position, 215
Trigger parametrisation, 226
Oscilloscope coupling, 218
Oscilloscope measuring range, 218
Outgoing mail server, 290
Outgoing mail server mail setting, 290
Overall test, 96
P
Part number, 146
PassThru, 22, 314
Performing the test, 98
Platform, 19
PostSetup, 27
PR number, 195
Print, 304
Print, diagnostic protocol, 304
Priority, 327
Product variant, 278
Production date, 193
Program update, 34
Provider, 291
Proxy server, 291
R
Radio head, 23
Radio head documentation, 22
Re-read event memory, 77
Read/enter VIN, 57
Readiness code, 112
Reading plan, 69
Repair history, 191
S
SAE code, 135
353
Index
Save, diagnostic protocol, 304
Save, session, 306
Search, 311
Select certificate, 23
Select diagnostic interface, 21
Select engine, 59
Select platform, 19
Select variant, 77
Selective actuator diagnosis, 150
Self-diagnosis, 117
Self-diagnosis, context menu button, 75
Send, diagnostic protocol, 304
Sequential actuator diagnosis, 150
Session, 283
setup.exe, 16
SMTP (Simple Mail Transfer Protocol), 291
Software part number, 81
Software version, 146
Software version number, 81
Sort preference, 82
Special functions, 95
sporadic / static, 82
Standard functions, 43
Standard order, 65
Start diagnosis, 52
Status, 82
Status line, 45
Support contact data, 288
Support request, 325
System designation, 81
System environment, 276
System identification, 146
System name, 81
System requirements, 15
T
Tab bar, 41
Table of contents, 13
Target directory for the diagnostic components, 18
Target installation, 68
Test abortion, 99
Test instruments,
Administration, 237
Diagnostic measured values, 235
General, 196
Multimeter client area, 197
Oscilloscope client area, 212
Test plan, 96, 98
Test program, 98
Touchscreen, 47
Transport mode, 163
Trigger amplitude, 229
Trigger channel, 228
Trigger coupling, 228
Trigger edge, 229
Trigger threshold, 227
354
Index
U
UDS, 124, 129, 140, 152, 159
Unaffiliated market participants, 53, 173
Update, 33, 273, 273
URDI measuring lead
Continuity test, 208
Current measurement, 204
Diode test, 206
Resistance measurement, 205
Voltage measurement, 203
User interface, 40
V
Variant, 59, 81
VAS5054, 22
Vehicle engine, 59
Vehicle ID, 41
Vehicle status, 53
Vehicle-specific functions, 161
Virtual keyboard, 281
Voltage measurement
DSO measuring lead, 209
URDI measuring lead, 203
W
Warnings, 333
Windows security alert, 348
Workshop code, 146
Workshop manuals, 192
355
Glossary
Amplitude
The maximum value that the deflection of an oscillation of an alternating current, e.g. an AC voltage, may have.
Adaptation
This service permits the interactive modification of parameters of the addressed control system. The modified values (e.g. correction values for noload speed) can also be saved permanently to the control units. The user is
given the option of changing the value and transferring it to the non-volatile
memory (RAM) for checking. The control unit creates the new values at its
outputs and the user is able to check the system's reaction. If the correct correction value is found, the tester arranges for the control unit to transfer the
value and the workshop code to the programmable read-only memory (EEPROM).
As opposed to the default setting, the respective control circuit is in closed
state. The adaptation is used to determine system-specific parameters and save
them to the vehicle system.
ASAM ODX
Association for Standardization of Automation and Measuring Systems
(http://www.asam.net)
Open Diagnostic Data Exchange
Mode
Each of the basic functions of the tester that can be accessed via the start
screen: "Flash", "Diagnosis", "Info" and "Admin". Each mode consists of a
number of individual functions.
Bluetooth
An industrial standard for radio transmission between devices over a short
distance.
Client
A program on the PC for connecting to a server. For example, a network client
is a program that connects to a server in the network so that the PC can be
operated as a workstation in the network.
Diagnosis
Diagnostic connection
Connector socket for the diagnostic cable on the tester or on the vehicle.
Diagnostic object
Collective term for diagnostic functions, assemblies or components modelled
in the diagnostic object tree. Not to be confused with diagnostic bus object
(def.: operating manual DES-VW A11.0). An object (function, component or
component group) to which the diagnostic function is applied.
Diagnostic objects should be named according to the master list. Even if currently not relevant, this needs to be done in the future for the circuit diagrams
on the tester to be requested according to the terminology from Elsa in the
master list.
Diagnostic protocol
The diagnostic protocol includes a list of control units with the corresponding
event memory entries, DISS codes and manually created text.
DIDB
Direct current measurement
(inline current measurement)
Current measurement during which the tester is integrated directly in the circuit like an ammeter. The opposite: inductive current measurement via clampon ammeter clamped on to the cable.
DISS
The DISS system (Direct Information System Service) is used to record vehicle complaints and to support the service core process.
356
Glossary
- Recording of complaints
- Reporting of existing complaints
DTC
Diagnostic Trouble Code. An event memory entry consisting of fault location,
fault types and possibly ambient conditions.
DTS (Softing)
Diagnostic Tool Set - software for creating diagnostic applications.
ECU
Electronic Control Unit
Self-diagnosis
Vehicle systems are capable of self-diagnosis. That means: they have methods
for constantly checking their own functions, as well as sensors and actuators
connected. A fault normally results in the entry of a fault code in the event
memory of the vehicle system. The tester has knowledge of all faults in its
knowledge base, so that after reading out the event memory it can assign the
fault code to a fault type and location and thus derive a test proposal.
Own test plan
Diagnostic strategy, with which the user selects possibly faulty functions or
components himself. If errors in vehicle systems are also detected during the
diagnostic session or if a complaint message was entered, a distinction is always made in the test plan between system test plan and own test plan.
End module
An end module may consist of one or more function tests that are started automatically after exiting guided fault finding. End modules are e.g. for feedback to the vehicle manufacturer.
Event code
Event location
Event memory
Rules based on experience
Logical link between perceived symptoms and/or symptoms from the event
memory model. A rule based on experience may be weighted according to its
reliability and assigned to one or more diagnostic objects.
eShop
eShop is the system for ordering and licensing software and diagnostic data
within Volkswagen's Offboard Diagnostic Information System.
Vehicle identification
Vehicle identification is performed by determining the basic vehicle characteristics (type, model year, variant, engine code) that can also be identified
automatically or semi-automatically at an existing gateway. This data is used
to create a list of control units and equipment possibly installed and check
their installation during the vehicle system test.
Feedback
Error classification
Flash data
Flash data refers to program components that can be loaded for a vehicle system.
Flash memory
Read-only memory, the data of which is retained even without power supply.
Unlike permanently programmed memory modules, a flash memory can be
updated by a corresponding update process (via flash CD).
Function
Function test
357
Glossary
Gateway installation list
A gateway control unit has information on the vehicle systems installed in the
vehicle. It monitors the vehicle systems and keeps a status list. By querying the
gateway installation list, e.g. whether the event memory of a vehicle system is
set, it is possible to query whether it is registered (coded) or whether communication is possible. The installation list is evaluated in the context of vehicle
identification and improves the performance of the identification process.
Guided fault finding
With guided fault finding, the diagnostic procedure is integrated in an optimised process consisting of vehicle identification, vehicle system test, test
plan and function tests.
Guided functions
Execution of a vehicle-specific function outside GFF, e.g. determining a measured value.
Default setting
The default setting is used to adapt control units to the peripheral devices.
Basic characteristics
A vehicle is identified via the basic characteristics: type, model year, variant
and engine code. Its equipment, however, is determined during the vehicle
system test.
Hardware key, hardwareID
Hardware features coded as strings. The hardwareID is part of the device-specific licence.
Hotfix
IP address
Abbreviation for "Internet Protocol Address". Every computer connected to a
computer network (TCP/IP) has a unique IP address. It consists of four groups
of numbers separated by dots (e.g. 194.0.0.135). IP addresses can be assigned
automatically by DHCP servers.
Actual no.
Calibration
Precise adjustment of a test instrument (e.g.: clamp-on ammeter) according to
specifications and correction of a measuring deviation by the compensation
of systematic errors.
Maximum no.
Test instruments
You can use the test instruments for independent measurements, the results
of which are displayed numerically or graphically on the tester. A multimeter
and an oscilloscope (DSO) are available.
Measured value block
A defined group of measured values read out of a vehicle system.
Mirror server
A software package installed e.g. locally on the dealer server and that provides data there, such as the update programs for VAS 505x. The dealer server
is connected to the headquarters and receives the latest updates from there.
Within the workshop, every tester connected to the LAN collects the latest
programs automatically when switched on, or explicitly when the "Network
update" function is executed in the administration area.
Offline
There is no active connection to a communication network.
Online
Active connection to a communication network, such as the workshop network, Volkswagen's partner network or the Internet. See also Online connection.
Online protocol
A protocol that is sent to a vehicle manufacturer via online connection.
Online connection
External connection, e.g. to the Internet or the Volkswagen server.
358
Glossary
Oscilloscope
Measuring and display device for electrical signals that displays the progression of the signal strength in time (e.g. oscillations).
D-PDU-API
D-PDU API is a standardised software interface for connecting diagnostic
interfaces to the diagnostic software.
Platform
Protocols KW1281, KW2000,
KW6000, UDS
The keyword protocols define the exact procedure for data exchange between control unit and tester. Older control units communicate according to
KW1281. Newer control units work according to KW2000 or KW6000 (CAN
diagnosis), ASAM control units according to UDS. During vehicle self-diagnosis, prior to the selection of the diagnostic functions for a control unit, the
tester automatically determines its keyword protocol version.
Provider
A service provider offering communication services, such as telephone, mobile communications or Internet.
Proxy server
A proxy server is equivalent to a switching centre between clients and another
network. It accepts requests from a client and forwards its data (possibly in
modified or anonymous form) to the original destination (in the other network,
e.g. Internet). Proxy servers are able to temporarily store the data locally that
is transferred, for further access (caching).
Test plan
Weighted sequence of test programs proposed to the service technician by the
processing system for vehicle repairs.
Test step
A complete unit of a function test.
Readiness code
8-digit binary code that indicates whether all diagnostic operations relevant
for exhaust gas and safety were dealt with by the engine management system.
Release notes
Version notes enclosed with a software version. New or modified functions
compared to previous versions are described in these version notes.
Screenshot
Copy of the current screen content into an image file.
Sensor
Device that records measured values.
Server
In computer technology, server refers to a central network computer. It provides the clients with the corresponding services or data.
Reliably installed (control unit)
Target installation
Start module
A start module may consist of one or more function tests that are started automatically after the vehicle system test. They are e.g. for checking whether
new flash data is available for a vehicle system.
Control unit
Electronic device for controlling and monitoring vehicle functions, e.g. engine
control unit. See ECU, vehicle system.
Touchscreen
A screen that is also used as an input device. The device, e.g. a computer or
mobile telephone, can be controlled by touching screen contents.
TPL
Traversion test
This type of test is used to identify control units and derive information from
them that enables automatic vehicle identification. For this, the structures of
the equipment network are gone through automatically.
359
Glossary
UDS
Unified Diagnostic Services; as per ISO 14229, standardised protocol for control unit communication, based on KW2000 for ASAM-ODX control units.
Update
Software modification package for updating an existing software product to
a higher version status.
1. New version of the processing system imported from CD-ROM.
2. New program version of a vehicle system imported from the tester.
URL
Abbreviation for "Uniform Resource Locator". A URL corresponds to
the address of an Internet resource (website, file, ...). Example: http://
www.volkswagen.de
Variant, variant rule
The term is used in the context of the equipment of vehicle systems. Some
equipment, e.g. an airbag, may be available in different variants for an identified vehicle. The main purpose of the vehicle system test is to find out which
variant is actually installed. If the variant cannot be determined automatically,
Yes/No questions relating to the equipment will follow, e.g. "Automatic gearbox?" The mechanisms for determining the variants are referred to as variant
rules. Their results determine which diagnostic data is provided.
Installation list
List of the control units installed in a vehicle.
Installation status
Verification
Workshop code
Certificate
Licence document in which all authorisations, scopes and properties of the
software and diagnostic data are stored. The certificate is the prerequisite for
the operation of the test software, which is checked every time the application
is started.
360