Download Hydro-View User Guide
Transcript
Hydro-View User Guide Refer to Page 13 for Calibration Procedure when used in Batch Weigher system Applications Hydronix part number: D0022 Revision: 1.06 Revision date: 12 June 2007 COPYRIGHT Neither the whole or any part of the information contained in nor the product described in this documentation may be adapted or reproduced in any material form except with the prior written approval of Hydronix Limited hereinafter referred to as Hydronix. © 1996 Hydronix Limited 7 Riverside Business Centre Walnut Tree Close Guildford Surrey GU1 4UG United Kingdom All rights reserved CUSTOMER RESPONSIBILITY The customer in applying the product described in this documentation accepts that the product is a programmable electronic system which is inherently complex and which may not be completely free of errors. In doing so the customer therefore undertakes responsibility to ensure that the product is properly installed commissioned operated and maintained by competent and suitably trained persons and in accordance with any instructions or safety precautions made available or good engineering practice and to thoroughly verify the use of the product in the particular application. ERRORS IN DOCUMENTATION The product described in this documentation is subject to continuous development and improvement. All information of a technical nature and particulars of the product and its use including the information and particulars contained in this documentation are given by Hydronix in good faith. Hydronix welcomes comments and suggestions relating to the product and this documentation. This documentation is intended only to assist the reader in the use of the product and therefore Hydronix shall not be liable for any loss or damage howsoever arising from the use of information or particulars in or any error in or omission from this documentation. AKNOWLEDGEMENTS Hydronix, Hydro-Probe, Hydro-Skid, Hydro-Mix, Hydro-View and Hydro-Control are Registered Trade Marks of Hydronix Limited. Author: R.E.B. Holland B.Eng. C.Eng. MIEE Table of contents Table of contents................................................................................................................................................ 3 Introduction ......................................................................................................................................................... 9 System overview................................................................................................................................9 Scope of this document .....................................................................................................................9 Organisation of this document ...........................................................................................................9 Applications of Hydro-View with Hydronix moisture sensors ..........................................................10 A batch weighing system ...........................................................................................................11 Batch weighing calibration procedure ............................................................................................................. 13 Calibration........................................................................................................................................14 Dry Bucket method ..........................................................................................................................15 Method .......................................................................................................................................15 A batch mixing system ..................................................................................................................................... 17 A continuous process.................................................................................................................19 Hydro-View quick start ..................................................................................................................................... 21 Hydro-View front panel ....................................................................................................................21 Display contrast adjustment.......................................................................................................21 Keypad .......................................................................................................................................21 Soft key legends.........................................................................................................................22 Moisture display page......................................................................................................................22 Max / Min % display ...................................................................................................................23 Help facility.......................................................................................................................................24 Hydro-View main menu ...................................................................................................................24 Trend display page ..........................................................................................................................25 Changing operating values ..............................................................................................................27 Adjusting set-points .........................................................................................................................28 Material in use..................................................................................................................................29 Advanced user options and configuration....................................................................................................... 31 Sensor calibration ............................................................................................................................31 Sensor set-up menu ........................................................................................................................32 HYDRO-VIEW USER GUIDE D0022 REV 1.06 3 Output set-up menu ........................................................................................................................ 33 Sensor diagnostic display ............................................................................................................... 34 Audible Alarm.................................................................................................................................. 34 Material mode ................................................................................................................................. 34 RS232 usage .................................................................................................................................. 35 RS485 usage .................................................................................................................................. 35 Data log rate.................................................................................................................................... 35 Station number................................................................................................................................ 35 Number of slaves ............................................................................................................................ 35 Communications diagnostic page ................................................................................................... 36 Input 1 / Input 2 use ........................................................................................................................ 36 Language selection ......................................................................................................................... 37 Factory default settings ................................................................................................................... 37 Sensor set-up ............................................................................................................................ 38 Output set-up............................................................................................................................. 38 Sensor calibration...................................................................................................................... 38 Set-point set-up ......................................................................................................................... 38 Other parameters ...................................................................................................................... 39 Suggested working values .............................................................................................................. 40 Sensor set-up ............................................................................................................................ 40 Output set-up............................................................................................................................. 40 Sensor calibration...................................................................................................................... 40 Set-point set-up ......................................................................................................................... 41 Other parameters ...................................................................................................................... 41 Calibration and sampling techniques .............................................................................................................. 43 Recommendations for best performance........................................................................................ 43 Equipment required......................................................................................................................... 44 Taking the samples ......................................................................................................................... 44 Batch mixer system sampling method ...................................................................................... 44 4 HYDRO-VIEW USER GUIDE D0022 REV 1.06 TABLE OF CONTENTS Continuous system sampling method........................................................................................45 Drying the samples ..........................................................................................................................45 Recommendations for best performance...................................................................................45 Calculating the moisture percentage ...............................................................................................45 Entering results into the Hydro-View ...............................................................................................46 What happens with your results ......................................................................................................46 Grouping channels ........................................................................................................................................... 49 Group moisture variables.................................................................................................................49 Group moisture display....................................................................................................................49 Effect of communications errors on grouped systems ....................................................................50 Example - a twin bin grouped system using RS232........................................................................51 Example - a four bin grouped system using RS485 ........................................................................52 Installation......................................................................................................................................................... 55 Power supply connections ...............................................................................................................55 Adjusting the Hydro-View mains operating voltage ...................................................................56 Field connections .............................................................................................................................56 Sensor Connections – Hydro-Probe II.............................................................................................57 Installation guidelines.................................................................................................................57 Connecting the Hydro-Probe II to the Hydro-View ....................................................................57 Sensor Connections – Hydro-Probe I..............................................................................................58 Analogue output connections.....................................................................................................59 Digital input connections ............................................................................................................60 Relay output connections...........................................................................................................61 Material selection using Digital I/O ............................................................................................61 Protection from lightning strikes.......................................................................................................63 Troubleshooting ...............................................................................................................................64 Factory test display ....................................................................................................................64 Installation problems ..................................................................................................................65 Sensor installation faults..................................................................................................................66 Sensor characteristics................................................................................................................67 HYDRO-VIEW USER GUIDE D0022 REV 1.06 5 Using Hydro-View serial ports ......................................................................................................................... 71 RS232 serial port ............................................................................................................................ 71 RS485 serial port ............................................................................................................................ 72 Installation of RS485 module .................................................................................................... 72 RS485 connections ................................................................................................................... 72 RS485 termination..................................................................................................................... 72 Data log mode................................................................................................................................. 73 Batch print mode ............................................................................................................................. 74 ASCII Hex mode ............................................................................................................................. 75 Scope ........................................................................................................................................ 75 Physical connection................................................................................................................... 75 Line signalling information......................................................................................................... 75 Basic frame format .................................................................................................................... 75 Frame types .............................................................................................................................. 76 Request frame types (‘command set’) ...................................................................................... 77 Timing constraints ..................................................................................................................... 78 ASCII Hex protocol examples ................................................................................................... 78 Appendix........................................................................................................................................................... 79 Access codes .................................................................................................................................. 79 Electromagnetic Compatibility Directive - 89/336/EEC................................................................... 79 Index ................................................................................................................................................................. 81 6 HYDRO-VIEW USER GUIDE D0022 REV 1.06 TABLE OF CONTENTS • • • • • • • • • • • • • • • • • • • • • • • • • • • • • • • • • List of figures Figure 1 - Batch weighing example.................................................................................................11 Figure 2 - Batch mixing system.......................................................................................................17 Figure 3 - Continuous mixing process ............................................................................................19 Figure 4 - Hydro-View front panel ...................................................................................................21 Figure 5 - Moisture display..............................................................................................................22 Figure 6 - Help facility .....................................................................................................................24 Figure 7 - Main menu ......................................................................................................................24 Figure 8 - Trend display ..................................................................................................................26 Figure 9 - Selecting parameters......................................................................................................27 Figure 10 - Changing a value..........................................................................................................27 Figure 11 - Changing options..........................................................................................................28 Figure 12 - Sensor diagnostic display.............................................................................................34 Figure 13 - Communications diagnostic .........................................................................................36 Figure 14 - Sensor calibration line ..................................................................................................47 Figure 15 - Group moisture display.................................................................................................50 Figure 16 - Twin bin grouped system..............................................................................................51 Figure 17 - Four bin grouped system..............................................................................................53 Figure 18 - Panel mounting the Hydro-View...................................................................................55 Figure 19 - Hydro-View mains transformer.....................................................................................56 Figure 20: Connecting the Hydro-View to a Hydro-Probe II ...........................................................57 Figure 21 - Sensor extension cable connections............................................................................58 Figure 22 - Hydro-View rear panel..................................................................................................58 Figure 23 - Hydro-View main circuit board .....................................................................................59 Figure 24 - Analogue output wiring .................................................................................................60 Figure 25 - Digital inputs .................................................................................................................60 Figure 26 - Internal/external excitation............................................................................................60 Figure 27 - Relay output schematic ................................................................................................61 Figure 28 - Material selection using digital I/O................................................................................62 Figure 29 - Factory loop-back test wiring........................................................................................65 Figure 30 : Using test blocks...........................................................................................................68 Figure 31 - RS232 serial port..........................................................................................................71 Figure 32 - RS485 interface............................................................................................................72 Figure 33 - RS485 module circuit board .........................................................................................73 HYDRO-VIEW USER GUIDE D0022 REV 1.06 7 Note: 8 This manual references older versions of Hydro-Probe Sensors which have now been superseded by the Hydro-Probe II. Hydronix recommends that all new installations should use the latest available sensor cable, which should be connected to the Hydro-View according to the instructions in the Hydro-Probe II User Guide. HYDRO-VIEW USER GUIDE D0022 REV 1.06 Introduction System overview The Hydro-View provides display and control-system interface facilities in an easy-toapply form for a single channel of moisture measurement using any of the moisture sensors from the Hydronix range. Key features include... Hydronix sensor input including power supply source for sensor. 0-10Vdc or 4-20mA analogue output (link selected option) with working range scaled from front panel. Graphic display provides large characters for legibility and 'chart-recorder' displays of sensor measurements. RS232 serial port built in for communication to external systems or printer. Plug-in RS485 multi-drop serial port module (extra-cost option). Two digital inputs that may be configured for batch averaging, input filtering and material level functions. Sensor fault or out of range alarm relay output. Two programmable set-point relay outputs. Panel mounting model HV02 has 146x98mm facia dimensions with 140x92mm panel cut-out. Overall depth including IEC connector is 205mm Scope of this document This guide describes Hydro-View model HV02 and associated options as indicated on the rear panel label. Earlier versions of the Hydro-View do not contain all the features of the HV02 and you should refer instead to the appropriate guide. Organisation of this document This guide is organised into the following sections... Section Introduction Hydro-View quick start Advance user options and configuration Calibration and sampling techniques Grouping channels Installation Readership All All Using Hydro-View serial ports Engineer Engineer Description Orientation. How to operate the Hydro-View front panel to select displays, change working values etc. How to configure the Hydro-View for a particular application. Supervisor & Engineer How to take samples of the material in use and obtain results for calibrating the Hydro-View unit. Engineer How to use multiple moisture sensors to compute average values. How to install the Hydro-View in a control panel and connect it to your control system. How to configure and operate the Hydro-View for use with RS232 and RS485 communications. Engineer HYDRO-VIEW USER GUIDE D0022 REV 1.06 9 APPLICATIONS OF HYDRO-VIEW WITH HYDRONIX MOISTURE SENSORS Applications of Hydro-View with Hydronix moisture sensors The Hydro-View is used in conjunction with any of the moisture sensors from the Hydronix range. Applications of the sensors normally fall into one of the following categories... Where the average moisture content of a batch of material is required, the material passing over the sensor only once during the batch. An example of this is in the batch weighing of materials out of a storage bin with the moisture sensor (normally a HydroProbe but possibly also a Hydro-Skid) mounted in or close to the outlet of the bin. This type of application is referred to as a Batch Weighing application in this manual. Where the moisture content of batch of material is measured continuously with the material being recycled over the sensor, which in this case would normally a HydroMix. An example of this is a batch mixing application, where the homogeneity of the batch is important. This type of application is referred to as a Batch Mixing application in this manual. Where the moisture content of a continuous stream of material is required. The material passes the face of the sensor only once, but the moisture value is then used as a feedback signal in a control loop. An example of this would be a Hydro-Skid sensor mounted on the output conveyor of a continuous mixing system. This type of application is referred to as a Continuous process in this manual. Each of these categories of applications would require the use of different facilities and settings within the Hydro-View. The selection of appropriate Hydro-View facilities and interfacing to external equipment is essential in obtaining the best performance from your Hydronix moisture measurement system - inappropriate choice of the operating conditions is the biggest single cause of poor performance. Examples of these three categories are described below. These may be used as a guide in developing your own systems although the applications of the Hydro-View are not limited to these applications. The examples show the minimum configurations required and in general do not show variations in the use of interfacing techniques, which are described elsewhere. 10 HYDRO-VIEW USER GUIDE D0022 REV 1.06 
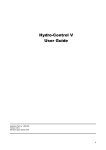
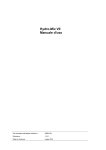
INTRODUCTION A batch weighing system A typical example of a batch weighing system involving a moisture measurement point (in this case a Hydro-Probe) at the output of the storage bin is shown in Figure 1. The Hydro-View is interfaced as follows... ⇒ Feed a signal to a digital input on the Hydro-View indicating when the gate is open. This signal can be derived either from a limit switch on the gate or from an auxiliary contact on the Open gate output in the batch control system, whichever is most convenient. Configure this input as an Average/Hold input (see Input 1 / Input 2 use on page 36). ⇒ Connect the Hydro-Probe sensor to the Hydro-View in the standard way. • Figure 1 - Batch weighing example ⇒ Connect the analogue output to the batch computer and set the output variable to AVERAGE. The output range should be set according to the working moisture range of the material; for most concrete batch applications, the default values of 0 and 20% are appropriate. Refer to Installation later in this document for wiring details. You may be tempted to short-cut this approach in some of the ways described below - if you do this, you are unlikely to achieve satisfactory results and Hydronix cannot provide technical support under these circumstances. Recommendations for best performance ALWAYS make use of the average/hold facility. Even if your batch computer is computing the average moisture value in the batch, you will still need to display the average unscaled HYDRO-VIEW USER GUIDE D0022 REV 1.06 11 APPLICATIONS OF HYDRO-VIEW WITH HYDRONIX MOISTURE SENSORS input reading for calibration purposes which can only be done by providing the average/hold input as described. ALWAYS position the sensor so that the moisture value used is representative of the batch being weighed. Generally, this means positioning the sensor as close to the point of weighing as possible, within the constraints of ensuring sufficient material covers the sensor. ALWAYS perform the weight correction ‘on the fly’, towards the end of the same weighing cycle. Some batch systems use the moisture value from one batch to correct the next sequential batch - this is not adequate, as there may be large batch to batch changes in moisture content. In some situations this can lead to the system performance actually being worse when the moisture value is used. ALWAYS ensure that the storage bins are managed correctly. Running out of material during a batch may lead to errors in the reading, even though out of range readings are not included in the average computation. ALWAYS ensure that you are getting a meaningful input to the Hydro-View - there is little point wasting time performing calibrations on the system if the sensor is covered by stagnant material or is otherwise subject to inconsistent material flow. Verify this first using the trend recorder display, which is a convenient way of observing the material passing the probe. ALWAYS use additional sensors where several gates are used - you should not assume that the moisture content of the material flowing out of both gates is the same - it will not be. The results of several Hydro-View units can be combined by use of the serial ports see Grouping channels (p49) for further details. NEVER attempt to use the NOW reading to correct weights - the moisture content during a batch can change quite dramatically. We have observed variations between 6% and 16% during a single batch - the average value computed by the Hydro-View on the same batch was accurate (compared with a desiccation test on a large sample of the batch) to within 0.2%. NEVER attempt to use the displayed value for manual input into a batch computer for weight correction if it is possible to interface directly. This relies on an operator to input the value, which at best will be one batch behind and at worst will never be done. 12 HYDRO-VIEW USER GUIDE D0022 REV 1.06 BATCH WEIGHING CALIBRATION PROCEDURE Batch weighing calibration procedure The procedure detailed below will enable the Hydro Probe, when connected to a Hydro View, to be used with confidence and accuracy. Ultimately, the accuracy of the system will only be as accurate as the method of sampling and drying. Therefore great care must be taken when gathering and drying samples. The Hydro View is provided with factory default values stored in memory. These default values are for initial installation set-up and allow the system to be used ‘’straight from the box’’. To accurately calibrate the system, two samples of aggregate are required with at least 2-3% moisture (minimum of 1%) difference and the aggregate flowing in the dynamic state. On initial installation, it can be difficult to obtain two different moisture values in one day. For this reason the ‘’Dry bucket Method may be used for the second moisture value. This should not be used as the final calibration value, but will enable the system to work until a different moisture content is available. Equipment required Scales Heat source Container Scoop To weigh 1 Kg, Accurate to 0.1g For drying samples, either hot plate or microwave oven. For storing samples, either bucket with sealable lid or polythene bags. For collecting samples. Preparation It is necessary to set the Hydro-View to work in the Average mode when calibrating the system. If the system is configured to work in the Average mode already then go to the Calibration section below. To configure the system to work in the Average mode carry out the following. ⇒ ⇒ ⇒ ⇒ Enter the main menu and log into the system using access code 336. Move down until Input 1 Use is highlighted and Press the enter key Record this setting to enable the system to be reset to the original configuration after calibration. Press either the up or down arrow soft key until Average/Hold is displayed. Then press the Enter key. A question will appear asking you to confirm any changes ⇒ Press ⇒ Return to the main moisture display. Connect the following wiring and switch if not already connected. ⇒ Remove power from the Hydro View by pulling the power cord from the back of the unit. ⇒ Connect the following HYDRO-VIEW USER GUIDE D0022 REV 1.06 13 CALIBRATION 13 Connect a single pole rocker switch across terminals 13 and 14 14 16 17 Connect a wire link across terminals 16 and 17 Hydro View Rear connector ⇒ Reconnect power to the Hydro View Calibration Read this section completely before starting any calibration. ⇒ Log into the system using access code 336. ⇒ Select Unscaled Input from the main menu. This display will be used to display the readings required for calibration. The following operation of collecting samples may require two or more people. Collecting a sample. ⇒ Open the bin gates to discharge a batch. If the system does not automatically select the average function then close the switch connected to the Hydro View as the bin gate opens and open the switch as the gate closes.. ⇒ While the batch is discharging collect two to three kilogram of aggregate which accurately represent samples of the complete batch. Place this in the container or bags and seal. ⇒ Record the Average Unscaled Input displayed on the Hydro-View before the next batch is started. The Average Unscaled Input will remain frozen on the display until the start of next batch. Drying the sample to calculate the moisture content. ⇒ Thoroughly mix the sample and remove approximately 1 Kg for drying. Reseal the container. ⇒ Accurately weigh the this sample, record this as A ⇒ Dry the sample until all traces of moisture have bean removed. This can be done by repeatedly weighing the sample between heating until three consecutive weightings are the same. Take great care not to lose any of the sample by careless stirring. Loosing only a few grains will make the test invalid. Record this weight as B. ⇒ Calculate (A-B)/B, this is the moisture content of the sample. ⇒ Repeat the drying sequence for another 1kg removed from the sample above. If the moisture is different by more than 0.1% then one of the samples was not dried out completely and the test has to be restarted. ⇒ Record the average of the two readings. 14 HYDRO-VIEW USER GUIDE D0022 REV 1.06 BATCH WEIGHING CALIBRATION PROCEDURE Inputting the calibration into the Hydro-View Unscaled I/P 2 and moisture 2 must always be of a higher moisture content than Unscaled I/P 1 and Moisture 1. If the factory default figures for Unscaled Input 1 and Moisture 1 are displayed and the new moisture calibration figures are higher than the displayed Unscaled input 2 and moisture 2, then the displayed Unscaled Input 2 and moisture 2 should be transferred into Unscaled Input 1 and Moisture 1 and the new figure entered as Unscaled Input 2 and Moisture 2. ⇒ Select Sensor Calibration from the Hydro View main menu. ⇒ Input the material table number for the material code to be calibrated. ⇒ Enter the new calibration figures. Before exiting the calibration check that the calibration makes sense ! The M value displayed at the bottom of the display should be in the range 0.3 - 0.6. If it is outside this range the figures input should be checked and the method of collecting and drying the sample checked. If all is correct with the data then contact Hydronix for further assistance. ⇒ Exit the calibration page by pressing the softkey as follows A pop up menu will appear asking you to confirm the changes ⇒ Press ⇒ When a moisture content with a difference of 2-3% is available repeat from 1 above. Dry Bucket method This procedure can be used on initial calibration when the silo can not be re- loaded with aggregate with moisture levels with a difference of 2-3%. It will provide a working system which can be fully calibrated at a later date. Equipment required Plastic Bucket Dry aggregate of approximately 1% moisture, enough to fill the bucket. This can be dried prior to arriving on site. A sample should be tested as above. If not dry to 0.5-1.5% then the aggregate should be dried once more. Method ⇒ Place the Hydro Probe in the centre of the bucket with the ceramic facing the centre and tilted to 10 degrees. The bottom of the probe should be 20mm from the base of the bucket. ⇒ Carefully pour the aggregate around the probe as lightly as possible. Do not compact the aggregate but TAP the bucket gently on the ground twice. ⇒ On the Hydro View select from the main menu Unscaled input and record the Unscaled input value. ⇒ On the Hydro View select from the main menu Sensor calibration and enter the reading for the recorded Unscaled input into Unscaled input 1. HYDRO-VIEW USER GUIDE D0022 REV 1.06 15 DRY BUCKET METHOD ⇒ Dry a sample of the aggregate in the bucket and record it’s moisture content, enter this figure into the Sensor calibration page as Moisture one. 16 HYDRO-VIEW USER GUIDE D0022 REV 1.06 A batch mixing system A typical batch mixer system using the Hydro-View is shown in Figure 2. Two interfacing schemes are illustrated... ‘One-shot calculation’ approach The first scheme uses the analogue output to transmit the moisture content to a batch computer then calculates how much water to add to the mixer. This is an approach used in the Hydronix Hydro-Control IV system, which performs both measurement and water addition. Improved performance in this type of system can often be obtained by using the Coarse/Fine digital input to select a ‘tighter’ filtering algorithm a few seconds prior to taking the measurement. The filter constants are set up in the Sensor Set-up menu. • Figure 2 - Batch mixing system ‘Dribble-feed’ approach The second scheme, which is useful only when there are few time constraints on the mix cycle, uses the set-point outputs to add water to the mixer. The water is added fairly slowly in this case, since it must be mixed evenly before the reading is valid. To speed things up a little, the second set-point output could be used to provide a coarse water feed in the case of very dry materials. Recommendations for best performance ALWAYS site the Hydro-Mix sensor in the most appropriate place for the mixer design. The position chosen should ensure that the sensor is covered by sufficient material at all parts of the mixer cycle and is not in an area prone to build up of waste material, which would lead to erroneous readings. General advice on this can be found in the Hydro-Mix sensor data sheet and by contacting your Hydronix supplier. HYDRO-VIEW USER GUIDE D0022 REV 1.06 17 ALWAYS pay attention to the sensor filter requirement. Static pan mixers in particular create large air pockets in the mix, which cause large ‘spikes’ in the sensor reading. The digital filter built into the Hydro-View is quite effective at removing these and the constants given in Suggested working values (p40) should be adequate for most pan mixer applications. ALWAYS ensure that the sensor reading has stabilised within the required tolerance band before taking a reading. This indicates that the mix is homogeneous. This may mean extending the mixing time accordingly although excessive mixing times should be avoided to prevent damage to the mix. ALWAYS position the sensor so that it is easily inspected without removal i.e. so that it can be clearly seen from an inspection door. NEVER reduce the digital filter constants so low (e.g. 0.01V) as to make the signal response very slow - although this will produce a stable reading, it will probably be the incorrect reading. In particular, watch for mix cycles following production gaps being excessively wet which is a clear sign that the time constant is too long. NEVER place the Hydro-Mix sensor directly below a water or material feed into the mixer. You should give the materials as much time as possible to mix before it is ‘seen’ by the sensor. NEVER calibrate until you are satisfied with the signal from the sensor and that the mixing times are appropriate - otherwise you are wasting your time. 18 HYDRO-VIEW USER GUIDE D0022 REV 1.06 A BATCH MIXING SYSTEM A continuous process A typical example of a continuous process is shown in Figure 3. In this case, a continuous mixer is supplied with material to be wetted to a pre-set moisture content. Modulating the water feed, dry-material flow-rate or a combination of both may be used to achieve this. A Hydro-Skid sensor is used to monitor the output of the continuous mixer on a conveyor belt. In some cases, it may be convenient to use a Hydro-mix sensor at the output of the mixer, depending on mechanical arrangements. As with many control systems of this type, there is a time lag between the control action point - the input to the mixer - and the point at which the measurement can be made. Hence the response time of the Hydro-View (in terms of the number of samples parameter) should be set in accordance with the time constant of the system to prevent unnecessary and erratic modulation of the valve controller. Systems such as this have been used successfully in the tempering of materials such as clay and PFA. • Figure 3 - Continuous mixing process Recommendations for best performance ALWAYS site the moisture sensor in the most appropriate place for the application preferably as near to the control point as possible (to minimise time lag) without compromising the homogeneity of the material passing the sensor. The position chosen should ensure that the sensor is covered by sufficient material at all times during measurement and is not in an area prone to build up of waste material, which would lead to erroneous readings. General advice on this can be found in the Hydronix moisture sensor data sheets and by contacting your Hydronix supplier. ALWAYS ensure that the sampling and filter parameters are set appropriately for the application - guidelines are given in Suggested working values (p40). ALWAYS provide some means of detecting an empty belt condition when using the HydroSkid sensor. In many cases, simply setting the sensor maximum voltage parameter to a suitable value will suffice. The purpose of this would be to prevent the control loop adding water to apparently very dry material. The alarm output relay of the Hydro-View might be used to signal the controller in this event. NEVER try to use the Hydro-Skid on very thin layers of material as this will give erroneous readings. All Hydronix sensors work best in bulk materials. HYDRO-VIEW USER GUIDE D0022 REV 1.06 19 Notes 20 HYDRO-VIEW USER GUIDE D0022 REV 1.06 Hydro-View quick start This section provides a brief introduction to using the Hydro-View for new operators and includes details of how to access the most commonly used facilities. Hydro-View front panel Figure 4 shows the front panel layout of the Hydro-View unit. You can use the keypad and display to view and change operating parameters of the Hydro-View. • Figure 4 - Hydro-View front panel Display contrast adjustment key (see The display contrast can be adjusted for optimum viewing by pressing the Keypad (p21)) when the Moisture display page (see overleaf) is being shown. You can press the key several times to select the most appropriate of sixteen different contrast settings. Note that at very low temperatures liquid crystal displays exhibit reduced contrast and this may be particularly noticeable immediately following the application of power to the unit. It may be necessary to adjust the contrast control several times until the unit has established its normal operating temperature in your application. It is recommended that you leave power applied to the Hydro-View wherever possible as this will also help to maintain the moisture sensor at normal working temperatures. Keypad The keypad is of a sealed membrane switch construction using dedicated keys for the most commonly used operator level functions… Legend Name Description Yes Confirms changes to data items. Also cancels an audible alarm. No Cancels changes to data items. Also used to adjust display contrast. Help Context-sensitive help facility. Select When pressed causes a menu to be displayed or selects the highlighted item on the menu. HYDRO-VIEW USER GUIDE D0022 REV 1.06 21 MOISTURE DISPLAY PAGE Legend Name Description Soft key Allows selection of options displayed above the key which are described in Soft key legends next. Soft key legends Legend Name Exit Description Return to the previous display or menu. Cursor up Moves the highlight cursor to the previous menu item. Cursor down Moves the highlight cursor to the next menu item. Increment value More When editing a numeric value, causes the value to be incremented. Holding the key down will speed up the count. When editing a numeric value, causes the value to be decremented. Holding the key down will speed up the count. Indicates more information available. Record Start recording data. Decrement value Moisture display page When power is applied a start-up display is shown for a few seconds and then the display changes to the default Moisture display page shown in Figure 5… • Figure 5 - Moisture display Hydro-View maintains several different variables representing the moisture content of the material in use... 22 HYDRO-VIEW USER GUIDE D0022 REV 1.06 HYDRO-VIEW QUICK START ‘Now’ value Average value Group M1,M2 and Avg values This is computed and updated continuously by the Hydro-View from the readings taken by the moisture sensor. This value is normally used for batch mixing type control systems in conjunction with the Hydro-Mix sensor, a stable value indicating that the material in the mixer is homogeneous. This value would also be used in the continuous process type application. This is the average of the ‘Now’ value beginning at an off to on transition of the Average/Hold input and therefore represents the average moisture content in a batch of material. The average value is continuously updated until the input is turned off, at which point it is frozen until the start of the next batch. This value is normally used in ready-mix and similar batch weighing applications in conjunction with the Hydro-Probe and Hydro-Skid products. Additional values computed in various ways from a group of HydroViews operating together - see Grouping channels (p49). It is legitimate for the moisture value to display a negative value - in some processes this is a useful measurement related to water absorption whilst in others it may indicate that the calibration of the sensor is incorrect. Note that the Average value is not indicated immediately but is shown the first time that the value is computed following the application of power to the Hydro-View. Thus systems not using the averaging facility will only see the Now moisture value displayed in large characters at the top of the display. You can select the moisture display page from any other non-menu page using the following keys… ⇒ Press to display the Main menu. The moisture display item is already highlighted. ⇒ Press again to select the moisture display page. Max / Min % display The maximum and minimum instantaneous moisture values occurring within an averaging period are recorded by the Hydro-View and may be displayed on demand by pressing the left-hand soft key (maximum %) or centre soft-key (minimum %). The maximum or minimum value will replace the 'NOW' value in the lower left-hand corner of the moisture display page whilst the associated key is held down. Note that these values are only available when the batch averaging facility is being used. HYDRO-VIEW USER GUIDE D0022 REV 1.06 23 HELP FACILITY Help facility Pressing will change the display to show the options available at any point… • Figure 6 - Help facility If you are in any doubt what to do next with the Hydro-View - try Hydro-View main menu To obtain a display other than the moisture display page, you must choose from a list of options in the Main menu. This is activated by pressing ... • Figure 7 - Main menu Choose the menu option you require by using the soft-keys to highlight the option followed by pressing again. 24 HYDRO-VIEW USER GUIDE D0022 REV 1.06 HYDRO-VIEW QUICK START The options available on the main menu by default are:Moisture display Trend display Material in use Set-point set-up Access code The default display when power is applied. A graphical display of moisture and other values plotted against time. Displays the current material number and allows this to be changed. Allows low and high cut-off operating parameters associated with the set-point outputs to be adjusted. Allows access to additional operations. These options are considered to be useful to most operators of the unit and therefore do not require any access code. Additional facilities are described in Advanced user options and configuration (p31). Trend display page The trend display allows the moisture content to be monitored over a period of time. It is of particular use under the following conditions… Monitoring the effectiveness of mixing action when used with a Hydro-Mix sensor. The display quite clearly shows the point at which thorough mixing has occurred. Looking at the variation in moisture content within a batch of material. It is inadvisable to take a calibration sample from a batch containing wide variations since this leads to inaccuracies. During installation to set up the digital filtering parameters (samples, clipping etc.) applied to the sensor input. The trend display simulates a paper chart recorder - the 'paper' moves under a fixed 'pen' so that the most recent 100 readings are displayed at any time. Four variables are recorded for each point... Instantaneous moisture (M%). Average moisture (A%). Raw sensor input voltage (V). Sensor voltage after ‘clipping’ (Vc). Although only one trace is visible at any time on the display, any of the four traces may be selected for display and so it is easy to compare (say) the input voltage before and after clipping has been applied. The controls are modelled on those of a tape recorder. HYDRO-VIEW USER GUIDE D0022 REV 1.06 25 TREND DISPLAY PAGE • Figure 8 - Trend display The current value of the variable whose trace is being displayed is shown at the top left hand corner of the display. For clarity on the small display, the vertical axis is not labelled. However, the traces are scaled according to the values programmed in the Sensor set-up menu. You can select the trend display from any non-menu display page using the following keys… ⇒ Press to display the Main menu. The moisture display item is highlighted. ⇒ Press to highlight the trend display item. ⇒ Press again to select the trend display page. Once the record option has been chosen, the most recent 100 values will be recorded continuously until the pause option is chosen, even if another display page is selected in the meantime. You can adjust how often a reading is taken by the trend display from the Sensor set-up menu. 26 HYDRO-VIEW USER GUIDE D0022 REV 1.06 HYDRO-VIEW QUICK START Changing operating values Hydro-View operating values (or parameters) are organised in lists of related items. The method for changing these values is described below... ⇒ Choose the list you wish to examine from the Main menu and then select the item you wish to change by highlighting it using the soft-keys... • Figure 9 - Selecting parameters ⇒ Press again, the soft-key legends will change to allow the value to be edited in a pop-up window... • Figure 10 - Changing a value ⇒ Holding down or will allow the value to be changed rapidly - the rate accelerates as you hold the key down. The value is bounded at lower and upper limits beyond which it cannot be changed and sometimes these limits will be based on the current values of other items. ⇒ Press value. or keys to accept the new value or press to restore the previous over a highlighted value, you do not have If nothing happens when you press permission to change this value and will need to enter the appropriate access code. HYDRO-VIEW USER GUIDE D0022 REV 1.06 27 ADJUSTING SET-POINTS Sometimes the parameter is not numeric but is instead one of a list of options. In this case or will step through the list… • Figure 11 - Changing options Usually, the new value will not take effect until you exit from the current list to prevent invalid intermediate combinations of values from being used… to exit the menu. If any of the values in the list have been changed ⇒ Press then a pop-up will appear, requesting confirmation of the changes you have made. ⇒ Press and the new values will become operational or press changes. to abandon all Adjusting set-points The Hydro-View control two set-point output relays. The set-points may be programmed so that the outputs are turned ON within a specified range of moisture contents. This allows the set-points to be used for such purposes as... Signalling an acceptable range of moisture content - for example monitoring material on a conveyor belt using a Hydro-Skid sensor or checking the moisture content out of a mixer using a Hydro-Mix sensor. Simple control of water addition by using the outputs to turn on a water valve up to a pre-set moisture reading. Each set-point operates independently and may be programmed with the following parameters... Parameter Variable Low cut-off % High cut-off % Hysteresis % Delay (s) Description Whether the Now or Average value of moisture content is to be used as the controlling variable. The moisture content below which the set-point output relay will be turned OFF. The moisture content above which the set-point output relay will be turned OFF. The % by which the moisture content must exceed the low cut-off or be below the high cut-off before the output relay will make an OFF to ON transition. This is used to prevent 'jitter' near to the programmed cut-off points. The time (in seconds) for which the moisture content must be within a range for any action to be taken. Note that only the Low and High cut-off values can be adjusted unless an access code is entered. When this option is selected from the main menu, you will first be prompted for the set-point number which you wish to adjust. 28 HYDRO-VIEW USER GUIDE D0022 REV 1.06 HYDRO-VIEW QUICK START Material in use The Hydro-View stores calibration settings for up to ten different materials, numbered 1 to 10. You must ensure that the material number in use by the Hydro-View matches the material being presented to the sensor otherwise you will get erroneous moisture values. Quite often the selection of material number may be controlled by an external system in which case you will not be able to adjust the material number from the Hydro-View keypad although the current setting will be displayed. To select the material number from the moisture display page… ⇒ Press ⇒ Press ⇒ Press to display the Main menu. The moisture display item is highlighted. to highlight the Material in use item. again. A pop-up will appear. ⇒ Adjust to the required value as described in Changing operating values (p27) and press to accept the new value. ⇒ Return to the current display page by pressing HYDRO-VIEW USER GUIDE D0022 REV 1.06 29 MATERIAL IN USE Notes 30 HYDRO-VIEW USER GUIDE D0022 REV 1.06 Advanced user options and configuration The menu options described in this section are only available if the relevant access code has been entered, otherwise they will appear as ... on the Hydro-View display. Access codes are listed at the end of this manual. Sensor calibration Unscaled input Sensor set-up Output set-up Sensor diagnostic Audible Alarm Material Mode RS232 Usage RS485 Usage Data Log Rate Station number Number of slaves Comms diagnostic Input 1 use Input 2 use Language Factory defaults Factory test Allows calibration values to be set from the results obtained by taking laboratory samples. Displays the sensor input prior to scaling for use during calibration. Allows the operating parameters of the sensor to be adjusted. Allows the analogue output range and variable to be adjusted. Displays some engineering values about the sensor and the Hydro-View. Determines whether the internal bleeper is sounded when a sensor alarm is triggered. Determines how the Material in use number will be selected. Configures the RS232 serial port. Configures the (optional) RS485 port. Sets how frequently moisture data will be sent to the serial port(s). Sets the station number of this Hydro-View unit in a multi-drop configuration. In a master/slave Hydro-View configuration, determines how many slave units are to be used. Displays performance information about the RS232 and RS485 communications ports. Selects how digital input 1 will be used. Selects how digital input 2 will be used. Allows the operating language of the Hydro-View to be chosen from a list of supported languages. Allows factory default parameters to be restored. Executes a set of diagnostic programs on the Hydro-View to verify operation of the unit. Sensor calibration The electrical properties of different materials can be quite diverse and it is often necessary to calibrate the moisture sensors to suit different materials. Hydro-View allows the calibration values for up to ten different materials to be stored internally in a material table which can then be recalled instantly by using a Material in use number. This number can be selected either locally at the keypad or remotely using the serial ports. The Hydro-View uses a two-point calibration method which requires you to enter values from two samples of material at different moisture contents. A minimum difference of 1% in moisture content between the two samples is required to reduce possible calibration errors, although a larger difference is preferable. Parameter name Unscaled i/p 1 Moisture % 1 Unscaled i/p 2 Moisture % 2 SSD % Default Value 4.15 0.00 28.40 11.00 0.00 Description Unscaled input value for calibration sample 1 Actual moisture % value for calibration sample 1 Unscaled input value for calibration sample 2 Actual moisture % value for calibration sample 2 SSD offset for this material HYDRO-VIEW USER GUIDE D0022 REV 1.06 31 SENSOR SET-UP MENU The basic calibration procedure is as follows... ⇒ Monitor the Unscaled Input display on Hydro-View and record either the instantaneous or average value shown (as appropriate for your application) at the time of taking a sample. ⇒ Perform a desiccation or bake out test on the sample to establish the true moisture content by weighing the sample before and after drying. Recommended procedures are given later in this guide in Calibration and sampling techniques ⇒ Enter the results into a material table using the Hydro-View Sensor Calibration page. Each material calibration table allows a compensating value to be entered. This is known as the Surface Saturated Dry or SSD offset and represents a value which will be subtracted from the moisture value before is it displayed or otherwise output. Its purpose is to adjust the displayed moisture reading for the absorption properties of the material. The Hydro-View uses the two calibration values to compute a calibration line for the material of the form… y = mx + c where y is a moisture value, x is the corresponding unscaled input from the sensor, m is the slope of the calibration line and c is the intercept. The computed values for m and c are indicated on the calibration display. Further details will be found in Calibration and sampling techniques on page 42. Sensor set-up menu Hydronix moisture sensors output a voltage signal, which varies according to the moisture content of the material. However, the signal may be disturbed by the presence of other materials such as mixer blades passing in close proximity to the sensor. These unwanted signals form 'noise' in the system and would result in errors in the reading if they were not filtered out. Fortunately these noise 'spikes' are characterised by being of short duration and having relatively fast rise and fall times and may therefore be effectively eliminated by filtering the input signal in a manner appropriate to the application. The Hydro-View uses the parameter list in the Sensor set-up menu to control how the raw voltage signal from the sensor is processed to derive the moisture content. 32 Parameter Default Value Description Type 1 Samples 5 A/H delay 0 Sync Delay 0.00 Sensor type. Defines the signal processing algorithm used for this sensor. Number of sensor samples used to evaluate the ‘NOW’ moisture reading. Range 1 Æ 1000. Time interval between the average/hold input going active and the start of averaging. Range 0.0 Æ 100.0 seconds. Time interval between a sync signal arriving at a digital input and a sensor reading being taken. Used to synchronise the readings to external events. The Sensor Type parameter must be set to 2 for this to be used. Range 0.00 Æ 10.00 seconds. HYDRO-VIEW USER GUIDE D0022 REV 1.06 ADVANCED USER OPTIONS AND CONFIGURATION Parameter Default Value Description +dV Coarse 1.00 -dV Coarse 1.00 +dV Fine 0.10 -dV Fine 0.10 Minimum volts 0.5V Maximum volts 12.0V Trend step 1.0 Trend lower 0.00 Trend upper 20.00 Alarm Lo 0.00 Alarm Hi 20.00 Positive coarse filter input rate limit. Sets the maximum positive voltage change between successive samples. Used to filter out noise from the signal. Range 0.01 Æ 10.00V Negative coarse filter input rate limit. Sets the maximum negative voltage change between successive samples. Used to filter out noise from the signal. Range 0.01 Æ 10.00V Positive fine filter input rate limit. Range 0.01 Æ 10.00V Negative fine filter input rate limit. Range 0.01 Æ 10.00V Minimum sensor voltage accepted before an alarm is issued. Used to detect broken sensor cable. Range 0.5V Æ Maximum volts. Maximum sensor voltage accepted before an alarm is issued. Range Minimum volts Æ 12.0V Sets the update interval on the trend recorder display. Range 0.1 Æ 10.0 seconds Sets the minimum moisture value displayed on the trend recorder display. Range -99.99 Æ 99.99% Sets the maximum moisture value displayed on the trend recorder display. Range -99.99 Æ 99.99% Sets the minimum moisture value allowed before an alarm occurs. Range -99.99 Æ 99.99% Sets the maximum moisture value allowed before an alarm occurs. Range -99.99 Æ 99.99% Output set-up menu The Hydro-View 0-10V (4-20mA) analogue output can be set to represent any convenient moisture content range by choosing Output set-up from the main menu. The parameters that may be set here are... Parameter Minimum % Maximum % Default Value 0.00 20.00 Calibrate % 0.00 Variable NOW Description The moisture value represented by an output of 0V or 4mA. The moisture value represented by an output of 10.00V or 20mA. Used to force a known value to the output for calibration of external equipment. Selects which moisture variable will be output. Options available are... Now - described elsewhere. Average - described elsewhere. V-Clip - sensor voltage after rate limiting filter has been applied. Calibrate - provides a fixed value determined by the Calibrate % parameter above. Group M1, Group M2, Group Avg see Grouping channels (pon page 49). HYDRO-VIEW USER GUIDE D0022 REV 1.06 33 SENSOR DIAGNOSTIC DISPLAY Sensor diagnostic display This is provided so that Hydronix technical support can assist you in the event of any problems with the system. The information contained is of an engineering nature and will not normally be used. However, a brief description is shown in the diagram below... • Figure 12 - Sensor diagnostic display This information is updated continuously, so a description of what is happening to this display is quite useful in the diagnosis of any problems. Audible Alarm The Hydro-View will turn on its alarm relay output under a number of conditions... When the sensor voltage is outside the range programmed in the Sensor Set-up menu. This is used to detect a faulty sensor and in particular a broken cable. When the moisture value is outside the range programmed in the Sensor Set-up menu. When the moisture value is outside the range programmed in the Output Set-up menu. The internal beeper of the Hydro-View will give an alarm if the Audible Alarm parameter is set to On. When an alarm occurs, the beeper can be turned off by pressing , although the relay output will remain energised. Material mode The material calibration table number to use at any instant can be determined from any of three sources, although only one such source can be used at any time. The source is selected using the Material mode parameter on the main menu. The possible sources are... Keypad Digital I/O Serial The material calibration table number to be used is entered via the keypad. The set-point output relays and digital inputs are used to select material tables 1, 2, 3 or 4. Refer to Material selection using Digital I/O (p61) for external connection details. The material table is selected remotely using either the RS232 or RS485 serial ports. This option will normally be set at installation time and never changed. 34 HYDRO-VIEW USER GUIDE D0022 REV 1.06 ADVANCED USER OPTIONS AND CONFIGURATION RS232 usage The RS232 port can be configured to operate in a number of different ways... Disable Data Log ASCII Hex Master Batch Print RS485 Watch Sensor Trace RS232 port is unused. The current moisture values are transmitted periodically, as determined by the Data Log Rate parameter. Provides two-way communication between the Hydro-View and another system, using a simple ASCII Hex protocol. The port acts as a master device to another Hydro-View unit configured for ASCII Hex on its RS232 port. See Grouping channels (p49) for further details. The port will print a report of the moisture variables each time the Average/hold input is turned off, thus providing an end of batch report. All information received by the RS485 port will be retransmitted on the RS232 port. By connecting the RS232 port to a personal computer running a terminal emulation program, it is possible to monitor what is happening on the RS485 port for testing purposes. This will output the sensor voltage reading at a rate of 100 samples per second. It is normally used to capture the signal wave-form from the sensor for testing purposes. The value is output as a four digit hexadecimal number where 0000 corresponds to 0.00V and 7FFF corresponds to 12.00V. RS485 usage The optional RS485 serial port may be configured to operate in a similar way to the RS232 port. However, the RS485 port allows multi-drop communication on a simple twisted pair cable, permitting several moisture measurement channels to be interfaced with a single communications port. Permitted options are... Disable Data Log ASCII Hex Master Batch Print RS485 port is unused The current moisture values are transmitted periodically, as determined by the Data Log Rate parameter. Provides two-way communication between the Hydro-View and another system, using a simple ASCII Hex protocol. The port acts as a master device for a maximum of three additional Hydro-View units configured for ASCII Hex on their RS485 ports. See Grouping channels (p49) for further details. The port will print a report of the moisture variables each time the Average/hold input is turned off, thus providing an end of batch report. Some of these options can be selected at the same time as similar options on the RS232 port, although some combinations will not be logically correct in use - for example, configuring both RS232 and RS485 ports as Master will produce undefined results. Data log rate Determines how often data is transmitted by a port configured for Data Log operation. Station number In a communications configuration involving the ASCII Hex communications protocol this parameter sets the station number for this Hydro-View unit acting as a slave device. Number of slaves In a Master/Slave system (see Grouping channels (p49)) this parameter sets the maximum number of slaves which will be used in the system. The Master station will then only attempt to communicate with the number of slave units entered, avoiding wasting communications time on slave units which are not present in the system. HYDRO-VIEW USER GUIDE D0022 REV 1.06 35 COMMUNICATIONS DIAGNOSTIC PAGE Communications diagnostic page This provides a page of information relating to the performance of the RS232 and RS485 communications ports and will be used to assist the installation and commissioning of a system. The format is shown below... • Figure 13 - Communications diagnostic The two columns of figures will increment as a communications event of the relevant type occurs. The events are relevant only to ASCII-Hex and Master port settings and are interpreted as follows... Good No reply Bad reply Overrun Timeout Checksum Char err The communications transaction was completed successfully The Hydro-View issued a request but did not get a reply within a predetermined period. The reply to a request contained invalid data or was of incorrect length. Too many characters were received to process. A frame start character was received, but the rest of the frame did not complete within the allowed time. The received frame of data contained an invalid checksum. A character framing error occurred. Input 1 / Input 2 use Two general purpose digital inputs are provided on the Hydro-View. However, different applications may demand that these be used in different ways and therefore it is possible to configure each input for a specific use. The options available are… Ave/Hold Coarse / Fine Level Material Sync 36 Input is used to control batch averaging of the moisture value. Relevant only to batch applications such as ready-mix plants. Input is used to select between the Coarse and Fine filter control values set in the Sensor set-up menu. This is relevant only to mixer applications in pre-cast and similar industries. An input indicates that sufficient material is covering the sensor and therefore that the value from the sensor can be used in the averaging process. Relevant only to batch applications such as ready-mix plants. In no inputs are configured as level inputs the material level is always deemed to be acceptable by the Hydro-View. Input is used to control material number selection. One of four materials may be selected in this way as described in Material selection using digital I/O. Input is used to synchronise sensor readings to some external timing signal. Useful in certain batch mixer applications to help remove unwanted noise. HYDRO-VIEW USER GUIDE D0022 REV 1.06 ADVANCED USER OPTIONS AND CONFIGURATION Since there are only two physical inputs available on the Hydro-View, it is not possible to use all of these facilities on a single installation. However, it is most unlikely to need any more than two facilities on the same system and so there is not usually a problem. Setting both inputs to perform the same function will lead to unspecified results and must be avoided. Language selection The Hydro-View now supports operation in many common languages with additional support being added as required. To select the operating language, choose Language from the main menu and simply select from the list of available languages shown. Factory default settings Prior to shipment by Hydronix, the Hydro-View operating parameters will have been set to default values. Since these are quite numerous it is useful to be able to reset them all to a known state, particularly when first commissioning a system. Selecting Factory defaults from the main menu produces a display referring the reader to this manual. This is to avoid unintentional resetting of the values. To restore the factory defaults, press the centre and right-hand function keys simultaneously. A confirmation pop-up box will appear which you must accept before the default values are restored. The current default values are tabulated in the following pages. Use the right hand column in each section to record the values you have used in your system. A copy of these tables will also be helpful should you need to call Hydronix for technical support. HYDRO-VIEW USER GUIDE D0022 REV 1.06 37 FACTORY DEFAULT SETTINGS Sensor set-up Parameter name Default Value Type 1 Samples 5 A/H delay 0 Sync delay 0.00 +dV Coarse 1.00 -dV Coarse 1.00 +dV Fine 0.10 -dV Fine 0.10 Minimum volts 0.5V Maximum volts 12.0V Trend step (s) 1.0 Trend lower % 0.00 Trend upper % 20.00 Alarm Lo % 0.00 Alarm Hi % 20.00 Your value Notes Your value Notes Your value Notes Output set-up Parameter name Default Value Minimum % 0.00 Maximum % 20.00 Calibrate % 0.00 Variable NOW Sensor calibration Parameter name Unscaled i/p 1 Moisture % 1 Unscaled i/p 2 Moisture % 2 SSD % Default Value 4.15 0.00 28.40 11.00 0.00 Set-point set-up Parameter name Variable Low cut-off % High cut-off % Hysteresis % Delay (s) 38 Default Value NOW 0.0 20.0 0.0 2 HYDRO-VIEW USER GUIDE D0022 REV 1.06 Set-point (1) Set-point (2) ADVANCED USER OPTIONS AND CONFIGURATION Other parameters Parameter name Audible Alarm Material Mode RS232 Usage RS485 Usage Data Log Rate Station number Number of Slaves Input 1 Use Input 2 Use Language Default Value On Keypad Data Log Disable 1.0 1 1 Ave/Hold Coarse/Fine English Your value Notes HYDRO-VIEW USER GUIDE D0022 REV 1.06 39 SUGGESTED WORKING VALUES Suggested working values The example configurations given in this section should be used as a guide in developing your own systems. However, the applications of the Hydro-View are not limited to these applications. The examples show the minimum configurations required and in general do not show variations in the use of interfacing techniques, each of which is described elsewhere. The following tables give recommended working values for the three examples described in Applications of Hydro-View with Hydronix moisture sensors (p10). These should be treated as starting points, although in practice very little tuning should be required. These values will need to be adjusted to suit changes to interfacing arrangements which may have been employed. Sensor set-up Parameter name Batch weigher Batch mixer Type Samples A/H delay Sync delay +dV Coarse -dV Coarse +dV Fine -dV Fine Minimum volts Maximum volts Trend step (s) Trend lower % Trend upper % Alarm Lo % Alarm Hi % 1 5 0.5 0.00 1.00 1.00 0.10 0.10 0.5V 12.0V 1.0 0.00 20.00 0.00 20.00 1 751 0 0.00 0.02 0.05 0.01 0.02 0.5 12.0 1.0 0.00 20.00 0.00 20.00 Parameter name Batch weigher Batch mixer Minimum % Maximum % Calibrate % Variable 0.00 20.00 0.00 AVERAGE 0.00 20.00 0.00 NOW Parameter name Batch weigher Batch mixer Unscaled i/p 1 Moisture % 1 Unscaled i/p 2 Moisture % 2 SSD % 4.15 0.00 28.40 11.00 0.003 4.15 0.00 28.40 11.00 0.00 Continuous process 1 1002 0 0.00 0.02 0.02 0.02 0.02 0.5 12.0 1.0 0.00 20.00 0.00 20.00 Output set-up Continuous process 0.00 20.00 0.00 NOW Sensor calibration 1 Continuous process 4.15 0.00 28.40 11.00 0.00 Depends on rotational speed of mixer. This is three rotations at 2.5 seconds. Depends on time constants in feedback control system. This will give a response time of around 10 seconds. 3 Normally set to reflect the absorption properties of material in ready-mix applications. 2 40 HYDRO-VIEW USER GUIDE D0022 REV 1.06 ADVANCED USER OPTIONS AND CONFIGURATION Set-point set-up Parameter name Batch weigher Batch mixer Variable Low cut-off % High cut-off % Hysteresis % Delay (s) N/A N/A N/A N/A N/A NOW As required As required 0.25 2 Parameter name Batch weigher Batch mixer Audible Alarm Material Mode RS232 Usage RS485 Usage Data Log Rate Station number Number of Slaves Input 1 Use Input 2 Use Language On Keypad Batch print Disable N/A 1 1 Ave/Hold N/A English On Keypad Data log Disable 1.0 1 1 N/A Coarse/Fine English Continuous process NOW As required As required As required 2 Other parameters Continuous process On Keypad Data log Disable 1.0 1 1 N/A Coarse/Fine English HYDRO-VIEW USER GUIDE D0022 REV 1.06 41 SUGGESTED WORKING VALUES Notes 42 HYDRO-VIEW USER GUIDE D0022 REV 1.06 Calibration and sampling techniques When using Hydronix moisture measurement equipment it is customary to calibrate the equipment to read real moisture percentage, since the sensor reading will be affected by basic physical (dielectric) properties of the material being measured. Therefore it is necessary to make independent tests to determine the real moisture content. A common method of determining moisture content is based on the desiccation (drying) of a sample and a suitable technique for use on site is described here. With materials such as sand, large variations of moisture content can be encountered in a single batch. For instance with stockpiles of sand it is quite possible to measure 4% moisture level at the top of the pile and 16% towards the bottom. When this material is loaded into the storage bins inevitably material is scooped from both the bottom and the top of the pile, thus creating localised stratification of moisture in the bin. As a bin is being emptied, the stagnant material from the sides, which almost certainly will be at a different moisture level, periodically falls in with the fresh material. Another feature is the dynamic state of the moisture content in a bin due to the free properties of the material. This is even noticeable in small laboratory samples in plastic containers which, if left to stand even for a very short period of time, will vary from top to bottom. NOTE: for the reasons given above, collecting a few kilograms of material that is representative to 0.1% accuracy of several tonnes of material is very difficult to achieve. Great care should therefore be taken when conducting these tests. A variety of laboratory techniques exist. The desiccation test is recommended in that it is an absolute measurement with repeatable results even when carried out by different operatives and it is not dependent on having to know the specific gravity of the material being tested. As will be appreciated no matter how much care is taken in conducting these tests, sampling and experimental errors will inevitably be present in each result. Initially the equipment can be calibrated from one actual set of results at the level of moisture contents encountered on site in conjunction with an estimate of calibration points at 0% moisture level, thus providing two separate calibration points spaced reasonably apart. However, improved accuracy will be obtained by taking adding a second true calibration point at a later date when site conditions allow. Recommendations for best performance ALWAYS ensure that the sample of material being used for calibration is from a batch with low moisture variation. This can be checked by using the minimum/maximum or trend display facilities on the Hydro-View and will help to prevent sampling errors affecting the results. ALWAYS take care when working with small samples of material not to lose any during the drying process. NEVER try to calibrate using extremely wet (near saturation) samples of material - the errors you will make in sampling such material will be very large. A maximum recommended calibration sample limit for sand would be around 12%. NEVER attempt to calibrate a Hydronix sensor by placing it in a bucket full of material or packing material on the face of the sensor. The ‘static’ readings obtained in such cases will not be representative of those obtained in the dynamic situation. HYDRO-VIEW USER GUIDE D0022 REV 1.06 43 EQUIPMENT REQUIRED NEVER use a calibration method which uses very small samples (e.g. ‘Speedy’ or infra-red balance) for calibrating coarse aggregates. NEVER assume that the material flowing out of two gates in the same bin is the same moisture content and do not attempt to take a samples from the flow of both gates in an attempt to get an ‘average’ value - ALWAYS instead use two moisture sensors in these cases, sampling the flow of each one individually - otherwise you will probably be wasting the money spent on the first sensor! Equipment required The following equipment is recommended for performing calibrations. Your Hydronix supplier will usually have this equipment available:Weighing scales Heating source Heating tray or dish Small hand shovel Plastic bucket An electronic or mechanical balance with a resolution to 0.1g and ideally with the facility to weigh up to 1Kg, although 600g is acceptable and perhaps easier to obtain. The most convenient source is a single ring electric hot plate. Other sources such as electric drying ovens, camping gas burners or microwave ovens can be used although extreme care should be taken with the latter. This should be ceramic (not plastic!) if used with a microwave oven, otherwise metal. For collecting samples from the flow of material. Ideally with plastic lid. Taking the samples You should always consider how the sensor is operating when taking your samples and should collect your samples in a manner similar to the way in which the sensor ‘sees’ the material. Batch mixer system sampling method In this situation the preferred calibration samples would be taken from the dry materials. However in many cases this can be impossible to obtain due to physical restrictions and so the following method can be used to acquire two calibration points for the Hydro-View. Proceed as follows... ⇒ Choose a suitable mix cycle to calibrate to. ⇒ Record the unscaled input at the end of the dry-mix phase when the reading has stabilised. ⇒ Record the dry weight of material and the quantity of water added to the batch. ⇒ Record the unscaled input at the end of the wet-mix, again when the reading has stabilised. ⇒ Discharge the mix and collect several samples from different parts of the batch into the bucket. ⇒ The material in the bucket should be well and thoroughly mixed immediately prior to taking a minimum of two samples for drying. The samples should preferably be approximately 1Kg in weight but not less than 500gm. For large aggregates it is more important to use a larger sample. ⇒ Dry the two samples of material and calculate the moisture content using the drying technique described later. This provides a ‘wet-reading’ for the Hydro-View calibration table. 44 HYDRO-VIEW USER GUIDE D0022 REV 1.06 CALIBRATION AND SAMPLING TECHNIQUES ⇒ Calculate the ‘dry-reading’ moisture value by calculating back based on the wetreading, water added, and dry weight of material. ⇒ Enter both sets of values into the Hydro-View calibration table. Continuous system sampling method In this case you will need to take samples passing the face of the sensor at the same time as recording the unscaled input display. It is normally impossible with this type of system to take a series of samples for mixing together before drying as it is the instantaneous value of moisture content passing the sensor which is required. The preferred procedure here is to take several spot samples at different moisture contents and plot these on a graph against the corresponding unscaled input. A ‘best-fit’ calibration line would then be obtained using a linear-regression algorithm (most spreadsheet programs will do this for you). Two points on this line would then be used for entry into the calibration table of the Hydro-View. Drying the samples An electric hot-plate (small portable models are available), camping gas burner, electric oven, or microwave oven are suitable. Proceed as follows... ⇒ Weigh the empty container to obtain its tare weight. Record this as value A. ⇒ Add the sample of material to the container and weigh again. Record this as value B. ⇒ Dry the material using the heat source, checking periodically by weighing until two measurements taken three minutes apart show no significant change. If an open tray is used, the material may be stirred carefully to assist evaporation. ⇒ Weigh the container again. Record this as value C. Normally the drying process for one sample takes approximately 15 minutes. Recommendations for best performance ALWAYS try to dry materials as quickly as possible to prevent reactions which may affect the results. This is particularly true of wet-mix concrete which will produce quite different results when dried overnight in an electric oven compared with drying quickly over a hotplate. ALWAYS wear safety glasses during the drying process. NEVER use excessive heat during the drying process. This can result in violent expulsion of small pieces of material from the drying tray which are potentially dangerous. Calculating the moisture percentage It is customary to express moisture present by weight as a percentage of the dry weight of material. Hence the following formula is used:- M= ( B − C) × 100 % ( C − A) Where... HYDRO-VIEW USER GUIDE D0022 REV 1.06 45 ENTERING RESULTS INTO THE HYDRO-VIEW M = Moisture content. A = weight of container. B = weight of container and wet sample. C = weight of container and dry sample. Entering results into the Hydro-View When you have obtained the moisture content of the sample, you need to enter this value together with the corresponding unscaled input value into the relevant material table. Calibration results are entered in the following way... ⇒ Select Sensor Calibration from the main menu. You will be prompted to enter a material number with which to associate the results. ⇒ Enter the unscaled input and associated Moisture % in positions 1 or 2 on the page as appropriate. The Hydro-View requires that the higher moisture content value is entered in position 2. As the values for the two calibration points are entered, the values of m and c are updated dynamically. These values describe the slope and intercept of the moisture calibration line which the Hydro-View will use to calculate the moisture reading from the unscaled sensor input. ⇒ When you finish entering the values, you will be asked to confirm whether or not the system is to be updated. If you accept, then the material calibration table will be updated and if this material number is currently in use the sensor calibration will be changed. What happens with your results Entering the results of a calibration test allows the Hydro-View to establish gain (m) and offset (c) parameters permitting the display of the absolute moisture content of the material in use. The moisture content displayed by Hydro-View is given by the linear scaling equation... M = mU + c - SSD where... M is the moisture content. U is the unscaled input value. SSD is the Surface Saturated Dry offset (see below). m and c are gain and offset parameters calculated automatically by Hydro-View from... m= ( M 2 − M1 ) (U 2 − U1 ) and... c = M1 − mU 1 where... U1, M1 are the unscaled input and moisture content respectively for the first sample, and U2, M2 are the unscaled input and moisture content respectively for the second sample. 46 HYDRO-VIEW USER GUIDE D0022 REV 1.06 CALIBRATION AND SAMPLING TECHNIQUES Moisture M2 M1 U1 U2 Unscaled input c • Figure 14 - Sensor calibration line HYDRO-VIEW USER GUIDE D0022 REV 1.06 47 Grouping channels In some situations and particularly in high-throughput batch plants, it is necessary to measure the moisture content at several points simultaneously and provide an average value. The Hydro-View provides a convenient way of doing this by making use of its serial ports. If the RS232 port is otherwise unused, then the output of two sensors can be averaged by simply connecting the RS232 ports of two Hydro-View units together using a cross-over cable (available from Hydronix). The optional RS485 port can be used to provide an average of up to four sensors, which should satisfy most application requirements. Grouping is achieved by defining one of the Hydro-View units (it does not matter which when using the RS232 interface) as a MASTER station with the other unit(s) as ASCII Hex devices. See examples later for clarification. The results of the grouping operation can be made available to external systems using either the analogue output port or the second serial port set for data log or batch print use. When grouping channels in this way, you must pay particular attention to calibration and in particular do not assume that the material flowing from one gate has the same moisture content as the others - they can be widely different at any instant. You should always aim to take a sample from the flow of a single sensor where possible. Group moisture variables The channel grouping facility results in the generation of three additional moisture variables in the system. These are referred to as... Group M1 Group M2 Group Average The average value of the NOW variables across all grouped units. This might be used in a large batch or continuous mixing application where there is some advantage in measuring the moisture at several points. The average value of the NOW variables across all grouped units which are currently in an ‘averaging’ state i.e. the average/hold input is ON and the average/hold delay timer has expired. This variable would normally be used by a batch computer performing its own time averaging. The integration over time of the Group M2 value, divided by time since the start of an averaging period. This variable will be used in the majority of grouped applications and in general is not the same as the average of the individual unit average values since the Group M2 value observes the ‘averaging’ state of individual units. The group variables automatically ignore channels which are either in an alarm condition and/or have a low level of material (as determined by the optional level sensing inputs). Group moisture display When a Hydro-View unit is configured as a MASTER station, you can view the group moisture variables by pressing the right hand soft-key when the standard moisture display is shown. This key will ‘toggle’ between the standard display, showing the moisture variables local to the unit, and the group display, showing the results of the grouping operation. Indicators to the right of the group display show which slave stations are currently responding to communications requests from the master station. HYDRO-VIEW USER GUIDE D0022 REV 1.06 49 EFFECT OF COMMUNICATIONS ERRORS ON GROUPED SYSTEMS • Figure 15 - Group moisture display Effect of communications errors on grouped systems The communications links between the master unit and the slave units should be trouble and maintenance free if correctly installed. However, in the event that a communications error occurs between the master and a slave, the slave station will be taken out of the system for a few seconds to allow it to recover and automatic retries will be performed periodically. These errors are most likely to occur during power up/power down of slave systems. A slave unit which has been powered down will be brought back on-line automatically within a few seconds of power being applied. Performance of the communications link can be viewed on the communications diagnostic page on the master Hydro-View. 50 HYDRO-VIEW USER GUIDE D0022 REV 1.06 GROUPING CHANNELS Example - a twin bin grouped system using RS232 Figure 16 shows probably the most common requirement for grouping moisture channels together. The majority of batch computers only provide a single channel of moisture input and when feeding simultaneously either from two bins or from another gate on the same bin there is no provision for combining the results of two moisture measurements. In this case, the Hydro-View on the left would be configured as a MASTER on its RS232 port, whilst that on the right would be configured as for ASCII HEX on RS232 with a station address of 1. The two units would be coupled together with a cross-over RS232 cable. The analogue output of the master unit would be connected to the batch computer, and • Figure 16 - Twin bin grouped system the analogue output variable set to Group Average. This variable is the batch average of the two channels, which is what is required. The Group Average variable automatically caters for situations where, for some reason, batching is performed from only one bin or gate. In addition, a bin level sensor input can be provided (level sensor not supplied by Hydronix) to prevent moisture errors in the event that one bin runs empty during a batch. HYDRO-VIEW USER GUIDE D0022 REV 1.06 51 EXAMPLE - A FOUR BIN GROUPED SYSTEM USING RS485 Example - a four bin grouped system using RS485 Figure 17 shows the maximum configuration which may be achieved with the grouping facility. Although four separate bins are indicated, the same situation may arise with two twin-gate bins. In this case, the Hydro-View on the lower left would be configured as a MASTER on its RS485 port, whilst the remainder would be configured for ASCII HEX on RS485 with a station address of 1, 2 or 3 as appropriate. The units would be coupled together with a single twisted-pair RS485 cable as described in Installation. The analogue output of the master unit would be connected to the batch computer, and the analogue output variable set to Group Average. This variable is the batch average of the four channels, which is what is required when all four bins are feeding at the same time. The Group Average variable automatically caters for situations where, for some reason, batching is performed from less than four bins or gates. In addition, a bin level sensor input can be provided (level sensor not supplied by Hydronix) to prevent moisture errors in the event that one bin runs empty during a batch. 52 HYDRO-VIEW USER GUIDE D0022 REV 1.06 GROUPING CHANNELS • Figure 17 - Four bin grouped system HYDRO-VIEW USER GUIDE D0022 REV 1.06 53 EXAMPLE - A FOUR BIN GROUPED SYSTEM USING RS485 Notes 54 HYDRO-VIEW USER GUIDE D0022 REV 1.06 Installation The Hydro-View unit must be mounted in a control panel or suitable alternative for normal operation with only the front panel exposed to the operator. For optimum display contrast, the unit should be mounted approximately at eye level. The control panel should be cut-out to receive the unit as shown in Figure 18. • Figure 18 - Panel mounting the Hydro-View The retaining bar and retaining screw are used to clamp the Hydro-View unit against the front panel. Do not over-tighten the retaining screw - just sufficient torque should be applied to hold the unit in place against the control panel. Power supply connections Mains power is connected to the Hydro-View using a standard IEC mains connector. The operating voltage of the unit can be selected by moving an internal link. Warning: For safety reasons and to meet the requirements of EMC Directive 89/336/EEC the earth connection in the IEC plug must be directly connected to the protective earth conductor in the external system. HYDRO-VIEW USER GUIDE D0022 REV 1.06 55 FIELD CONNECTIONS Adjusting the Hydro-View mains operating voltage The mains input voltage for the Hydro-View is selected internally as follows… 1. Remove the 7 screws securing the lid to the case. 2. Remove the lid to reveal the mains transformer and power supply assembly which is mounted on the inside of the lid. 3. Move the BROWN wire to select the appropriate mains voltage as indicated in Figure 19 opposite. 4. Refit the lid and screws. • 5. Indicate the new operating voltage on the rear panel using the labels supplied. Figure 19 - Hydro-View mains transformer Field connections All field connections (except mains and RS232 serial port) are made via plug-in screw terminal blocks located on the rear panel of the instrument. You should refer also to the wiring labels fitted to the lid of the Hydro-View. The terminals (numbered 1 through 21) are allocated as follows… Terminal Group function group 1-5 Moisture sensor connections 56 6,7 Analogue output 8-12 RS485 serial port 13-17 Digital inputs 18-21 Relay outputs HYDRO-VIEW USER GUIDE D0022 REV 1.06 Terminal Description 1 +15V sensor power 2 3 4 5 6 7 8 9 10 11 12 13 14 15 16 17 18 19 20 21 0V sensor power return -15V sensor power 0-10V sensor input + 0-10V sensor input 0-10V or 4-20mA analogue output Analogue output return Data A Data B RS485 0V (for test purposes only) +Vdc Input excitation supply Digital input 1 Digital input 2 Digital input common 0Vdc Input excitation supply return Relay common Alarm Set-point 1 or material select output 1 Set-point 2 or material select output 2 INSTALLATION Sensor Connections – Hydro-Probe II The Hydro-Probe II must be connected using the Hydronix sensor cable (part no 0090A), available in different lengths to suit the installation. Any extension cable required should be connected to the Hydronix sensor cable using a suitable screened junction box. Installation guidelines Ensure that the RS485 cable is taken back into the control panel. This can be used for diagnostic purposes and takes the minimum of effort and cost to connect at the time of installation. To connect to a PC use a suitable converter – see Hydro-Probe II user guide HD0193 for more details. Route the signal cable away from any power cables. The sensor cable should only be grounded near to the sensor. Ensure that the cable screen is not connected at the control panel. Ensure that there is continuity of the screen through any junction boxes. Keep the number of cable joins to a minimum. Three twisted pairs required (6 cores total) cable with 22 AWG, 0.35mm2 conductors. Screen (shield): Braid with 65% minimum coverage plus aluminium/polyester foil. 500 Ohm resistor – The recommended resistor is an epoxy sealed precision resistor of the following specification: 500 Ohm, 0.1% 0.33W Maximum cable run: 200m. Connecting the Hydro-Probe II to the Hydro-View A Red B Black C Yellow D Blue E Black J Green G Black F White K Black D Brown To connect to a Hydro-View, the Hydro-Probe II needs to be set to compatibility mode. This mode allows the Hydro-Probe II to directly replace an existing Hydro-Probe (HP01). The 500 Ohm resistor supplied with the cable is required to convert the analogue current output to a voltage signal 0090A twisted pair Sensor Cable H Screen Junction box RS485 A B 1 2 3 4 5 6 7 8 9 10 11 12 500 Ohm resistor Hydro-View (HV02) Connector • Figure 20: Connecting the Hydro-View to a Hydro-Probe II HYDRO-VIEW USER GUIDE D0022 REV 1.06 57 SENSOR CONNECTIONS – HYDRO-PROBE I Sensor Connections – Hydro-Probe I Hydronix moisture sensors are terminated in a 6-way Bulgin connector with a 1m lead attached to the sensor. It is therefore necessary to wire an extension cable between the sensor connector and the Hydro-View unit. The connection diagram is given in Figure 21. • Figure 21 - Sensor extension cable connections The cable should be 5 or 6 core screened multi-core with 0.5mm2 conductors. Note that it is NOT satisfactory to use a 4-core cable with terminals 2 and 5 connected at the Hydro-View end - this will lead to ‘common impedance’ type interference problems. The +15V power rail is protected internally against short circuits by a 500mA plug-in fuse (FS1) which may be replaced easily if required. Warning: Never connect other equipment to the +/-15V supply intended for the moisture sensor. • Figure 22 - Hydro-View rear panel 58 HYDRO-VIEW USER GUIDE D0022 REV 1.06 INSTALLATION Analogue output connections The analogue output may be configured for use either as 0-10V (default) or 4-20mA. The selection is made via an internal jumper as shown in Figure 23 which shows the main circuit board inside the Hydro-View. The jumper is located close to the analogue output terminals 6 and 7. EPROM FS1 RS485 module connector 0-10V/4-20mA jumper… Position 1-2 4-20mA (source) Position 2-3 0-10Vdc Relays FS2 FS3 • Figure 23 - Hydro-View main circuit board Wiring details are shown in Figure 24. Note that the analogue output shares a common supply rail with the internal 24V supply connected to terminal 17 - see Digital input connections on page 60 for further details. The working range of the analogue output is set in the Output set-up menu (see p33). HYDRO-VIEW USER GUIDE D0022 REV 1.06 59 SENSOR CONNECTIONS – HYDRO-PROBE I • Figure 24 - Analogue output wiring Digital input connections The two digital inputs (terminals 14 & 15) share a single common terminal (16) and are arranged internally as shown in Figure 25. • Figure 25 - Digital inputs Terminals 13 and 17 are connected to an internal dc power supply which may be used as an excitation supply for voltage-free contacts if required as shown in Figure 26. • Figure 26 - Internal/external excitation 60 HYDRO-VIEW USER GUIDE D0022 REV 1.06 INSTALLATION Terminals 7 and 17 are connected internally - if the internal supply is used for input excitation, then galvanic isolation between analogue output and the digital inputs cannot be achieved. A 500mA fuse (FS2) protects the internal 24V supply from external wiring errors. The fuse is a plug-in type and is easily replaced should it fail. Warning: Do not attempt to use the internal 24V supply for purposes other than providing digital input excitation for the Hydro-View. Relay output connections The alarm and set-point output relays are implemented using reed-relays as shown in Figure 27. • Figure 27 - Relay output schematic Care must be taken to avoid contact welding by fitting external contact snubber (typically 100R in series with 0.1uF) across the contacts when driving inductive loads. You should also ensure that such loads are fitted with suitable transient suppressors at the load to reduce electromagnetic interference. The relay contacts are rated at 240Vac 500mA (resistive). An internal series fuse (FS3) limits the TOTAL load taken by all three relays to 500mA. Plug-in replacement relays and fuses are available from Hydronix. Material selection using Digital I/O This mode allows one of four material calibration tables to be selected. Since this requires the use of the set-point output relays these functions are automatically disabled when the mode is selected. The digital input used in the diagram is input 2, but input 1 could also be used; the input must be configured for material selection using the relevant item on the Main menu. The electrical connections for using this method are shown in Figure 28. HYDRO-VIEW USER GUIDE D0022 REV 1.06 61 SENSOR CONNECTIONS – HYDRO-PROBE I • Figure 28 - Material selection using digital I/O A multiplexing method is used by the Hydro-View to determine the state of the two external switches SW1 and SW2 and thus to determine which material calibration table to use. These 'switches' may of course be 'outputs' from a control system; however, they must be of the 'voltage-free' type for the scheme to operate correctly. The diagram above shows the internal excitation supply being used, but an equivalent arrangement for external excitation is possible. The multiplexing sequence performed by the Hydro-View is as follows... ⇒ Close relay output on terminal 20 and open relay on terminal 21. ⇒ Read state of SW1 on terminal 15. ⇒ Open relay on terminal 20 and close relay on terminal 21. ⇒ Read state of SW2 on terminal 15. ⇒ Repeat from beginning as required. The Hydro-View requires that the state of switches SW1 and SW2 remain stable for two multiplexing cycles before it updates its internal values. To avoid excessive wear on the Hydro-View relay contacts, this process takes about 5 seconds to complete and thus the external control system should allow sufficient time for any changes of material to be propagated to the Hydro-View. The material table number corresponding to the states of switches SW1 and SW2 is given by... 62 SW2 SW1 Material table Open Open 1 Open Closed 2 Closed Open 3 Closed Closed 4 HYDRO-VIEW USER GUIDE D0022 REV 1.06 INSTALLATION Protection from lightning strikes You should give some consideration to protecting the Hydronix installation from damage due to lightning and similar electrical disturbances. Many installations of Hydronix equipment will be into situations which are particularly prone to damage by lightning, for example… Tropical regions. Outdoor installations. Long cable runs between the sensor and instrumentation. Tall, electrically conductive constructions (e.g. aggregate bins). High value computer equipment connected. Although the Hydro-View model HV02 is fitted with opto-isolation on the sensor input, these will not prevent damage in all cases. Precautions should still be taken to avoid damage by lightning in areas where there is a known risk. We would recommend the installation of suitable lightning barriers to all conductors in the sensor extension cable. Ideally, these would be fitted at both ends of this cable to protect both the moisture sensor and the Hydro-View (and equipment connected to the HydroView). Please consult your Hydronix distributor for further information regarding lightning protection on our equipment. HYDRO-VIEW USER GUIDE D0022 REV 1.06 63 TROUBLESHOOTING Troubleshooting Factory test display The Hydro-View includes a factory test display page to assist in troubleshooting if problems are suspected with the Hydro-View itself. This requires a special access code see Access codes (p79) and once selected, it is necessary to remove power from the Hydro-View to restore normal operation. Since this function exercises the inputs and outputs of the Hydro-View, it is not recommended that this be used when the Hydro-View is connected to the plant. The test page performs the following operations… Displays the voltage at the sensor input. Cycles the voltage/current on the analogue output between 0, 50% and full scale. Operates each output relay in turn. Performs an external loop-back test on the serial port. You must connect transmit data to receive data to see this. Displays the state of the digital inputs. To use the factory test display... 1. Remove power to the Hydro View. 2. Disconnect all wires connected the Hydro View terminals after first noting their positions. 3. Connect jumpers in the positions shown in Figure 29. If you wish to test the RS232 port, you will need to use a RJ11 to 9-pin D-type connecting cable, available from Hydronix. 4. Re-apply power and enter pass code given in Access codes (p79). 5. Select menu option Factory Test. If the Hydro-View is working correctly the following actions will take place on the display... Analogue output voltage (OUT) will cycle between 0, 5 and 10V. Sensor input voltage (IN) will cycle between 0, 5 and 10V at the same time as the output voltage due to the feedback wiring. Output relays (out) 1, 2 and 3 will cycle in a binary sequence... 3 0 0 0 0 1 1 1 1 0 etc. 64 2 0 0 1 1 0 0 1 1 0 1 0 1 0 1 0 1 0 1 0 Digital input signals (in) 1 and 2 are connected back to relays 1 and 2 and will therefore follow the pattern above. Battery (Batt) will display 1 if the internal Lithium battery is healthy, otherwise it will display 0. HYDRO-VIEW USER GUIDE D0022 REV 1.06 INSTALLATION Key will display the name of the relevant key when pressed. RS232 (232) will scroll ‘’The quick brown fox jumps over the lazy dog‘’ Contact your distributor for further details if any of the above fail to operate correctly. 1 2 3 4 5 6 7 8 9 10 11 12 13 14 15 16 17 18 19 20 21 RS232 Port RJ 11 conector • 2 3 9 pin D type connector Figure 29 - Factory loop-back test wiring Installation problems The table below lists some symptoms that may be encountered during installation of the Hydro-View. If you are unable to solve the problem please contact your Hydronix distributor. Symptom Probable cause Remedy Blank display Display contrast set incorrectly. Adjust contrast. See Display contrast adjustment (p21). No mains power. Check mains supply and IEC inlet fuse. If fuse blows repeatedly contact your supplier. Check internal fuse FS1 and replace if required (see Figure 23 (p59)). See also Sensor installation faults overleaf. Sensor readings do not change. No sensor power supply. Incorrectly wired cable Bad sensor location. HYDRO-VIEW USER GUIDE D0022 REV 1.06 65 SENSOR INSTALLATION FAULTS Symptom Probable cause Remedy Cannot see required menu item. Unable to enter calibration values. Access code not entered. Enter the access code for the required facility. Incorrect order of moisture value. No analogue output. Fuse blown Analogue output does not change Digital inputs do not operate Output set-up is set for Calibrate variable No input excitation power. Relay outputs do not operate Incorrect settings Fuse blown. Moisture % 2 must be greater than Moisture % 1 in calibration screen. Difference must be >1%. Check internal fuse FS2 and replace if necessary. Check wiring for analogue output and digital inputs which share a common power supply. Go to Output set-up and select relevant output variable. If using external 24V power source, check common connection at terminal 16. If using internal source, check that you have linked terminal 16 to 17. Check internal fuse FS2 and replace if necessary. Check alarm and set-point settings. Check internal fuse FS3 and replace if necessary. Check external wiring. Replace plug-in relay. Check that the serial port has been enabled for the purpose you require. If using RS485, verify that the optional RS485 module is installed. No serial communications Contacts welded. Incorrect configuration Sensor installation faults The moisture display reading being excessively low, or excessively high, or not changing at all would normally suggest a fault. This may be caused by... faulty interconnecting wiring – most common error blown DC fuse in Hydro-View sensor in wrong position faulty sensor faulty Hydro-View The following steps should help to locate the fault. 1. Carefully check the wiring to the sensor in accordance with the information given in Figure 21 (p58). Take particular care with the cross-over between pins 2 and 3 of the Bulgin connector and terminals 2 and 3 at the Hydro-View. Also ensure that the two ground connections at pin 3 of the Bulgin are made correctly and that stray wire strands from the cable shield are not shorting to other pins within the Bulgin connector. 2. Disconnect the sensor from the Hydro-View by unplugging the terminal block. Use a voltmeter to check the sensor power supply voltages at terminals 1-2 (+14.5 to +15.5Vdc) and 3-2 (-14.5 to -15.5Vdc) at the rear of Hydro-View. If this test fails, the 66 HYDRO-VIEW USER GUIDE D0022 REV 1.06 INSTALLATION fault is in the Hydro-View and may be a blown fuse – check FS1 and replace if required (see Figure 23 (p59)). Later revisions of the HV02 are fitted with re-settable fuses, so remove power for about 30 seconds and try again. 3. Disconnect the sensor at the 6-pin Bulgin connector. Replace the terminal block on the Hydro-View and repeat the measurements in 2 above. A change in the indicated measurements suggests there is a fault in the extension cable wiring. When using Hydro-Probe II or Hydro-Mix II sensors the -15Vdc power supply rail is unused but this voltage should still be checked if the wiring is present. 4. Now reconnect the sensor, and repeat the measurements in 2. You may find that the voltages reduce slightly. On older Hydro-View units (model HV01), the voltage across terminals 3-2 will drop significantly but should still be in the range -5 to -15.5V. If this test fails there may still be a fault in the extension cable wiring, but also possibly a fault either internal to the sensor or in the short length of cable connecting to the sensor. 5. Verify that the power supply voltages for the sensor are present at the sensor end. To do this you will need to unscrew the Bulgin connector (on the extension cable side) so that you can measure voltages with the sensor connected. Measure this time across pins 1-3 (+12V to +15.5V) and 2-3 (-5V to -15.5V). 6. Check that the sensor output signal can be measured between pin 4 and 3 (at the Bulgin connector) and terminals 4 and 5 at the Hydro-View. The signal should change according to the moisture content (see below). To do this test it may be necessary to remove the sensor from its installed location. 7. Check that the signal voltage measured across terminals 4 and 5 on the rear of Hydro-View is the same as the displayed voltage shown on the “Sensor Diagnostics” display (mV). Differences of more than 100mV (measured on an appropriate meter range) suggest a fault within the Hydro-View itself. Sensor characteristics The sensor output signal is a DC voltage that varies inversely (and in a non-linear manner) with the moisture of the material being measured. The approximate response of a sensor is as indicated in the table below. Condition Approx. Sensor Volts DC Sensor in open air 10.0 ∏ 12.0 Very dry sand (0.0 ∏ 2.0%) 10.0 ∏ 8.0 Medium wet sand (4.0 ∏ 8.0%) 6.0 ∏ 4.0 Very wet sand (12.0 ∏ 16.0%) 3.0 ∏ 1.0 Two simple tests may be performed to check whether the sensor is working correctly... 1. Pressing the palm of your hand very firmly on the ceramic faceplate of the sensor will simulate the condition of very wet sand. Therefore, first check the open-air voltage and then press your hand against the sensor, which should reduce the voltage to approximately around 2 volts. 2. A more precise test (for Hydro-Probe sensors only) uses two test blocks that may be purchased for this purpose as indicated in Figure 30 below. This is an approximate test, so providing that the sensor output voltage is within 1 volt of the voltage marked on the block, then the sensor may be deemed to be operating satisfactorily. Block 1 simulates dry material. Block 2 has two faces - with the black rubber face uppermost it HYDRO-VIEW USER GUIDE D0022 REV 1.06 67 SENSOR INSTALLATION FAULTS simulates a medium wet material and with the black rubber face in contact with the ceramic plate simulates a very wet material. 8.9v Block 1 5.0v Block 2 (Rubber Face Up) 1.7v Block 3 (Rubber Face Down) • Figure 30 : Using test blocks 68 HYDRO-VIEW USER GUIDE D0022 REV 1.06 INSTALLATION Notes HYDRO-VIEW USER GUIDE D0022 REV 1.06 69 Using Hydro-View serial ports RS232 serial port The RS232 connection is via a 6-way RJ11 style plug. Hydronix can supply a standard 2m lead terminated in a 9-pin female D-type for connection to a IBM-PC compatible communication (COM) port - please ask for details. • Figure 31 - RS232 serial port RJ11 Pin Signal (relative to Hydro-View) PC-compatible 9-way 1 Request to send (biassed internally to active state) 8 2 Transmit data 2 3 0V 5 4 0V 5 Receive data 3 Note: to ensure that the system meets the requirements of EMC directive 89/336/EEC the cable should be fitted with a ferrite rf attenuator close to the RS232 socket of the Hydro-View when the serial port is in use. HYDRO-VIEW USER GUIDE D0022 REV 1.06 71 RS485 SERIAL PORT RS485 serial port The RS485 serial port provides an optically-isolated twisted-pair interface between multiple Hydro-View units and a host computer or master Hydro-View. Installation of RS485 module The RS485 interface is supplied on a plug-in module which must be inserted into the Hydro-View unit unless this was installed as a factory option… ⇒ Remove the screws securing the lid of the Hydro-View. ⇒ Lift the lid off the unit to expose the circuit board. ⇒ Locate the RS485 module connector on the circuit board as shown in Figure 23 on page 59. ⇒ Plug the module into this connector - only one orientation is possible. ⇒ Refit the lid and screws. RS485 connections The Hydro-View implements RS485 using a two wire interface. This is shown in Figure 32. • Figure 32 - RS485 interface Shielded twisted-pair cable is recommended for EMC purposes. The shield should be connected to ground at one end only to minimise capacitive coupling (the twisted pair cable will minimise magnetic coupling). RS485 termination Note that the twisted pair cable should be terminated at each end in a resistor equivalent to the characteristic impedance of the cable used - typically 100R/0.5W These are indicated by Rt in Figure 32. The RS485 module (shown in Figure 33) contains a termination resistor which may be placed in circuit by inserting jumper J3 on the relevant module(s). This should be done for those units at each end of the twisted pair. 72 HYDRO-VIEW USER GUIDE D0022 REV 1.06 USING HYDRO-VIEW SERIAL PORTS J1-J3 termination jumpers • Figure 33 - RS485 module circuit board The RS485 module also includes RS485 line bias resistors to bias an un-driven line to a known condition. ONE module only in a system should have these enabled by inserting jumpers J1 and J2 - normally this would be done on the unit configured as a MASTER station. The RS485 module is supplied with J1, J2 and J3 installed by default. Data log mode The Hydro-View provides a continuous stream of data output on the relevant port which may be captured by an external device. This data stream is in ASCII format and contains the NOW and AVERAGE moisture values according to the programmed data log rate. The data format used is as follows... <STX>NNN.NN,AAA.AA<CRLF> where... <STX> NNN.NN AAA.AA <CRLF> is the ASCII start of text character (hex 02). is the NOW moisture value in the range -99.99 to 99.99%. is the AVERAGE moisture value in the range 99.99 to 99.99%. is the ASCII carriage return - line feed combination (hex 0D, hex 0A). The data rate/format used is 9600 baud, 8 data bits, no parity, 1 stop bit. This cannot be altered. The data logging format changes when the unit is configured as a Master on the other serial port. The data stream is again in ASCII format and contains the GROUP moisture values updated according to the programmed data log rate. The data format used is as follows... <STX>MMM.MM,NNN.NN,AAA.AA<CRLF> where... <STX> MMM.MM NNN.NN is the ASCII start of text character (hex 02). is the group M1 value in the ranger -99.99 to 99.99%. is the group M2 value in the range -99.99 to 99.99%. HYDRO-VIEW USER GUIDE D0022 REV 1.06 73 BATCH PRINT MODE AAA.AA <CRLF> is the group average moisture value in the range -99.99 to 99.99%. is the ASCII carriage return - line feed combination (hex 0D, hex 0A). Batch print mode The Hydro-View provides a report at the end of a batch (as determined by the state of the average/hold input) on the relevant port which may be printed or captured by an external device. This data stream is in ASCII format and contains the NOW and AVERAGE moisture values updated once per second. The data format used is as follows... Now = NNN.NN%, Avg = AAA.AA%<CRLF> where... NNN.NN AAA.AA <CRLF> is the NOW moisture value in the range -99.99 to 99.99%. is the AVERAGE moisture value in the range 99.99 to 99.99%. is the ASCII carriage return - line feed combination (hex 0D, hex 0A). The data rate/format used is 9600 baud, 8 data bits, no parity, 1 stop bit. This cannot be altered. The batch print format changes when the unit is configured as a Master on the other serial port. The Hydro-View provides a report at the end of a batch as determined by the state of the average/hold inputs across all units involved in the group. The data format used is as follows... M1 = MMM.MM%, M2 = NNN.NN%, Avg = AAA.AA%<CRLF> where... MMM.MM NNN.NN AAA.AA <CRLF> 74 is the group M1 value in the range -99.99 to 99.99%. is the group M2 value in the range -99.99 to 99.99%. is the AVERAGE moisture value in the range -99.99 to 99.99%. is the ASCII carriage return - line feed combination (hex 0D, hex 0A). HYDRO-VIEW USER GUIDE D0022 REV 1.06 USING HYDRO-VIEW SERIAL PORTS ASCII Hex mode The ASCII-Hex mode uses a communications protocol which is designed to be simple to implement and test whilst allowing a reasonable degree of performance to be achieved. It should be possible to implement a suitable driver from most high level languages such as ‘C’ or BASIC running on standard PC-compatibles or even BASIC modules in programmable controllers whilst ‘trials’ can be performed from standard communications programs such as Microsoft Windows ‘Terminal’, Hayes ‘Smartcom’ etc. Driver code for such applications is beyond the scope of this manual. Scope Using ASCII-Hex protocol you can perform tasks via the Hydro-View serial port such as... Read instantaneous (NOW) moisture value. Read average moisture value. Read set-point output status flags. Read average/hold status. Read level input status. Set current material number. The Hydro-View communications port acts as a SLAVE device when running the ASCIIHex protocol i.e. it will transmit data only in response to requests from your external device. Future issues of the Hydro-View system firmware will support additional operations via the serial port and these will be documented in updates to engineering note EN0005 and later incorporated into this manual. Physical connection The ASCII-Hex protocol can be used on either the RS232 port which is fitted as standard to all Hydro-View units or on the optional RS485 port which may be fitted as an optional extra. Line signalling information The ASCII-Hex protocol operates only at 9600 baud, using 8 data bits, 1 stop bit and no parity. Basic frame format Data frames on the communications link are constructed as indicated in the table below. Field STX STATION Format 02 Two ASCII-Hex characters Description Start of frame. Represents the station number of the relevant Hydro-View. Valid slave station numbers are in the range 01-7F (1-127 decimal). Reply frames from slave stations have the top bit of the station number set and thus reply station number fields are in the range 81-FF. The purpose of this mechanism is to allow discrimination between request and reply data frames over a two-wire RS485 link. HYDRO-VIEW USER GUIDE D0022 REV 1.06 75 ASCII HEX MODE Field REQUEST Format Two ASCII-Hex characters DATA Two ASCII-Hex characters per byte of data CHECKSUM Two ASCII-Hex characters 03 ETX Description Two ASCII Hex characters representing a request to be processed. Valid request codes are in the range 01-FF, but only certain commands will be recognised by the Hydro-View - see below. As required by the COMMAND field. Data entities larger than one byte are transmitted low-byte first in keeping with the order used by Intel family processors (such as those in the IBM-PC) which allows data to be streamed directly into a ‘C’ data structure (for example) without re-ordering of data. Motorola family processors will need to assemble the data bytes accordingly for both transmission and reception. Byte-wise exclusive-OR (XOR) of all characters from the station number to the end of data inclusive. End of frame. Frame types The master device issues request frames. These frames either solicit data from the slave or send information to the slave for it to process, or a combination of both. The slave can respond to a request in one of four ways... It processes the request and issues an acknowledge frame back to the master. It processes the request and issues a reply frame back to the master containing some data. It does not process the request because the request was invalid although not corrupted. An acknowledge frame is then sent containing an error code. It does nothing. In this case, the slave may have detected an error (usually corruption) but cannot reply because to do so may result in further errors. An example of this may be a faulty checksum in the request - the slave cannot reply here since it would not be certain that the station number itself had not been corrupted. In this case the slave will ignore the faulty frame and attempt to synchronise to the next STX character. Request frame format Issued by the master station. Format as per table in Basic Frame Format above. Acknowledge frame format Issued by slave stations. The station number has the top bit set as described in Basic Frame Format above. The request field is returned unaltered. The data field is a single byte (two hex digits) code from the following table... 76 Code 00 Mnemonic OK 01 BAD_REQUEST HYDRO-VIEW USER GUIDE D0022 REV 1.06 Description The request frame was received and processed without error. The request field of the request frame was not understood by the slave. This may mean that the version number of the firmware running in the slave is out of date. USING HYDRO-VIEW SERIAL PORTS Code 02 Mnemonic BAD_DATA 03 BAD_LENGTH Description The data field contained data which was out of range for the specific request. The frame length was incorrect for the request. This would normally mean that you have supplied either too little or too much data. Additional acknowledge codes may be added in future versions. Reply frame format Issued by slave stations. The station number has the top bit set as described in Basic Frame Format above. The request field is returned unaltered. The data field is a series of single bytes (two hex digits) code according to the request frame being processed. Request frame types (‘command set’) The different types of request which a slave will respond to are given below in terms of the request code (hexadecimal), request data field and reply frame description. Read Moisture - request code 01 This will return the current moisture values from the slave together with some status flags. Request data Material number Format HH Description Two hex digits (one byte) representing the material number to use in the range allowed by the Hydro-View (currently decimal 1-10). If this field is set to 00, then the material number in the slave will not be changed. The slave will not allow its material number to be changed unless it is configured appropriately. Reply data Now value Format HHHH Average value HHHH Control flags HH Description Four hex digits (two bytes, LSB first) representing the instantaneous (NOW) moisture % in the slave. The data transmitted is in 0.01% units. Four hex digits (two bytes, LSB first) representing the batch AVERAGE moisture % in the slave. The data transmitted is in 0.01% units. Two hex digits (one byte) representing some status flags as follows... Bit Description 0-3 Represent the state of the batch average/hold function. This is coded numerically as follows... 0 - Hold state 1 - Timing (Average/hold delay) 2 - Averaging 3 - Low material level 4-F - currently undefined. 4 Set-point 1 status 5 Set-point 2 status 6 Material low level (if configured) 7 Alarm output on. HYDRO-VIEW USER GUIDE D0022 REV 1.06 77 ASCII HEX MODE This is currently the only request frame type supported but meets most application requirements. Additional facilities will be added at a later date. Timing constraints The ASCII-hex protocol requires a communications link of reasonable performance in particular... A slave station will time out if the request frame does not complete within a period of 0.2 seconds following receipt of the STX character. The slave will normally respond within 0.1 seconds of the request frame being received. An upper limit on slave response time is set at 1 second, after which the slave will not begin a transmission. This figure is important to know for multi-drop systems (i.e. either 2 or 4 wire RS485) to prevent subsequent transmissions from being ‘jammed’ by a late slave reply. ASCII Hex protocol examples Read Moisture request The following request frame will read the moisture data from station number 3, setting the material number to 5 in the process. ASCII Character code (in hex) 02 30 33 30 31 30 35 30 37 03 Description STX Station number 03 Request code 01 - read moisture Material number 05 Checksum 07 ETX A typical response to this frame might be... ASCII Character code (in hex) 02 38 33 30 31 41 33 30 32 37 31 30 32 31 31 37 45 03 78 HYDRO-VIEW USER GUIDE D0022 REV 1.06 Description STX Station number 83 (slave reply sets the top bit!) Request code 01 - read moisture NOW value in hexadecimal is 02A3. Converting this to decimal gives 675 or 6.75%. AVERAGE value in hexadecimal is 0271. Converting this to decimal gives 625 or 6.25%. Status flags indicating... Unit is in average/hold delay period. Set-point 1 is ON, Set-point 2 is OFF Material level is OK Alarm output is OFF Checksum 7E ETX Appendix Access codes The Hydro-View supports several levels of operator access, each protected by an appropriate code which is entered at the Access code option in the Main menu. Facilities enabled by entering an access code will remain active until a new code is entered. The access codes are fixed in current models of Hydro-View. For security reasons, you are advised to remove this page from the manual if necessary to prevent unauthorised access to the Hydro-View parameters. Access code 0 (default) 190 213 336 1459 Facilities View main displays and adjust set-point ranges. View diagnostic displays and calibrate sensor Engineering level other than communications related parameters. Full engineering access. Reset factory defaults and display factory test page. Electromagnetic Compatibility Directive - 89/336/EEC When installed and operated according to the instructions given in this guide, this equipment conforms to the requirements of Council Directive 89/336/EEC according to the following schedule… Equipment type: Manufacturer: Conformity criteria: Hydro-View interface unit model number: HV02 Hydronix Ltd. 70, Smithbrook Kilns, Cranleigh, Surrey, England Conducted emissions: EN55011:1991 Group 1 Class A Radiated emissions: EN55011:1991 Group 1 Class A Radiated immunity: prEN50082-2:1992 Electrostatic discharge: prEN50082-2:1992 Fast transient/burst immunity: prEN50082-2:1992 HYDRO-VIEW USER GUIDE D0022 REV 1.06 79 ELECTROMAGNETIC COMPATIBILITY DIRECTIVE - 89/336/EEC Notes 80 HYDRO-VIEW USER GUIDE D0022 REV 1.06 INDEX Index Access code.................................................. 31 Alarm ............................................................ 33 Analogue output ...................................... 33, 59 Application batch mixing.............................................. 16 batch weighing .......................................... 11 continuous process ................................... 18 ASCII Hex protocol ..................................................... 75 Average/hold................................................. 11 Batch mixing dribble-feed system................................... 16 one-shot system........................................ 16 Batch print..................................................... 74 Calibration......................................... 12, 31, 43 entering results ......................................... 46 Checks .......................................................... 66 Clipping ......................................................... 25 Communications diagnostic.................................................. 36 Connections .................................................. 56 Conveyor belt ................................................ 18 Data log................................................... 35, 73 Default settings ............................................. 37 Display contrast adjustment................................... 21 Fault-finding .................................................. 64 Filtering ................................................... 17, 25 Front panel.................................................... 21 Fuse FS1 ........................................................... 58 FS2 ........................................................... 61 FS3 ........................................................... 61 Gate signal.................................................... 11 Grouping channels ........................................ 12 Groups .......................................................... 49 Help .............................................................. 24 key ............................................................ 21 Hydro-Mix...................................................... 16 Hydro-Probe.................................................. 11 Hydro-Skid .................................................... 18 Inputs digital ................................................... 36, 60 Installation ..................................................... 55 Keypad .......................................................... 21 Language ................................................ 31, 37 Lightning protection barriers...................................... 63 Main menu..................................................... 24 Material in use................................................... 25, 29 selection .................................................... 61 selection mode .......................................... 34 Moisture average ..................................................... 23 Average ..................................................... 11 display ....................................................... 22 group values .............................................. 23 max/min..................................................... 23 now............................................................12 Now ........................................................... 23 Power supply ................................................. 55 Relays ........................................................... 61 RS232 ..................................................... 35, 71 RS485 ..................................................... 35, 72 station number........................................... 35 watch ......................................................... 35 Samples ........................................................ 43 Select key...................................................... 21 Sensor connections ............................................... 58 diagnostic .................................................. 34 position .......................................... 12, 17, 18 set-up menu .............................................. 32 Set-point .................................................. 25, 28 Soft key ......................................................... 22 SSD ............................................................... 32 Storage bins .................................................. 12 Trend display........................................... 12, 25 Troubleshooting............................................. 64 Unscaled input............................................... 32 Water valve control .............................................. 28 Weight correction........................................... 12 HYDRO-VIEW USER GUIDE D0022 REV 1.06 81 Notes 82 HYDRO-VIEW USER GUIDE D0022 REV 1.06