1
The Fluksometer Manual
Deploying, Troubleshooting, Hacking
Bart Van Der Meerssche
December 2011
ii
Contents
Preface
1 Introduction
1.1 Ports . . . . . . . . . .
1.1.1 Screw Terminal
1.1.2 Ethernet . . . .
1.1.3 Power Jack . .
1.2 Pushbutton . . . . . .
1.3 LEDs . . . . . . . . .
v
.
.
.
.
.
.
.
.
.
.
.
.
.
.
.
.
.
.
.
.
.
.
.
.
.
.
.
.
.
.
.
.
.
.
.
.
.
.
.
.
.
.
.
.
.
.
.
.
.
.
.
.
.
.
.
.
.
.
.
.
.
.
.
.
.
.
.
.
.
.
.
.
.
.
.
.
.
.
.
.
.
.
.
.
.
.
.
.
.
.
.
.
.
.
.
.
.
.
.
.
.
.
.
.
.
.
.
.
.
.
.
.
.
.
1
1
1
1
1
2
2
2 Deploying
2.1 Networking . . . . . . . . . . . .
2.1.1 Wifi Mode . . . . . . . . .
2.1.2 Ethernet Mode . . . . . .
2.2 Configuring Sensors . . . . . . .
2.2.1 Status . . . . . . . . . . .
2.2.2 Services . . . . . . . . . .
2.2.3 Current Clamp Setup . .
2.2.4 Sensors . . . . . . . . . .
2.3 Securing the Fluksometer . . . .
2.4 Attaching Current Clamps . . . .
2.5 Connecting Sensor Clamp Cables
2.6 Powering Up . . . . . . . . . . .
2.7 Registering . . . . . . . . . . . .
2.8 Congratulations . . . . . . . . . .
.
.
.
.
.
.
.
.
.
.
.
.
.
.
.
.
.
.
.
.
.
.
.
.
.
.
.
.
.
.
.
.
.
.
.
.
.
.
.
.
.
.
.
.
.
.
.
.
.
.
.
.
.
.
.
.
.
.
.
.
.
.
.
.
.
.
.
.
.
.
.
.
.
.
.
.
.
.
.
.
.
.
.
.
.
.
.
.
.
.
.
.
.
.
.
.
.
.
.
.
.
.
.
.
.
.
.
.
.
.
.
.
.
.
.
.
.
.
.
.
.
.
.
.
.
.
.
.
.
.
.
.
.
.
.
.
.
.
.
.
.
.
.
.
.
.
.
.
.
.
.
.
.
.
.
.
.
.
.
.
.
.
.
.
.
.
.
.
.
.
.
.
.
.
.
.
.
.
.
.
.
.
.
.
.
.
.
.
.
.
.
.
.
.
.
.
.
.
.
.
.
.
.
.
.
.
.
.
.
.
.
.
.
.
.
.
.
.
.
.
.
.
.
.
.
.
.
.
.
.
.
.
.
.
.
.
.
.
.
.
.
.
.
.
.
.
.
.
.
.
.
.
3
3
3
3
4
4
5
5
5
6
6
6
6
7
7
3 Accessing
3.1 Version . . . . . . . . . . . . . .
3.2 Token . . . . . . . . . . . . . . .
3.3 Data Types . . . . . . . . . . . .
3.4 Retrieving sensor time series data
3.5 Retrieving sensor parameters . .
3.6 Retrieving real-time sensor data .
.
.
.
.
.
.
.
.
.
.
.
.
.
.
.
.
.
.
.
.
.
.
.
.
.
.
.
.
.
.
.
.
.
.
.
.
.
.
.
.
.
.
.
.
.
.
.
.
.
.
.
.
.
.
.
.
.
.
.
.
.
.
.
.
.
.
.
.
.
.
.
.
.
.
.
.
.
.
.
.
.
.
.
.
.
.
.
.
.
.
.
.
.
.
.
.
.
.
.
.
.
.
.
.
.
.
.
.
9
9
9
10
10
12
12
.
.
.
.
.
.
.
.
.
.
.
.
.
.
.
.
.
.
.
.
.
.
.
.
.
.
.
.
.
.
iii
iv
CONTENTS
Preface
This version of the Fluksometer Manual is based on commit 3009d840bbb7bd6a
of the Flukso Git repository.
v
vi
PREFACE
Chapter 1
Introduction
Let’s kick off this manual with a short tour of a Fluksometer’s externals. We
will introduce each of the Fluksometer’s ports, buttons and LEDs.
1.1
Ports
1.1.1
Screw Terminal
The screw terminal contains twelve inputs. A port on the screw terminal is
defined as a pair of adjacent inputs. We have printed the port numbers on the
side of the enclosure for easy reference, with the polarity denoted by + and -.
Ports 1 to 3 are analog ports that are tuned to accept Flukso split-core current
clamps. Ports 4 and 5 can be used for detecting pulses. This includes support
for, but is not limited to, the S0 interface1 common to DIN-rail energy meters.
Finally, port 6 offers a half-duplex RS-485 serial interface. Contrary to the other
ports, the RS-485 port has its polarity indicated by the letters a and b.
1.1.2
Ethernet
The ethernet port offers support for a 10baseT/100baseTx interface with autonegotiation and auto MDI/MDI-X crossover detection.
1.1.3
Power Jack
The center-positive power jack accepts a DC voltage between 9V and 15V. The
switching adapter should have a minimum rating of 500mA output current.
1 S0
is an open-collector interface standardized in DIN EN 62053-31
1
2
1.2
CHAPTER 1. INTRODUCTION
Pushbutton
The pushbutton has a dual function. Which function will be triggered depends
on how long the button is pressed.
Toggle reporting mode If you press the button for 2 to 5 seconds, the Fluksometer will toggle its reporting mode to the Flukso server from wifi to
ethernet or vice-versa.
Restore defaults If you press the button between 10 and 30 seconds, the
Fluksometer will restore its default network settings.
1.3
LEDs
The Fluksometer has five red LEDs on the top of its enclosure. Together these
LEDs provide us with an overview of the Fluksometer’s internal functioning, the
status of its network interfaces and its ability to communicate with the Flukso
server. From left to right, these LEDs are:
Wifi If the wifi interface is enabled, the wifi LED will blink. A fast blink
rate [approx. twice per second] signals that no wifi connection can be
established. A slow blink rate [once every three seconds] signifies that a
wifi connection has been successfully set up.
Ethernet The ethernet LED will be on when an ethernet link is established.
This can either be a 10baseT or 100baseTX link in full- or half-duplex
mode.
Globe After the Fluksometer has finished its boot sequence, the globe LED will
be on when it can access the Flukso server. Every time the Fluksometer
reports to the Flukso server, the LED will blink in case of a successful
call. The globe LED will be turned off when the call is not completed
successfully. A successful call has been made when either a 200 or 204
HTTP response code is returned by the Flukso server.
Heartbeat The heartbeat LED is positioned right next to the globe led. While
the globe LED informs us about the status of the Fluksometer’s external
communication, the heartbeat LED allows us to monitor the Fluksometer’s internal functioning. This LED will be on when the sensor board
is running its firmware. From the moment the Flukso daemon is started
during the boot sequence, it will start polling the sensor board every second for data. Each poll triggers a blink of this LED, thus mimicking a real
heartbeat. Hence, a ’heartbeat’ is an indication of a Fluksometer that has
booted, a running Flukso daemon, a sensor board running its firmware
and proper communication between the main board and sensor board.
Power The power LED is directly connected to the internal 3.3V supply. A
burning LED indicates that power has been applied to the device and the
internal voltage regulators are working properly.
Chapter 2
Deploying
This chapter will guide you through the installation steps that should lead to
your Fluksometer’s successful deployment. Please consult the troubleshooting
chapter if you experience any installation difficulties.
2.1
Networking
Out of the box, a Fluksometer will report to the Flukso server via the wifi
interface. Please refer to section 2.1.1 if you wish to use your Fluksometer in
this reporting mode. As detailed in section 1.2, the Fluksometer’s pushbutton
can be used to toggle the reporting mode to ethernet. The networking setup for
this case is described in section 2.1.2.
2.1.1
Wifi Mode
Power up your Fluksometer and wait until the heartbeat LED starts to blink.
Connect your computer to the Fluksometer’s ethernet port. Then surf to
192.168.255.1. Configure the wifi page with the proper name and security key
so that the Fluksometer gets connected with the internet via your local wifi network. After saving1 these settings, the globe LED on the Fluksometer should
light up. To further test your configuration, try surfing to www.flukso.net while
the ethernet cable is still connected to the Fluksometer.
2.1.2
Ethernet Mode
When the reporting mode is toggled to ethernet, the ethernet interface will
be set as a DHCP client. The wifi interface will be disabled. Connect the
Fluksometer’s ethernet port to your network and find out which IP address
1 While saving settings doesn’t take long, restarting the whole wifi and networking stack
with its dependencies can take more than a minute to complete. Be patient.
3
4
CHAPTER 2. DEPLOYING
Note 1
Art thou WAN or LAN?
The default settings listed on the network page will mostly work just
fine. Should this not be the case, it’s important to understand which
section on the network page applies to which interface. In wifi mode,
the Local Network or LAN section refers to the ethernet interface
while the Internet Connection or WAN section is associated with
the wifi interface. So if you want to assign a fixed IP address to the
wifi interface, then you should set the Protocol for the Internet Connection to manual and fill in the additional form fields. Conversely,
if you wish to change the IP settings on the ethernet interface, then
the Local Network section should be edited.
We understand this configuration aspect will be the cause of some
confusion. We however cannot apply the ethernet and wifi naming
to these sections directly since they are swapped when toggling the
Fluksometer into ethernet mode. The Internet Connection will in
this case refer to the ethernet interface and the Local Network to the
wifi interface.
it has been assigned by your DHCP server. Power up your Fluksometer and
wait until the heartbeat LED starts to blink. The globe LED should now be on.
Surf to the Fluksometer’s ethernet IP address. No further network configuration
steps should be required. In case you do need to change something, you should
read note 1 first.
2.2
Configuring Sensors
The sensor configuration will be synchronized with the Flukso server each time
you save the sensor page. A synchronization can only be successful when the
Fluksometer has internet connectivity. You should therefore make sure the
globe LED is lit before commencing this configuration step. If not, then goto
section 2.1.
2.2.1
Status
The status section lists a couple of parameters to help you verify that your
Fluksometer is configured and operating correctly.
System Time The Fluksometer’s system time is presented in UTC. If this
time setting is showing a Jan 1970 date, then your network firewall might
be blocking NTP’s UDP port 123.
Flukso server ping test When generating the sensor page, the Fluksometer
will try pinging the Flukso server and report the outcome. A failed ping
indicates a networking problem, so please consult section 2.1 before continuing the sensor configuration.
Last synchronisation time Saving this sensor page will trigger a synchroni-
2.2. CONFIGURING SENSORS
5
sation action with the sensor board and the Flukso server. This entry
shows last time a synchronisation attempt was made.
Last synchronisation status The last synchronisation status indicates the
last synchronisation attempt’s outcome.
2.2.2
Services
Your Fluksometer will by default be configured to report its measurements to
the Flukso server. Clear the checkbox if you want to stop all communication
with the Flukso server. Since no HTTP calls will be initiated to the server
anymore, the globe LED will be turned off.
The Fluksometer can make its sensor measurements available through a local
JSON/REST API as well. While the Flukso server allows you to analyze your
historical data and derive trend information, this local API is useful for monitoring your sensors in real-time. Sixty datapoints with a second resolution will be
made available via the local API. No historical data is stored on the Fluksometer
itself. Set the checkbox if you wish to enable the local API feature.
2.2.3
Current Clamp Setup
Select the number of phases that apply for your current clamp setup. When
selecting 3 phases, the three current clamp ports will be grouped and presented
as a single sensor #1. Sensors #2 and #3 will be disabled automatically after
saving. When selecting 1 phase, each clamp port will be sampled seperately and
mapped to sensors #1, #2 and #3 respectively.
2.2.4
Sensors
As already indicated in the previous section, a sensor is a logical entity that
can aggregate multiple physical screw terminal ports as defined in section 1.1.1.
Since the screw terminal contains a maximum of six ports, six sensors per Fluksometer will suffice. A sensor is defined by a unique identifier. Sensors can be
enabled or disabled individually. Leave sensors in a disabled state when not
in use. An enabled sensor requires a name. This name will be used in the
Flukso website’s charts. It’s important that you assign a distinct name for each
enabled sensor associated with your account. By convention, we use main for
total household electricity consumption and solar for photo-voltaic production.
When adding other users to your chart on the Flukso website, the main sensors
will be the ones on display. A sensor can only contain ports of the same class.
Ports that have different classes cannot be aggregated into a single sensor. We
now introduce each of the three classes in turn:
Analog Ports #1, #2 and #3 are analog ports. They accept Flukso splitcore current clamps of 50A, 100A, 250A and 500A. A three-phase setup
requires all current clamps to be identical. Besides the current range, you
can also specify the line voltage for each clamp. The default is 230V,
6
CHAPTER 2. DEPLOYING
which applies to the mains electricity voltage in most European countries.
Australia and New-Zealand have a 240V power grid. Please consult this
Wikipedia article if you are unsure about your country’s mains voltage.
Pulse Ports #4 and #5 on the screw terminal are pulse ports. They are
mapped to sensors #4 and #5 respectively. A meterconstant defines the
amount of flow represented by each pulse. For electricity, the unit is Wh
per pulse2 while water and gas are specified in liter per pulse. Fractional
meterconstants are allowed down to 0.001.
Uart The RS-485 port #6 is mapped to sensor #6. The baud rate is set to a
fixed 115200.
2.3
Securing the Fluksometer
Disconnect all cables from the Fluksometer. Now find a suitable location near
the fuse box to install the device. Mounting holes have been provisioned on the
back of the Fluksometer. Alternatively, you can use a plastic cable tie or velcro.
2.4
Attaching Current Clamps
For safety reasons, switch off the main electricity supply when installing the
current clamps. Attach a clamp to each non-neutral line in the fuse box. Close
the clamps firmly. You should hear a double click. The lip should lie flush with
the clamp’s body.
2.5
Connecting Sensor Clamp Cables
Connect a cable from each current clamp to the Fluksometer’s screw terminal.
Use the red wire for positive polarity and the black one for negative polarity.
2.6
Powering Up
Switch the main electricity supply back on. Activate the Fluksometer by inserting its power plug.
2 Most small energy meters define their meterconstant in imp/kWh. 1000, 2000 and 5000
imp/kWh values on the energy meter equal meterconstants of 1, 0.5 and 0.2 Wh/pulse on the
Fluksometer respectively.
2.7. REGISTERING
2.7
7
Registering
Vist www.flukso.net/user/register and fill in the form to create your account.
Once logged in, you can associate the Fluksometer with your account. Click
on the My account → Devices tab and submit the Fluksometer’s serial number.
You should now see this Fluksometer added to the device list.
Point your browser to www.flukso.net. A first reading should be visible on the
hour chart within five minutes from powering up.
2.8
Congratulations
You are now part of the Flukso community!
8
CHAPTER 2. DEPLOYING
Chapter 3
Accessing
Once the Fluksometer is operational, it will start collecting data on its configured ports. These measurements are sent to the Flukso server and stored in
a time series database. You can access the data in chart form via the Flukso
website. The same data is also made available in a machine-readable format via
the RESTful API.
3.1
Version
This chapter is a description of v1.0 of the Flukso API. Although only a single
version is currently in use, you are required to specify the version for each API
call. This will prevent any existing code from breaking when new, incompatible
versions of the API are introduced in the future.
You can include the versioning parameter either as part of the header (X-Version:
1.0) or as a query parameter (&version=1.0).
3.2
Token
The server will verify each time whether a correct token has been specified for
the requested resource. For extracting information, you can use two types of
tokens:
Sensor-level token A default token is generated for each sensor providing
full read access to the sensor resource. The database structure has been
conceived to support multiple tokens per sensor, each with different access restrictions. This functionality is however not currently activated.
It might be interesting when you want to make a subset of your sensor
data available to a third-party service for further processing. This would
allow you to revoke this specific token at any time without affecting other
services accessing the same sensor data.
9
10
CHAPTER 3. ACCESSING
Account-level token A token is also made available to each account, which
you can regard as an API key. This single token allows you to access data
of all devices and sensors associated with your account.
3.3
Data Types
unix time()
time range()
unit()
3.4
int32 representing the number of seconds elapsed since midnight UTC of Jan 1, 1970
minute, 15min, hour, day, week, month, year, decade, night
watt, kwhperyear, eurperyear, audperyear, lpermin, lperday,
m3peryear
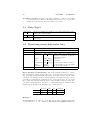
Retrieving sensor time series data
request
verb
url
query params
response
retrieve sensor data in time series format from flukso.net
GET
https://api.flukso.net/sensor/<sensorid>
interval
time range() time range for which values
should be returned, from now interval till now
start
unix time()
start time
end
unix time()
end time
resolution time range() format data in this resolution
unit
unit()
convert values to specified unit
callback
string()
jsonp function name
a JSON array containing [unix timestamp, value] array elements
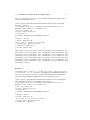
Query Parameter Compatibility The most straightforward way to extract
time series data from the platform is by use of the interval query parameter.
E.g. specifying interval=month will return one month worth of data in a day
resolution, the default resolution for this interval. A default resolution can be
overridden by including it explicitely in the query parameters. If you would
like to fully customize the interval, then you should instead use the start and,
optionally, end parameters. Below is a compatibility matrix detailing which
parameters are Required [R], Exclusive [X] or Optional [O].
interval
start
interval
R
X
start
X
R
end
X
O
resolution
O
O
Example 1
icarus75@cirrus:~$ curl -k -v -X GET -H "Accept: application/json"
-H "X-Version: 1.0" -H "X-Token: d8a8ab8893ea73f768b66b45234b5c3a"
3.4. RETRIEVING SENSOR TIME SERIES DATA
11
"https://api.flukso.net/sensor/c1411c6b4f9910bbbab09f145f8533b9?
interval=month&unit=watt"
> GET /sensor/c1411c6b4f9910bbbab09f145f8533b9?interval=month&
unit=watt HTTP/1.1
> User-Agent: curl/7.19.7 (i486-pc-linux-gnu) libcurl/7.19.7
OpenSSL/0.9.8k zlib/1.2.3.3 libidn/1.15
> Host: api.flukso.net
> Accept: application/json
> X-Version: 1.0
> X-Token: d8a8ab8893ea73f768b66b45234b5c3a
>
< HTTP/1.1 200 OK
< Server: nginx/0.7.64
< Date: Thu, 07 Jul 2011 10:34:35 GMT
< Content-Type: application/json
< Connection: keep-alive
< Content-Length: 494
<
[[1307664000,234],[1307750400,169],[1307836800,72],[1307923200,71],
[1308009600,103],[1308096000,263],[1308182400,176],[1308268800,165],
[1308355200,261],[1308441600,400],[1308528000,139],[1308614400,235],
[1308700800,151],[1308787200,141],[1308873600,113],[1308960000,301],
[1309046400,210],[1309132800,166],[1309219200,286],[1309305600,237],
[1309392000,241],[1309478400,148],[1309564800,125],[1309651200,187],
[1309737600,248],[1309824000,263],[1309910400,143],[1309996800,191],
[1310083200,"nan"]]
Example 2
icarus75@cirrus:~$ curl -k -v -X GET -H "Accept: application/json"
-H "X-Version: 1.0" -H "X-Token: d8a8ab8893ea73f768b66b45234b5c3a"
"https://api.flukso.net/sensor/c1411c6b4f9910bbbab09f145f8533b9?
start=1309478400&end=1309996800&resolution=day&unit=watt"
> GET /sensor/c1411c6b4f9910bbbab09f145f8533b9?start=1309478400&
end=1309996800&resolution=day&unit=watt HTTP/1.1
> User-Agent: curl/7.19.7 (i486-pc-linux-gnu) libcurl/7.19.7
OpenSSL/0.9.8k zlib/1.2.3.3 libidn/1.15
> Host: api.flukso.net
> Accept: application/json
> X-Version: 1.0
> X-Token: d8a8ab8893ea73f768b66b45234b5c3a
>
< HTTP/1.1 200 OK
< Server: nginx/0.7.64
< Date: Thu, 07 Jul 2011 12:45:02 GMT
< Content-Type: application/json
< Connection: keep-alive
12
CHAPTER 3. ACCESSING
< Content-Length: 122
<
[[1309564800,125],[1309651200,187],[1309737600,248],[1309824000,263],
[1309910400,143],[1309996800,191],[1310083200,"nan"]]
3.5
Retrieving sensor parameters
request
verb
url
query params
response
retrieve sensor parameters from flukso.net
GET
https://api.flukso.net/sensor/<sensorid>
param all return all sensor parameters
a JSON object containing containing all sensor parameters
Example
icarus75@cirrus:~$ curl -k -v -X GET -H "Accept: application/json"
"https://api.flukso.net/sensor/c1411c6b4f9910bbbab09f145f8533b9?
version=1.0&token=d8a8ab8893ea73f768b66b45234b5c3a¶m=all"
> GET /sensor/c1411c6b4f9910bbbab09f145f8533b9?version=1.0&
token=d8a8ab8893ea73f768b66b45234b5c3a¶m=all HTTP/1.1
> User-Agent: curl/7.19.7 (i486-pc-linux-gnu) libcurl/7.19.7
OpenSSL/0.9.8k zlib/1.2.3.3 libidn/1.15
> Host: api.flukso.net
> Accept: application/json
>
< HTTP/1.1 200 OK
< Server: nginx/0.7.64
< Date: Thu, 07 Jul 2011 13:28:18 GMT
< Content-Type: application/json
< Connection: keep-alive
< Content-Length: 183
<
{"access":1310045295,"type":"electricity","function":"main","class":
"pulse","voltage":null,"current":null,"phase":null,"constant":1.0,
"enabled":1,"lastupdate":[1310045295,1006793948]}
3.6
Retrieving real-time sensor data
request
verb
url
query params
response
retrieve real-time sensor data directly from the Fluksometer
GET
http://192.168.255.1:8080/sensor/<sensorid>
interval minute fixed interval
unit
watt
fixed unit
callback
string() jsonp function name
a JSON array containing [unix timestamp, value] array elements
3.6. RETRIEVING REAL-TIME SENSOR DATA
13
Example
icarus75@cirrus:~$ curl -v "http://192.168.255.1:8080/sensor/
c1411c6b4f9910bbbab09f145f8533b9?version=1.0&interval=minute&
unit=watt&callback=realtime"
> GET /sensor/c1411c6b4f9910bbbab09f145f8533b9?version=1.0&interval=
minute&unit=watt&callback=realtime HTTP/1.1
> User-Agent: curl/7.19.7 (i486-pc-linux-gnu) libcurl/7.19.7
OpenSSL/0.9.8k zlib/1.2.3.3 libidn/1.15
> Host: 192.168.255.1:8080
> Accept: */*
>
< HTTP/1.1 200 OK
< Connection: close
< Transfer-Encoding: chunked
< Content-Type: application/json
<
realtime([[1310047446,124],[1310047447,125],[1310047448,125],
[1310047449,125],[1310047450,125],[1310047451,125],[1310047452,125], ...
[1310047501,124],[1310047502,124],[1310047503,124],[1310047504,"nan"],
[1310047505,"nan"]])