1
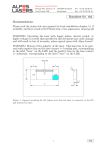
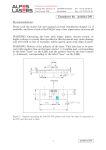
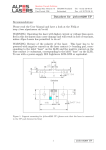
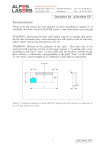
Quantum Cascade Solutions
Passage Max.-Meuron 1-3 CH-2000 Neuchˆatel
Case Postale 1766
Switzerland
Tel: +41 32 729 95 10
Fax: +41 32 721 36 19
Datasheet for #sb276 DN
Recommendations:
Please read the starter kit user manual (at least installation chapter 5), if
available, and have a look at the FAQ at http://www.alpeslasers.ch/alfaq.pdf
WARNING: Operating the laser with longer pulses, shorter period, or
higher voltage or current than specified in this document may cause damage
and will result in loss of warranty, unless agreed upon with Alpes Lasers!
WARNING: Beware of the polarity of the laser. This laser has to be powered with negative bias on the laser contact (= bonding pad, corresponding
to the label ”laser” on the LLH) and the positive bias on the base contact
(= submount, corresponding to the label ”base” on the LLH).
Emission
DN
UP
Figure 1: Support mounting for #sb276 DN (please note that the laser is connected to
the DN pad drawned in blue)
1
#sb276 DN
#sb276 DN
1.4
-30C
-15C
1.2
1
P [mW]
0.8
0.6
0.4
0.2
0
-0.2
1897
1897.5
1898
1898.5
1899
Frequency [cm-1]
1899.5
1900
Figure 2: Output power as a function of the singlemode emission frequencies and temperatures
#sb276 DN
9.5
-30C
-15C
Uldd [V]
9
8.5
8
7.5
1897
1897.5
1898
1898.5
1899
Frequency [cm-1]
1899.5
1900
Figure 3: DC voltage fed to LDD (Uldd) as a function of the singlemode emission frequencies and temperatures
2
#sb276 DN
λ[nm] ν[cm−1 ]
5264
1899.7
5264.1 1899.6
5264.3 1899.6
5270.1 1897.5
5270.3 1897.4
5270.4 1897.4
Temp[◦ C] ULDD [V]
-30
8
-30
8.5
-30
9
-15
8
-15
8.5
-15
9
P[mW]
0
0.4
1.2
0
0.1
0.6
Ipulse [A]
0.48
0.59
0.7
0.51
0.62
0.73
Table 1 : singlemode optical output power as function of operating parameters
#sb276 DN
6
5
Peak Voltage [V]
1.2
power (-30C )
voltage (-30C )
power (-15C )
voltage (-15C )
power (0C )
voltage (0C )
power (15C )
voltage (15C )
power (30C )
voltage (30C )
Max single mode power
1
0.8
4
0.6
3
0.4
2
0.2
1
0
0
0
0.1
0.2
0.3
0.4
0.5
0.6
Peak Current [A]
0.7
0.8
0.9
1
Light [mW] avg on power meter
7
-0.2
Figure 4: peak voltage and average power vs peak current at 2%dc (the solid squares
indicate the maximum singlemode emitted power)
3
#sb276 DN
#sb276 DN
6
5
Peak Voltage [V]
3.5
power (-30C )
voltage (-30C )
power (-15C )
voltage (-15C )
power (0C )
voltage (0C )
power (15C )
voltage (15C )
power (30C )
voltage (30C )
Max single mode power
3
2.5
2
4
1.5
3
1
2
0.5
1
0
Light [mW] avg on power meter
7
0
0
0.1
0.2
0.3
0.4
0.5
0.6
Peak Current [A]
0.7
0.8
0.9
1
-0.5
Figure 5: peak voltage and average power vs peak current at 2%dc (including the multimode region)
Note: data taken with 50ns pulses, 2.5µs period.
#sb276 DN
0.9
0.8
0.7
Peak Current [A]
1.2
power (-30C )
current (-30C )
power (-15C )
current (-15C )
power (0C )
current (0C )
power (15C )
current (15C )
power (30C )
current (30C )
Max single mode power
0.6
1
0.8
0.6
0.5
0.4
0.4
0.3
0.2
0.2
0
0.1
0
Light [mW] avg on power meter
1
0
2
4
6
DC Voltage fed to LDD [V]
8
-0.2
10
Figure 6: peak current and average power vs LDD voltage at 2%dc (the solid squares
indicate the maximum singlemode emitted power)
4
#sb276 DN
#sb276 DN
0.9
0.8
0.7
Peak Current [A]
3.5
power (-30C )
current (-30C )
power (-15C )
current (-15C )
power (0C )
current (0C )
power (15C )
current (15C )
power (30C )
current (30C )
Max single mode power
0.6
3
2.5
2
0.5
1.5
0.4
1
0.3
0.5
0.2
0
0.1
0
Light [mW] avg on power meter
1
0
2
4
6
DC Voltage fed to LDD [V]
8
-0.5
10
Figure 7: peak current and average power vs LDD voltage at 2%dc (including the multimode region)
Spectral density (normalized to 1)
8.5V
9.0V
30C
30C 9.5V
10.0V
8.5V
15C
9.5V
15C 9.0V
10.0V
0C 10.0V
8.5V
9.0V
0C
9.5V
8.0V
-30C 10.0V
8.5V
9.0V
9.5V
-30C
1.2
8.0V
8.5V
-15C
9.5V
-15C 9.0V
10.0V
#sb276 DN
1
0.8
0.6
0.4
0.2
0
-0.2
5230
5240
5250
5260 5270 5280
Wavelength [nm]
5290
5300
5310
Figure 8: spectra at -30C, -15C, 0C, 15C and 30C at 2%dc for various LDD voltages
5
#sb276 DN
#sb276 DN
Spectral density (normalized to 1)
-30C 9.5V
8.0V
-30C
8.5V
-30C
-30C 9.0V
10.0V
1.2
1
0.8
0.6
0.4
0.2
0
-0.2
5225
5230
5235
5240
5245 5250 5255
Wavelength [nm]
5260
5265
5270
Figure 9: spectra at -30C for various LDD voltages (modes around 5232 nm)
Spectral density (normalized to 1)
-30C 9.0V
-30C 8.0V
1.2
-30C 8.5V
#sb276 DN
1
0.8
0.6
0.4
0.2
0
-0.2
5262
5262.5
5263
5263.5 5264 5264.5
Wavelength [nm]
5265
5265.5
5266
Figure 10: spectra at -30C for various LDD voltages (monomode range)
6
#sb276 DN
#sb276 DN
Spectral density (normalized to 1)
-15C 9.5V
8.0V
8.5V
-15C
-15C
-15C 9.0V
10.0V
1.2
1
0.8
0.6
0.4
0.2
0
-0.2
5230
5240
5250
Wavelength [nm]
5260
5270
Figure 11: spectra at -15C for various LDD voltages (modes around 5231 nm)
Spectral density (normalized to 1)
-15C 8.5V
8.0V
1.2
-15C 9.0V
#sb276 DN
1
0.8
0.6
0.4
0.2
0
-0.2
5268
5269
5270
5271
Wavelength [nm]
5272
5273
Figure 12: spectra at -15C for various LDD voltages (monomode range)
7
#sb276 DN
Spectral density (normalized to 1)
0C 8.5V
1.2
0C 9.0V
0C 10.0V
9.5V
#sb276 DN
1
0.8
0.6
0.4
0.2
0
-0.2
5271
5272
5273
5274
5275
5276
Wavelength [nm]
5277
5278
5279
Figure 13: spectra at 0C for various LDD voltages (all bimodes)
#sb276 DN
Spectral density (normalized to 1)
15C 8.5V
15C 9.0V
15C 9.5V
15C 10.0V
1.2
1
0.8
0.6
0.4
0.2
0
-0.2
5276
5277
5278
5279
5280 5281 5282
Wavelength [nm]
5283
5284
5285
Figure 14: spectra at 15C for various LDD voltages (all biomodes)
8
#sb276 DN
Spectral density (normalized to 1)
30C 9.0V
8.5V
30C 9.5V
1.2
30C 10.0V
#sb276 DN
1
0.8
0.6
0.4
0.2
0
-0.2
5282
5284
5286
Wavelength [nm]
5288
5290
Figure 15: spectra at 30C for various LDD voltages (all bimodes)
9
#sb276 DN