1
EMME Evaluation Framework User Manual
Release 1.0
Università della Svizzera italiana (Switzerland)
December 10th, 2011
1
EMME Evaluation Framework, User Manual
Release 1.0
Contents
1 License
3
2 Installation Requirements and Procedure
2.1 Installation Requirements . . . . . . . . . . . . . . . . . . . . . . . . . . . . . . . . . . . . . . . . . . . . . . .
2.2 Installation Procedure . . . . . . . . . . . . . . . . . . . . . . . . . . . . . . . . . . . . . . . . . . . . . . . . .
4
4
4
3 Overview of the EMME Evaluation Framework
3.1 Goals of EMME Evaluation Framework . . . . . . . . . . . . . . . . .
3.1.1 Run-time resource management for multi-core architectures
3.1.2 Portability . . . . . . . . . . . . . . . . . . . . . . . . . . . .
3.2 Quick start . . . . . . . . . . . . . . . . . . . . . . . . . . . . . . . .
.
.
.
.
.
.
.
.
.
.
.
.
.
.
.
.
.
.
.
.
.
.
.
.
.
.
.
.
.
.
.
.
.
.
.
.
.
.
.
.
.
.
.
.
.
.
.
.
.
.
.
.
.
.
.
.
.
.
.
.
.
.
.
.
.
.
.
.
.
.
.
.
.
.
.
.
.
.
.
.
6
6
7
7
7
4 Evaluating a Run-time Resource Management Policy
4.1 The run-time methodology . . . . . . . . . . . . . . . . . . . . . . . . . . .
4.2 Framework assumptions and system model . . . . . . . . . . . . . . . . . .
4.3 The input use case scenario . . . . . . . . . . . . . . . . . . . . . . . . . . .
4.3.1 Specifying the application characterization . . . . . . . . . . . . . .
4.3.2 Specifying the user activity . . . . . . . . . . . . . . . . . . . . . . .
4.4 The run-time resource management policies . . . . . . . . . . . . . . . . .
4.4.1 Pull High Push Low . . . . . . . . . . . . . . . . . . . . . . . . . . .
4.4.2 Maximization of the current Throughput . . . . . . . . . . . . . . .
4.4.3 Maximization of the current Throughput with resource Reservation
4.4.4 Application-specific Run-Time managEment . . . . . . . . . . . . .
4.5 The execution trace . . . . . . . . . . . . . . . . . . . . . . . . . . . . . . .
4.6 Post-processing . . . . . . . . . . . . . . . . . . . . . . . . . . . . . . . . .
4.7 Profiling the RRM for a target execution environment . . . . . . . . . . . .
.
.
.
.
.
.
.
.
.
.
.
.
.
.
.
.
.
.
.
.
.
.
.
.
.
.
.
.
.
.
.
.
.
.
.
.
.
.
.
.
.
.
.
.
.
.
.
.
.
.
.
.
.
.
.
.
.
.
.
.
.
.
.
.
.
.
.
.
.
.
.
.
.
.
.
.
.
.
.
.
.
.
.
.
.
.
.
.
.
.
.
.
.
.
.
.
.
.
.
.
.
.
.
.
.
.
.
.
.
.
.
.
.
.
.
.
.
.
.
.
.
.
.
.
.
.
.
.
.
.
.
.
.
.
.
.
.
.
.
.
.
.
.
.
.
.
.
.
.
.
.
.
.
.
.
.
.
.
.
.
.
.
.
.
.
.
.
.
.
.
.
.
.
.
.
.
.
.
.
.
.
.
.
.
.
.
.
.
.
.
.
.
.
.
.
.
.
.
.
.
.
.
.
.
.
.
.
.
.
.
.
.
.
.
.
.
.
.
.
.
.
.
.
.
.
.
.
.
.
.
.
.
.
.
.
.
.
.
.
.
.
.
.
.
.
.
.
9
9
9
11
11
12
13
13
13
14
14
14
16
16
.
.
.
.
.
.
.
.
.
.
.
.
5 A practical example
18
5.1 Use case specification . . . . . . . . . . . . . . . . . . . . . . . . . . . . . . . . . . . . . . . . . . . . . . . . . 18
5.2 Evaluating the system performance . . . . . . . . . . . . . . . . . . . . . . . . . . . . . . . . . . . . . . . . . 18
5.3 Evaluating the RRM overhead . . . . . . . . . . . . . . . . . . . . . . . . . . . . . . . . . . . . . . . . . . . . . 20
6 Extending the EMME framework
21
7 Author
22
8 Acknowledgments
22
2
EMME Evaluation Framework, User Manual
Release 1.0
1 License
EMME evaluation framework is open-source and it is released under the BSD license:
Author: Giovanni Mariani
Copyright (c) 2011-2012, Università della Svizzera italiana
All rights reserved.
Redistribution and use in source and binary forms, with or without modification, are permitted provided that the following conditions are met:
• Redistributions of source code must retain the above copyright notice, this list of conditions and the following disclaimer.
• Redistributions in binary form must reproduce the above copyright notice, this list of conditions and the following
disclaimer in the documentation and/or other materials provided with the distribution.
Neither the name of Università della Svizzera italiana nor the names of its contributors may be used to endorse or promote
products derived from this software without specific prior written permission.
THIS SOFTWARE IS PROVIDED BY THE COPYRIGHT HOLDERS AND CONTRIBUTORS ”AS IS” AND ANY EXPRESS OR IMPLIED
WARRANTIES, INCLUDING, BUT NOT LIMITED TO, THE IMPLIED WARRANTIES OF MERCHANTABILITY AND FITNESS FOR A
PARTICULAR PURPOSE ARE DISCLAIMED. IN NO EVENT SHALL THE COPYRIGHT OWNER OR CONTRIBUTORS BE LIABLE FOR
ANY DIRECT, INDIRECT, INCIDENTAL, SPECIAL, EXEMPLARY, OR CONSEQUENTIAL DAMAGES (INCLUDING, BUT NOT LIMITED
TO, PROCUREMENT OF SUBSTITUTE GOODS OR SERVICES; LOSS OF USE, DATA, OR PROFITS; OR BUSINESS INTERRUPTION)
HOWEVER CAUSED AND ON ANY THEORY OF LIABILITY, WHETHER IN CONTRACT, STRICT LIABILITY, OR TORT (INCLUDING NEGLIGENCE OR OTHERWISE) ARISING IN ANY WAY OUT OF THE USE OF THIS SOFTWARE, EVEN IF ADVISED OF THE
POSSIBILITY OF SUCH DAMAGE.
3
EMME Evaluation Framework, User Manual
Release 1.0
2 Installation Requirements and Procedure
2.1 Installation Requirements
EMMEframework has been designed to be compatible with LINUX operating system. The framework is written in C and can
be compiled with a standard GNU C compiler (gcc version 4.4.3 is recommended). The basic version of the framework can be
installed without requiring additional programs or libraries.
The post-processing utilities and the run-time profiling functionalities1 depends on the following software:
• Post-processing routines are written in matlab language (tested with MATLAB, version 7.0.6, R2008a) and also require
gnuplot (tested with version 4.2).
• Run-time profiling functionalities require the SESC tool-chain including the SescUtils package and the SESC simulator
(http://sesc.sourceforge.net/).
2.2 Installation Procedure
EMMEframework is released in source form. To run it you need to compile and install the software.
• Download the compressed file containing the release of (EMMEframework_1_0.tgz).
• Uncompress the archive using the following command:
~$ tar -zxvf EMMEframework_1_0.tgz
This will create a directory EMMEframework. In the following text, the absolute path name of this directory will be
referred as sourcedir.
• Create an installation directory (which absolute path name will be referred as installdir):
~$ mkdir <installdir>
• Change the working directory and enter in the sourcedir.
~$ cd <sourcedir>
• Edit the host.setup file and assign to INSTALLDIR the value installdir.
• Run make and make install to complete the installation:
<sourcedir>$ make
<sourcedir>$ make install
• (Recommended). To test the installation run make test. This should produce the following output:
1 The run-time profiling functionalities are released targeting the SESC simulation environment.
4
EMME Evaluation Framework, User Manual
Release 1.0
<sourcedir>$ make test
cd tests && ./launch.host
ARTE TEST PASSED
PHPL TEST PASSED
maxTR TEST PASSED
maxT TEST PASSED
• (Optional). To delete the temporary files generated during the installation you can run make clean.
5
EMME Evaluation Framework, User Manual
Release 1.0
3 Overview of the EMME Evaluation Framework
EMME: Efficient run-time resource Management for Multi-core Embedded platforms, is a research project funded by the Hasler Foundation and it is based on previous work carried out during the MULTICUBE project.
Programmable multi-core and many-core platforms increase exponentially the challenge of task mapping and scheduling,
provided that enough task-parallelism does exist for each application. When considering that different applications are executed concurrently on the same multi-core platform and are competing to access the system resources, a Run-time Resource
Management (RRM) layer should be integrated in the OS in order to arbiter about resource allocation. The RRM system should
take decisions in order to maximize platform performance while minimizing nonfunctional costs such as energy or power
consumption.
The EMME evaluation framework (in short, EMMEframework) is a simulation environment to enable high level performance
analysis of a multiprogrammed multi-core scenario when an user-selected RRM policy is applied.
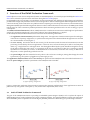
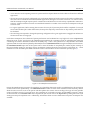
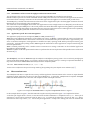
In the EMMEframework, the RRM takes decisions on the basis of the following information:
• The application characterization performed at design-time. The application characterization reports for each application the set of operating configurations, i.e. performance and power indices obtained when the application is executed
on a certain number of cores (Figure 1).
• The user activity. We assume that the user activity (or the interaction with the external environment) issues the
processing of some data by the active applications. From now on we will use the term job to refer to an unitary data
chunk, e.g. a single frame in a video application. The throughput offered by the system should be enough for serving
all the jobs issued by the user activity. As an example, if the user is re-producing a video, he is expecting a smooth
reproduction of 25 frames per second. In EMMEframework we assume that, even if the user activity is unknown at
design-time, it can be dynamically profiled at run-time.
• The power budget, which is assumed to be set by the OS. This can be set according to, among other things, the actual
system state (e.g., the system is plugged into a power supply or not).
The application characterization and the user activity are specified to the EMMEframework as described in Subsection 4.3
while the power budget is passed as a parameter to the EMMEframework executable.
(a) app0’s operating configurations
(b) app1’s operating configurations
Figure 1: Design-time application characterization reporting the operating configurations of two applications in terms of:
performance (y axis), power consumption (x axis) and resource requirement (the π value).
3.1 Goals of EMME Evaluation Framework
The goal of the EMMEframework aims at providing to Embedded System Designers (ESDs) a tool to explore the impact of
different RRM policies on the performance of a target computing platform. The approach addresses soft real-time applications
where the RRM system is responsible of maximizing the platform performance while fitting in a power budget constraint.
6
EMME Evaluation Framework, User Manual
Release 1.0
Given an input use case scenario (Section 4.3), the EMMEframework can evaluate the system behavior for different RRM policies. Output of the framework is a set of trace files showing information such as job arrival and completion time and the distribution of computing resource on the active applications (Section 4.5). The framework also includes some post-processing
routines to extrapolate high level information about applications’ performance (Section 4.6).
3.1.1 Run-time resource management for multi-core architectures
The current EMMEframework distribution includes different RRM policies to cope with different design problems (Section
4.4). The different RRM policies can be linked dynamically at run-time, thus the performance evaluation for different RRM
policies can be carried out without the need of recompiling the framework. The dynamic linking is supported by a well
defined interface between the RRM software modules implementing the RRM policies and the rest of the framework.
The EMMEframework can be extended introducing new RRM modules for both academic and industrial purposes (Section 6).
3.1.2 Portability
The EMMEframework is developed using the standard ANSI C programming language. This enables to install and use the tool
on a wide range of different systems. In addition, to compute the run-time overhead that a RRM policy introduces when
executed on the embedded system being designed, it is possible to cross-compile the framework and running it using an
instruction set simulator (Section 4.7).
In other words you can:
• Compile the EMMEframework to generate binaries for the execution on the host machine (e.g. your laptop). This allows
you to quickly execute the EMMEframework and to evaluate the performance of the target embedded system at a high
level (Section 4).
• Cross-compile the EMMEframework to generate binaries for the execution on the target machine (i.e. the embedded
computing system being designed). This allows you to simulate the EMMEframework with an off-the-shelf instruction
set simulator that emulates the target system. Thus, the execution of the software module implementing the selected
RRM policy is simulated and the run-time overhead can be profiled. An example of this procedure is described in
Sections 4.7 and 5.3.
3.2 Quick start
Once completed the installation procedure (Section 2.2), you can execute the EMMEframework from a shell with the following
command:
<workingdir>$ <installdir>/bin/EMMEframework -n <cores> -f <frequency> -c <appCharDir> -a <activityDir>
-p <powerBudget> -t <RRMperiod> -r <RRMpolicy> -o <outputDir>
The program arguments have the following meanings:
• -n <cores>. The number of homogeneous computational elements available on the platform is cores (cores should
be a natural number greater than 0).
• -f <frequency>. The operating frequency is frequency (frequency is expressed in M Hz, it should be a natural
number greater than 0).
• -c <appCharDir>. The application characterization is available in the path appCharDir.
• -a <activityDir>. The directory name where to find the user activity specification is activityDir.
• -p <powerBudget>. The power budget is powerBudget (powerBudget is expressed in W , it should be greater than
0).
7
EMME Evaluation Framework, User Manual
Release 1.0
• -t <RRMperiod>. The RRM routine to decide about resource allocation is invoked every RRMperiod [Kcycles]
(RRMperiod should be a natural number greater than 0).
• -r <RRMpolicy>. The name of the RRM policy to use is RRMpolicy.
• -o <outputDir>. The output directory name is outputDir. If this argument is omitted, output files are written in
the current working directory.
For more details about the use case specification (i.e. the content of the directories appCharDir and activityDir), refer
to Section 4.3. Note that an example use case specification is released together with the EMMEframework distribution and can
be found under the path <installdir>/SPLASH2-CS. To run the example you can use the scripts available in the directory
<installdir>/example.
8
EMME Evaluation Framework, User Manual
Release 1.0
4 Evaluating a Run-time Resource Management Policy
4.1 The run-time methodology
The EMMEframework targets homogeneous multi-core computing platform. We consider that at run-time different applications will be executed and will compete to access the available processing resources. The RRM introduces a run-time
processor assignment policy to maximize the user-perceived performance (in terms of applications’ response time) while
fitting in the power budget. The processor assignment depends on the user activity that dynamically issues the processing
of different applications’ jobs and on the design-time application characterization.
We consider code versioning [1] as the main enabling technology in order to change the task-level parallelization of an application. However, other mechanisms for manipulating the program representation to exploit available processors can be
considered with their additional overhead (e.g. stream program fusion [2, 3]).
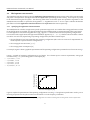
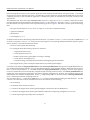
Figure 2: Run-time system behavior. The parallelization π is changed only between the execution of two jobs.
We consider that application parallelization cannot be changed during the execution of a single job but only between the
execution of two different jobs. We also consider that some jobs might be temporarily stored in memory while waiting to
be processed. This might happen for bursty applications where many jobs are issued during a short time interval. Figure
2 shows an example behavior of the task-level parallelization chosen by a RRM for a scenario with 3 applications running
concurrently (job starting times are indicated with ’+’). When α1 starts, 8 cores are allocated to it. Then, applications α2 and
α3 enter the system. The RRM allocates to these applications 4 and 2 cores respectively. When the α1 exits the system, the
parallelization of α3 is increased to 8 cores. The run-time decisions are taken following the RRM policy and influence the
overall system performance.
4.2 Framework assumptions and system model
The EMMEframework targets homogeneous multi-core computing platform. We consider that, during run-time different applications are executed concurrently and that the user activity will issue the elaboration of a sequence of applications’ jobs.
We assume that the user activity is not known at design time but it can be profiled at run-time. For instance, at run-time the
RRM system profiles (for each application) the number of jobs issued in a time unit and the run-time decisions might depend
on this data.
Using a traditional approach to evaluate the run-time performance of the target multiprogrammed multi-core system one
would have to simulate the concurrent execution of the different applications with a detailed architectural model that is
computational expensive. For example, simulating the execution of a single MPEG2 application processing 2 frames using
the SESC simulator might take few minutes. Extending the simulation to a significant number of frames and considering the
concurrent execution of other applications might lead to simulation time of several hours or even few days.
To reduce this simulation cost and to produce results for complex use case scenarios in few minutes, the EMMEframework
takes some assumptions on the underlying computing platform and in particular on the predictability of the applications’
execution times. We assume that:
9
EMME Evaluation Framework, User Manual
Release 1.0
• At run-time, the set of computing resources is partitioned into disjoint subsets and each subset is allocated to a different
application.
• The execution time of a specific job depends only on the input dataset and on the resources allocated to its elaboration.
Thus, there are no interferences between different applications during the concurrent execution. It is worth to notice
that this assumption might require specific communication infrastructure in order to keep a predictable communication time. In future release we envision to extend the framework to consider a less conservative assumption on the job
execution time.
• For a given application, before starting the execution of a new job, all previous jobs should be completed. If a new job
arrives while another job is under elaboration, the new job is temporary stored in the on-chip memory and it waits to
be scheduled.
• The switching time required to change the operating configuration for a given application is negligible in reference to
the execution time of a single job.
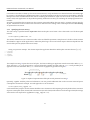
Under these assumptions, the evaluation of system performance can be obtained at a very high level. Given an input trace,
defined in terms of jobs’ arrival times, the EMMEframework simulates the computing system by scheduling the input jobs
considering the resource distribution defined in the RRM policy. When a new job arrives it is dispatched to the related
application which current state is updated by the EMMEframework’s simulation kernel. During the EMMEframework execution,
the simulation kernel keeps track of the system state in terms of number of completed jobs, number of jobs currently in
the system (either waiting or executing), power consumption resulting from the current resource allocation etc... These
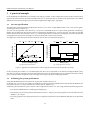
information can be assessed by the RRM to decide the resource allocation for the next simulation period (Figure 3).
Figure 3: The EMMEframework structure.
During the EMMEframework execution, the simulation on a detailed architectural model is avoided thanks to the assumption
on the execution time predictability. The simulation kernel includes an event driven simulator whom iteratively verifies
when the next event will occur in the system and then updates the current state according to the type of event (possible
events include the arrival of a new job arrive, the completion of a job under execution and the RRM invocation). Output
of the framework is an execution trace that completes the jobs’ arrival time in the input trace by adding data such as job
waiting time and job completion time. Additionally, information about resource distribution and power consumption are
available.
10
EMME Evaluation Framework, User Manual
Release 1.0
4.3 The input use case scenario
The EMMEframework takes as entry points the application characterization reporting average values of the execution time
and power consumption for each application and the input trace representing the user activity. These inputs are passed
to the framework using the file system. The directory paths where to find this inputs are specified as arguments to the
EMMEframework executable. In particular, the arguments -c <appCharDir> and -a <activityDir> indicate the absolute
path where to find the application characterization and the input trace directories respectively.
4.3.1 Specifying the application characterization
The EMMEframework considers an application specific optimization approach. We consider that average performance values
for each application are available. This data should be fed to the EMMEframework in Comma Separated Value (CSV) format.
For each application a file named <appCharDir>/app_<appId>.csv should contain the list of operating configurations.
For a scenario with N applications, the application identifiers appId are {0, 1, ..., N −1}. The files content are three-columns
CSV tables. For each row (representing an operating configuration), the three columns report:
1. The parallelization level associated with this operating configuration (this is the cost in terms of computational elements required to operate with this configuration)2 .
2. The average job execution time [cycles].
3. The average power consumption [W ].
For example, Figure 4 shows a graphical representation of the operating configurations presented in CSV format in Listing 1.
Listing 1: Example of operating configurations in CSV format. The columns report: resource requirements, average job
execution time [cycles], and average power consumption [W ].
1
2
3
4
1 ,12070470 ,0.777
2 ,8046980 ,1.726
4 ,6726170 ,3.236
8 ,6021600 ,6.184
16 ,5620910 ,12.02
Performace [job/s]
0
55
π=16
50
π=8
45
π=4
40
π=2
35
30
π=1
25
20
0
2
4
6
8
10
12
14
Power Consumption [W]
Figure 4: Graphical representation of the operating configurations in Listing 1. The application performance on the y axis is
inversely proportional to the job execution time and refers to a clock frequency of 300M Hz.
2 The RRM policies released with expect that the operating configurations are sorted in ascending order according to their resource requirements.
11
EMME Evaluation Framework, User Manual
Release 1.0
It is worth to notice that, to obtain cycle accurate execution times, costly simulations on a detailed architectural model might
be necessary. The advantages of EMMEframework are, a) given the assumption on the execution time predictability, different
RRM policies can be evaluated without the need of re-running the simulations of jobs’ execution on the costly architectural
model, and b) each application can be profiled separately without the necessity of simulating the multiprogrammed environment.
We want to remark that the assumption on the execution time predictability does not imply a constant execution time for
all jobs. Information on the execution time variation in reference to the average value can be reported in the user activity
as explained in next Section.
4.3.2 Specifying the user activity
The user activity is specified with an input trace that lists the jobs’ arrival times. This is done with a CSV file whose path
must be:
<activityDir>/jobArrivals.csv
The content of that file is a two-column CSV table. Each row of the file represents a new job arrival. The first column contains
the identifiers <appId> of the application to whom the job belongs. The second column reports the time elapsed from the
arrival of the previous job (the inter-arrival time).
Listing 2: Input trace example. The columns report the application identifiers and the jobs’ interarrival times [cycles].
1
2
3
4
0 ,10000
1 ,30000
1 ,5000
0 ,30000
The example in Listing 2 reports the arrival of 4 jobs. The first one belongs to application 0 and arrives at the 10th Kcycles.
Then, after 30Kcycles a job of application 1 arrives followed by another one after other 5Kcycles. Finally another job of
application 0 arrives after other 30Kcycles. These arrivals are graphically presented in Figure 5.
Figure 5: Graphical representation of the job arrivals presented in Listing 2.
Optionally, together with the job arrival information, one can provide additional data on the execution time and power
consumption variations for each job. For each application a CSV file named:
<activityDir>/var_<appId>.csv
can be used for this purpose. The file content should be a two-columns CSV table reporting for each job the relative variations
of power consumption (first column) and execution time (second column) with reference to the average values (the average
values are the ones reported in <appCharDir>/app_<appId>.csv).
12
EMME Evaluation Framework, User Manual
Release 1.0
4.4 The run-time resource management policies
A RRM policy defines how the resources should be distributed between the active applications. Four RRM policies are released
with the EMMEframework. The RRM policies can be linked to the EMMEframework at run-time or at compilation time. The first
linking mode is supported to enable a quick evaluation of different RRM strategies without the need of recompiling the
framework for each policy. The latter linking mode can be used to install the framework on the target system and to profile
the overhead introduced by the selected RRM policy.
By default, the EMMEframework is installed to support the run-time linking mode for the RRM policies. In this case, you can
pass the name of the RRM to use with the argument -r <RRMpolicy> when launching the EMMEframework.
When using a static linking mode for the RRM, you should compile and link statically the selected RRM policy. To do so you
can edit the setup file used by your makefile (i.e. either <sourcedir>/host.setup or <sourcedir>/SESC.setup). In
particular, you should comment the lines:
# Allow dynamic linking of RRM policies
LDYNAMIC=true
and uncomment the lines:
## Statically link the target RRM policy.
#LDYNAMIC=false
#RRMTARGET=<RRMpolicy>
Note that you should assign to the variable RRMTARGET, the name of the RRM policy to use.
The four RRM policies available are:
• Pull-High Push-Low, named PHPL.
• Maximization of current throughput, named maxT.
• Maximization of current throughput with resource reservation, named maxTR.
• Application-specific Run-Time managEment, named ARTE.
Note that some of the RRM policies are periodic and all of them take decisions such to fit in the power budget. The RRM
period and the power budget should be passed as arguments when launching the EMMEframework as: -p <powerBudget>
-t <RRMperiod>
4.4.1 Pull High Push Low
The Pull-High Push-Low (PHPL) RRM policy is derived from the approach presented in [4].
This policy periodically verifies the power consumption of the different applications and modifies the resource allocation to
fit in the power budget (first) and to balance the power consumed by the different applications (second).
Every time the PHPL is invoked, the RRM verifies if in the last period the power budget was exceeded. If this is the case, PHPL
reduces the parallelism of the application consuming the most power. Otherwise, the power budget not in use is allocated to
the application consuming the least power whose parallelization is increased.
4.4.2 Maximization of the current Throughput
The maximization of the current Throughput (maxT) is a RRM policy presented in [5].
maxT is invoked every time an application switches between the idle and the ready states. maxT exhaustively explores the
possible allocations of computing resources to the set of applications currently running. The resource allocation providing
the maximum throughput sum (measured in Job/s) is selected. The exhaustive exploration excludes the resource allocations
that do not fit in the power budget or that would exceed the available resources.
13
EMME Evaluation Framework, User Manual
Release 1.0
4.4.3 Maximization of the current Throughput with resource Reservation
The maximization of the current Throughput with resource Reservation (maxTR) is an extended version of maxT.
maxTR considers a periodic invocation of the RRM. Within a RRM period resources are reserved to the applications. Resource
reservation allows to manage constraints on the individual application throughput on a window-based, periodic basis.
The maxTR policy considers smooth variations in the arrival rates of applications’ jobs. The throughput constraints for each
RRM period are set accordingly to this consideration.
The constraints on the throughput ensures that each application receives enough resources to adequately serve the arrival
rate expected during next RRM period. This avoids possible starvation effects that might arise using maxT in systems where
an application with high throughput requirements does not receive enough resources since other applications are repeatedly
entering and exiting the system and consume more resources than necessary.
4.4.4 Application-specific Run-Time managEment
The Application-specific Run-Time managEment (ARTE) is a RRM presented in [6].
ARTE takes some additional assumptions on the underlying system. In ARTE it is assumed that job inter-arrival times are
exponentially distributed with a certain mean. Moreover, it is assumed that the job execution time is approximately constant. Given these assumptions, each application is modeled as a M/D/1 queuing model and the job response time is given
analytically. Exploiting the queuing models, ARTE targets the minimization of the applications’ response time during the
run-time optimization.
ARTE is invoked periodically and it considers resource reservation to manage constraints on the individual application
throughput as done for maxTR.
ARTE also includes an efficient optimization heuristic to perform the run-time exploration of the possible resource allocation
alternatives [6].
(For developers). Note that the ARTE RRM might be modified to model different queuing systems. This can be done by modifying the
queuing model defined in RRM_ARTE.h. For example, to model an M/M/1 queuing system (i.e. assuming an exponential distribution of
the job execution time) the EXPECTEDPOPULATION(U) should be redefined as follows:
#define EXPECTEDPOPULATION(U) (U / (1.0 - U))
The above macro defines how the expected average number of jobs populating the system depends on the utilization (U) [7].
4.5 The execution trace
The EMMEframework takes as input the user activity and the application characterization and it returns as output detailed
information about application execution for the selected RRM policy. In particular, EMMEframework completes the input
trace with additional data such as the start and completion times of each job execution.
Figure 6: An example of execution trace to complete the input trace shown in Figure 5.
In the example shown in Figure 6, the information about jobs’ arrivals presented in Figure 5 are completed as follows.
As the first job of application 0 arrives, its execution starts and the elaboration is completed at 25Kcycles. Then a job of
application 1 arrives and its execution starts (at 40Kcycles). A second job of application 1 arrives at 45Kcycles but its
execution will start only at 60Kcycles. The second job of application 1 is subject to a waiting time since we assumed that
14
EMME Evaluation Framework, User Manual
Release 1.0
before starting the execution of a new job the application must complete the elaboration of all previous jobs. A second job
of application 0 arrives while the application 1 is elaborating. In this example we consider that the RRM did not allocate all
computing resources to the execution of application 1 and thus the system can schedule the concurrent execution of the
application 0.
The EMMEframework writes the output execution trace in the file <outputDir>/trace.csv (where outputDir has been
passed as parameter to the framework as described in Section 3.2). The content of <outputDir>/trace.csv is a four-column
CSV table whose rows represent the events represented using arrows in Figure 6. The table’s columns report the following
data:
• The type of event (either Arrival, Start or Completion of a job or an RRM invocation).
• Application identifier.
• Job identifier.
• Timestamp [Kcycles].
In addition to the trace file, the following output files are written: <outputDir>/events.csv and <outputDir>/RRMbehavior.csv.
In the file <outputDir>/events.csv, every time an event happens, a row reporting detailed information about the system
state is written in a CSV table formatted as follows:
• The first column reports the timestamp.
• For each application the following columns are reported:
– Target parallelization level.
– Current parallelization level.
– Number of jobs in the system (either executing or waiting).
– Current power consumption [W ].
– Cumulative energy consumption measured from the beginning of the simulation.
• Sum of applications’ power consumption (that shall not exceed the power budget).
It is worth to notice that the target parallelization and the current parallelization of an application might differ for the reason clarified in the following example. Let us assume that the RRM at a certain moment decides to deallocate some resources
from α0 and to allocate them to α1 . The RRM modifies the target parallelization accordingly. However, those applications will continue their execution until they complete the jobs currently under execution. The current parallelization will
change only at the moment the applications switch their operating configurations. However, the computing resources are
limited by the ones available on the platform. Thus, if α1 completes its job first, it cannot increase its current parallelization
until α0 releases the required computing resources.
The last output file (i.e. <outputDir>/RRMbehavior.csv) reports detailed data describing the RRM decisions. This file
contains a CSV table with a line for each RRM invocation. The columns are the following:
• The timestamp.
• An identifier of the current invocation.
• A column for each application reporting the throughput constraint for the next RRM period.
• A column for each application reporting the identifier of the selected operating configuration to execute.
• A column reporting the expected power consumption.
15
EMME Evaluation Framework, User Manual
Release 1.0
4.6 Post-processing
From the output execution trace one can get insight of many important information such as jobs’ execution, waiting and
response times3 . However, these average information are not directly available in the CSV tables which contains detailed data
for each job. For this reason we implemented some simple post-processing functionalities to extract high-level information
about the system behavior.
These functionalities are implemented in matlab and released with the EMMEframework package. In the directory:
<installdir>/post-processing
you can find a file named EMMEpostprocessing.m where the post-processing function is implemented. This function takes
as input three parameters:
• <inputpath>: the path name of the directory where the EMMEframework output files are stored.
• <windowlength>: the post-processing returns figures of merit computed within each time window of size <windowlength>
[Kcycles].
• <outputpath>: the path name where to save the post-processing output files.
To execute the post-processing function from the MATLAB environment you can proceed as follows:
addpath <installdir>/post-processing
mkdir <outputpath>
EMMEpostprocessing(<inputpath>,<windowlength>,<outputpath>);
which commands generate in the <outputpath> the following plots:
• powerConsumption.ps: the trend of the maximum power consumption (per each application and system-wide).
• responseTime.ps: the average response time (per each application and system-wide4 ).
• residentJobs.ps: the average number of jobs resident in the system (per each application and system-wide). The
waiting jobs should be stored in memory and thus the the number of resident jobs is correlated with the on-chip
memory requirements.
• througput.ps: the throughput (per each application and system-wide4 ).
(Known problem). Note that the average response time is computed within consecutive windows of length windowlength. The response
time within a time window is averaged over the jobs completed within the window itself. If no jobs are completed within a given time window, the average response time is undefined. This might generate visualization problems in the response time plot (responseTime.eps).
4.7 Profiling the RRM for a target execution environment
Once you select a RRM to be deployed on the computing system being designed, you might be interested to know the computational overhead the given RRM would generate on the target system. With this purpose, the EMMEframework can be
compiled for the execution on a target architecture (assuming that a C compiler for such an architecture is available). Then,
each RRM invocation can be profiled by executing the EMMEframework on the target system (or on its simulator).
The current EMMEframework release provides support for the MIPS-based architecture modeled with the SESC simulator [8].
Note that: to install the EMMEframework targeting the SESC simulator, you first need to install the SESC tool-chain.
To generate the EMMEframework binaries compatible with the SESC simulator proceed as follow:
3 For job’s response time we mean the overall time the job spend in the system from its arrival to its completion (i.e.
waiting time plus execution time).
response times and throughput might vary significantly for different applications. To dampen the effects of very high and low values we
use the geometric mean rather than the arithmetic one.
4 Application
16
EMME Evaluation Framework, User Manual
Release 1.0
• Create an installation directory (which absolute path name will be referred as installdir):
~$ mkdir <installdir>
• Open a shell and change the current directory to sourcedir (where you unpacked the EMMEframework package):
~$ cd <sourcedir>
• Edit the SESC.setup file as follows:
– Assign to INSTALLDIR the directory path name <installdir> where you wish to install the framework.
– Assign to RRMTARGET the name <RRMpolicy> of the RRM policy to use.
– Assign the variables SESC_UTILS_DIR, SESC_COMPILER, SESC_SIM_DIR, SESC_SIM, and SESC_LIB according to
your system setting.
• Make sure that the object files from previous EMMEframework installation are deleted:
<sourcedir>$ make clean
• Run the following commands to complete the installation:
<sourcedir>$ make -f Makefile.SESC
<sourcedir>$ make -f Makefile.SESC install
The C code implementing the the run-time decision making of the selected RRM policy is automatically instrumented with
profiling instructions. During the execution, these instructions generate a log file reporting timestamps of starting and
completion times of each RRM invocation. A post-processing executable <installdir>/bin/sesc-logparser will also be
generated during the installation to elaborate the log file and print on the output the execution time for each RRM call in
CSV format. An usage example can be found in the script <installdir>/example-sesc/launch (Section 5.3).
Note that the SESC simulation might take few hours. It is to reduce this simulation cost that with the EMMEframework we
introduced a high level evaluation methodology to run on the host machine.
17
EMME Evaluation Framework, User Manual
Release 1.0
5 A practical example
In the EMMEframework distribution an example case study is provided. In this example the system executes several jobs of
applications taken from the SPLASH2 benchmark suite [9]. In particular jobs are related to the applications: FFT, RADIX,
OCEAN and LU. In the following text we will call these applications {app0, app1, app2 app3}.
5.1 Use case specification
The application characterization (specified in the directory <installdir>/SPLASH2-CS/characterization) was generated using the SESC simulator [8].
The user activity (specified in the directory <installdir>/SPLASH2-CS/activity) has been generated considering a
Markov process where job inter-arrival times are exponentially distributed (i.e. a Poisson process). The input trace length
models one minute of run-time (that is 18Gcycles considering a frequency of 300M Hz). During this period we consider that
average job inter-arrival times are subject to some variations due to some external events.
The application characterization and the trend of job arrival rates are represented in Figure 7.
app0
app1
app2
app3
app0
app2
app3
45
Arrival Rate [job/s]
Performace [job/s]
250
app1
200
150
100
50
40
35
30
25
20
15
10
0
5
0
2
4
6
8
10
12
14
0
Power Consumption [W]
3e+09
6e+09
9e+09
1.2e+10
1.5e+10
Time [cycles]
(a) Application characterization.
(b) Average job arrival rate times.
Figure 7: Application characterization and average job arrival rates for the specific case study.
In this case study we consider a 17-core MIPS-based CMP. One core is responsible to run the OS including the RRM system.
The other 16 cores are responsible to execute the applications’ jobs. The power budget is set to 8.6W that is 70% of the overall
power consumed when all applications are running concurrently using all the computing elements.
5.2 Evaluating the system performance
Install the EMMEframework for the execution on your host machine (Section 2.2).
In the directory <installdir>/example you find shell scripts to launch the EMMEframework with each of the RRM policies
presented in Section 4.4. These script files are named launch.<RRMpolicy>.
Additionally, the same directory also contains a shell script named launch.all. This script performs the following actions:
• Executes the EMMEframework considering each RRM policy.
• Executes the post-processing routine described in Section 4.6. The post-processing outputs are saved in the directories
<RRMpolicy>-output.
• Executes a gnuplot script that generates plots to compare the performance of the different RRM policies (as described
next).
18
EMME Evaluation Framework, User Manual
Release 1.0
First, you need to edit the file ./launch.all to let the MATLAB variable point to the matlab executable. Then, the execution
of the command:
<installdir>/example$ ./launch.all
from the <installdir>/example directory, generates the following files:
• <installdir>/example/RRM-comparison/powerConsumption.ps
• <installdir>/example/RRM-comparison/responseTime.ps
• <installdir>/example/RRM-comparison/residentJobs.ps
• <installdir>/example/RRM-comparison/througput.ps
These files contain plots reporting the system-wide figures of merit for each of the 4 RRM policies presented in Section 4.4.
In this example case study, we focus our attention on the analysis of the response time. For a better graphical comparison,
this figure of merit is reported by comparing each couple of RRM policies. These comparison plots are saved in files named
responseTime-<RRMpolicy_0>-<RRMpolicy_1>.ps.
PHPL
ARTE
maxT
1e+07
1e+06
1e+07
1e+06
0
2e+09
4e+09
6e+09
8e+09
1e+10
1.2e+10 1.4e+10 1.6e+10 1.8e+10
2e+10
0
2e+09
4e+09
6e+09
8e+09
Time [cycles]
maxTR
1e+10
1.2e+10 1.4e+10 1.6e+10 1.8e+10
2e+10
Time [cycles]
(a) Response time comparison between ARTE and PHPL
(b) Response time comparison between ARTE and maxT
ARTE
PHPL
1e+08
maxT
maxTR
ARTE
180
160
Resident Jobs
Response Time [cycles]
ARTE
1e+08
Response Time [cycles]
Response Time [cycles]
1e+08
1e+07
140
120
100
80
60
40
20
1e+06
0
0
2e+09
4e+09
6e+09
8e+09
1e+10
1.2e+10 1.4e+10 1.6e+10 1.8e+10
2e+10
0
Time [cycles]
(c) Response time comparison between ARTE and maxTR
2e+09
4e+09
6e+09
8e+09
1e+10
1.2e+10 1.4e+10 1.6e+10 1.8e+10
2e+10
Time [cycles]
(d) Number of jobs resident in the system for the different RRM policies
Figure 8: Comparison of the proposed RRM policies in terms of response time and number of jobs resident in the system.
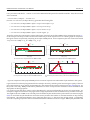
Figure 8 shows few selected plots generated for the example case study. With the goal of maximizing the quality of the user
perceived experience we are looking for the RRM policy that minimizes the response time (Figures 8(a), 8(b) and 8(c)). For
the specific case study, ARTE provides better performance in terms of response time and thus we select this RRM for the
deployment on the target system.
It is worth to notice that other criteria to select the RRM policy can be used depending on the use case requirements. For
example we might be interested in verifying that the storage requirements do not exceed the memory available on the chip.
This might be the case of PHPL in our case study since the number of jobs resident in the system reaches 160 instances (Figure
8(d)). We recall that the jobs should be stored in the memory and thus this number is correlated with the on-chip memory
requirements. This phenomena happens since, during the initial 5Gcycles the arrival rate of app0 is high. To adequately
serve this computing request the resource distribution should be unbalanced in favors of app0. PHPL equally distributes the
19
EMME Evaluation Framework, User Manual
Release 1.0
computing resources between the active applications and thus it does not serve adequately app0. Consequently during this
period the arrival rate of app0 is higher than its throughput and arriving jobs should be buffered increasing the number of
resident jobs and thus the storage requirements.
5.3 Evaluating the RRM overhead
To compute the run-time overhead you need to simulate the RRM routines execution on an executable model of the target
processor. In this example we use the SESC simulation environment.
You first need to install the EMMEframework for the execution on the SESC simulator (Section 4.7). The target RRM policy is
linked statically and cannot be changed during run-time.
As described in the previous Section we selected the ARTE RRM. Set RRMTARGET accordingly to this decision while following
the installation procedure (Section 4.7).
The installation directory contains a subdirectory named example-sesc. In this directory you can three files:
• power.conf. This file contains the SESC configuration modeling the processor where the RRM policy should be executed.
• gnuplot.scr. A gnuplot script to visualize the RRM invocation overhead.
• launch. A shell script to execute the SESC simulation, to parse the output log file and to execute the gnuplot script.
Before running the launch script you should edit it to let the variable SESC_SIM point to the path of your SESC simulator
executable. Then you can run the example from a bash environment as follows:
~$ cd <installdir>/example-sesc
<installdir>/example-sesc$ ./launch
after the invocation of the commands above, you find in the directory named output the profiling file profile.csv containing a CSV table with two columns to report the RRM invocation count and the execution overhead for each RRM call.
Additionally, the data is visualized in the file profile.ps (Figure 9).
Overhead [cycles]
60000
50000
40000
30000
20000
10000
0
0
20
40
60
80
100
120
RRM invocation count
Figure 9: Run-time overhead for the example case study when using the ARTE RRM.
It is worth to notice that the overhead of the first invocation might result in an outlier. In fact cache misses might raise from
the fact that the RRM code is not yet loaded in the cache.
20
EMME Evaluation Framework, User Manual
Release 1.0
6 Extending the EMME framework
(This Section is thought for developers)
With the current EMMEframework distribution, four RRM routines are released. Extending the framework by introducing new
RRM strategies consists in implementing the functions defined in the source file RRM.h under the section // RRM SPECIFIC
ROUTINES.
In particular, the following functions must be implemented:
• rrm_initSpecific(rrmStruct* rrm)
This function should initialize the data structure specific of your RRM.
• rrm_jobArrive(rrmStruct* rrm, unsigned int appId)
It is invoked every time a new job arrives. The parameter appId is the identifier of the application to whom the job
belongs. This function can be used to profile the arrival rates.
• rrm_jobExit(rrmStruct* rrm, unsigned int appId)
It is invoked every time a job is completed. The parameter appId is the identifier of the application to whom the job
belongs. This function can be used to profile the throughput.
• rrm_evalOP(rrmStruct* rrm)
This function implements the decision making to select the operating configurations of the active applications (or
Operating Point, OP). The function is meant to be invoked periodically with the period specified in rrm->period. This
function is also responsible to communicate the decisions to the applications by setting the elements of the array
GRRM_targetRes accordingly. The function is also responsible to write information in the RRMbehavior.csv file
which descriptor can be accessed through rrm->reportFile.
All the above function should return STATUS information. Acceptable return values are defined in defines.h. In particular,
either STATUS_FAILURE or STATUS_SUCCESS shall be returned.
21
EMME Evaluation Framework, User Manual
Release 1.0
7 Author
• Giovanni Mariani, ALaRI - Università della Svizzera italiana
8 Acknowledgments
We would like to acknowledge the contributions of the following people, for their scientific contribution in the analysis and
development of different run-time resource management methodologies.
• Vittorio Zaccaria, Politecnico di Milano
• Cristina Silvano, Politecnico di Milano
• Gianluca Palermo, Politecnico di Milano
• Prasanth Kuncheerath Ramankutty, ALaRI - Università della Svizzera italiana
This work is supported by the Hasler Foundation under the project EMME (Grant No. 11096), http://www.alari.ch/emme.
Neither the Hasler Foundation nor the Università della Svizzera italiana nor any of its contributors are liable for any use that
may be made of the software presented herein.
22
EMME Evaluation Framework, User Manual
Release 1.0
References
[1] Ch. Ykman-Couvreur, V. Nollet, Th. Marescaux, E. Brockmeyer, Fr. Catthoor, and H. Corporaal. Pareto-based application
specification for MP-SoC customized run-time management. In Proc. International Conference on Embedded Computer Systems:
Architectures, Modeling and Simulation IC-SAMOS 2006, pages 78–84, 2006.
[2] Michael I. Gordon, William Thies, and Saman Amarasinghe. Exploiting coarse-grained task, data, and pipeline parallelism
in stream programs. In Proceedings of the 12th international conference on Architectural support for programming languages and
operating systems, ASPLOS-XII, pages 151–162, New York, NY, USA, 2006. ACM.
[3] Michael I. Gordon, William Thies, Michal Karczmarek, Jasper Lin, Ali S. Meli, Andrew A. Lamb, Chris Leger, Jeremy Wong,
Henry Hoffmann, David Maze, and Saman Amarasinghe. A stream compiler for communication-exposed architectures.
In Proceedings of the 10th international conference on Architectural support for programming languages and operating systems,
ASPLOS-X, pages 291–303, New York, NY, USA, 2002. ACM.
[4] C. Isci, A. Buyuktosunoglu, C. Cher, P. Bose, and M. Martonosi. An analysis of efficient multi-core global power management policies: Maximizing performance for a given power budget. In Proceedings of the 39th Annual IEEE/ACM International
Symposium on Microarchitecture, pages 347–358, 2006.
[5] G. Mariani, G. Palermo, C. Silvano, and V. Zaccaria. A design space exploration methodology supporting run-time resource
management for multi-processor systems-on-chip. In Proc. IEEE 7th Symp. Application Specific Processors SASP ’09, pages
21–28, 2009.
[6] G. Mariani, G. Palermo, C. Silvano, and V. Zaccaria. ARTE: An application-specific run-time management framework for
multi-core systems. In Application Specific Processors (SASP), 2011 IEEE 9th Symposium on, pages 86 –93, june 2011.
[7] Kishor S. Trivedi. Probability and statistics with reliability, queuing and computer science applications. John Wiley and Sons Ltd.,
Chichester, UK, 2002.
[8] Jose Renau, Basilio Fraguela, James Tuck, Wei Liu, Milos Prvulovic, Luis Ceze, Smruti Sarangi, Paul Sack, Karin Strauss,
and Pablo Montesinos. SESC simulator, January 2005. http://sesc.sourceforge.net.
[9] S. C. Woo, M. Ohara, E. Torrie, J. P. Singh, and A. Gupta. The SPLASH-2 programs: characterization and methodological
considerations. In Proc. 22nd Annual Int Computer Architecture Symp, pages 24–36, 1995.
23