1
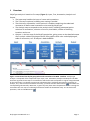
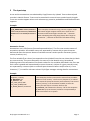
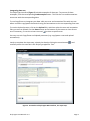
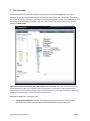
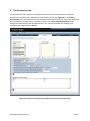
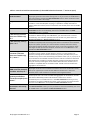
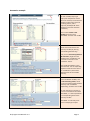
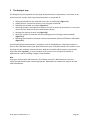
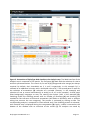
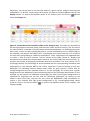
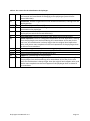
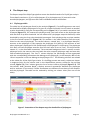
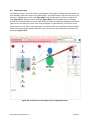
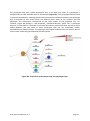
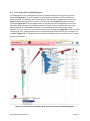
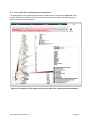
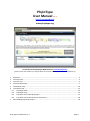
PhyloType User Manual V1.4 [email protected] www.phylotype.org Screenshot of the PhyloType Web interface: www.phylotype.org (please contact the authors by e-mail for details or technical problems, [email protected]) 1 2 3 4 5 6 Overview ............................................................................................................................................. 2 The Input step ..................................................................................................................................... 3 The Tree step ...................................................................................................................................... 5 The Annotation step ........................................................................................................................... 7 The Analysis step .............................................................................................................................. 10 The Output step ................................................................................................................................ 14 6.1 Phylotype table ......................................................................................................................... 14 6.2 Phylotype map .......................................................................................................................... 15 6.3 Tree with color-coded phylotypes ............................................................................................ 17 6.4 Tree with color-coded ancestral annotations ........................................................................... 18 7 Downloading PhyloType output ....................................................................................................... 19 PhyloType User Manual v1.4 Page 1 1 Overview PhyloType analysis is based on five steps (Figure 1): Input, Tree, Annotation, Analysis and Output. The Input step handles the input of a tree and annotations. The Tree step is optional, enabling tree rooting if needed. The third step, Annotation, is also optional. It enables combining the submitted annotation to define new annotations to be used by PhyloType. The Analysis step corresponds to the analysis itself, including parameterization: selection of annotations, selection of criteria, thresholds, number of shuffling iterations and so on. Output is the last step of the PhyloType pipeline, giving access to the detailed output of an analysis: table of phylotypes found, tree graphics with color-coded phylotypes, table of annotation, etc. All output is downloadable. Figure 1. Overview of the PhyloType pipeline and screenshot of its Web interface. A Phylotype analysis is composed of five sequential steps: Input, Tree, Annotation, Analysis and Output. The Web interface organizes these steps as a notebook in which each tab corresponds to a given step (indicated by the red arrows). To validate a given step (submitting data, combining annotations, launching an analysis, etc.) and to move forward the next step, you must click the arrow button ( ) and select the corresponding tab manually. Moreover, a given step may have internal operations such as rooting the tree within the Tree step or combining annotations within the Annotation step. To run this kind of operation, click on the Go button ( ). PhyloType User Manual v1.4 Page 2 2 The Input step A tree and its annotations are submitted by Copy/Paste or by Upload. Trees to be analyzed must be in Newick format. Trees must be rooted with care and must contain branch lengths. Trees can contain support values such as bootstrap, posterior probabilities and likelihood ratio supports. Example: (((((B_86DEHAN:0.018569,CBW3871 3:0.012185)50:0.002353,CBW9606M J496MOLE1chi:0.026038)40:0.00673 8...; In this example, the Newick string contains support values and branch lengths. Support values are in front of the ‘:’ character and branch lengths are after the ‘:’ character. When submitting data using Copy/Paste, don't forget to include the ‘;’ character at the end of the Newick string. Annotation format Annotations are in CSV format (Comma Separated Values). The first row contains names of annotation variables. All variable names are separated by comma with a space character before and after the comma. Names of variables cannot contain specific characters (space, comma, brackets, etc.). The first variable (first column) corresponds to the tip labels from the tree. Note that tip labels are case-sensitive. They must be exactly the same as in the Newick string. Second and following rows of the annotation file contain values for the variables described in the first row. Each value is quoted and monovalued (no space character). Values of a given record (a row) are separated by a comma (with or without space character before and/or after it). A star character (‘*’) is used for unknown values. PhyloType manages missing data for annotations. Example Sequence , Country 'B_86DEHAN','US' 'B_89SP061','US' 'A2_97CD_KFE4','DRC' 'A2_97CD_KTB48','DRC' 'A_96CM_MP512','Cameroon' … PhyloType User Manual v1.4 In this example, the first row saves the name of two variables: ‘Sequence’ and ‘Country’. The first one (‘Sequence’) is related to the names of the tips in the tree (case-sensitive). The second column (‘Country’) is an annotation variable, it saves the country for each tip. For instance, the first row 'B_86DEHAN','US' indicates the Country ‘US’ for the Sequence ‘B_86DEHAN’ (a tip in the tree). Columns are separated by a comma and values are in quotes. Page 3 Integrating data sets The PhyloType interface (Figure 2) includes examples of data sets. To use one of these examples, click the corresponding Load example button. This fills the Tree and Annotations text areas with the corresponding data. To use Copy/Paste to integrate your data: edit your tree and annotation files with any text editor and then copy/paste the Newick string and annotations to the corresponding text area. To use the Upload process, click on the Upload link, and then select the tree and annotation files you want to upload. Use the Reset button at the bottom of the screen to clear all text area if necessary, or use the scissors control ( ) to clear a specific area. You may not mix Copy/Paste and Upload processes (e.g. copy/paste a tree and upload annotations). Lastly to complete the Input step, submit the data by clicking the arrow button ( manually select the next tab in the PhyloType pipeline: Tree. ) and Figure 2. Screenshot of PhyloType Web interface, the Input step. PhyloType User Manual v1.4 Page 4 3 The Tree step The second step of a PhyloType analysis is related to tree rooting (Figure 3). This step is optional. There are several methods for tree rooting with PhyloType (see below). If necessary, select one of these methods by checking the corresponding option, click on the Go button and then wait for the feedback message. You may return to the submitted tree at any time by clicking on Root reset. Figure 3. Screenshot of the PhyloType Web interface, the Tree step. There are two parts to the tree display window: the left part is a global view; the right part is a local view (a zoom-in perspective). Move the blue rectangle from the global view to navigate the local view. Resize the blue rectangle (by grabbing the bottom-right corner) to modify the zoom factor. Methods available for rooting the tree: Variance minimization method. This algorithm places the root on the point that minimizes the variance of each genetic distance between tips to this point. PhyloType User Manual v1.4 Page 5 Variance minimization with heterochronous tips method. This algorithm is quite similar to the previous one, except that it assumes that tips are not all contemporary. To run, it needs the sampling dates of each tip. It places the root on the point that minimizes the variance of distances between each tip; see like contemporary, to this point. To use this method, submit dates by copy/paste in the Dates text area, where each tip from the tree is placed with respect to the date value separated by a colon (without space). Outgroup method. The outgroup method lets you select one or more tips. PhyloType roots the tree at 50% of the stemming branch of the ancestor of the selected tips. To visualize the tree click on the Draw tree button. Branch lengths and support values can be posted by checking on the corresponding box. After rooting, the new Newick string will be available for download in the Output section. Proceed to the Annotation step by clicking the arrow button ( ) and selecting the next tab in the PhyloType pipeline: Annotation. PhyloType User Manual v1.4 Page 6 4 The Annotation step The Annotation step is optional. It enables the selection and combination of submitted annotations to define new annotations to be used by PhyloType (Figure 4). The Primary annotations panel corresponds to the annotations submitted during the Input step. It displays each annotation variable with its domain of values. The added New annotations panel displays annotations that will be defined here. The controls available for building new annotations are described in Table 1. Figure 4. Screenshot of the PhyloType Web interface, the Annotation step. PhyloType User Manual v1.4 Page 7 Table 1. Controls to build new annotations (in the table below the character ‘*’ marks an input) ‘create a new variable with the name*’ ‘duplicate variable * to *’ ‘delete variable *’ ‘add value(s) (selection from one variable only) to *’ ‘add remaining value(s) from * to *’ ‘add value(s) with an OR connector (selection from one variable only) to *, name: *’ ‘add value(s) with an AND connector (multiple variables selection) to *’ ‘rename value(s) (primary annotations cannot be modified) with name *’ ‘Remove one or several annotations selected by the user’ To build a new annotation variable, select the control, enter a name (by default PhyloType generates new names starting with an ‘A’), then click on the Go button. The new variable is listed in the New annotations section. Here, the domain value of this new variable is still empty. Creation of a new annotation variable by copying an existing one, either a primary variable or a new variable (after copying, it is possible to modify its domain of values). Select the control, enter a name for the new variable, then click on the Go button. Select the control, select a variable to delete (only variables from the New annotations section can be deleted), then click on the Go button. The New annotations section is updated. On the control and target, check the variable you want to fill with new annotations. Before clicking on the Go button, you must select one or several annotation(s). This selection operates from one variable only, either from the Primary annotations or New annotations sections. Complete the domain values of a new annotation variable. Knowing an annotation variable to complete, it fills its missing values from an annotation source selected by the user (either a primary or a new annotation variable). Select the control, select the annotation variable you want to use as a source for annotation, select the target variable you want to complete, and then click on the Go button. This updates the New annotation section. A target annotation variable is filled with a new annotation for each selected annotation of one another variable (either a primary or a new variable). For instance, knowing two annotation variables X (a primary variable) and Y (a new variable to fill), where X has the following annotations values: {x1; x2; x3; x4; x5}. If x2, x3 and x4 are the selected annotations from X and the Y variable is selected as the targeted new variable to complete with the annotation x234 (named by the user), for each tip matching the value x2 OR x3 OR x4 from the variable X, the Y variable is completed with the annotation x234. The OR connector enables the aggregation of annotations. Knowing a selection of annotations from at least two variables (primary or new), PhyloType checks for each combination between them. If the combination exists, that is, for a given tip the values for the different variables are in the user’s selection, then a new annotation is inserted in the targeted variable. Rename one or several annotation(s) from a new annotation. The new name is chosen by the user. This control enables the aggregation of annotations, see also the control ‘add value(s) with an OR connector’. Select one or several annotation(s) from a variable which is in the New annotations section (primary annotations cannot be modified), then enter a new name for the new annotation and click on the Go button. This updates the New annotations section. Select the control, then select one or several annotations from a variable that is in the New annotations section (primary annotations cannot be modified), then click on the Go button. This updates the New annotations section. PhyloType User Manual v1.4 Page 8 Annotation example For each variable, PhyloType displays the frequencies of each value. For instance, the ‘Continent’ variable has five values, the first one being ‘Africa’, with a frequency of 108 (41.4% of the sequences in the tree have this annotation). Click to select create a new variable, enter the name ‘Variable01’ and then click on Go. Select several values from the ‘Country’ variable (by clicking while holding the CTRL key). Then, click on add value(s) with an OR connector, target the new variable to fill, ‘Variable01’, and then enter a name for a new annotation: ‘Africa’. Click on Go.‘Variable01’ is now filled at 41.4%. The corresponding sequences have the value ‘Africa’ for ‘Variable01’ in place of the selected values of the variable ‘Country’. To fill ‘Variable01’ at 100%, click on add remaining values, select the source and the target variables (‘Country’ and ‘Variable01’ respectively), and then click on Go. For each sequence in the tree, if there is no annotation value from ‘Variable01’, it is then copied from the corresponding value of the ‘Country’ variable. ‘Variable01’ is now ready to be used in a PhyloType analysis. PhyloType User Manual v1.4 Page 9 5 The Analysis step The Analysis step corresponds to PhyloType parameterization, computation, and access to an overview of the results. PhyloType parameterization is comprised of: Setting thresholds for the required criteria (Sz, Ps and Sz/Df) (Figure 5.1). Adding further criteria with more or less stringent thresholds. Selecting the variable to analyze (Figure 5.2). Selecting variable’s annotations to analyze (Ctrl+A to select all annotations, or use your mouse and the Shift/Ctrl keys to add/remove values). Naming the analysis at each run (Figure 5.3). Setting a number of iterations for the shuffling process (strongly recommended) (Figure 5.4). Selecting the method to compute ancestral annotations (either ACCTRAN or DELTRAN) (Figure 5.5). Once PhyloType parameterization is complete, click on the Go button. PhyloType analysis is fast, so don't hesitate to tune your parameterization over multiple analyses. For instance, start by using only the required criteria with their default thresholds. With respect to the results (overview table, Figure 6), rerun the analysis with more or less stringent thresholds or add/remove criteria. Shuffling is highly recommended. Hint Start your analysis with 100 iterations, for example, and use 1,000 iterations once your PhyloType parameterization seems appropriate. Remember to rename the analysis at each new computation. PhyloType User Manual v1.4 Page 10 Figure 5. Screenshot of PhyloType Web interface, the Analysis step. The Web interface of the Analysis step is composed of five panels. The first panel (1) deals with the selection of criteria and their parameterization. The criteria Sz, Ps and Sz/Df (foreground color orange) are always required. By default, their thresholds are 2, 1 and 2 respectively. In this example ‘Sp’ is selected as an additional criterion with a threshold value of 0.7. The second panel is used for the selection of annotations (2): selection of a variable (‘Country’ in this example) and selection of one or several annotation(s) to study (or all, as in this example). A third panel (blue background) integrates an entry for naming the analysis (‘a01’ in this example) (3), switching on/off the shuffling process with its number of iterations (4) and choosing the method for the inference of ancestral annotations (ACCTRAN or DELTRAN, with or without taking into account the tree outgroup). The process is activated by clicking on Go. The corresponding analysis is computed in a few seconds and, if the shuffling process is activated, each iterative step is displayed during the computation (6). Lastly, a table is returned at the bottom of the window with an overview of the results (7). All analyses are saved by PhyloType User Manual v1.4 Page 11 PhyloType. You can go back to an overview table of a given analysis without rerunning the computation. To do this, simply select the analysis you want to visualize (8) and click on the Display button. To access the detailed results of an analysis, press the arrow ( ) (9) and select the Output tab. Figure 6. Screenshot of the Overview table in the Analysis step. This table lists annotations for which phylotypes have been found, and the mean values for each criterion. The first row of the table contains a reminder of PhyloType parameterization (1) and, if a shuffling process has been used, a menu to select phylotypes given a p-value threshold for the Sz criterion (2). In this example, the analysis was called ‘A01’; 4 phylotypes were found covering 71 % of tips of the tree and corresponding to 4 different annotations. These 4 phylotypes are supported with a p-value <= 0.05 for the Sz criterion. The first column of the table, named ‘A’, displays the annotations associated with the phylotypes found by the analysis (3). The second column, ‘P’, contains the number of phylotypes associated with each annotation. The third criteria ‘Cov %’ (Coverage) displays the percentage of taxa annotated with the corresponding annotation and phylotype(s). In this example, 88% of the ‘Africa’ sequences in the tree belong to only one phylotype. The following columns display mean values for each criterion. Criteria with an orange background are the required criteria Sz, Ps and Sz/Df (4). The criteria with a green background are the additional criteria selected by the user for phylotype identification (in this example, Sp was used as an additional criteria) (5). The other criteria (grey background) are calculated by PhyloType but are not used for identifying phylotypes. By clicking on the column’s name (first row), the user can sort values by alphabetical order (annotation, as shown in this example with light green background) or by increasing/decreasing values (criteria). Click on the arrow button ( ) to access the detailed results of the analysis, the Output step (6). PhyloType User Manual v1.4 Page 12 Table 2. The criteria for the identification of PhyloType. Sz ≥ Ps ≥ Sz/Df Tt ≥ Df ≤ Sl Sg ≥ Dv Sl/Dv Sg/Dv Sp Spg ≤ ≥ ≥ ≥ ≥ ≥ size, number of strains in the phylotype; only strains with studied annotations are counted and considered as belonging to the phylotype (see article for formal definition). persistence, number of generations with studied annotations, starting from the phylotype root. ratio of size (Sz) and different (Df). total number of strains (without regard to annotations) in the subtree associated to the phylotype. different, number of subtrees with different annotations included in the phylotype (see article for formal definition). local separation, length of the branch from which the phylotype stems. global separation, value of a weighted combination of local separation, starting from the phylotype root and considering all its ascendants all the way to the tree root; this combination is always larger than the original local separation value, and places more emphasis on the local separation of the phylotype than on those of its ascendants. diversity, average root-to-tip distance among phylotype strains. ratio of local separation (Sl) and diversity (Dv). ratio of global separation (Sg) and diversity (Dv). support (e.g. bootstrap) of the phylotype. global support, value of a weighted combination of local support, starting from the phylotype root and considering all its ascendants all the way to the tree root; this combination is always larger than the original local support value, and places more emphasis on the local support of the phylotype than on those of its ascendants. PhyloType User Manual v1.4 Page 13 6 The Output step The Output step of the PhyloType pipeline covers the detailed results of a PhyloType analysis. These details results are: (1) a list of phylotypes, (2) a phylotype map, (3) trees with colorencoded phylotypes, and (4) trees with color-encoded ancestral annotations. 6.1 Phylotype table The table lists all phylotypes found by the analysis (Figure 7). If a shuffling process was used, the detailed list displays phylotypes for a given Sz p-value threshold. You can switch to another p-value threshold by using the corresponding menu (Figure 7.1). If you switch to another kind of output (Figure 7.2), for instance the phylotype map, you have access to the phylotype map with the same Sz p-value threshold. You can also access a phylotype map with another p-value threshold by using the Sz p-value threshold menu again. Each phylotype has a unique number in the first column named ‘Pi’ (Figure 7.3). This number is the node identifier (from the tree) linked to the root of phylotype. The second column, named ‘Anc’, is a phylotype identifier, ancestor to the phylotype. In this example, the phylotype Pi=1 (Africa) is the ancestor of two other phylotypes: phylotype Pi=251 (EastEurope) and phylotype Pi=14 (Greece). The phylotype Pi=1 does not have phylotype ancestor (then the Anc value is set to ‘root’). The third column named ‘A’, is the associated annotation. The associated background color is specific to each phylotype and is the same as that used with the other outputs (phylotype map and tree with color-encoded phylotypes). The ‘Cov %’ column displays the percentage of taxa annotated with the corresponding annotation that belongs to the phylotype. In this example, 88% of the ‘Africa’ sequences in the tree belong to the phylotype Pi=1. The following columns are related to the values for all the PhyloType criteria. If a shuffling process was used, p-values are shown in magenta (only for the criteria used in the identification process, except for Sp and Spg criteria; Figure 7.4). The S column gives the list of strains inside a phylotype (Figure 7.5). The last column, AnB (‘Ancestor Break’), displays ancestral annotations between the phylotype and its ancestor (if one exists) if these annotations are different from those of the ancestor and the phylotype. The table can be ordered by clicking on column titles (first row of the table). Figure 7. Screenshot of the Output step, the detailed list of phylotypes. PhyloType User Manual v1.4 Page 14 6.2 Phylotype map The phylotype map is a tree-like view of phylotypes. Phylotypes are organized with respect to tree topology, with their hierarchical relationships. The map display is split into two parts. The left part is a global view of the map (Figure 8a.1) and the right part is a zoom-in view of the map (Figure 8a.2). Move the blue rectangle (Figure 8a.3) from the global view to navigate around the map and update the local view. Resize the blue rectangle (by grabbing the bottomright corner) to modify the zoom ratio. Each phylotype is represented by a circle with a size proportional to its Sz value. Each phylotype is annotated with its annotation and the identifier of the node. Knowing this node’s identifier, you can access all the information related to the phylotype (Figure 8a.4). Figure 8a. Screenshot of the Output step, the phylotype map. PhyloType User Manual v1.4 Page 15 The phylotype map may include phylotypes with a red label (the label of a phylotype is composed by its node identifier with its annotation) (Figure 8b). Such phylotypes have a break in ancestral annotations, meaning that there are ancestral annotations between the phylotype and its ancestor (if one exists) which are different from those of the ancestor and the phylotype. This information corresponds to the ‘AnB’ column of the phylotype lists. For instance, Figure 8b displays a red phylotype, 789:EasternEurope, which has a phylotype ancestor, 1:CentralAfrica. The break in ancestral annotation means that there are one or more nodes between the two roots of these phylotypes that are not annotated, neither CentralAfrica nor EasternEurope. The phylotype map legend indicates that this break is due to one or more nodes being annotated as SouthernAfrica. Figure 8b. Screenshot of the Output step, the phylotype map. PhyloType User Manual v1.4 Page 16 6.3 Tree with color-coded phylotypes The phylogenetic tree is displayed with color-encoded phylotypes for a given Sz p-value threshold (Figure 9.1). The color palette for phylotypes is the same as that used for the phylotype map. The display is split into two parts. The left part is a global view of the map (Figure 9.2) and the right part is a zoom-in view of the map (Figure 9.3). Move the blue rectangle (Figure 9.4) from the global view to navigate the tree and update the local view. Resize the blue rectangle (by grabbing the bottom-right corner) to modify the zoom ratio. Each phylotype is annotated the identifier of its associated node. Knowing this node’s identifier, you can access the information related to the phylotype (Figure 8.5). Different kinds of phylotype color-coding (background or foreground) and different kinds of tree shapes are available (Figure 8.6). A red dot posted on an internal edge of the tree indicates a non-unique ancestral annotation. Figure 9. Screenshot of the Output step, the tree with color-coded phylotypes. PhyloType User Manual v1.4 Page 17 6.4 Tree with color-coded ancestral annotations The phylogenetic tree is displayed with color-coded ancestral annotations (Figure 11). Nonunique ancestral annotations are represented with a unique identifier corresponding to a given combination of annotations. Figure 11. Screenshot of the Output step, the tree with color-coded ancestral annotations. PhyloType User Manual v1.4 Page 18 7 Downloading PhyloType output To download PhyloType output click the arrow button ( ) (top-right of Output, Figure 11.1). Make sure you have selected the correct Sz p-value threshold (Figure 11.2). All PhyloType outputs are listed here. You must select one or several file formats, if available (Figure 11.3): JPG, a bitmap output. PS (PostScript), vector output for a high quality graphic image. May be viewed with GSview, a graphical interface for Ghostscript, an interpreter for the PostScript page description language used by laser printers. SVG, the W3C standard Scalable Vector Graphics (SVG) file format, high quality graphics. You can use the free Inkscape vector graphics editor, a powerful and convenient drawing tool that is fully compliant with XML, SVG, and CSS standards. Annotations are available in CSV format. The file integrates the primary annotations but also any new annotations built in the Annotation step. This format saves the table’s column layout for use with nearly any spreadsheet application. After selecting the files, click on the Go button (Figure 11.4) and wait until the .zip file is available to download (Figure 11.5) Figure 11. Screenshot of the Output step, downloading PhyloType output. PhyloType User Manual v1.4 Page 19