1
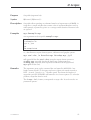
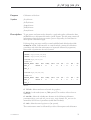
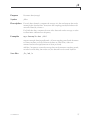
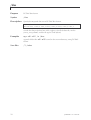
µGRAPH The Micro Graphic Data Analyzer Visualization Data Analysis File Formatting BETA VERSION JUNE 2004 User’s Manual MGR v1.9 Release 3 How to contact EDAS François Beauducel Software developer, technical support, bug reports. Observatoire Volcanologique et Sismologique de Guadeloupe Le Houëlmont, 97113 Gourbeyre, Guadeloupe, FWI @ [email protected] http:// www.ipgp.jussieu.fr/~beaudu/mgr.html Michel Van Ruymbeke EDAS Project manager. André Somerhausen EDAS hardware and software developer. Observatoire Royal de Belgique Avenue Circulaire 3, 1180 Bruxelles, Belgium @ [email protected] http:// wwww.oma.be/KSB-ORB/D1/LABO/edas µGRAPH User’s Manual © François Beauducel, 1995-2004 by FBSoft. Written in Paris, Brussels, Yogyakarta, Guadeloupe & Lanzarote, May 2004. Contents Contents iii Getting Started 5 Introduction ................................................................ ................................................................................................ ........................................................................................... ........................................................... 6 Basic Operations ................................................................ ................................................................................................ .................................................................................... .................................................... 9 Command Summary 11 General Purpose Commands ................................................................ ............................................................................................... ............................................................... 12 Importing Data Files ................................................................ ................................................................................................ ............................................................................ ............................................ 12 Data Processing ................................................................ ................................................................................................ .................................................................................... .................................................... 13 Exporting Data File ................................................................ ................................................................................................ .............................................................................. .............................................. 14 Graphics ................................................................ ................................................................................................ .............................................................................................. .............................................................. 14 Reference Technical Notes 17 126 References and Acknowledgments................................ Acknowledgments ................................................................ ....................................................................................... .......................................................128 .......................128 Index v1.9 Release 3 131 iii Contents iv µGRAPH User’s Manual Getting Started v1.9 Release 3 5 Getting Started Introduction What is µGRAPH? µGRAPH is a simple tool to help analysis of time data series. It reads regular raw ASCII data files, offers standard processing, and produces an interactive and intuitive visualization via time referenced graphics. Results can be exported in new file under various data formats or GIF image. Other software’s allow to produce high-quality graphics, but usually require the very last update of computer performances as soon as you want to process large data files… µGRAPH is a tiny stand-alone MS-DOS program “mgr.exe“ (about 100 Kb), running with standard graphic display and processor 80286 or higher. It does not need RAM and can handle up to 30 channels and 200 files together of unlimited size because all the processes are sequential. All options can be specified on a single line at the MS-DOS prompt or into alias script files, such as full automatic processing / graph outputs are allowed. µGRAPH can be used in three different ways: From almost any ASCII data file(s), process data (filtering, extraction, averages, regression, arithmetic...), change date, time and data formats with a set of options on the MS-DOS command line; Visualize these data file(s) as time referenced graphics in an interactive mode (channel selection, scale adjustment, zooming, simple formula and data fitting,…), with keyboard or mouse functions, and export the final graphic in a GIF image; View graphics in real-time from EDAS data-loggers connected on the serial port. The syntax of µGRAPH is (brackets stand for optional arguments) mgr filename1 [filename2 ...] [/options] [@script1 [@script2 …]] and you get a graph of your data and/or processed data file! The Figure 1 shows basic principles of µGRAPH. 6 µGRAPH User’s Manual Getting Started ASCII data file(s) EDAS data logger Date & time / data processing DOS prompt / BATCH / Script file Visualization / graphic analysis Formatted ASCII data file Graphic User Interface GIF image Figure 1. Basic principles of µGRAPH: Inputs, outputs and interfaces. Installing µGRAPH µGRAPH is delivered as a single software package “mgrpack.exe”, autoextractable zipped file, small enough to be stored on a floppy disk, which contains all the files (executable, help and documentation). If you want to access to µGRAPH from any of your data directories, it is advised to install it in your MS-DOS path. For correct installation, use the following steps: 1. Execute the package by double-clicking on it, or under a MS-DOS prompt window C:\TEMP\mgrpack 2. Execute the BATCH file “install.bat” C:\TEMP\install 3. To access µGRAPH from any directory, reboot your computer; otherwise, call c:\mgr\mgr from the MS-DOS prompt or in your BATCH files, instead of “mgr”. µGRAPH Package Contents Strictly speaking, µGRAPH can run properly with the only file “mgr.exe”. v1.9 Release 3 7 Getting Started However, to be fully functional, it needs three other files in a directory included in your MS-DOS PATH: mgr.exe Main executable. mgr_help.dat On-line help file. mgr_tide.dat Earth tide wave list. mgr.ini Script initialization file day.exe Date & time converter. The other files provided in the package are: mgr.pdf User’s manual (this document). example.clb Example of calibration file. example.bok Example of book file. example.dat Example of data file. example2.dat Example of data file with header. readme.txt Information for installation. lisezmoi.txt Full history of previous updates (in French). µGRAPH Philosophy µGRAPH has been first developed for data processing of the µDAS data-logger (Micro Data Acquisition System®), and was named at this time µDAS Grapher. It has been written during my doctorate thesis field missions supported by IPGP and ORB, from 1995 to 1997, and a lot on my personal free time. In 1996, it became a part of the EDAS (European Data Acquisition for Scientists) project of the Royal Observatory of Belgium (ORB). The related functions, specific to these materials, are still supported and have been extended to recent EDAS hardware’s and software’s. In this framework, it has been oriented to help the work on data acquisition stations in natural conditions, i.e., using very basic portable computers (for instance, without Windows and RAM) and with a special need of fast and simple manipulation, in order to get a quick view of the data in the field. Regarding these constraints, we tried to make the software as simple as possible, with a lot of automatic settings. On the other hand, the intuitive aspect and quickness of the program have encountered so much success, that it is presently used also on desk computers to process a large range of files and data types. For this reason, it has been recently renamed µGRAPH and is currently used by various laboratories / observatories in the world for data analysis. Since µGRAPH is mainly used by students, technicians and researchers for monitoring / routine data processing an research, it must be efficient and must answer to general and specific problems. For this reason, µGRAPH is an evolutionary software: Do not hesitate to contact us if you feel that additional functions of general interest may be added! 8 µGRAPH User’s Manual Getting Started Basic Operations Getting Help Running the program without any argument will launch the on-line help. You will have access to a set of 10 pages (using arrow keys or page number) that covers most of the options of µGRAPH. A Windows help file is provided with the software package: “mgr.hlp”; it offers an interactive document with cross links and can be open under Windows 3.1, 95, 98, 2000, NT and XP. The present document is also available in a PDF file: “mgr.pdf”; it can be read and printed on any operating system with the Adobe Acrobat Reader. See the Web site http://www.adobe.com to get the software (free download). Execute the example script For a quick demo of µGRAPH possibilities, go to the program directory and type: mgr @example.mgr This produces the following graph: v1.9 Release 3 9 Command Summary This chapter lists µGRAPH commands by functional area. There is two categories of commands: the arguments (DOS prompt, Batch and script files); the keyboard and mouse functions (GUI = graphic user interface). Since some of the commands have an equivalent in both categories, GUI function keys are noted in left margin when applicable. v1.9 Release 3 11 Command Summary General Purpose Commands Help Alt H no argument Display on-line help Main Commands filename / @ /com /test /tmp Import the file filename as data Option Script file (argument list) Connect to an EDAS data logger on port COM Test the file(s) format and display information Change directory for temporary files Exit default Alt X / F10 Automatic exit after exporting data or GIF using argument commands (not GUI) Exit (GUI) Importing Data Files Main Commands default /i /ic /im /x /xt All columns imported as data channels Specify column format (date, time and data) Interpret coma as decimal point Interpret minus as separator Exclude first lines Exclude lines with text Multiple Files Alt F1 default /a /merge Append channels (for visualization only) Append files in time Merge files using common time reference Date and Time Ctrl 12 F1 /b /e /it /nt /r /s /sort /tr /y /yn Extract from specific date & time (begin) Extract until specific date & time (end) Impose a sample period Exclude time recovering Center data versus sample period Time lag Sort time Time restore Specify date & time reference Specify date & time reference from filename µGRAPH User’s Manual Command Summary Preset Formats defaults /l /das /mdas /reunion Files with µGRAPH header or µDAS binary files LTERM capture files PC-DAS shot files MDAS shot files (µDAS v4) Reunion tiltmeter binary files Data Processing Calibration / Channel Names and Units /c /cn /cf /cv /cg Apply full calibration on the data Use only names & units Calibrate in frequency (DAS processes only) Calibrate in voltage (polynomial factors) Calibrate in physical unit (general factor & constant) Filtering Alt T Alt S /d /df /ed /fx /nan /spike /vm /vn Decimate data (average) Apply moving average Extract data (under sampling) Remove noise (differential threshold criteria) Define Not-a-Number value Remove noise (intelligent criteria) Remove noise (maximum threshold criteria) Remove noise (minimum threshold criteria) Data Fitting Alt O L Alt W F7 Alt /do /dl /dh Remove offset (mean value) Remove trend (linear regression) Remove first harmonics (sinusoidal decomposition) Data fitting preview (GUI) Specific Calculations Alt C D F8 Shift F8 Alt Shift F7 v1.9 Release 3 /dc /dd /f /hicum /m Compute cumulative sum Compute derivative Compute formula (arithmetic) Compute periodic histogram (HiCum) Retrieve over-scales from DAS shots Show over-scales limits (GUI) 13 Command Summary Exporting Data File Main Commands default F1 F1 F1 /nh /o /t Data exported after import options and data processes application, with space-separated columns and µGRAPH header No header Specify output data filename Export data and specify column format Formatting Options /iso /os /shot /tf /xi ISO standard for date and time Specify column separator Keep 5-digit shots for DAS data Export numerical data format No information lines in header Graphics Main Commands graph_string Shift F1 I / F2 Alt default /g /gif /test All channels on separated axis, solid lines Specify graphic type (channels and styles) Make GIF image Display statistical information on data (GUI) Graph Parameters Alt F2 F2 Shift F2 F6 Ctrl F6 Shift F6 Alt F6 Ctrl /bk /c /c default /g /g /gd /lw Adds time event marks (book) Define or change channel names and units Define or change graph title Return to original channel colors Define line type Define marker type Turns grid off Use heavy lines Display Features Ctrl F9 F9 Shift F9 /novga /pe /sc /vga Use EGA/CGA video mode Use full screen (no header window) Specify screen color mode Specify display resolution mode Scale, Scrolling and Zooming + – Alt Z 14 /zb X-axis zoom in X-axis zoom out X-axis zoom begin µGRAPH User’s Manual Command Summary Alt Z /ze arrows Home End Esc F5 Shift F5 F4 default default /es /fs X-axis zoom end X and Y-axis scrolling Go to X-axis begin Go to X-axis end Return to X-axis full scale Magnify scales Equal scale interval for all axis Full / normalize scales Graphic User Interface Menu Alt F Alt A Alt V Alt G Alt N Esc v1.9 Release 3 default Display the File menu Display the Data menu Display the View menu Display the Graph menu Display the Screen menu Return to main GUI menu 15 Reference This chapter describes all µGRAPH command line options and menu functions, in alphabetic order. The Graphic User Interface functions are referenced as GUI function key. v1.9 Release 3 17 18 µGRAPH User’s Manual @ Scripts Purpose Script files (argument list) Syntax @filename1 [@filename2] … Description Script files allow specifying an unlimited number of arguments to µGRAPH. A script file is a simple text file that contains a list of argument (filenames and/or valid options), separated by spaces or a carriage return character. Recursive calls are ignored. Examples mgr @example.mgr uses arguments in the script file example.mgr: example.dat /mdas /c:example.clb /g:1.2,,|b4 /pe /bk:example.bok i.e., data filename, import format options, calibration and graphic options. mgr sta*.dat /a @stafmt.mgr @stadsp.mgr /gif will append all the files sta*.dat, using the import format options in stafmt.mgr script file, display the data using graphic options in stadsp.mgr script file, then export the result in a GIF image (named mgr.gif in this case). Remarks The arguments given on the command line are limited by MS-DOS®: line length cannot exceed 127 characters and some of them are strictly reserved to DOS: , (coma), | (pipe), <, >, " (double quote). This limits the number of arguments passed to µGRAPH and limits the use of some options. To solve this problem, script files must be used. The file mgr.ini, if exists, is interpreted as script a file. It can be used to set permanent options. v1.9 Release 3 19 /a Purpose Append files in time Syntax /a Description By default, channels of multiple files are concatenated. The /a option append them in time, thus the files must have the same number of channels. Examples mgr file1.dat file2.dat /a where the two files have 8 channels for instance, appends the files and display data as a unique continuous file of 8 channels. On the contrary, mgr file1.dat file2.dat concatenates the files and display 16 different channels. Remarks If the /a option is forgotten when loading a large amount of files, it will usually produce an error because the number of channels is limited to 30 (from A to U), while total number of imported files is limited to 200. See Also /merge, limitations 20 µGRAPH User’s Manual /b Purpose Extract data from a specific date and time (begin) Syntax /b:time_string Description Specify a begin date and time by time_string to keep only data with time reference after this limit. Examples mgr example.dat /i:ymdhns /b:9509181520 imports data in MDAS format with date and time after 1995-09-18 15:20:00. Remarks This option applies after all other time and date options have been taken into account. For instance, it supposes that date and time format has been correctly defined with import options. See Also /e v1.9 Release 3 21 /bk Purpose Add time event marks on graphics Syntax /bk:filename Description Display dashed areas on the background of graphics, to mark specific time events related with data (for instance intervention on the station), using filename, a text file containing lines in the following format: begin_time end_time [level [text_info]] where begin_time is the begin date and time of event (time_string format); end_time is the end date and time of event (time_string format); level is a number to determine the type of dashing: 0= (default), 1= , 2= , 3= , 4= , 5= , 6= , 7= , 8= , text_info is ignored and can be used to describe the event. Examples mgr example.dat /i:ymdhns /bk:example.bok displays 3 different types of events below the example data file. The file example.bok is: 9509161530 9509161800 0 Electronic checking 9509190705 9509190715 6 Seismic event 9509200500 9509200515 2 Data transfert See Also 22 /c µGRAPH User’s Manual /c /cf /cg /cn /cv Purpose Calibration of the data Syntax /c:filename /cf:filename /cg:filename /cn:filename /cv:filename Description To give names and units to the channels, a graph title and to calibrate the data, µGRAPH uses a calibration file with a specific format. This file must contain all information about the data you want to process. Especially, for DAS data for what specific calculations apply. If filename does not exist, it will be created and filled with default values (like example.clb). Calibration file is a text file which contains all calibration parameters and other data information as keywords followed by arguments, then a table of parameters for each channel: # TITLE: text_title # BOOK: begin_time end_time [level] # BOOK: begin_time end_time [level] # VALID: begin_time end_time # LAG: hour SENSOR_NAME UNIT DIV Chan_1 unkwn 1 FREQ FACT CST A0 … A3 B0 … B3 0 1 0 0 0 1 … 0 FREQ FACT CST A0 … A3 B0 … B3 0 1 0 0 0 1 … 0 … Chan_2 … … # VALID: begin_time [end_time] # LAG: hour SENSOR_NAME UNIT DIV Chan_1 unkwn 1 … Chan_2 … where: # TITLE: define text line used as title for graphics; # BOOK: book marks (same as /bk option). The number of these lines is unlimited; # VALID: define the validity time domain of the following calibration parameters (begin_time and end_time in time_string format). end_time can be omitted for the last set of parameters (valid until last data); # LAG: define the time lag (same as /s option); These information must be followed by a table of description and calibration v1.9 Release 3 23 /c /cf /cg /cn /cv parameters for each channels, separated by spaces: SENSOR_NAME = sensor name (16 characters max.); UNIT = physical unit name (7 characters max.); DIV = 2, 16 or 128 = frequency divisor, for DAS data (set in µDAS box); FREQ = initial frequency, in Hz, for DAS data shots only; this frequency value will fix the number of over-scales at the beginning of the file; 0 value also means no change from previous data and -1 value means the sensor is a real counter (not FM signal), thus, time sampling will not be applied and decimation will compute the sum (and not the average) of the data. FACT and CST = general factor and constant of calibration applied after the polynomial, (physical unit per Volt for DAS data); A0 to A3 and B0 to B3 = 3rd order polynomials factors (in Volt per Hz for DAS data); by default, all factors equal 0 except A1 = B0 = 1; The complete calibration formula is given by the relation: a0 + a1 x + a2 x 2 + a3 x 3 d = fact + cst b0 + y1 x + b2 x 2 + b3 x 3 where d is the calibrated data, and x is original data (frequency in Hz for DAS data). A single calibration file can be used to specify several calibration parameters varying in time. The two lines # VALID and # LAG, followed by a new table of parameters for each channels can be added below the previous ones. This allows to describe, for instance, the evolution of sensors parameters on the same station. There is five ways to use a calibration file: Examples /c = apply full calibration; /cn = apply only names, units and book marks for graphics; /cf = calibrates data in “Frequency unit” (apply only DIV, FREQ and SENSOR_NAME); /cv = calibrates data in “Voltage unit” (apply only DIV, FREQ, 3rd order polynomials A0 to B3 and SENSOR_NAME); /cg = calibrates data in "Geophysical units" (only FACT, CST and SENSOR_NAME and UNIT). mgr example.dat /i:ymdhns /c:example.clb uses default calibration file to name channels of example data file and give a title. 24 µGRAPH User’s Manual /c /cf /cg /cn /cv Remarks Calibration file format of previous versions are still accepted, µGRAPH detects the header line to read them normally: Versions up to 1.8a: DIV FREQ FACT CST X X^2 X^3 UNIT UNIT NAME NAME Versions up to 1.6a: DIV FREQ CST X X^2 X^3 Attention: Attention: the variable CST in these old files correspond to A0 in the new version and not CST which is now applied after the multiplication by FACT. See Also v1.9 Release 3 /bk, filename, /m, /s, time_string, CtrlF2, AltF2 25 /com Purpose Real-time graphics for µDAS data logger Syntax /comx /comx:nnn Description Connect to an EDAS data logger via the COM port x (1 or 2) and display graphic of the data in real-time, after at least 2 data are received. Most of the functions are then allowed (zoom, scales, analysis, exporting, …), except formula. The first syntax is used for µDAS EEPROM v4 or previous, the second syntax is for higher versions, when specifying the µDAS or nanoDAS identification number nnn (between 001 and 255). Examples mgr /com1 connects to a µDAS EEPROM up to v4 on the COM port 1. mgr /com2:1 connects to a µDAS EEPROM greater than v4 or nanoDAS with identification number 1, on the COM port 2. 26 µGRAPH User’s Manual /d Purpose Decimate data (average) Syntax /d:n Description For each data channels, computes the average of n data and imports the result, starting by the first data line. It increases the sampling period (and reduces the amount of data) by a factor n. For DAS shot data, computes the sum of the data and not the average, in order to allow future calibration in frequency. Examples mgr @example.dat /d:6 imports example data (originally with a 10-min sampling period) and decimates to obtain one data per hour. Because the data are DAS shots, values are summed and not averaged (amount of shots per hour). Add the /r option to center the average data on the new time sampling period, in order to avoid delay; but in this case, the data will not be causal anymore. See Also v1.9 Release 3 /b, /ed, /r 27 /das Purpose PC-DAS data format Syntax /das Description Specify that imported data are in PC-DAS files format: DD/ MM/YY HH NN Chan_1 Chan_2 Chan_3 Chan_4 Chan_5 Chan_6 Chan_7 Chan_8 it reads the date in the first line of file, applies it for all the data file, sets the format_string to hn*, and the file type to DAS (shots). Examples mgr u@*.m95 /a /das appends all the files u@*.m95 located in the current directory, using PC-DAS format. See Also 28 /l, /mdas µGRAPH User’s Manual /dc Purpose Cumulative sum Syntax /dc Description Compute the cumulative sum for all channels i Di = ∑d j . j =1 During the graphic visualization, use F3 to return to original data (undo). GUI Alt See Also /dd, F3 v1.9 Release 3 C 29 /dd Purpose Difference Syntax /dd /dd:n Description Compute the difference between 2 or n consecutive data for all channels. If a regular sample period T has been detected, it computes Di = di − di − n +1 T ti − ti − n +1 which is the approximate derivative normalized by T (per sample period). Otherwise, it divides by the time interval (in second) and give values expressed in data unit per second. During the graphic visualization, use F3 to return to original data (undo). Remarks When n is more than 2, it is equivalent to differentiate after applying a moving average filter on n data. GUI Alt See Also /dc, /df, F3, AltD, sample_period 30 D µGRAPH User’s Manual /df Purpose Moving average filter Syntax /df:n Description Compute the moving average on n consecutive data for all channels (low pass filtering) Di = 1 n i ∑d i j = i − n +1 During the graphic visualization, use F3 to return to original data (undo). GUI Alt See Also /dd, F3 v1.9 Release 3 T 31 /dh Purpose Harmonic correction Syntax /dh:n Description Correct phase data from its first 4 harmonics. The number n is equal to the decimal value of binary combination of harmonics, where harmonic #1 = 1 (fundamental), harmonic #2 = 2, harmonic #3 = 4 and harmonic #4 = 8. For instance, n = 15 corresponds to the sum of harmonics # 1+2+3+4. During the graphic visualization, use F3 to return to original data (undo). Examples mgr tide.dat /hicum:s2 /dh:1 computes a periodic histogram on wave S2, then removes the fundamental to give the residue. GUI Alt See Also /hicum, F3, F7, AltI 32 W µGRAPH User’s Manual /dl Purpose Linear correction Syntax /dl Description Correct all channels from its linear regression (trend). During the graphic visualization, use F3 to return to original data (undo). GUI Alt See Also /do, F3, F7, AltI v1.9 Release 3 L 33 /do Purpose Mean value correction Syntax /do Description Correct all channels from its mean value (offset). During the graphic visualization, use F3 to return to original data (undo). GUI Alt See Also /dl, F3, F7, AltI 34 O µGRAPH User’s Manual /e Purpose Extract data until a specific date and time (end) Syntax /e:time_string Description Specify end date and time by time_string to keep only data with time reference before this limit. Examples mgr example.dat /i:ymdhns /e:950920 imports data in MDAS format with date and time before 1995-09-20 00:00:00. Remarks This option applies after all other time and date options have been taken into account. For instance, it supposes that date and time format has been correctly defined with import options. See Also /b v1.9 Release 3 35 /ed Purpose Extract data (under sampling) Syntax /ed:n Description For each data channels, imports one data every n data, starting with the first data. It increases the sampling period (and reduces the amount of data) by a factor n. Remarks This option must be used under special conditions, since it does not respect the Shannon’s theory and could generate aliasing. Prefer /d the option to decimate data. See Also /d 36 µGRAPH User’s Manual /f Purpose Compute formula Syntax /f:formula_string [/f:formula_string] … Description Creates new channel(s) as the result of an arithmetic combination of existing channels, using formula defined by formula_string. Several formula can be specified, in order to use the result of the previous one, for instance. Accessing to formula needs a single data file or multiple files in append mode (/a). For concatenated files, use the merge function first (/merge). The first formula applies eventually on result of data calculations like derivative, cumulative sum, mean and linear corrections. Examples mgr @example.mgr /dd /f:12/2 /f:4-3 /g:5#6 imports example data, computes the derivative of all channels, creates a new channel (5th) as the average of 1st and 2nd, creates a 6th channel as the difference between 4th and 3rd, and plots the results on separated axis. Remarks Because some of the formula_string characters are reserved to DOS, prefer script files to specify formula. GUI F8 See Also @, /a, formula_string, /merge v1.9 Release 3 37 filename Purpose Specify a file Syntax [drive:][directory]filename[.extension] Description Data filename is the main arguments passed to µGRAPH. It uses DOS syntax to specify where the file is and its name: drive: is the letter of drive disk followed by : (default is current drive); directory is the path of folders, separated by \ and using .. for up directory (default is current directory of the drive); filename is a string of 8 characters maximum; extension is a string of 3 letters maximum, separated from the filename by . (default is all files corresponding to filename). For the data filename arguments, group of files can be specified using * (star) and ? to replace group or single characters of the filenames and access multiple files. Examples mgr c:\mgr\example.dat mgr ..\data\sta*.asc /a Remarks µGRAPH uses the dir DOS function to interpret filename argument(s) and access files. See MS-DOS documentation for a complete review of filename possibilities. See Also @, /bk, /c, /gif 38 µGRAPH User’s Manual format_string Purpose Column formatting Syntax channels {[xymdhnsbi.]} {gtlkq} Description The format_string allows to define each column meaning (time and data) for import (/i) and export (/t) data file formatting. One character, or expression between brackets, stands for one column: 1 to 9 then A to U = channel number * = all channels in order (automatically added if no channel character is specified) x = unused column (NaN for export) y = year (after 1970) m = month (01 to 12) d = day in month (01 to 31) j = ordinal day (001 to 366) h = hour n = minute s = second b = month name (3 letters) t = Matlab’s datenum format (floating number of days since January 1, 0000) i = data index or phase (as x-axis) . = fractions of time, can be added after date and time characters for export [...] = group into one column, without separator (the dot is allowed) Here is some shortcut letters and their equivalent: g = [yyyymmdd] l = [hhnnss] k = [hhnn] q = [hh.nn] Examples /i:* Chan_1 Chan_2 Chan_3 Chan_4 … imports all column as data channels (default import format if no header is present and no preset format specified). /i:1ymd[hhnn]23 Chan_1 YYYY MM DD HHNN Chan_2 Chan_3 v1.9 Release 3 39 format_string imports a file with channel 1, year, month, day, concatenated 2-digit hour and minutes, and channels 2 and 3. /t:ymds134 YYYY MM DD SSSSS Chan_1 Chan_3 Chan_4 exports a file with 4-digit year, month, day, seconds in the day (from 0 to 86399) and channels 1, 3 and 4. /t:yj.* YYYY JJJ.jjjjj Chan_1 Chan_2 … exports a file with 4-digit year, ordinal day with fractions, and all channels. Remarks For import, each letter of the format_string is interpreted independently, and the date and time is reconstructed as the sum of each. Then, order of appearance has no importance and numerical values are able to exceed their normal limits, i.e., 12 for month, 31 for days, 24 for hours, 60 for minutes and seconds. This allows a lot of possibilities in format and a very simple coding. For instance, a column that codes the number of second in a day (from 0 to 86399) will be simply coded as s. In that sense, d and j are strictly equivalent (day). For export, the principle is to never lost information on date and time, even if uncompleted formats are specified. For example: ys = year and number of seconds in the year; dn = “absolute” number of days (in fact, since 1970-01-01), and number of minutes in the day; yd = yj = year and number of day in the year (ordinal date). Thus, d and j are also equivalent at export, if only year is specified (and not the month). Indeed, the j character has been kept in order to fix 3-digit number with leading zeros, especially when using the ISO standard at export (see /iso). Fractions (dot .) are not allowed at import for year (y) and month (m), since they do not constitute regularly spaced bases (leap year, 28 to 31 days for months). In these cases, the fractions will be ignored and only the integer part will be considered. However, for the time characters d, h, n, s and j, fractionate parts will be converted in hour, minutes or second correctly. See Also 40 /i, /iso, F1, header, /t, /tr µGRAPH User’s Manual formula_string Purpose Formula coding Syntax channel {+-./\} <x> {cstelvw} Description Formula can be used to process simple calculation on channels or to keep the result of a data calculation (simply a copy of a channel). The formula_string is a combination of characters for channels and operators, read in the order of appearance: 1 to U or * = channel number, or all channels. 0 = time vector, in Unix format (number of seconds). <x> = constant number (real). + - . / \ = addition, subtraction, product, division right and left modes. All following channels will be added, subtracted, multiplied with, or divided by previous result, until an other mode encountered. Addition mode is default. l and e = logarithm (base 10) and exponential of previous result. c, s and t = cosinus, sinus and tangent of previous result (in radian). v and w = synchronised time events mode. For instance, v123 produces a function with steps where there is events on all channels 1, 2 and 3 at a same time, and flat no where else. v123w4 excludes events present also on channel 4. Examples See Also v1.9 Release 3 1.2+3/4 = (ch1 * ch2 + ch3) / ch4 123/<3>-4 = (ch1 + ch2 + ch3) / 3 — ch4 123\4 = ch4 / (ch1 + ch2 + ch3) /2 or <1>/2 or 2\<1> = 1 / ch2 12e = e(ch1 + ch2) 3l = log10(ch3) 0.<1e-8>s = sin(time*10—8) /f, F8 41 /fs Purpose Normalize scale mode Syntax /fs Description For axis with single channel, magnify the Y-axis between exact maximum and minimum, instead of rounded values, and indicates the values on axis legend. For axis with multiple channel, draws each channel on its own scale and indicates ticks as percent (unknown scale). This is useful for data comparison when scales or units are different. GUI F4 See Also F5 42 µGRAPH User’s Manual /fx Purpose Noise filtering (difference) Syntax /fxN:x Description Exclude data of channel N if absolute difference between 2 data is more than x value. If no /nan option is specified, the entire data line will be excluded. Otherwise, the single data will be replaced by NaN. Examples /fxB:50 tests the data of channel B and excludes it if abs(di—di—1) > 50. See Also v1.9 Release 3 /nan, /spike, /vm, /vn 43 /g Purpose Graphic type Syntax /g:graph_string Description Select channel to draw, line style and colors to use. This option allows to determine the first graphic pattern which will be displayed, e.g. for very large files (default is all channels on separated axis, solid lines and default colors). Examples /g:#:o1-3 plots channels 1 to 3 on separated axis with dotted line and circle markers, default colors. /g:1.2##/sb4 plots on the first axis channel 1 (solid line) and channel 2 (dots), and on the second axis (of half size), channel 4 (blue solid line and square markers). Remarks Because some of the graph_string characters are reserved to DOS, prefer script files to specify graph type. GUI any of graph_string characters, AltI See Also graph_string 44 µGRAPH User’s Manual /gd Purpose Grid off Syntax /gd Description Turns off the background grid of graphics. GUI Shift v1.9 Release 3 F6 45 /gif Purpose Make a GIF image Syntax /gif /gif:filename Description Exports the graphic in a GIF image file mgr.gif (in the current directory) or in filename. Example mgr @example.mgr /gif:example.gif produces a GIF image file named example.gif (included in the software package). Remarks To obtain the best results, use SVGA resolution (/vga), full display screen (/pe), and set the screen colors to white background (/sc). This option makes a screen copy and writes a binary file in GIF87a format, no transparency color. Prefer the .gif extension for filename if you want an automatic recognition with photo editor software’s. With /t, this option is the main batch µGRAPH function, because it forces the program to exit after all processes done, without entering GUI mode. GUI Shift See Also graph_string, /pe, /sc, /vga 46 F1 µGRAPH User’s Manual graph_string Purpose Graphic type coding Syntax channels {-*#,ve} {/:.os|} {rygcbm} Description The graph_string format allows to specify a graphic parameters in a single word. It is used both on the command line (/g) and on keyboard while visualize data (see GUI). Characters used are: 1 to 9 then A to U (uppercase) for channels; * for all channels on the same axis; - to select intervals; # or , (coma) to separate axis between channels and specify the axis relative size (for example, two comas = previous axe will be double). v (versus) to make XY graphs: next channel will be X-axis instead of time or data index. e (error): next channel will be display as error bar of the previous one. Any combination of line and marker types preceding channel(s): / = solid line (default) : = dotted line . = dots s = squares o = circles | = bars x = crosses Any of one colors preceding a channel (the number stands for default channel attribution): Examples r = red (1) y = yellow (2) g = green (3) c = cyan (4) b = blue (5) m = magenta (6) 23,,1,4 = draws channels 2 and 3 in first double size axis, channel 1 in a second axis and channel 4 in a third one; 1-4v5 = draws channels 1 to 4 versus channel 5; ,:s1-5|B = draws channels 1 to 5 with dotted line and squares, and B (11) with bars, all in separated axis; 1e4,5 = draws channel 1 using errors (channel 4), and channel 5 in a second axis. Remarks v1.9 Release 3 Because some of the graph_string characters are reserved to DOS (coma and pipe), prefer script files to specify graph type on the command line. 47 graph_string Line style is by default a continuous line between data, interrupted when the time interval exceeds 1.5 times the acquisition period. If no regular acquisition period is detected, the line is continuous. For line types, see also the F6 and Ctrl F6 keys (GUI). See Also 48 /g, ShiftF2, F6, CtrlF6 µGRAPH User’s Manual GUI menu Purpose Graphic user interface functions Syntax Any GUI functions (keyboard or mouse) graph_string + Enter {+ - Home End PgUp PgDn Esc} Description When entering GUI mode, µGRAPH displays a graph screen and a set of functions are available on keyboard or mouse (see all following GUI pages): Any graph_string character prompts for graphic string editing. Enter applies and Esc cancels. + or – keys zoom in or out in time by a factor of 2. At the bottom-left of the screen, the zoom factor is indicated (default is x1) (See also mouse functions). Left and right arrow keys () shift the view backward or forward by halfscreen, if a zoom is active. At the bottom-left and bottom-right of the graph axis, date and time interval is displayed. Home and End function keys go to the begin or end of the time interval, keeping the zoom factor. Esc returns to plain time view (no zoom) See Also v1.9 Release 3 graph_string, GUI mouse, GUI functions 49 GUI AltA Purpose Display the Data menu Syntax Alt A Esc returns to main menu Description Display the available Data menu function keys: AltO AltT Offset Linear Derivative CumSum Filter AltW WaveHarm (appears only with phase type files) AltL AltD AltC AltS Spike F3 Undo F8 Formula (appears only with single, appended or merged files) ShiftF8 Hicum (appears only with time referenced files) Example Remarks It is not necessary to use this command to access functions; this is just a help for the user. See Also GUI menu, AltO, AltL, AltD, AltC, AltT, AltS, F3, F8, ShiftF9 50 µGRAPH User’s Manual GUI AltC Purpose Cumulative sum Syntax Alt C F3 returns to original data Description Compute and display the cumulative sum for all channels i Di = ∑d j . j =1 Command /dc See Also Alt v1.9 Release 3 A, F3 51 GUI AltD Purpose Difference or derivative Syntax Alt D Approximate Derivative = n (Esc to cancel) F3 returns to original data Description Compute and display the difference between 2 or n consecutive data for all channels. If a regular sample period T has been detected, it computes Di = di − di − n +1 T ti − ti − n +1 which is the approximate derivative normalized by T (per sample period). Otherwise, it divides by the time interval (in second) and gives values expressed in data unit per second. Remarks When n is more than 2, it is equivalent to differentiate after applying a moving average filter on n data. Command /dd See Also Alt 52 A, F3 µGRAPH User’s Manual GUI AltF Purpose Display the File menu Syntax Alt F Esc returns to main menu Description Display the available File menu function keys: F1 Export ShiftF1 Make GIF AltF1 Merge (appears only with concatenated files) CtrlF1 Sort Data AltX F10 Exit Remarks It is not necessary to use this command to access functions; this is just a help for the user. See Also GUI menu, F1, ShiftF1, AltF1, CtrlF1, AltX, F10 v1.9 Release 3 53 GUI AltG Purpose Display the Graph menu Syntax Alt G Esc returns to main menu Description Display the available Graph menu function keys: F2 Info AltF2 Names ShiftF2 Title CtrlF2 Reset Colors F6 Line CtrlF6 Marker ShiftF6 Grid AltF6 Bold Remarks It is not necessary to use this command to access functions; this is just a help for the user. See Also GUI menu, F2, ShiftF2, AltF2, CtrlF2, F6, CtrlF6, AltF6, ShiftF6 54 µGRAPH User’s Manual GUI AltH Purpose Display the on-line help Syntax Alt H {0 … 9} select pages { PgUp PgDn } vertical scroll into page Esc or AltH quit or returns to previous screen Description Display 10 pages of quick help: 0. Introduction (default from command line) 1. How to use SGRAPH 2. General options and index 3. Import/export file format options 4. Data calibration 5. Data calculation options 6. Graphic options 7. Main menu functions (default from GUI) 8. Limitations 9. About SGRAPH… See Also v1.9 Release 3 mgr.hlp Windows help file 55 GUI AltI Purpose Graphic and data information See F2 56 µGRAPH User’s Manual GUI AltL Purpose Syntax Linear correction Alt L F3 returns to original data Description Correct each channel from its linear regression (trend), computed on the viewed time interval. Di = di — (ati + b). Command /dl See Also Alt v1.9 Release 3 A, F3 57 GUI AltN Purpose Display the Screen menu Syntax Alt N Esc returns to main menu Description Display the Screen menu function keys: F9 Colour/B&W ShiftF9 VGA Mode CtrlF9 Full Screen Remarks It is not necessary to use this command to access functions; this is just a help for the user. See Also GUI menu, F9, ShiftF9, CtrltF9 58 µGRAPH User’s Manual GUI AltO Purpose Syntax Offset correction Alt O F3 returns to original data Description Remove mean value of each channel, computed on the viewed time interval. Di = di — mean(di). Command /do See Also Alt v1.9 Release 3 A, F3 59 GUI AltS Purpose Syntax Remove spikes Alt S Remove spikes (STD): n Description (Esc to cancel) Remove “aberrant” data in the signal using an intelligent criteria. This function allows to remove local data points out of n times the RMS of the signal. This process cannot be undo, and will degrade the data on a regular noisy signal. Values between 5 and 10 are advised, and the process can be done iteratively. Command /spike See Also Alt 60 A µGRAPH User’s Manual GUI AltT Purpose Moving average filter Syntax Alt T Filtering (moving average): n (Esc to cancel) F3 returns to original data Description Compute the moving average on n consecutive data for all channels (low pass filtering) 1 Di = n i ∑d i j = i − n +1 Remarks Moving average applies a phase delay on the signal, equal to n/2 time sampling, in order to remain causal. Command /df See Also /dd, F3 v1.9 Release 3 61 GUI AltV Purpose Display the View menu Syntax Alt V Esc returns to main menu Description Display the View menu function keys: F4 Normalize F5 Magnify F7 Data Fit ShiftF7 OverScale Remarks It is not necessary to use this command to access functions; this is just a help for the user. See Also GUI menu, F4, F5, F7, ShiftF7 62 µGRAPH User’s Manual GUI AltW Purpose Harmonic correction Syntax Alt W Enter harmonic binary combination (1 to 15): n F3 returns to original data Description Correct phase data from its first 4 harmonics. The number n is equal to the decimal value of binary combination of harmonics, where harmonic #1 = 1 (fundamental), harmonic #2 = 2, harmonic #3 = 4 and harmonic #4 = 8. Example n = 15 corresponds to the sum of fundamental and harmonics 2, 3 and 4. Command /dh See Also /hicum, F3, F7, AltI v1.9 Release 3 63 GUI AltX Purpose Exit Syntax Alt Description Exits the program without prompting. See Also F10 64 X µGRAPH User’s Manual GUI AltZ Purpose Zoom time interval Syntax Enter zoom begin date (YYMMDDhhnnss):time_string Enter zoom end date (YYMMDDhhnnss):time_string Description Specify a begin and/or end date and time by time_string to zoom the first graphic display. Command /zb, /ze See Also +, -, mouse v1.9 Release 3 65 GUI F1 Purpose Export data and specify column format Syntax F1 Output File Name: filename (Esc to cancel) Output File Format: format_string [ Merge Files (Y/N): {yn} ] [ Include File Header (Y/N): {yn} ] Description Writes data corresponding to the displayed time interval, in a new ASCII file filename, using column formatting format_string, and optional text header. filename can be any valid DOS file name. By default, a name is proposed that corresponds to the one defined by /o command (if apply), or an automatic name constructed from the first data file name with an extension in format .$nn, where nn is a number between 00 and 99. format_string defines the column formatting. By default, the import format is proposed (from /i command, text header or preset formats). If multiple files have been imported without append option /a, export them will produce a single data file containing each file concatenated with a header in front of each. It is here proposed to merge them. Default is no. Except if the previous answer has been no, it is here proposed to include a header in the data file. Default is yes. Command /o, /t, /merge, /nh See Also filename, format_string, AltF, AltF1, header 66 µGRAPH User’s Manual GUI AltF1 Purpose Merge concatenated files Syntax Alt F1 Merge the Files (Y/N): {yn} Description (Esc to cancel) When multiple data files have been imported without append command /a, they are concatenated: Each file is displayed sequentially with its own data channels. This function merge the channels to produce a new single file with a single time reference. If the time periods are different, or if some data are missing for a given date and time intervals, data are interpolated using the neighbor method. If a /nan command has been specified, missing data are replaced by Not_a_Number. This allows to access to formula calculation, XY axis drawing, and to export a data file with all channels in a single time referenced table. Default answer is yes. Command /merge See Also /a, AltF, F1, F8, Not_a_Number v1.9 Release 3 67 GUI CtrlF1 Purpose Sort data in time Syntax Ctrl F1 Sort the Data (Y/N): {yn} Description (Esc to cancel) Sets the data in chronological order, and if necessary, deletes redundant data. This allows faster display and clean file exporting. Default answer is yes. Command /sort See Also Alt 68 F, /nt µGRAPH User’s Manual GUI ShiftF1 Purpose Make GIF image Syntax Shift F1 Enter GIF File Name: filename (Esc to cancel) Description Exports the screen display in a GIF image file filename. Remarks The export takes few seconds while the mouse cursor disappears. To obtain best results, use SVGA resolution (ShiftF9), full display screen (CtrlF9) and set the screen colors to white background (F9). This option makes a screen copy and writes a binary file in GIF87a format, no transparency color. Prefer the .gif extension for filename if you want an automatic recognition with photo editor software’s. Command /gif See Also filename, AltF, F9, CtrlF9, ShiftF9 v1.9 Release 3 69 GUI F2 Purpose Graphic and data information Syntax F2 or AltI channels selects one channel * selects all channels F6 changes line type Ctrl F6 changes marker type F2, for phase type only, displays a second page of information Enter validates selection Esc returns to graph Description Mouse 70 Displays one or two window(s) with actual graphic and data parameters, and allows selecting channels to draw and graphic type: Gr. = graph number and line type; Name = channel name, unit and number; RMS Difference = an estimation of short term noise (root mean square of derivative) ; Resol. = smallest non-zero value between two consecutive data; Mean Value = average of displayed data (see AltO); Linear Coeff. = linear regression rate of displayed data (see AltL); Valid Data = percent of existing data calculated from global time interval and time period; Over Scale (for DAS data type only) = number of over-scale corrected (see /m); Over Range (for DAS data type only) = number of excluded data for overscale correction (see /m); Harmonic n° 1 to 4 (for phase data only) = phase and amplitude of the first four harmonics (see AltW). left-button click on a channel line = change line type µGRAPH User’s Manual GUI F2 left-button double click on a channel line = select one channel only right-button click on a channel line = change graph number right-button double click = select all/none channel left-button click on the Enter area = accept selections and redraw Command /test (partial equivalence) See Also graph_string, F7, AltG, AltI, AltL, AltO, AltW, /m v1.9 Release 3 71 GUI F3 Purpose Undo Syntax F3 Undo last_operation (Y/N): {yn} Description (Esc to cancel) Undo the last operation and return to orginal data. This function works with the following operations: offset correction (AltO); linear correction (AltL); derivative / finite difference (AltD); cumulative sum (AltC); harmonic correction (AltW); remove noise / spike correction (AltS); formula (F8); periodic histogram / HiCum (ShiftF8). For the formula, the undo function is available only once (last calculated formula). Idem for spike correction and HiCum (back to original data). See Also 72 Alt A µGRAPH User’s Manual GUI F4 Purpose Full / normalize scale Syntax F4 F4 again returns to normal scale mode Description Normalizes Y-axis for all channels between their minimum and maximum. For single-channel axes, indicates maximum and minimum numerical values on the Y-axis legend. For multiple-channel axes, draws each channel on its own scale and indicates percent on Y-axis legend (unknown scale). This allows comparison of different type of data. After a zoom, use F5 to adjust scales on the new X-axis interval. Command /fs See Also F5, AltV v1.9 Release 3 73 GUI F5 Purpose Magnify scale Syntax F5 Description Magnifies Y-axis for all channels in order to view existing data in the current Xaxis interval. After a zoom, use F5 again to adjust scales on the new X-axis interval. See Also 74 Alt V, zooming µGRAPH User’s Manual GUI ShiftF5 Purpose Equal scale Syntax Shift F5 F5 returns to normal scale mode Description Adjusts all Y-axis scales at the same interval value. This is useful when units of all displayed channels are consistent. Command /es See Also Alt v1.9 Release 3 V 75 GUI F6 Purpose Line type Syntax F6 [ F6 [ F6 ]] Enter validates the choice Description Changes the line type of displayed channels. Hitting F6 successively sets the line type to: dotted line; none; solid line (default). Command /g See Also graph_string, CtrlF6 76 µGRAPH User’s Manual GUI CtrlF6 Purpose Marker type Syntax Ctrl F6 [CtrlF6 [CtrlF6 [CtrlF6 [CtrlF6 [CtrlF6 ]]]]] Enter validates the choice Description Changes the marker type of displayed channels. Hitting CtrlF6 successively sets the line type to: dots; crosses; squares; circles; bars; none (default). Command /g See Also graph_string, F6 v1.9 Release 3 77 GUI ShiftF6 Purpose Grid on/off Syntax Shift Description Turns the grid on or off (grid on by default) Command /gd F6 See Also 78 µGRAPH User’s Manual GUI F7 Purpose Data fitting preview Syntax F7 [F7 [F7]] Enter applies the offset or linear correction Description Displays average, linear trend or period counting. This function has two different modes: 1. If the displayed data are original, i.e., there is no Offset, Linear, Derivative or Cumulative Sum calculations, then press F7 successively shows: the average; the linear trend; returns to normal mode. If a single channel is displayed, the numerical values of the fitting will be displayed on the right side of the graph. These grey lines are shown for each graph, and correspond to the correction which will be applied when using Offset or Linear modes. Press Enter applies the correction (similar to AltO or Alt L). Note that in X-Y mode, the average shows a small cross (the “gravity centre” of data!) instead of a line. 2. If one of the Offset, Linear or Derivative modes are active, and only one channel is displayed, then press F7 once indicates on the right vertical label the average period of the signal, obtained by counting time intervals between zeros (positive transition). See Also v1.9 Release 3 /do, /dl, /dd, AltO, AltL, AltD 79 GUI ShiftF7 Purpose Shot over-scale limits Syntax Shift Description Displays over-scale limits for DAS shots data. See Also /m, /das, /mdas 80 F7 µGRAPH User’s Manual GUI F8 Purpose Compute formula Syntax F8 [ Replace channel n (Y/N): {yn} ] Enter formula for channel n: formula_string Description (Esc to cancel) Creates new channel(s) as the result of an arithmetic combination of existing channels, using formula defined by the formula_string. The created channel will be labeled automatically. If a formula has already been created, µGRAPH proposes to replace the previous formula channel. Answering N (for No) will create a new channel. Accessing to formula needs a single data file or multiple files in append mode (/a). For concatenated files, use the merge function first (/merge). Formula applies eventually on result of data calculations like derivative, cumulative sum, mean and linear corrections. A simple use of the formulas is a copy of a channel to keep in memory these data calculation as separated channels from original data. Command /f See Also /a, formula_string, /merge v1.9 Release 3 81 GUI ShiftF8 Purpose HiCum (periodic histogram) Syntax Shift F8 HiCum: Enter the wave name, Doodson argument or integer period: wave (Esc to cancel) Enter the number of samples: p Description (default is 360) Computes HiCum algorithm on all channels. Given a known tide wave or simple period defined by wave, this function computes the mean of signal in regular phase intervals (360° divided in p intervals). The wave argument can be specified in three different ways: 1. xxx.xxx = Doodson argument for a tide wave (i.e., 164.555 for S1) 2. wave_name = tide wave name (i.e., S1, M2, … see mgr_tide.dat file) 3. n = period (in samples) p corresponds to the number of phase intervals into 360°. This function transforms time referenced data into “phase” data. Some additional functions are available in this mode, like first harmonic fitting values (AltI), fitting preview (F7) and correction (AltW). Remarks To computes correctly the phases of tide waves, data must be referenced in UT (Universal Time, GMT). Use /s option to apply a delay if necessary. Command /hicum See Also Alt 82 I, AltW, F7, /hs, /phase µGRAPH User’s Manual GUI F9 Purpose Screen colors Syntax F9 [F9 [F9 [F9]]] Description Set the screen colors. Four modes available (hit successively F9 key): 2 colors (gray) on black background 2 colors (gray) on white background 16 colors (dark) on white background 16 colors (saturated) on black background (default) Command /sc See Also Alt v1.9 Release 3 N, ShiftF9, CtrlF9 83 GUI ShiftF9 Purpose VGA video mode Syntax Shift F9 Enter VGA video mode (0 to 4): n Description (Esc to cancel) Sets the screen resolution. Six modes n are available depending on the hardware video card compatibility : 0 = 320 x 200 pixels 1 = 640 x 350 pixels (EGA) 2 = 640 x 480 pixels (VGA, default) 3 = 800 x 600 pixels (SVGA) 4 = 1024 x 768 pixels (XGA) Remarks The default resolution (VGA) is usually sufficient for data analysis, but higher modes may be necessary to produce better quality graphics (see ShiftF1). Lower modes can be used to run µGRAPH on pocket PC. Command /vga See Also Alt 84 N, F9, CtrlF9 µGRAPH User’s Manual GUI CtrlF9 Purpose Full screen mode Syntax Ctrl F9 Ctrl F9 returns to normal screen mode Description Toggles normal screen / full screen mode. Default screen mode includes a header with clock and information on file(s) and channels. The full screen mode contains only data axis and a bottom line for simplified legend and prompt. Command /pe See Also Alt v1.9 Release 3 N, F9, CtrlF9 85 GUI F10 Purpose Exit Syntax F10 Do you really want to quit (Enter to confirm): Description Exit the program with prompt confirmation. See Also Alt 86 X µGRAPH User’s Manual header Purpose Header files Syntax [# DATE: creation_date] [# PROG: command_line] [# INFO: information] [# TITL: title] [# SHOT: n] [# SAMP: time_sampling] # CHAN: = time and data format Description The file header of µGRAPH is managed internally by the program or created by EDAS download utilities. It allows handling basic information on file formats and processing through the following keywords (order has no importance): # DATE: = date and time of file creation # PROG: = complete path and line command when calling µGRAPH # INFO: = copy of a maximum of ten information lines from original file header (use option /xi to exclude it from exported files) # TITL: = copy of title from calibration file, original file header or defined by F6 key Alt # SHOT: = data are original DAS shots (must correct over-scale) # SAMP: = time sampling (in seconds) # CHAN: = time and data format, including channel names and units into parenthesis preceded by an underscore. This is the only needed line for valid header. Others are optional. Example File header of an exported file: # DATE: 2000-09-01 10:13:54 # PROG: D:\METEO\DATA\mgr cr1x0005.dat /i:xyj[hhnn] /iso /c:meteo.clb # TITL: MGR EXAMPLE 2: METEO STATION # SAMP: 900s # CHAN: YYYY MM DD HH NN SS Wind_Speed_(m/s) Wind_Dir_(deg) IRRad_(W/mý) Atm_Pressure_(mbar) Batt_(V) 2000-03-18 11:30:00 0.305 123.5 440.4 722 14.06 2000-03-18 11:45:00 0.303 67.8 438.6 722 14.04 … v1.9 Release 3 87 header Remarks A file with this text header can be loaded by µGRAPH without the import option /i:. Thus, it is advised to keep this header in all exported files, but if you do not want it, use /nh option or answer “no” at the appropriate question when using the F1 key. See Also /i, /nh, /t, /x, /xi 88 µGRAPH User’s Manual /hicum Purpose HiCum (periodic histogram) Syntax /hicum: wave Description Computes HiCum algorithm on all channels. Given a known tide wave or simple period defined by wave, this function computes the mean of signal in regular phase intervals (360° divided in 1° intervals). The wave argument can be specified in three different ways: 1. xxx.xxx = Doodson argument for a tide wave (i.e., 164.555 for S1) 2. wave_name = tide wave name (i.e., S1, M2, … see mgr_tide.dat file) 3. n = period (in samples) This function transforms time referenced data into “phase” data. In GUI mode, some additional functions are available in this mode, like first harmonic fitting values (AltI), fitting preview (F7) and correction (AltW). Remarks To computes correctly the phases of tide waves, data must be referenced in UT (Universal Time, GMT). Use /s option to apply a delay if necessary. GUI Shift See Also Alt v1.9 Release 3 F8 I, AltW, F7, /hicum, /hs, /phase, /s 89 /hs Purpose HiCum phase samples Syntax /hs: n Description Determine the number of phase intervals for HiCum computing (default is 360). GUI Shift See Also Alt 90 F8 I, AltW, F7, /hicum, /phase, /s µGRAPH User’s Manual /i Purpose Import file format Syntax /i:format_string Description Specifies the column format (date, time and data) for file(s) import. When no EDAS header is available in the file(s) or no preset format is specified, the default is /i:* and imports each raw as data channel. Examples See format_string examples. See Also header, format_string, /t v1.9 Release 3 91 /ic Purpose Coma as decimal point Syntax /ic Description Interprets all comas as decimal points when importing data file(s). Some countries use coma as decimal point in numerical formats; without this option, µGRAPH may interpret comas as column separator. This option does not affect exporting format. The point is always used. See Also 92 format_string, /i, /im µGRAPH User’s Manual /im Purpose Minus as separator Syntax /im Description Interprets all minus as column separator when importing data file(s).Without this option, µGRAPH may interpret minus as negative numbers. This option does not affect exporting format. See Also v1.9 Release 3 format_string, /i, /ic 93 /iso Purpose ISO 8601 format Syntax /iso Description Uses ISO 8601 standard format for date and time when exporting file (F1 or /t), i.e., adds minus between date field and colon between time field. Only two export formats will respect the ISO standard (see format_string): ymdhns = YYYY-MM-DD HH:NN:SS yjhns = YYYY-DDD HH:NN:SS These complete format can be truncated at the condition that the order for date and time are respected: Year-Month-Day and Hours:Minutes:Seconds, i.e., the biggest first. Since 2-digit years are forbidden, any 'y' will be replaced automatically by 'Y'. See Also 94 format_string, /t µGRAPH User’s Manual /l Purpose LTERM capture file format Syntax /l Description Specify that imported data are in LTERM (terminal emulator for serial connections) capture file format: *YYMMDDHHNNSS Chan_1 Chan_2 Chan_3 Chan_4 This option sets the format_string to [yymmddhhnnss]*, and the file type to DAS (shots). See Also v1.9 Release 3 format_string, /i, /das 95 /lw Purpose Line width Syntax /lw Description Sets the line and points at 3-pixels width (instead of 1). GUI Alt See Also /gd, /vga 96 F6 µGRAPH User’s Manual /m Purpose Retrieve over-scales from DAS shots Syntax /m: n /m Description When importing DAS shots data files, rebuilts the full dynamic by correcting overs-scales of 100 000 shots. This option sets the DAS data mode, adjusts the correction of over-scales with a maximum absolute difference n (0 < n < 50 000) between two consecutive data (default is n = 40 000). Use /m:0 to not correct over-scales (keep original data, see also option /shot for exports). /m by itself avoids all DAS specific computations. See Also v1.9 Release 3 /das, ShiftF7, /mdas, /shot 97 /mdas Purpose µDAS shot data format Syntax /mdas Description Specify that imported data are µDAS data logger format without header (v4): YY MM DD HH NN SS Chan_1 Chan_2 Chan_3 Chan_4 This option sets the format_string to ymdhns*, and the file type to DAS (shots). See Also 98 /das, format_string, header, /i µGRAPH User’s Manual /merge Purpose Merge concatenated files Syntax /merge Description When multiple data files have been imported without append command /a, they are concatenated: Each file is displayed sequentially with its own data channels. This function merges the channels to produce a new single file with a single time reference. If the time periods are different, or if some data are missing for a given date and time intervals, data are interpolated using the neighbor method (nearest data value). If a /nan command has been specified, missing data are replaced by Not_a_Number. This allows to access to formula calculation, XY axis drawing, and to export a data file with all channels in a single time referenced table. GUI Shift See Also /a, AltF, F1, F8, /nan, /t v1.9 Release 3 F1 99 /nan Purpose Not a Number Syntax /nan /nan: n Description Filtered data will be replaced by a NaN (Not A Number) value equal to n (default is 1e-37), which will be ignored in graphics and calculations, and used to export x columns (see format_string). If this option is not specified when importing file(s) with filtering, any invalid data will exclude the entire line (all channels). See Also 100 format_string, /fx, F1, /spike, /t, /vm, /vn µGRAPH User’s Manual /nh Purpose No header Syntax /nh Description Puts no header in exported file. By default, a µGRAPH header is added to the file when exported, in order to import it without format options. GUI F1 See Also header, /i, /x, /xi v1.9 Release 3 101 /nt Purpose No negative time Syntax /nt Description When importing file(s), this option excludes any back time data lines. See Also /i, /sort 102 µGRAPH User’s Manual /o Purpose Output file name Syntax /o: filename Description Specifies the output data filename for command line batch. By default, exported data file will have the name of the first imported data file, with extension .$nn, where nn is a 2-digit number automatically set to avoid existing file replacement. GUI F1 See Also filename, /t v1.9 Release 3 103 /os Purpose Output separator character Syntax /os: n Description Specifies the ASCII code n for separator character between columns (default is a space). Here are some values of ASCII codes (see a table in your MS-DOS User Guide for others): 9 = tabulation (TAB) 32 = space (default) 44 = coma (,) 45 = minus (-) 58 = colon (:) 59 = semicolon (;) See Also 104 /o, /t, /tf µGRAPH User’s Manual /pe Purpose Full screen mode Syntax /pe Description Sets the graphic screen in full screen mode. Default screen mode includes a header with clock and information on file(s) and channels. The full screen mode contains only data axis and a bottom line for simplified legend and prompt. It is adapted to export images (see /gif). GUI Ctrl See Also /gif,/sc, /vga v1.9 Release 3 F9 105 /phase Purpose Full screen mode Syntax /phase /phase:rad Description Sets the angle unit (default is degree) for phase files, as produced by HiCum. See Also /hicum 106 µGRAPH User’s Manual /r Purpose Center data versus sample period Syntax /r Description When importing file(s), this option subtracts p/2 on time reference, where p is the sample period. This applies especially to EDAS data loggers, which produce result of an integration referenced to the end time of the period. Remarks Attention: The data will not be causal anymore. This option can be used when decimation (/d) is applied on data, to avoid time delays. See Also /d v1.9 Release 3 107 /s Purpose Time shift Syntax /s:n Description Applies n hours (negative or positive) of time correction on the imported data file(s). This option is useful to process local time or GMT referenced data. See also # LAG: flag in calibration_file. See Also calibration_file, /hicum 108 µGRAPH User’s Manual /sc Purpose Screen colors Syntax /sc:n Description Set the screen colors for graphics. Four modes n are available: 0 = 16 colors (saturated) on black background (default) 1 = 2 colors (gray) on black background 2 = 2 colors (gray) on white background 3 = 16 colors (dark) on white background GUI F9 See Also v1.9 Release 3 109 /shot Purpose 5-digit shots DAS data Syntax /shot[:maxshots] Description Without argument maxshots, keeps the 5-digit shots numbers when exporting DAS data file. By default, DAS data are corrected from 100 000 shots overscales (see /m) to reconstruct full dynamic data values. This option will produce phase wrapping as made by EDAS data loggers. This may be useful when using /d decimation option on DAS data. When maxshots is specified, uses this value to apply DAS corrections (overscales, frequency conversion, …). See Also 110 /d, /das, /m, /mdas µGRAPH User’s Manual /sort Purpose Sort data in time Syntax /sort Description Sets the data in chronological order, and if necessary, deletes redundant data. This allows faster display and clean file exporting. GUI Ctrl See Also /nt v1.9 Release 3 F1 111 /spike Purpose Remove spikes Syntax /spike:n Description Removes “aberrant” data in the signal using an intelligent criteria. This function allows to remove local data points out of n times the RMS of the signal. Values of n between 5 and 10 are advised, and the process can be done iteratively. GUI Alt See Also /fx, /vm, /vn 112 S µGRAPH User’s Manual /t Purpose Export file format Syntax /t /t:format_string Description Exports imported data as a new file, without entering GUI mode. By default, /t option uses the imported format (/i). Specify the format_string will determine the column format (date, time and data) for file export. A header will be added to the file by default (see /nh to avoid it). Examples See format_string examples. Remarks With /gif, this option is the main batch µGRAPH function, because it forces the program to exit after all processes done, without entering GUI mode. GUI F1 See Also format_string, header, /i, /nh, /o, /os, /tf v1.9 Release 3 113 /test Purpose File test mode Syntax /test /test:n Description Displays, in DOS text mode, information about file format and data you may import. This function supposes that the import format is OK, so use /i:* if you do not know it exactly. Two modes n are available: 0 = displays number of columns and acquisition period (reads only file header, default) 1 = display also statistics on the data, like in the Data Information Window in GUI mode (reads the whole file). See Also 114 Alt I, /i µGRAPH User’s Manual /tf Purpose Export numerical format Syntax /tf:C_printf_format Description Specifies the numerical format for export data file, using C_printf_format string. Default is %1.8g for 8-digit (maximum) generic float format, which works correctly with integers and floats and reduce file space. Example /tf:%03.4f will write the data in a formatted columns with 3-digit before point, leading zeros if necessary, and 4-digit after the decimal point. Remarks Attention: Respect strictly the C syntax because µGRAPH does not make any verification. See any C code printf command manual. See Also /o, /os, /t v1.9 Release 3 115 time_string Purpose Date and time coding Syntax YYMMDDHHNNSSsss Description Date and time coding format used by various functions of µGRAPH. The complete time_string format is formed by 15 digits: 2-digit year, month, day, hour, minute, second and 3-digit millisecond. This string can be truncated anywhere from the right, keeping the most significant digits. Examples 99 = 1999-01-01 00:00:00 950920 = 1995-09-20 00:00:00 000807221455 = 2000-08-07 22:14:55 Remarks The 2-digit year is interpreted as followed: 70 to 99 = 1970 to 1999, and 00 to 38 = 2000 to 2038. Years before 1970 and after 2038 cannot be handled by µGRAPH. See Also /b, /bk, /c, /e, header, limitations, /y 116 µGRAPH User’s Manual /tmp Purpose Temporary drive Syntax /tmp /tmp:drive Description Specifies the drive for temporary file. Without this option, µGRAPH use C:\. Default is local drive. Remarks µGRAPH needs some drive space to process data (about twice the size of imported data files). If some RAM is available, it may be efficient to set a RAMdrive and define it as temporary drive to accelerate processes. See Also limitations v1.9 Release 3 117 /tr Purpose Time restore Syntax /tr Description Allows automatic continuous time restore when the imported file(s) has an uncompleted time reference. When the time reference is uncompleted in the data files, and files are append, µGRAPH can produce with this option a continuous time, increasing automatically when negative time jumps are encountered. This option may be used when time reference is unknown, but it is better to use if possible /yn option to get complement information from data filename. Examples A data file without the year will possibly have dates jumping from December to January, and then one year will be added (option /i:mdhn to specify format): … 12 31 23 50 1234.5 6789.0 => 1970-12-31 23:50 01 01 00 00 1234.6 6788.9 => 1971-01-01 00:00 … If the complete date is missing, and hours jump from 23 to 00, a day will be added (option /i:hns to specify format): … 23 59 59 1234.5 6789.0 => 1970-01-01 23:59:59 00 00 00 1234.6 6788.9 => 1970-01-02 00:00:00 … See Also 118 /a, /i, /yn µGRAPH User’s Manual /vga Purpose VGA video mode Syntax /vga:n Description Sets the screen resolution. Five modes n are available depending on the hardware video card: 0 = 320 x 200 pixels 1 = 640 x 350 pixels (EGA) 2 = 640 x 480 pixels (VGA, default) 3 = 800 x 600 pixels (SVGA) 4 = 1024 x 768 pixels (XGA) Remarks The default resolution (VGA) is usually sufficient for data analysis, but higher modes may be necessary to produce better quality graphics (see /gif). Lower modes can be used to run µGRAPH on pocket PC. GUI Shift See Also /pe, /gif v1.9 Release 3 F9 119 /vm /vn Purpose Threshold data filtering Syntax /vm[channels]:max /vn[channels]:min Description Removes data values of channels above a maximum max and a minimum min when importing data file(s). channels (optional) specifies one or more channels instead of all channels. By default, the entire line of data is excluded. Use /nan to replace invalid data by a Not a Number. Examples /vm:1000 = excludes all channels data greater than 1000 /vn26:450 = excludes channels 3 and 6 data lower than 450 /vm2:25.2 /vn5:1.3 = excludes channel 2 data greater than 25.2 and channel 5 data lower than 1.3 See Also 120 /fx, /spike µGRAPH User’s Manual /x Purpose Exclude first lines of file Syntax /x:n Description Excludes first n lines of imported file(s). This option allows importing files that contain lines of headers. It will apply to all imported files. See Also v1.9 Release 3 /i, /xt 121 /xi Purpose No information in header Syntax /xi Description Excludes information lines in exported file header. By default, header information lines (#INFO:) are kept and append when exported, and may be numerous after a lot of import/export operation. This option allows avoiding it while keeping the file header. See Also 122 header, /nh, /t µGRAPH User’s Manual /xt Purpose Exclude lines with text Syntax /xt Description Excludes all lines of imported file(s) that contain some text or letters (like comments or remarks). This option allows excluding data lines that contain text or non numerical characters. It will apply to all imported files. See Also v1.9 Release 3 /i, /x 123 /y Purpose Specify date and time reference Syntax /y:time_string Description Specifies date and time reference when importing uncompleted file(s). This option will impose a part of date and time to all data. See Also /i, time_string, /yn 124 µGRAPH User’s Manual /yn Purpose Specify date and time reference from filename Syntax /yn:date_string Description Searches for time reference in the imported data filenames. The time will be completed for each file. The date_string uses the same codes defined for format_string, but it describes in this case the meaning of each character of the filename (x replaces an unknown character). Examples sta0225.d97 is one of the daily files acquired containing columns with hours, minutes and data channels, but no date reference except in the filename itself, with format staMMDD.dYY (here, on February 25, 1997). To import all the similar files and complete the time reference, use the following options: mgr sta*.* /i:hn* /a /yn:xxxmmdd.xyy See Also v1.9 Release 3 /a, filename, format_string, /i, /y 125 /zb /ze Purpose Zoom time interval Syntax /zb:time_string /ze:time_string Description Specify a begin and/or end date and time by time_string to zoom the first graphic display. GUI Alt See Also /b, /e 126 Z µGRAPH User’s Manual Technical Notes v1.9 Release 3 127 Technical Notes References and Acknowledgments Beauducel, F., Structures and mechanical behaviour of Merapi volcano, Java: A methodological approach of the deformation field, Doctorate Thesis, Univ. Paris 7 , 250 pp., 1998. Executable program has been compressed with LZEXE written by Fabrice Bellard, © 1989. SVGA display BGI driver and C source written by Jordan Hargraphix Software, © 1991-1994. GIF exporting C source code written by Sverre H. Huseby, © 1992. µDAS binary format v8 and HiCum implemented thanks to André Somerhausen help. Serial protocol interrupt implemented thanks to G. Leblanc great book, © 1993, and AE-Belgium documentation, © 1995. Many thanks for useful comments and bug reports to J. Ammann, C. Antenor, P. Catherine, M.-F. Esnoult, H. Delorme, H. Gunawan, P. Kowalski, P. Mourot, and A. Somerhausen. 128 µGRAPH User’s Manual v1.9 Release 3 129 Index v1.9 Release 3 131 Index 132 µGRAPH User’s Manual