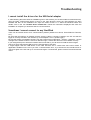
1
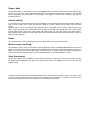
SPD User's Manual Version date 22/09/2011 Management Software for SterilDisk, PasteurDisk, SterilCyl, PasteurCyl all versions (standard, Jumbo, Radio) Temperature Dataloggers Software version 1.4.x.x Dostmann electronic GmbH Waldenbergweg 3b, 97877 Wertheim phone +49 9342 308-90 - fax +49 9342 308-94 e-mail: [email protected] - web: www.dostmann-electronic.de Index LICENSE AGREEMENT..................................................................................................................... 5 INTRODUCTION .............................................................................................................................. 6 AVAILABLE DEVICES ......................................................................................................................... 6 SYSTEM REQUIREMENTS ................................................................................................................. 7 HARDWARE..................................................................................................................................... 7 SOFTWARE ...................................................................................................................................... 7 INSTALLATION ................................................................................................................................ 8 INSTRUMENTS AND ACCESSORIES ................................................................................................ 9 CONNECTING THE DISKINTERFACE ..................................................................................................... 9 USB DRIVER INSTALLATION UNDER WINDOWS XP .................................................................................. 9 USB DRIVER INSTALLATION UNDER WINDOWS VISTA/7 .......................................................................... 9 UNSUCCESSFUL INSTALLATION ............................................................................................................. 9 DEVICES CONNECTION..................................................................................................................... 9 BASIC OPERATIONS ..................................................................................................................... 11 LAUNCHING THE PROGRAM ............................................................................................................ 11 THE MAIN WINDOW ....................................................................................................................... 11 ONLINE HELP ................................................................................................................................ 12 INFORMATION ............................................................................................................................... 12 EXIT THE PROGRAM ........................................................................................................................ 12 CONFIGURATION ........................................................................................................................ 13 TEMPERATURE MODE ...................................................................................................................... 13 CONNECTION ............................................................................................................................... 13 LANGUAGE .................................................................................................................................. 13 EXPORT PATH ................................................................................................................................ 13 DATA PATH................................................................................................................................... 13 PRINTING OPTIONS ........................................................................................................................ 14 HEADING 1 ..................................................................................................................................... 14 HEADING 2 ..................................................................................................................................... 14 HEADING 3 ..................................................................................................................................... 14 ALARM PROFILES ........................................................................................................................... 14 ADD A PROFILE ............................................................................................................................... 14 REMOVE A PROFILE ......................................................................................................................... 14 F0/PU ......................................................................................................................................... 14 ACQUISITION OPTIONS .................................................................................................................. 14 START A NEW MISSION ................................................................................................................ 15 INFORMATION ON THE DATA LOGGER ............................................................................................... 15 STARTING A MISSION ...................................................................................................................... 15 DATA LOGGER MULTIPLE START ......................................................................................................... 16 ENABLE RADIO AND RADIO OPTIONS (ONLY FOR RADIO DEVICES) ........................................................ 16 READING THE ACQUIRED DATA .................................................................................................. 17 GRAPH MANAGEMENT – ZOOM....................................................................................................... 18 SET MARKERS OF THE PROCESS ......................................................................................................... 19 SETTING THE MARKERS THROUGH THE TABLE ........................................................................................ 19 SETTING THE MARKER THROUGH THE GRAPH ........................................................................................ 19 ADD A DESCRIPTION OF THE MARKERS ............................................................................................... 19 REMOVE THE MARKERS ..................................................................................................................... 19 STATISTICS ....................................................................................................................................... 19 MISSION REPORT PRINTING .............................................................................................................. 20 STOPPING A MISSION.................................................................................................................. 21 RECEIVING DATA WITH THE RADIO ............................................................................................. 22 STATISTICS .................................................................................................................................... 22 EXPORT DATA................................................................................................................................ 23 ALARMS SETTING ........................................................................................................................... 23 NOTES ......................................................................................................................................... 23 MISSION REPORT PRINTING .............................................................................................................. 23 SAVE THE MISSION ......................................................................................................................... 23 DATA ARCHIVE ............................................................................................................................ 24 MULTI-GRAPH COMPARISON...................................................................................................... 25 ANALYSIS OF MISSIONS FROM THE SAME PROCESS .............................................................................. 25 ANALYSIS OF MISSIONS FROM DIFFERENT PROCESSES........................................................................... 26 TROUBLESHOOTING ..................................................................................................................... 28 I CANNOT INSTALL THE DRIVERS FOR THE USB-SERIAL ADAPTOR............................................................. 28 SOMETIMES I CANNOT CONNECT TO ANY STERILDISK .......................................................................... 28 License agreement Read this license agreement thoroughly before using the Software. Using and copying this Software is subject to the acceptance of this agreement. If you choose to refuse the following conditions, please return this Software to the point of purchase for a complete refund. This agreement involves Tecnosoft srl, Redecesio di Segrate, Milano, Italy (henceforth called Tecnosoft) and the User (be it a physical or juridical person) for the following software products (henceforth called Software): "Program" and any software product accompanying it. Tecnosoft grants the user a non-exclusive right to use a copy of the software on a single computer provided that the user accepts the following conditions. 1. User license. The Software is property of Tecnosoft and cannot be copied nor sold without the prior written authorization of Tecnosoft. The Software is protected by Italian and European Laws and by International Treaties concerning intellectual properties. 2. Additional licenses. The purchase of additional licenses conveys the right to use the Software on a corresponding number of computers at the same time. 3. Exclusion of liabilities. Except for what stated by applicable laws, in no case can Tecnosoft be considered liable for damages or losses, direct or indirect, including, but not limited to, loss or missing income, suspension of activities, loss of information or any other monetary or economical damage, deriving from proper or improper use of the Software even if Tecnosoft has been advised of the possibility of such damages. In any case, the responsibility of Tecnosoft for such damages will be limited to the price paid for the Software. This clause is applied even if the User does not accept the Software. 4. Use of Software results. It is User's responsibility to check that results given by the Software are correct and appropriate. In no case the Software should be used if such use can be threatening to the health or life of human beings. This clause is applied even if the User does not accept the Software. 5. Updates. If the Software is an update of a previous version, the license is transferred from the old version to the update. Only the update can be used, unless the update is destroyed. 6. Separation of components. The Software is licensed as a single product. Components cannot be separated. 7. Limitations. The User cannot convert, decode, decompile or disassemble the Software, except for what is explicitly requested by applicable laws. Introduction SPD is a software program that is used to configure and acquire data off temperature data loggers (up to 100°C and up to 140°C). These devices are used to monitor pasteurization and sterilization processes and other applications involving high temperatures. Data loggers are supplied with a replaceable battery with a typical autonomy of two years (based upon standard use of the device). Thousands of acquisitions can be stored and then downloaded by means of the interface (DiskInterface) and the application software. SPD displays the acquired data both in the form of a graph as well as a table, furthermore the data may be exported in Excel (.SLK) file format. SPD is also used to program the data logger for future data logging missions. Each data logger is identified by means of a unique serial number, and, if requested, may be supplied with a calibration certificate in order to guarantee the validity of the acquired readings. Available devices Following the list of the devices currently supported by the SPD software, with the needed accessories (all with their product code). Interface Data logger PasteurDisk (ts01pd) PasteurDisk Probe (ts01pdp) DiskInterface (ts04diu) SterilDisk (ts01sd) SterilDisk Probe (ts01sdp) PasteurDisk Can (ts01pdds, ts01pddm, ts01pddl, ts01pddd) SterilDisk Can (ts01sdds, ts01sddm, ts01sddl, ts01sddd) DiskInterface (ts04diu) and adapter (ts10spca) PasteurCyl (ts10pca, ts10pcg, ts10pcb, ts10pcc) DiskInterface (ts04diu) and adapter (ts04spdja) PasteurDisk Jumbo (ts01pdj1, ts01pdj2, ts01pdj3, ts01pdjd) DiskInterface (ts04diu) and adapter (ts04spcja) PasteurCyl Jumbo (ts10pcj1, ts10pcj2, ts1cpcj3, ts10pcjd) DiskInterface (ts04diu) and adapter (ts04spcra); USB Radio Receiver (ts04rr) PasteurCyl Radio (ts10pcra, ts10pcrd, ts10pcrb, ts10pcrc, ts10pcrh) SterilCyl (ts10sca, ts10scg, ts10scb, ts10scc) SterilDisk Jumbo (ts01sdj1, ts01sdj2, ts01sdj3, ts01sdjd) SterilCyl Jumbo (ts01scj1, ts10scj2, ts10scj3, ts10scjd) SterilCyl Radio (ts10scra, ts10scrd, ts10scrb, ts10scrc, ts10scrh) System Requirements Hardware Description Minimum Recommended Microprocessor 1 GHz 2 GHz Memory 64 MB 128 MB Video 800x600; 256 colours 1024x768; 16 Mil. colours 1 free USB port for the DiskInterface 1 free USB port for the USB Radio Receiver Software Description Operating system Supported Windows XP / Vista / 7 (32 bit and 64 bit) Installation To install SPD simply insert the installation CD into your CD-ROM; click on Start – Run and type “D:\setup.exe” (N.B. Your CD-ROM device could have a different name to “D”). Select the installation menu language and click on Install, then select SPD and click Install again; from this menu you can also open the PDF manual or the USB driver installation instructions. Follow the instructions to complete the installation. You may be required to install Microsoft .NET 4.0 before installing the SPD: accept and proceed. We suggest to install SPD for all users (Everyone). At the end click on Finish. Instruments and accessories All loggers currently managed by the SPD software are connected to the PC by means of a single interface, the DiskInterface. Initially developed for PasteurDisk and SterilDisk, with and without probe, it can accept also other kind of loggers using dedicated adapters. The only other loggers that don't require such an adapter are the PasteurDisk Can and the SterilDisk Can. The first thing to do is connect the interface to a free USB port and install the drivers. Connecting the DiskInterface In the kit there is also a USB cable: connect the biggest flat end in the free USB port of your PC while the other smaller end in the USB connector on the device. As soon as the device is connected to the PC, Windows will detect its presence and will begin the driver installation procedure. According to your operating system, proceed as follows. USB driver installation under Windows XP In the Add New Hardware window, select No, not now (last option) and click Next. Then, select always the last option, which requires manual installation of the driver (for expert users) and click Next. Set in the path field, the following path (make sure the CD is in drive): "D:\Drivers\XP_2000 (32 bit)" (your driver might not be called “D") and click Next. If, during installation, Windows would give you a warning about the origin of the unsigned drivers, click Continue, and after the procedure, click Finish. If you change the connection port of the interface, you might be required to reinstall the drivers. Note: the DiskInterface drivers is available on the Tecnosoft website and are also found in the installation folder of the program, if you lose the installation CD. USB driver installation under Windows Vista/7 Windows will install the driver, without success. When you will get the option, ask to specify a path to look for the drivers. Set in the path field, the following path (make sure the CD is in drive): "D:\Drivers\Vista_7 (32 and 64 bit)" (your driver might not be called “D") and click Next. If, during installation, Windows would give you a warning about the origin of the unsigned drivers, click Continue, and after the procedure, click Finish. If you change the connection port of the interface, you might be required to reinstall the drivers. Note: the DiskInterface drivers is available on the Tecnosoft website and are also found in the installation folder of the program, if you lose the installation CD. Unsuccessful installation If, for various reasons, the installation fails, go to Control Panel - System - Device Manager (or Hardware Device Manager for Windows XP), select USB Ports and click the right button on SDI and select Update Driver. Then, follow the instructions above. Devices connection The devices must be inserted in the interface in a specific way: if, however, you insert them in the wrong way, it simply won't communicate with the data logger but there is no risk of damage to the instruments. In general, this rule applies: the face of the logger on which the serial number is engraved is facing the side on the reader interface identified by the label “Serial number here”. In cases of cylindrical data loggers, the tip should always be directed towards the USB connection. Following, the images with the data loggers inserted in the interface with the data logger with the proper adapter and in the correct direction (the USB connection is facing upward). PasteurDisk, SterilDisk PasteurDisk Probe, SterilDisk Probe, PasteurDisk Can, SterilDisk Can PasteurCyl, SterilCyl It is possible to connect multiple devices simultaneously and start and download them in series, one after another. Note: some interfaces, for special purposes (for example, when a logger is connected to a dummy unit of product and should not be taken away from it and so cannot be placed in the Disk Interface or in its adapter), might have a cable with two clips, red and black. The red one must be connected to the probe or to the end where the probe would have been, if you have the version without the probe, while the black one should be connected to the other end. If you misplace the two clips the interface simply won't be able to communicate with the logger. If you get an error message, just invert the two clips on the two ends of the logger. PasteurCyl Radio, SterilCyl Radio PasteurDisk Jumbo, SterilDisk Jumbo PasteurCyl Jumbo, SterilCyl Jumbo Basic Operations Launching the Program Once the installation is complete, double click on the SPD icon on the desktop to start the program, alternatively navigate to Start – All Programs – Tecnosoft - SPD – SPD. The Main Window The Main Window of the program should appear as a rectangle with a curved side; if it appears inside a white rectangle, it indicates that the configuration of your graphic card has not set hardware acceleration to the maximum level. To correct this issue, right-click on the desktop, select Properties. Click on the Settings label and then click on Advanced. Select the label Problems solution and move the cursor on the Hardware acceleration bar to Max, i.e. completely to the right. Click on OK and then close the window Properties – Display. The central part of Main Window holds the function buttons, whereas at the bottom of the window we find buttons that provide access to the configuration page, the about window and a button to close the program. Use the underscore button on the top right corner of the window to iconize it. If you need to move the window within your desktop, click on the dark blue border at the .top of the window with the left mouse button and, keeping it pressed, move the window to the desired position. Initially only the Connect and Archive buttons will be available; the others will be enabled once a data logger is connected to the reader interface or the USB radio Receiver is connected to a USB port. Online Help Click on the Info button, and in the following window click on the Tecnosoft logo to open the Online Help. Browse through the pages to obtain more information on the program functions. Information Click on the Program Information button (the question mark icon on the bottom right) in the Main Window; an information window will appear, displaying the software version and the programs licence agreement. Exit the program To exit the program just click on the Close the program button, i.e. the X on the bottom right of the Main Window. Configuration Click on the Configuration button (the leftmost button at the bottom of the window) to open the Setup window, where you may set the program parameters. Temperature Mode Select the desired units to be displayed for temperature degrees: Celsius or Fahrenheit. Connection Select whether you use a USB interface or a serial one (select from the list of available serial ports the port that corresponds to the one where the reader interface has been connected). Language You may choose the preferred language used throughout the program; to effect changes close and start the program again. Export Path The directory specified here is used as the default directory when you export data in Excel format (*.SLK). Click on the folder button to navigate to the desired folder. Data Path The directory specified here is used to store the acquired data from the loggers. Click on the folder button to navigate to the desired folder. Printing Options Enable the Include Data Table option if you want to print the table in the report. It will be possible to change this options even before printing the mission itself. Here you can also set the headings for the report to be printed. Heading 1 The title of the report. Heading 2 The sub-title of the report. Heading 3 Additional information text to be printed on the report. Alarm Profiles Here you can create several profiles to set alarms to each radio sensor connected. To see the details for a profile just place on it the cursor and wait for the tooltip to show. Add a Profile Just click on the plus (+) sign to open a new window where you can set the Name of the profile, the reference Temperature and F0/PU thresholds for the alarms (meaning the alarm will turn on when this levels are reached by the sensor). Temperatures set here must be in °C. Remove a Profile To remove a Profile from your list, select it form the drop down list and click on the Remove Profile button (the rubber button next to the plus sign). F0/PU F0 and PU (Pasteurization Units) values to be used to calculate your curve of process efficiency. You can set the Z and N fields values for the two variable parameters in the F0/PU formula. The standard default values are 10 and 121,11 (for sterilization) and 7 and 60 (for pasteurization). Click on PU to change them for pasteurization or directly type them into the appropriate fields. N is the temperature reference value while Z is the delta temperature value to decrease the number of the bacteria of 10. Temperatures set here must be in °C. Min is the temperature value from which the program must start to calculate the F0/PU value: data lower than that value will be ignored for the formula. Acquisition Options Enable the Stop After Download option to stop the acquisitions after you downloaded the data from the data logger. In this way you'll be able to save battery power while the logger is not running a monitoring mission. Start a New Mission To start a new mission and program the data logger, ensure the interface is connected to the PC and that the data logger is correctly inserted in the interface (or in the adapter if you are using a logger requiring it). Click on the Connect button in the Main Window; after a while the connection is established SPD will display some basic information about the data logger. Moreover, the buttons that were previously disabled are now enabled. Information on the data logger The middle of the window holds two boxes that display some information on the connected data logger. On the left the current temperature value read by the logger is shown. At the bottom there are the following indications: Type of logger, serial number, battery status (if this line is red, either the calibration is expired or in its last month of validity, or the battery is very low) and calibration expiration date; Started: date and time at which the current mission was started; Step: acquisition rate of the current mission; Status: device status (Recording mean it's acquiring data, Stopped indicates the mission has ended, Stand-by implies that a mission is programmed and will start once the programmed start delay has elapsed). Starting a mission If the Status indicates Stopped, a button labelled Start will appear at the top right. If the Stop button is visible on the opposite side, it indicates a mission is in progress, which must be stopped with the Stop button in order to start a new mission. Click on Start to open the programming window for the device. In the Start Date Time box select the date and time at which you would like the mission to start. If it is the current date and time, the mission will start immediately, alternatively you can set the mission to start in the future. In the Acquisition Step box you must define the acquisition rate, expressed in days, hours, minutes and seconds. You may leave unnecessary fields blank (you do not have to enter 0). In the Stop After box (appears only for some data loggers with this feature enabled) you can set the maximum duration of the mission, after which the logger will stop acquiring. This can be useful to stop the logger before downloading the data and not consume unnecessary battery. If the time you set to stop is not a multiple of the rate of acquisition (eg: 67 seconds with rate 5 seconds) the acquisition will stop before the deadline set (according to the example above, 67 / 5 = 13.4, so there will be 13 acquisitions and the mission will stop after 65 seconds). You may also enter additional Notes at the end to help you identify the mission in the future. Click on OK to start the mission. Click on Disconnect before removing the logger from the reader interface and closing the program. Note: if the data logger is in the interface and connected to the software and there is no operation of the user within the program, the logger will be automatically disconnected. Data logger multiple start It is possible to start a mission on two or more loggers in series, with the same parameters (interval and notes). To start more than one data logger, activate the option Multiple Start, in the bottom left corner of the window, and then click OK. The program starts the mission on the data logger connected, then will ask to replace it with the next one to be started. The program connects to the new data logger and the start window pops up again with the same parameters of the previous mission. You still can change these parameters and notes, or leave them as they are and click on OK to start this device too. Repeat the operations for all the data loggers you need to start and then click on the X to close and stop the multiple start. Enable Radio and radio options (only for radio devices) If the connected device has a radio in it (SterilCyl Radio and PasteurCyl Radio), you can enable the radio transmission on it. Just click on the Enable Radio option and then start the mission. The Acquisition Step is also the Transmission Step. If you want only the radio transmission, select the Radio Only option, and the data will not be saved in the logger memory but on the PC only. In the last field, RNN, you can change the radio serial number (not the sensor number). Be careful not to assign the same number to more than one radio or you won't be able to recognize them when receiving data. Reading the acquired data When you receive a data logger that has completed a mission, you may view and process the data acquired. Ensure that the interface is connected to the PC and insert the data logger you wish to read. Click on the Connect button: once a connection is established, click on the Data button. Doing this you'll save the data in the Archive too. The program will take more or less time to download the readings according to the amount of data recorded: when this operation is complete, a window displaying a graph and table will appear. The Notes will appear at the bottom-left, under the table. These notes cannot be modified, while you can add new notes in the box below this one. To save these note, click on OK to close the window, while if you don't want to save changes, click on the X to close the graph window. The left part of the window displays all the data in tabular format, indicating the date and time as well as the temperature of each acquisition. You can scroll through the data using the left vertical bar. On the bottom there is an area displaying some information on the mission. The minimum and maximum values recorded are shown as well as the F0 parameter required for pasteurization and sterilization processes. These statistics are updated according to the portion of the graph selected, both with the zoom or the selection of the first data in the table and then, by pressing the SHIFT key, of the last data of the portion we want to consider. In this way it is possible to select only the process of sterilization and pasteurization. Clicking with the right mouse button on the section, the option Zoom will appear: select it and the area will be zoomed on the graph. You can personalize the grid on the graph by indicating how every degrees an horizontal line should appear and how many seconds a vertical line should appear, in the Temperature & Time Grid fields. Press the magnifying glass in the box to make the changes operational. To export the data for this mission click on the Export button located at the bottom of the window: if you have not set the destination folder for the exported files (Configuration chapter, p.13), the data will be exported in the main folder of the program. The export file has a .SLK extension, and may be imported in Excel, and has a progressive F0 for each acquisition. This exported file is automatically generated when you save the mission data. Click on Close (the X on the bottom right) to close this window. Graph management – Zoom It is possible to zoom into a particular area of the graph by selecting the required area. To do this click with the left mouse button and, keeping it pressed, drag the mouse until a grey area appears; this area will be zoomed. When the desired area is covered release the button. At the sides of the graph, vertical and horizontal scroll bars will appear such that you may scroll the graph at the current zoom level. You may also zoom in further, following the same procedure. To revert to the original size, click on the button with a circle inside close to the scroll bars. You will have to press them as many times as you zoomed in. The vertical and horizontal zoom, in this case, are independent and therefore you must click both of them. To bring the graph to its original size immediately, you can click with the right mouse button on the table and select Unzoom. Set markers of the process It is possible to set two vertical markers on the graph to identify, for example, the beginning and the end of the analysed process. The area outside the markers will be highlighted in grey and will be calculated statistics. The markers are printed on the graph on the report. Markers can be set in two ways: on the table or on the graph. Setting the markers through the table Select the acquisition for the first marker and then, holding down the SHIFT key on your keyboard, select the last one. Right click within the table and select Set markers. Setting the marker through the graph Click the point on the graph where you want to set the first marker and then click the first + button at the bottom, click on the graph where you want to set the end marker and click the second + button at the bottom. Add a description of the markers When you set the marker, next to the + buttons at the bottom date and time of the two markers appear: in the empty field next to them you can write a description of the markers (maximum 20 characters). The descriptions appear on the graph and on the printed report. Remove the markers To remove the markers, you can click on the buttons - (previously +) at the bottom; if you added them using the table, you can right click on it and select Clear markers. Statistics When two markers are set, some statistics are displayed at the bottom right corner, including the duration of the period between the markers, the maximum, minimum, average, and the value of F0/PU, again for the period between markers. Mission report printing It is possible to print a report of the mission currently displayed: click on the Print button. Under it there is the option Include Table, and it is enabled or disabled according to the options chosen in Configuration (p.13). Here you can still change it. From the dialogue box that appears select the printer and click on Print. The Print Preview window will appear where the report is shown: all the information regarding the mission, along with the graph, is shown. Click on Print to print or close the window to cancel. Stopping a mission To stop a mission in progress, connect the interface, insert the data logger and click on Connect. When connection is established, click on Stop to stop the mission. The recorded data will not be deleted but will remain in the data logger's memory, available for download until a new mission is started. Receiving data with the radio To begin receiving data just plug in the USB Radio Receiver (no drivers needed) and the Radio button will be enabled. Click on it and a window displaying two graphs and a table will appear. To maximize it, click on the magnifying glass in the bottom right corner of the window (Maximize Window). The right part of the window displays all the data from all the units, indicating the date and time, the name of the unit (the RN number you set when starting the mission or the serial number of it) as well as the temperature values and F0/PU values. You can scroll through the data using the right vertical bar. On the left there are the graphs (temperature above, F0/PU below), which are blank at the beginning, and under them there are four drop down list and a list under each one of them. From the drop down list you can select one of the unit received and its graph will be displayed. The borders and the drop down list will change colour and the lines in the graphs will have the same colour of them. Enabling or disabling the checkmark on the right of each drop-down list enables or disables the calculation, and then the graph, of F0/PU for that probe. Statistics On the right, under the list of data, there is a table that shows all the units received so far. If you select one of them, you will see its statistics in the Partial box: MIN: the minimum temperature transmitted; AVG: the average temperature; MAX: the maximum temperature transmitted; F0/PU: the actual value of it. You may select more than one unit from the list pressing the CTRL button (keep it pressed and select the units you want to see the statistics of) and in this box you will see the details referring to all of them (F0/PU indicates the minimum value for the sensors selected). To see the statistics of all data received, look in the Global box below the Partial box. Export data To export the data for this mission click on the Export button (the disk) located at the bottom right of the window: if you have not set the destination folder for the exported files (Configuration chapter, p.13), the data will be exported in the main folder of the program. The export file has a .SLK extension, and may be imported in Excel. Alarms setting In the same way you select the units to see their statistics you can select them and assign an alarm profile to each of them. Select one or more unit and then assign it or them a profile from the drop down list Alarm Profile. When an alarm occurs, according to the parameters set in the profiles, the unit that is in alarm will turn red and a + sign will appear if the temperature value reached the one set in the profile and a star (*) will appear and the field will turn yellow if the F0/PU value has reached the one set in the profile. Also, there will be a sound alarm. After a minute the sound alarm will cease, while the blinking alarm will remain till the values go down the set thresholds. Notes You can add notes to this monitoring session in the blank field on the right of the window. Mission report printing It is possible to print a report of the mission currently displayed: click on the Print report button (the left most button in the right corner of the window). From the dialogue box that appears select the printer and click on Print. The Print Preview window will appear where the report is shown: all the information regarding the mission, along with the graph, are there. Click on Print to print or close the window to cancel. Save the mission To save the mission, click on Close. A window will open where you type in the name for the mission, or keep the default name, identified by the date of the mission itself. Click on the disk to proceed or on the X to exit without saving. The data of each mission are automatically saved every 5 seconds in a file called LAST, in the archive. This is done so that if a blackout occurs, you don't loose all the data. Remember to rename the LAST record in the archive, otherwise it will be overwritten by the new mission you will start. Data Archive When a mission is saved, either by downloading data from a logger or saving real time received data, SPD stores the data from that mission in the archive. Please remember to setup the destination folder for the data files in the configuration window before saving data. Note that in order to access the Archive the software must not be communicating with a datalogger. Click on Archive to display two lists of missions that have been saved. This window will display a list of missions in the left part, saved from the loggers, that may be ordered in chronological order (based upon the mission start date and time), by selecting the Mission Start option, in the Sorted By box, or according to the serial number, by selecting the Serial option. On the right you can select a mission saved from the real time graph window. To open a mission double click on the item in the list or select it and click on the confirmation button on the bottom right. To delete a saved mission, select it and click on Erase data. Multi-graph comparison SPD allows to compare two or more missions in the same graph window, overlapping graphs and allowing to analyse the temperature curves at the same time. The multiple analysis is done offline, meaning no data logger has to be connected to the interface. When the data that have to be compared are downloaded, you just have to start the software and open the archive. Don't select the single mission, but make a multi selection by clicking on each mission to be compared while pressing the CTRL key on the keyboard (if you want a contiguous range of missions, click on the first one and then on the last one while pressing the SHIFT key on the keyboard). The click on OK and you'll be asked how to compare these missions. In fact, there are two methods to proceed. Analysis of missions from the same process The first possibility is to analyse two or more missions from the same process. For example, if you put five data loggers in an autoclave to monitor temperature in different points and then want to compare the curves, you'll,have to use this method. In this way the program will compare the graphs according to the time (date and time) and is possible to see the differences during the same process. Select One Process Analysis and click on OK to open the graph window. This window is quite the same of the single graph window; although it has some differences. In the main part there are the curves, showed overlapped one to another, while above them there is the key of the graph, with all the colours of the single loggers (serial number) showed in the graph itself. No notes are showed, while the statistics are referred to all the graphs showed, of all the data loggers: in fact, the maximum an minimum temperature with date, time and serial number of the logger that recorded them. The table is initially empty: select from the drop down list above it the serial number of a logger to display all the data of it and the F0 below the table itself. The zoom function works exactly as it explained previously. You can print the report of the comparison, but not with all the tables (to print the data tables, open each mission alone and print it). Analysis of missions from different processes The second case is the comparison of missions recorded during different processes, maybe by the same logger too. This method might be used to test the repeatability of the processes in different times. After selecting in the described way the missions to compare, click on OK and select the option Multi Process Analysis and set the value, in degrees (C or F is determined by what you set in the configuration window, p.13), of the reference temperature. In this way the graphs are compared from the first reading of that temperature. For example, by selecting as reference temperature on 50°C, the graphs are displayed, overlapped, beginning from 50°C and the previous data are not shown (but non deleted). Troubleshooting I cannot install the drivers for the USB-Serial adaptor If, after following the instructions for installation given in this manual, you are still unable to install the drivers, open the folder /USB-seriale2 which is found in the main directory where the SPD software has been installed and also on the installation CD. Open the folder Version V1.1. Select the Windows folder and double click on the icon PL2303 Driver Installer.exe. Follow the instructions displayed and when the installation is complete you should be able to use the interface. Sometimes I cannot connect to any SterilDisk There can be several causes for a communication problem (interface not found, TecnoCOM Port TimeOut, ecc.). Be sure that the interface is inserted correctly, that the cable is correctly inserted in the PC and that the logger is correctly inserted in the interface (or in the adapter if it is a cylinder logger). Be sure the drivers are installed correctly, from the Control Panel of Windows – System – Hardware – Device manager: if the interface name is next to an attention sign, it means the drivers are not installed correctly. If you changed the port to which the interface was connected to, you will have to install the drivers again. Check you have selected the USB port in the Configuration of the SPD. It might happen that the USB drivers of the Disk Interface are in conflict with some other drivers or applications installed on the PC If you face a communication error, try to disconnect the Interface and reconnect it again to the PC and try to communicate again. If it should fail, please contact Tecnosoft technical centre. Tecnosoft s.r.l. Via Galvani, 4 - 20068 Peschiera Borromeo (Milano) - telephone +39 02 26922888 - fax +39 02 26922875 e-mail: [email protected] - web: www.tecnosoft.eu Certified UNI EN ISO 9001:2008 fo Software development