1
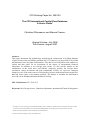
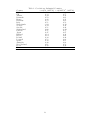
No. 2007/24
The CFS International Capital Flow Database:
A User’s Guide
Christian Offermanns and Marcus Pramor
Center for Financial Studies
The Center for Financial Studies is a nonprofit research organization, supported by an
association of more than 120 banks, insurance companies, industrial corporations and
public institutions. Established in 1968 and closely affiliated with the University of
Frankfurt, it provides a strong link between the financial community and academia.
The CFS Working Paper Series presents the result of scientific research on selected
topics in the field of money, banking and finance. The authors were either participants
in the Center´s Research Fellow Program or members of one of the Center´s Research
Projects.
If you would like to know more about the Center for Financial Studies, please let us
know of your interest.
Prof. Dr. Jan Pieter Krahnen
Prof. Volker Wieland, Ph.D.
CFS Working Paper No. 2007/24
The CFS International Capital Flow Database:
A User’s Guide*
Christian Offermanns1 and Marcus Pramor2
Original Version: July 2006
This Version: August 2007
Abstract:
This paper documents the methodology underlying the construction of a global database
of gross foreign asset and liability positions for 153 countries over the period 1970 to 2004
and illustrates some key data characteristics. The data cover both inflows and outflows of
capital and thus allow for an assessment of the degree of international financial
integration. In addition to net foreign asset stocks, we also provide details on the
composition of the main asset and liability categories, namely the foreign direct
investment, equity investment and debt components. Finally, we report on valuation
changes as one of the main sources of discrepancy between transaction-based capital flow
data and stock values of investment positions. The dataset is available for download at
www.ifk-cfs.de/fileadmin/downloads/data/cfs-icfd.zip.
JEL Classification: F21; F34; F32
Keywords: Net Foreign Assets; Valuation Adjustment; International Financial Integration
* This paper is part of a research project with Michael Binder, whom we thank for valuable advice at all stages of the project, funded
by the Center for Financial Studies (CFS) and the Deutsche Bundesbank. All remaining errors and omissions are our own.
1 Goethe University Frankfurt; E-mail: [email protected]
2 Center for Financial Studies; E-mail: [email protected]
1
Introduction
Economic interaction has become an increasingly international phenomenon characterized by markedly growing flows of trade and capital. As international payments
and investment positions claim a growing share of both corporate and national balance sheets, they also inevitably impact domestic financial variables and the level
and composition of economic activity. This development demands appropriate consideration in both theoretical and applied research, and it is to this end that we have
endeavored to properly capture and report international capital and financial flows
and international investment positions. This user’s guide is intended to describe and
explain the data series reported in the corresponding data file, which can be found
at http://www.ifk-cfs.de/fileadmin/downloads/data/cfs-icfd.zip.
We provide information not only on the size of the external investment position on a
gross and net basis, but also on its composition according to asset class, as far as data
availability permits. Total assets and liabilities are hence consistently built up as the
sum of their components, i.e. foreign direct investment (FDI), equity, and debt. In
addition, international reserves are included on the asset side, after subtracting gold
holdings since the latter do not constitute a liability of any counterpart. To provide
an indicator of the relative magnitude of the international investment position of
each country we also include a series for gross domestic product (GDP).
While this data set is based both on flows as reported in the balance of payments
and on international investment position stock data, only stock data are presented.
Due to the conceptual equivalence of flows and the corresponding changes in stocks,
no information is lost by only reporting the international investment position. Apart
from the effect of inadvertent accounting errors and omissions, however, there will be
a discrepancy between flows and increments in stock variables resulting from changes
in the valuation of flow balances brought forward from prior periods. In fact, one of
the main contributions in compiling this database is the appropriate adjustment of
flow figures that re-establishes the conceptual equivalence. Through complementing
reported international investment position figures with valuation-adjusted flows, we
are able to cover a larger number of countries and obtain longer data series than
either concept by itself could provide.
The database has significantly benefited from pioneering work by Sinn (1990) and
was conceptually inspired by Lane and Milesi-Ferretti (2001). Lane and MilesiFerretti (2006) now offer a data set of similar coverage.
1
2
Data Sources
A variety of data sources has been drawn upon in compiling this data set. We
present annual estimates of gross and net international capital stocks for 153 countries over the period 1970-2004. Our main source is the International Financial
Statistics (IFS) online database by the International Monetary Fund (IMF), which
provides the data series of the Balance of Payments Statistics (BOPS) and the International Investment Position (IIP). For the net foreign assets (NFA) position only,
the IIP series are complemented through data points taken from Sinn (1990) for the
period 1970-1987. Debt stock figures for developing countries are taken from the
World Bank’s Global Development Finance (GDF) database since these numbers
are generally not available from the IIP series of the IFS.
For GDP, the primary data source is the World Bank’s World Development Indicators database due to its comprehensive coverage. These series are complemented
by data points taken from the IFS.1 Time series for the consumer price index (CPI)
that enter the calculation of valuation adjustments to flow data are obtained from
the IFS. Similarly, trade-weighted real exchange rates of partner countries vis-`a-vis
the U.S. are calculated using trade data from the IMF’s Direction of Trade Statistics
and bilateral nominal exchange rates (period averages) from the IFS.
Equity indices, which also enter the calculation of valuation adjustments, are primarily taken from Morgan Stanley Capital International. Additional national and
regional indices are obtained from Standard & Poor’s, Nomura, Datastream, FTSE,
Global Property Research, or directly from national stock exchanges. For Japan,
the UK, and the U.S., separate world equity indices are used that omit the domestic
country in each case. Tables providing more details on the source data series are
shown in Appendix A.
3
Construction of Stock Data
3.1
Gross Asset and Liability Components
The guiding principle in building this database has been to obtain estimates of gross
foreign asset and gross foreign liability components whenever data quality permits.
Not only do these components allow the calculation of total foreign assets and total
foreign liabilities, but they can also provide important information on a country’s
financial structure and changes in economic activity.
1
Subsequently, some missing GDP observations were filled through data points from the recently
published Lane and Milesi-Ferretti (2006), who generally rely on many different data sources. The
same holds for the NFA series of Hong Kong, in which the new data points replace BOPS as the
basis for complementing Sinn (1990) and IIP data. For details on the construction procedure, see
the following section.
2
To this end, the different data sources are employed according to a consistent pecking
order. When the level of detail in the reporting of individual asset and liability
components is high enough, stock data from the IIP section of the IFS are used.
However, IIP series are generally available only from the 1980s onwards and may
omit too many of the individual components, in which case a calculation of total
assets and total liabilities would not be meaningful. In these instances, the IIPbased series are extrapolated by use of the corresponding flow data from the BOPS,
provided the latter benefit from a more comprehensive data coverage. In cumulating
flow data, valuation adjustments need to be made to ensure consistency with the IIP
series as the value of flow balances brought forward will change over time. Valuation
adjustments will be specific to individual asset and liability classes, as described in
detail in the following subsection.
The asset and liability series for FDI and equity (EQ) conform with the IIP classifications. Debt assets (DEBT A) are the sum of the IIP categories portfolio debt
assets, other assets, and, if applicable, financial derivative assets. Debt liabilities
(DEBT L) are analogously calculated from portfolio debt liabilities, other liabilities,
and financial derivative liabilities. Since these IIP series are frequently not available
for developing countries, external debt figures from the GDF database are used in
these cases. Instead of the IIP series reserve assets, we use the alternative IFS stock
series total reserves minus gold (RES ∗ ) since gold holdings do not constitute a liability of any counterpart. Hence, our measures of gross foreign assets (GF A) and
gross foreign liabilities (GF L) are constructed as follows:
GF Ait = F DIAit + EQAit + DEBT Ait + RESit∗ ,
(1)
GF Lit = F DILit + EQLit + DEBT Lit .
(2)
Note that unlike the gross foreign assets and gross foreign liabilities figures directly
reported by the IIP, we employ strict criteria for determining whether the number of
individual components available permits the calculation of dependable total foreign
assets and total foreign liabilities figures. These aggregates are calculated only if
all of the three components FDI, equity and debt are simultaneously available on
both the asset and the liability side. However, even when meaningful gross asset
and liability estimates cannot be calculated from the available data series, it may
nonetheless be possible to construct a net foreign asset position as outlined below.
3.2
Valuation Adjustment
When flow data are used to extrapolate stock positions, the change in value of
the balances brought forward needs to be added to the flow figure in every period.
Since the value of different components of the international investment position
is determined by different factors, these differences also need to be reflected in
3
the calculation of valuation adjustments. While any attempt of such “marking
to market” will necessarily be imperfect, neglecting it altogether would not only be
wrong on conceptual grounds but could also lead to severe distortions in practice.
In some cases the valuation effect may more than offset the contribution of the flow
figure for that period, thereby not only altering the magnitude but also the sign of
the change in the corresponding stock position.
For this purpose, we follow the lead provided in Lane and Milesi-Ferretti (2001) and
calculate comparable valuation adjustments. Equity assets (domestic holdings of
foreign equity shares) are adjusted by changes in the MSCI World Index m, assuming
that equity investment abroad is allocated according to the world portfolio that is
approximated by this index.2 Decomposing the change in the stock as above into
∆EQAit = DEQAit + ∆V (EQA)it ,
(3)
where ∆ is the first difference operator and DEQAit refers to the inflow of equity
assets into country i in period t, we take the change in the value of the stock as
mt
mt
− 1 EQAi,t−1 + √
− 1 DEQAit ,
(4)
∆V (EQA)it =
mt−1
mt mt−1
taking into account that mt refers to end-of-period values whereas flows are assumed
to be evenly distributed over the year and hence adjusted for the average index value
√
of mt mt−1 .
Equity liabilities (foreign holdings of domestic equity shares) are adjusted by changes
in domestic (or regional) stock market indices mi in the same vein as equity assets,
with
∆EQLit = DEQLit + ∆V (EQL)it ,
(5)
DEQLit denoting the flow of equity liabilities to country i in period t, and
mit
mit
− 1 EQLi,t−1 + √
− 1 DEQLit .
∆V (EQL)it =
mi,t−1
mit mi,t−1
(6)
FDI assets are adjusted for changes in the real trade-weighted Dollar exchange rate
of country i’s trade partners, q˜it ,
∆F DIAit = DF DIAit + ∆V (F DIA)it ,
(7)
where DF DIAit is the inflow of FDI assets into country i (i.e. an outflow of capital)
in period t. ∆V (F DIA)it is the change in the value of the FDI asset stock as of the
end of period t − 1 during period t, with
q˜it
− 1 F DIAi,t−1 ,
(8)
∆V (F DIA)it =
q˜i,t−1
2
Note that for the U.S., Japan and the UK, we use an index that excludes the respective home
country.
4
where
q˜it = exp
( N
X
ln
j=1
)
CP Ijt
· sjt · w˜ijt ,
CP IU S,t
(9)
CP I is the consumer price index, and sjt is country j’s exchange rate in U.S. Dollar
per unit of domestic currency. The weight w˜ijt is calculated as a predetermined
moving average of country i’s trade (i.e., the sum of exports, EXP , and imports,
IM P ) with country j relative to country i’s total trade for each year, or specifically
w˜ijt =
where
t−1
1 X
wijs
τ s=t−τ
EXPijs + IM Pijs
wijs = PN
k=1 EXPiks + IM Piks
(10)
(11)
and the span is set to τ = 3.
We thus assume that a country’s foreign direct investment flows are in line with
its trade pattern, and that changes in the foreign direct investment position that
country i holds in country j are due to changes in the relative price of consumption
goods between country j and the U.S. as well as changes in the value of country j’s
currency relative to the U.S. Dollar.
FDI liabilities are adjusted in the same vein, using country i’s real Dollar exchange
rate qit , such that
∆F DILit = DF DILit + ∆V (F DIL)it ,
(12)
where DF DILit denotes the inflow of FDI liabilities into country i (i.e. a capital
inflow) in period t, and the change in the stock value is defined as
qit
− 1 F DILi,t−1 ,
(13)
∆V (F DIL)it =
qi,t−1
with
qit =
CP Iit
· sit .
CP IU S,t
(14)
Finally, we infer changes to the stock of international reserves excluding gold holdings (RES ∗ ) from the difference between the change in official reserves (∆RES)
according to IIP and recorded reserve flows (DRES):
∆V (RES ∗ )it = ∆RESit − DRESit .
(15)
Since debt figures from the GDF database are available as stock data only, separate
series for valuation adjustments cannot be obtained.
5
3.3
Net Foreign Asset Position
When we derive separate total asset (GF A) and total liability (GF L) estimates
from individual components as described above, the calculation of the net foreign
asset (NFA) position is straightforward:3
N F At = GF At − GF Lt .
(16)
Whenever this method is not feasible due to a lack of observations for gross figures,
the following option may be available. Sinn (1990) had compiled an earlier database
on NFA positions that covers 145 countries for the period from 1970 to 1987. This
supplementary source is used to complement the data points calculated from total
asset and total liability numbers. In most instances, combining these two sources will
result in a data gap in the middle of the series. The remaining gap can, however, be
filled through interpolation based on the other supplementary source, viz. valuationadjusted flow figures. This last approach is also used when only one of the two
aforementioned NFA sources is available, in which case the valuation-adjusted flow
figures are used for extrapolation instead of interpolation.
In using flow figures from the BOPS, we exploit the fact that the sum of domestic
balances on current and capital account over a particular period will amount to
the change in the international investment position of that economy, provided that
the valuation adjustments of all international investment components are taken into
account. Since both flows and international investment positions in this database
are classified in accordance with the fifth edition of the Balance of Payments Manual
(BOPM) published by the IMF, it is worth noting that there have been some changes
in definitions relative to earlier editions of the BOPM in order to harmonize the
reporting practice with the System of National Accounts. Most importantly, what
had formerly been known as the “capital account” has been redesignated as the
“capital and financial account”. As a consequence, the current account balance
(CA) and the balance on capital account (KA) within the capital and financial
account do not conceptually offset each other any longer, instead the sum of the two
represents the net lending (or net borrowing) of an economy.4 Therefore, the final
adjusted flow figure is computed as
CA∗t = CAt + KAt + ∆N Vt ,
(17)
where ∆N Vt represents the sum of available net valuation changes of asset and
liability components,
∆N Vt = ∆V (F DIA)t − ∆V (F DIL)t + ∆V (EQA)t − ∆V (EQL)t + ∆V (RES ∗ )t .
(18)
3
In the following, we will omit the country subscript i for notational convenience.
Additional changes, particularly in the definition and reporting of transfers, have also altered
the scope of the current account, so the redesignated terms are not directly comparable to their
corresponding former definitions.
4
6
We derive the valuation changes ∆V (·) by constructing purely flow-based series for
each component both with and without valuation adjustments, and computing the
difference between the adjusted and the unadjusted estimates. Since the absolute
level of balances brought forward determines the size of the valuation adjustment,
we anchor the flow-based series through the earliest available IIP stock figure. When
this starting value is preceded by one or more of the available BOPS data points, an
initial value for the flow-based series is computed by extrapolating the IIP starting
value backwards with and without valuation adjustments, respectively.
As a consequence, the adjusted current account balance provides an alternative
estimate on the change in NFA which can be used to fill the gaps induced by missing
observations. However, in the case of interpolation, we need to ensure that the
interpolated segment meets its two attachment points. Therefore, the flow-based
increments in the NFA position are scaled as follows. Observing stock data for N F At
and N F At′ , with t < t′ , and observing the valuation-adjusted current account, CA∗s ,
with s = t + 1, t + 2, . . . , t′ , we obtain the missing values for N F A between t and t′
as
s
X
(19)
N F As = N F At +
CA∗r + dt′ ,t , s = t + 1, t + 2, . . . , t′ ,
r=t+1
P′
where dt′ ,t = t′1−t (N F At′ − N F At − ts=t+1 CA∗s ). Missing values at the beginning
or at the end of the sample are filled in the same manner by using extrapolation,
i.e. with dt′ ,t = 0.
The NFA position of a country may deviate from the difference between gross foreign assets and liabilities calculated from individual components. Let us denote
stock data which are based on the aggregation of components and the respective
component itself by an asterisk. Then we have
N F ADIF Ft = N F At − N F A∗t ,
where N F A∗t is computed as the difference between
GF A∗t = F DIA∗t + EQA∗t + DEBT A∗t + RESt∗
and
GF L∗t = F DIL∗t + EQL∗t + DEBT L∗t .
To adjust the underlying gross stock figures accordingly, we distribute the difference
across components to obtain estimates that are consistent with net figures. Hence,
we apply the following scheme:
GF Lt = GF L∗t − wL,t · N F ADIF Ft ,
GF At = GF A∗t + wA,t · N F ADIF Ft ,
7
where5
wA,t =
|GF A∗t − RESt∗ |
,
|GF A∗t − RESt∗ | + |GF L∗t |
wL,t = 1 − wA,t .
The gross stock figures of the components are adjusted in the same manner, computing assets as
F DIAt = F DIA∗t + wF DIA,t · (wA,t · N F ADIF Ft ),
EQAt = EQA∗t + wEQA,t · (wA,t · N F ADIF Ft ),
DEBT At = DEBT A∗t + wDEBT A,t · (wA,t · N F ADIF Ft ),
with
wF DIA,t =
|F DIA∗t |
,
|GF A∗t − RESt∗ |
wEQA,t =
|EQA∗t |
,
|GF A∗t − RESt∗ |
wDEBT A,t = 1−wF DIA,t −wEQA,t ,
and liabilities as
F DILt = F DIL∗t − wF DIL,t · (wL,t · N F ADIF Ft ),
EQLt = EQL∗t − wEQL,t · (wL,t · N F ADIF Ft ),
DEBT Lt = DEBT L∗t − wDEBT L,t · (wL,t · N F ADIF Ft ),
with
wF DIL,t =
|F DIL∗t |
,
|GF L∗t |
wEQL,t =
|EQL∗t |
,
|GF L∗t |
wDEBT L,t = 1 − wF DILt − wEQLt .
The consistency adjustment ensures that the relations (1), (2) and (16) hold.
The valuation-adjusted current account described above may not only be used for
interpolation of gaps in the NFA position, it also permits the construction of an
entire NFA series based on BOPS flow figures. In that case, CA∗ is cumulated over
time:
∗
N F ACF
= N F ACF
(20)
t
t−1 + CAt .
The initial value for this cumulative flow series is the earliest available stock figure
for NFA, which we take from Sinn (1990).
5
For conceptual reasons, assets and liabilities are also affected by negative transactions (e.g.
realized holding losses, repayments) and by difficulties in attributing transactions to residents vs.
non-residents. Therefore individual components and hence GFA and GFL could turn negative.
However, this occurs in a few cases only.
8
4
Data Characteristics
The increase in international capital flows and stock positions clearly marks a global
trend, nonetheless it is necessary to distinguish between different developments
across different groups of countries. For this purpose, we will distinguish between
three groups of countries, based on their degree of economic development and in
accordance with the World Bank classification.6 The group of “industrial countries”
includes “high-income OECD countries”, while “emerging markets” captures “highincome non-OECD countries” and “upper-middle income countries”. The third
group, “developing countries”, consists of “lower-middle or low income” countries.
Figure 1 shows the development of gross asset and liability positions over time for
these country groups.7 Industrial countries (Figure 1(a)) display a strong growth
of capital stocks for all categories, amounting to an increase in the group’s mean
ratio of foreign assets and liabilities combined from about 50% of GDP in 1970 to
more than 250% of GDP in 2003. We combine the other two groups, which are
summarized in Figure 1(b) and display a similar trending behavior. However, they
experienced strong flows of capital already at the beginning of the sample until
the 1980s, comprising mostly debt liabilities, which is of course partly due to the
major role of foreign credit in many developing countries’ government budgets.8 In
addition, there has been a big increase also in FDI liabilities. Altogether, capital
stock positions of non-industrial countries built up mainly after the sequence of
financial crises that occurred in the 1990s when markets regained confidence in the
stability of their financial system.
Figure 2 compares the differences in relative NFA positions between different country
groups over time. The series of aggregate NFA scaled by aggregate GDP (Figure
2(a)) show that industrial countries have gradually moved from a slightly positive to
a slightly negative position over time. In contrast, emerging markets rose to a period
of positive balances lasting from the mid-1970’s to the mid-1980’s from an otherwise
negative position, while developing countries started from a visibly negative position
and experienced minor further deterioration over time. However, the series are all
contained within a relatively close range, with only moderate dispersion and no
discernible trends. The means of individual NFA/GDP ratios (Figure 2(b)) instead
document larger differences between country groups. As these series give equal
weight to all group members and are not dominated by large economies, they better
reflect developments affecting the majority of countries within a given group. Based
on group means, industrial countries exhibit an almost entirely negative position
6
See http://go.worldbank.org/D7SN0B8YU0, as of April 26, 2006.
Subfigures (a) and (b) are based on the series for 22 industrial countries and 48 non-industrial
countries, respectively, as all other countries do not have sufficiently complete component series.
8
Note that data points prior to 1980 are only available for a small number of these countries
such that the representation would be severely distorted by including these observations.
7
9
over the sample period, while both the rise and the subsequent fall experienced by
emerging markets are much more pronounced. Developing countries still start from
a similar negative position, but display a substantial deterioration throughout the
1980’s with further subsequent decline and no major trend reversal. Subfigure (a)
also documents the fact that aggregate NFA of all countries is different from zero,
which is well-known under the designation “world NFA discrepancy”.
Tables 1 and 2 display the degree of commonality in different measures of capital
flows. For both industrial and non-industrial countries, the outcomes are very similar
to the figures presented in Lane and Milesi-Ferretti (2001, 2006). The left column of
each table shows the correlation between the current account balance and the change
in net foreign assets. Since most of the difference between the flow figure and the
increment in the stock series is caused by the change in the value of the previous
period’s stock balance, this number can also be interpreted as a measure for the
impact of valuation adjustments. In countries with high correlation coefficients the
effect of valuation changes is relatively low and vice versa. On average, the figures for
non-industrial countries are higher than for industrial countries. However, one has
to bear in mind that this partly reflects the lack of appropriate indices for valuation
adjustments in these countries rather than less volatile asset prices.
The right column of both tables shows the correlation between the two measures
of capital flows constructed by using the different approaches outlined in Section
3.3. Here, a high correlation coefficient indicates a high degree of empirical equivalence between accumulated flows and extrapolated stocks. Although the correlation
figures are usually larger than those in the left column, especially for industrial
countries, the correlation in many cases is still far from unity.
In a last step, we separately identify each country’s net debt and net equity (including FDI) position in the most recent period available (Figure 3). For the group of
industrial economies, this comparison reveals that the majority of countries display
a positive net equity, but a negative net debt asset position, with a net equity-net
debt correlation coefficient of −0.16. So it would seem that from a national perspective, external borrowing is used for maintaining a foreign equity portfolio. Both
emerging markets and developing countries instead virtually always show a negative
net equity balance, in the vast majority of cases coupled with negative net debt
assets. However, among emerging markets there is a positive correlation of 0.27
between the two asset categories, while for developing countries the correlation is
−0.37. This suggests that depending on the stage of development, countries either
face a trade-off between debt and equity financing or are allowed to use the two
instruments as complements.
10
Figure 1: Sum of Gross Asset and Liability Stocks
3
2.5
2
DEBTL
DEBTA
EQL
EQA
FDIL
FDIA
RES
1.5
1
0.5
0
1970
1975
1980
1985
1990
1995
2000
(a) Industrial Countries, 1970 – 2003
3
2.5
2
DEBTL
DEBTA
EQL
EQA
FDIL
FDIA
RES
1.5
1
0.5
0
1980
1985
1990
1995
2000
(b) Non-industrial Countries, 1980 – 2003
11
Figure 2: Net Foreign Assets
0.4
0.2
0
−0.2
−0.4
−0.6
−0.8
1970
1975
All
1980
1985
Industrial Countries
1990
1995
Emerging Markets
2000
Developing Countries
(a) Aggregate NFA/Aggregate GDP
0.4
0.2
0
−0.2
−0.4
−0.6
−0.8
1970
1975
All
1980
Industrial Countries
1985
1990
1995
Emerging Markets
(b) Mean of NFA/GDP Ratios
12
2000
Developing Countries
Country
USA
UK
Austria
Denmark
France
Germany
Italy
Netherlands
Norway
Sweden
Switzerland
Canada
Japan
Finland
Greece
Iceland
Portugal
Spain
Australia
New Zealand
Korea
Mean
Table 1: Correlations: Industrial Countries
corr(CA, ∆N F A) corr(∆N F AC , ∆N F A)
0.50
0.88
0.33
0.57
0.44
0.38
0.70
0.61
0.43
0.31
0.72
0.19
0.51
0.59
-0.18
-0.10
0.99
0.99
0.56
0.49
0.00
-0.19
0.71
0.77
0.47
0.87
0.14
0.98
0.64
0.64
0.30
0.42
0.58
0.69
0.30
0.85
0.40
0.86
0.11
0.59
0.92
0.92
0.46
0.59
13
Table 2: Correlations: Non-industrial Countries
Country
Argentina
Bangladesh
Bolivia
Brazil
Bulgaria
Cameroon
Chile
China
Colombia
Costa Rica
Ecuador
Egypt
Guatemala
Hungary
India
Indonesia
Israel
Jordan
Kenya
Malaysia
Mexico
Morocco
Nicaragua
Nigeria
Pakistan
Paraguay
Peru
Philippines
Poland
Romania
Saudi Arabia
Singapore
South Africa
Syria
Thailand
Tunisia
Turkey
Uruguay
Venezuela
Mean over 129 countries
corr(CA, ∆N F A) corr(∆N F AC , ∆N F A)
0.65
0.84
0.48
0.48
0.52
0.52
0.33
0.87
0.56
0.88
0.20
0.20
0.66
0.63
0.89
0.89
0.84
0.84
0.50
0.50
0.85
0.85
0.82
0.82
0.79
0.79
0.56
0.78
0.80
0.81
0.66
0.66
0.60
0.77
0.81
0.81
0.69
0.69
0.64
0.64
0.31
0.31
0.71
0.71
0.75
0.75
0.79
0.79
0.86
0.86
0.80
0.80
0.70
0.63
0.70
0.77
0.69
0.75
0.79
0.84
0.98
0.98
0.23
0.38
0.08
0.42
0.87
0.87
0.89
0.89
0.24
0.34
0.28
0.66
0.23
0.23
0.83
0.84
0.65
0.67
14
Figure 3: Debt/Equity Distribution
0.4
ISL
NLD
NOR
BEL
ITA
GBR
DNK
SWE
CAN FRA
DEU
AUT
USA
KOR JPN
Net Equity Assets / GDP
0.2
0
CHE
GRC
ESP
FIN
AUS
PRT
−0.2
NZL
−0.4
−0.6
−0.8
−1
−2
−1.5
−1
−0.5
0
0.5
Net Debt Assets / GDP
1
1.5
2
(a) Industrial Countries
0.4
0.2
Net Equity Assets / GDP
BWA
0
HKG
ZAF
BHR
MUS
SVN
URY
ARG
TUR
RUS
MEX
CRI
LTU
POL
HRV LVA
CYP
SVK ISR
CHL
VEN
−0.2
−0.4
HUN
−0.6
MLT
CZE
EST
−0.8
−1
−2
−1.5
−1
−0.5
0
0.5
Net Debt Assets / GDP
1
1.5
2
(b) Emerging Markets
0.4
Net Equity Assets / GDP
0.2
0
BDI
−0.2
RWA BFA
SEN
BEN BGD IND
IDN
BLR
NAM
UKR
PRY
PHL
TGO MLI
PER
COL
SLV
ROU
BGR
BRA
ARM
MDA MAR
THA
KAZ
−0.4
SWZ
−0.6
VUT
TUN
−0.8
−1
−2
BOL
−1.5
−1
−0.5
0
0.5
Net Debt Assets / GDP
(c) Developing Countries
15
1
1.5
2
Appendix
A
Tables
Table A.1: Source Variables
Name
Code
Balance of Payments Statistics (BOPS), flow data:
CURRENT ACCOUNT, N.I.E.
xxx78ALDZF...
CAPITAL ACCOUNT, N.I.E.
xxx78BCDZF...
DIRECT INVESTMENT ABROAD
xxx78BDDZF...
DIR. INVEST. IN REP. ECON., N.I.E.
xxx78BEDZF...
PORTFOLIO INVESTMENT ASSETS
xxx78BFDZF...
PORTFOLIO INVESTMENT LIAB., N.I.E.
xxx78BGDZF...
PI EQUITY SECURITIES ASSETS
xxx78BKDZF...
PI EQUITY SECURITIES LIAB
xxx78BMDZF...
PI DEBT SECURITIES ASSETS
xxx78BLDZF...
PI DEBT SECURITIES LIAB
xxx78BNDZF...
FINAN DERIVATIVES: ASSETS
xxx78BWDZF...
FINAN DERIVATIVES: LIABIL
xxx78BXDZF...
OTHER INVESTMENT ASSETS
xxx78BHDZF...
OTHER INVESTMENT LIAB., N.I.E.
xxx78BIDZF...
NET ERRORS AND OMISSIONS
xxx78CADZF...
RESERVE ASSETS
xxx79DBDZF...
International Investment Position (IIP), stock data:
FIN ACCT TOTAL ASSETS: EPS
xxx79AADZF...
FIN ACCT TOTAL LIAB: EPS
xxx79LADZF...
DIRECT INVESTMENT ABROAD: EPS
xxx79ABDZF...
DIRECT INV IN REP ECONOMY: EPS
xxx79LBDZF...
PORTFOLIO INVESTMENT ASSETS: EPS
xxx79ACDZF...
PORTFOLIO INVESTMENT LIAB: EPS
xxx79LCDZF...
PI EQUITY SECURITIES ASSETS: EPS
xxx79ADDZF...
PI EQUITY SECURITIES LIAB: EPS
xxx79LDDZF...
PI DEBT SECURITIES ASSETS: EPS
xxx79AEDZF...
PI DEBT SECURITIES LIAB: EPS
xxx79LEDZF...
FINAN DERIVATIVES: ASSETS
xxx79ALDZF...
FINAN DERIVATIVES: LIABIL
xxx79LLDZF...
OTHER INVESTMENT ASSETS: EPS
xxx79AFDZF...
OI BANKS ASSETS: EPS
xxx79AIDZF...
OI GEN GOVT ASSETS: EPS
xxx79AHDZF...
OI MON AUTH ASSETS: EPS
xxx79AGDZF...
OI OTH SECT ASSETS: EPS
xxx79AJDZF...
OTHER INVESTMENT LIAB: EPS
xxx79LFDZF...
OI BANKS LIAB: EPS
xxx79LIDZF...
OI GEN GOVT LIAB: EPS
xxx79LHDZF...
OI MON AUTH LIAB: EPS
xxx79LGDZF...
OI OTH SECT LIAB: EPS
xxx79LJDZF...
RESERVE ASSETS: EPS
xxx79AKDZF...
16
Table A.1: Source Variables (continued)
Name
International Financial Statistics, stock data:
TOTAL RESERVES MINUS GOLD
Code
xxx.1L.DZF...
World Bank, Global Development Finance 2005, stock data:
TOTAL DEBT STOCKS
xxxDTDODDECTCD
IMF Direction of Trade Statistics, flow data:
EXPORTS FOB
IMPORTS CIF
xxx70..DZDxxx
xxx71..DZDxxx
Table A.2: List of Variables
Name
IMFCODE
ISO3CODE
COUNTRY
DATE
GDP
NFA
DVNFA
NFACF
DVNFACF
CCA
GFA
GFL
FDIA
DVFDIA
FDIL
DVFDIL
EQA
DVEQA
EQL
DVEQL
DEBTA
DEBTL
RESGOLD
Description
Numerical country code (IMF)
Alphanumerical country code (3-digit ISO)
Name of country
Year of observation
Nominal GDP in Million U.S. Dollar
Net foreign asset (NFA) position
Change in valuation of net foreign assets as the sum of
valuation changes of components
NFA position calculated from adjusted cumulative current account
Valuation change in cumulative current account: Sum
of valuation changes of components
Cumulative current account
Gross foreign assets
Gross foreign liabilities
Foreign direct investment (FDI) assets, stocks consistent
with NFA
Change in valuation of consistent FDI asset stocks
FDI liabilities, stocks consistent with NFA
Changes in valuation of consistent FDI liability stocks
Equity assets, stocks consistent with NFA
Changes in valuation of consistent equity asset stocks
Equity liabilities, stocks consistent with NFA
Changes in valuation of consistent equity liability stocks
Debt asset stocks consistent with NFA
Debt liability stocks consistent with NFA
Reserves minus gold
17
Table A.3: List of Countries
Name
Afghanistan
Algeria
Antigua and Barbuda
Argentina
Armenia
Australia
Austria
Bahamas
Bahrain
Bangladesh
Barbados
Belarus
Belgium
Belize
Benin
Bolivia
Botswana
Brazil
Bulgaria
Burkina Faso
Burundi
Cameroon
Canada
Central African Republic
Chad
Chile
China
Colombia
Congo, Republic Of
Costa Rica
Cˆote d’Ivoire
Croatia
Cyprus
Czech Republic
Czechoslovakia
Denmark
Dominica
Dominican Republic
Ecuador
Egypt
El Salvador
Equatorial Guinea
Estonia
Ethiopia
Fiji
Finland
France
Gabon
Code
AFG
DZA
ATG
ARG
ARM
AUS
AUT
BHS
BHR
BGD
BRB
BLR
BEL
BLZ
BEN
BOL
BWA
BRA
BGR
BFA
BDI
CMR
CAN
CAF
TCD
CHL
CHN
COL
COG
CRI
CIV
HRV
CYP
CZE
CZS
DNK
DMA
DOM
ECU
EGY
SLV
GNQ
EST
ETH
FJI
FIN
FRA
GAB
18
Table A.3: List of Countries (continued)
Name
Gambia
Germany
Ghana
Greece
Grenada
Guatemala
Guyana
Haiti
Honduras
Hong Kong
Hungary
Iceland
India
Indonesia
Iran
Iraq
Ireland
Israel
Italy
Jamaica
Japan
Jordan
Kazakhstan
Kenya
Korea
Kuwait
Latvia
Lebanon
Lesotho
Liberia
Libya
Lithuania
Luxembourg
Madagascar
Malawi
Malaysia
Maldives
Mali
Malta
Mauritania
Mauritius
Mexico
Moldova
Morocco
Myanmar
Namibia
Nepal
Netherlands
Code
GMB
DEU
GHA
GRC
GRD
GTM
GUY
HTI
HND
HKG
HUN
ISL
IND
IDN
IRN
IRQ
IRL
ISR
ITA
JAM
JPN
JOR
KAZ
KEN
KOR
KWT
LVA
LBN
LSO
LBR
LBY
LTU
LUX
MDG
MWI
MYS
MDV
MLI
MLT
MRT
MUS
MEX
MDA
MAR
MMR
NAM
NPL
NLD
19
Table A.3: List of Countries (continued)
Name
Netherlands Antilles
New Zealand
Nicaragua
Niger
Nigeria
Norway
Oman
Pakistan
Panama
Papua New Guinea
Paraguay
Peru
Philippines
Poland
Portugal
Qatar
Romania
Russia
Rwanda
Samoa
Saudi Arabia
Senegal
Seychelles
Sierra Leone
Singapore
Slovak Republic
Slovenia
Solomon Islands
Somalia
South Africa
Spain
Sri Lanka
St. Lucia
St. Vincent & Grenadines
Sudan
Suriname
Swaziland
Sweden
Switzerland
Syrian Arab Republic
Taiwan
Tanzania
Thailand
Togo
Trinidad and Tobago
Tunisia
Turkey
Uganda
Code
ANT
NZL
NIC
NER
NGA
NOR
OMN
PAK
PAN
PNG
PRY
PER
PHL
POL
PRT
QAT
ROU
RUS
RWA
WSM
SAU
SEN
SYC
SLE
SGP
SVK
SVN
SLB
SOM
ZAF
ESP
LKA
LCA
VCT
SDN
SUR
SWZ
SWE
CHE
SYR
OAN
TZA
THA
TGO
TTO
TUN
TUR
UGA
20
Table A.3: List of Countries (continued)
Name
Ukraine
United Arab Emirates
United Kingdom
United States
Uruguay
Vanuatu
Venezuela
Zambia
Zimbabwe
Code
UKR
ARE
GBR
USA
URY
VUT
VEN
ZMB
ZWE
21
References
Lane, P.R. and Milesi-Ferretti, G.M. (2001). The External Wealth of Nations: Measures of Foreign Assets and Liabilities for Industrial and Developing Countries.
Journal of International Economics, 55:263–294.
Lane, P.R. and Milesi-Ferretti, G.M. (2006). The External Wealth of Nations Mark
II: Revised and Extended Estimates of Foreign Assets and Liabilities, 1970 – 2004.
Working Paper, International Monetary Fund.
Sinn, S. (1990). Net External Asset Positions of 145 Countries: Estimation and
Interpretation, in: Siebert, H. (Ed.), Kieler Studien, T¨
ubingen: Mohr, Vol. 234.
22
CFS Working Paper Series:
No.
Author(s)
Title
2007/23
Michael Binder
Christian Offermanns
International Investment Positions and Exchange
Rate Dynamics: A Dynamic Panel Analysis
2007/22
Howard Kunreuther
Alexander Muermann
Self-Protection and Insurance with Interdependencies
2007/21
Wolfram J. Horneff
Raimond H. Maurer
Olivia S. Mitchell
Michael Z. Stamos
Money in Motion: Dynamic Portfolio Choice in
Retirement
2007/20
Bea Canto
Roman Kräussl
Electronic Trading Systems and Intraday NonLinear Dynamics: An Examination of the FTSE
100 Cash and Futures Returns
2007/19
Maria Kasch-Haroutounian
Erik Theissen
Competition between Exchanges: Euronext versus
Xetra
2007/18
Günter W. Beck
Volker Wieland
Money in Monetary Policy Design under
Uncertainty: A Formal Characterization of ECBStyle Cross-Checking
2007/17
Günter W. Beck
Volker Wieland
Money in Monetary Policy Design under
Uncertainty: The Two-Pillar Phillips Curve versus
ECB-Style Cross-Checking
2007/16
Silvio Colarossi
Andrea Zaghini
Gradualism, Transparency and Improved
Operational Framework: A Look at the Overnight
Volatility Transmission
2007/15
Annamaria Lusardi
Olivia S. Mitchell
Financial Literacy and Retirement Preparedness:
Evidence and Implications for Financial Education
Programs
2007/14
Jean Boivin
Marc P. Giannoni
Ilian Mihov
Sticky Prices and Monetary Policy: Evidence from
Disaggregated U.S. Data
Copies of working papers can be downloaded at http://www.ifk-cfs.de